Introduction
Neuroblastoma is an embryonal tumor that arises from
the sympathetic nervous system, accounts for ~15% of childhood
cancer mortality (1,2). Despite intensive myeloablative
chemotherapy, survival rates for neuroblastoma have not
substantively improved; relapse is common and frequently leads to
mortality (3,4). Like most human cancers, this
childhood cancer can be inherited; however, the genetic aetiology
remains to be elucidated (3).
Therefore, an improved understanding of the genetics and biology of
neuroblastoma may contribute to further cancer therapies.
In terms of genetics, neuroblastoma tumors from
patients with aggressive phenotypes often exhibit significant MYCN
proto-oncogene, bHLH transcription factor (MYCN)
amplification and are strongly associated with a poor prognosis
(5). MYCN, a member of MYC
proto-oncogene family, functions as a transcriptional factor, which
controls cell growth and proliferation and thus has an important
role in driving tumorigenesis of neuroblastoma cells (6,7).
Additionally, the overexpression of MYC genes in
non-MYC-amplified cells may induce apoptosis (8). A previous study by Molenaar et
al (9) confirmed that
inactivation of cyclin-dependent kinase 2 (CDK2) was
synthetically lethal to neuroblastoma cells with MYCN-amplification
and overexpression (9). The
CDK2 gene encodes a protein that is member of
serine/threonine protein kinase family that is involved in cell
cycle regulation (10).
Additionally, CDK2 has been demonstrated to regulate the
progression through the cell cycle (11). A previous study also has determined
that the targeting of aberrant cell cycle checkpoints in cancer
cells may inhibit tumor growth and induce cell death (12). CDK2 is a vital regulator of S-phase
progression and is deemed to be an anticancer drug target (9,13).
Additionally, CDK2 inhibitors may act as potential
MYCN-selective cancer therapeutics in the treatment of
neuroblastoma (9). However, the
molecular mechanism of CDK2 in the genesis of childhood cancer
neuroblastoma remains to be fully elucidated.
In a previous study, microarray data from GSE16480
was used for identification of the upregulated genes following CDK2
silencing. The findings revealed that these upregulated genes were
target genes of p53, and silencing of p53 protected the cells from
MYCN-driven apoptosis (9).
However, to the best of our knowledge, there was no systematic and
comprehensive analysis for this expression profile. The present
study downloaded the microarray data of GSE16480 and then
identified significant clusters associated with differentially
expressed genes (DEGs) following CDK2 silencing. Gene ontology (GO)
and pathway enrichment analysis of DEGs in each cluster were
performed, and protein-protein interaction (PPI) network was
constructed. Additionally, a functional annotation of DEGs in the
clusters was performed. The present study aimed to identify key
genes and biological pathways underlying the progression of
neuroblastoma with CDK2 silencing by means of comprehensive
bioinformatics analysis to further elucidate the function of CDK2
in neuroblastoma progression and determine potential targets for
future cancer therapies.
Materials and methods
Source of data
The microarray data GSE16480 was downloaded from
Gene Expression Omnibus (GEO, http://www.ncbi.nlm.nih.gov/geo/) database based on
the platform of GPL570 (Affymetrix Human Genome U133 Plus 2.0
Array), which was deposited by Molenaar et al (9). This dataset contained 15 samples:
Neuroblastoma cell line IMR32 was transfected with CDK2 shRNA at 0,
8, 24, 48 and 72 h (n=3 per group; total=15).
Data preprocessing
Background correction, quartile normalization and
probe summarization were performed to normalize the gene expression
intensities obtained from the raw dataset using robust multi-array
average algorithm (14), and the
gene expression time-course matrix of samples was acquired.
Soft clustering analysis
Noise robust soft clustering of gene expression
time-course data was implemented using the fuzzy C-Means algorithm
(15) in the Mfuzz package
(15,16). The following parameters were set:
Minimum Standard Deviation=0.4, score=0.7. This method may assign
genes into several clusters according to the expression pattern of
DEGs. Then, clusters with significant change tendency were screened
for further analysis.
PPI network construction
The Search Tool for the Retrieval of Interacting
Genes (STRING) database (17) is a
database for the exploration and analysis of known and predicted
protein interactions, including both experimental and predicted
interaction information. The present study used the STRING online
tool to analyze the PPIs of up and downregulated genes with
required confidence (combined score) >0.4. The hub proteins were
subsequently identified from the PPI network based on connectivity
degree analysis.
GO and pathway enrichment
analysis
GO (18) is widely
used for the studies of large-scale genomic or transcriptomic data
in function. Kyoto Encyclopedia of Genes and Genomes (KEGG)
(19) is an online pathway
database, which deals with genomes, enzymatic pathways and
biological chemicals. The present study identified over-represented
GO categories in biological processes and significant KEGG pathways
of the DEGs in each cluster. The P-value of the default
hypergeometric test of >0.05 was selected as the threshold.
Functional annotation of DEGs in each
cluster
The tumor suppressor gene (TSGene) (20) database provides detailed annotation
for each tumor suppressor gene (TSGs), such as transcription
factors (TF) regulations. The tumor-associated gene (TAG) database
(21) summarizes attributes for a
specific entity associated with the TAGs.
Functional annotations of DEGs in clusters were
performed for the detection of TFs and TAGs and both databases,
TSGene and TAG database, were used to identify oncogenes and tumor
suppressor genes.
Results
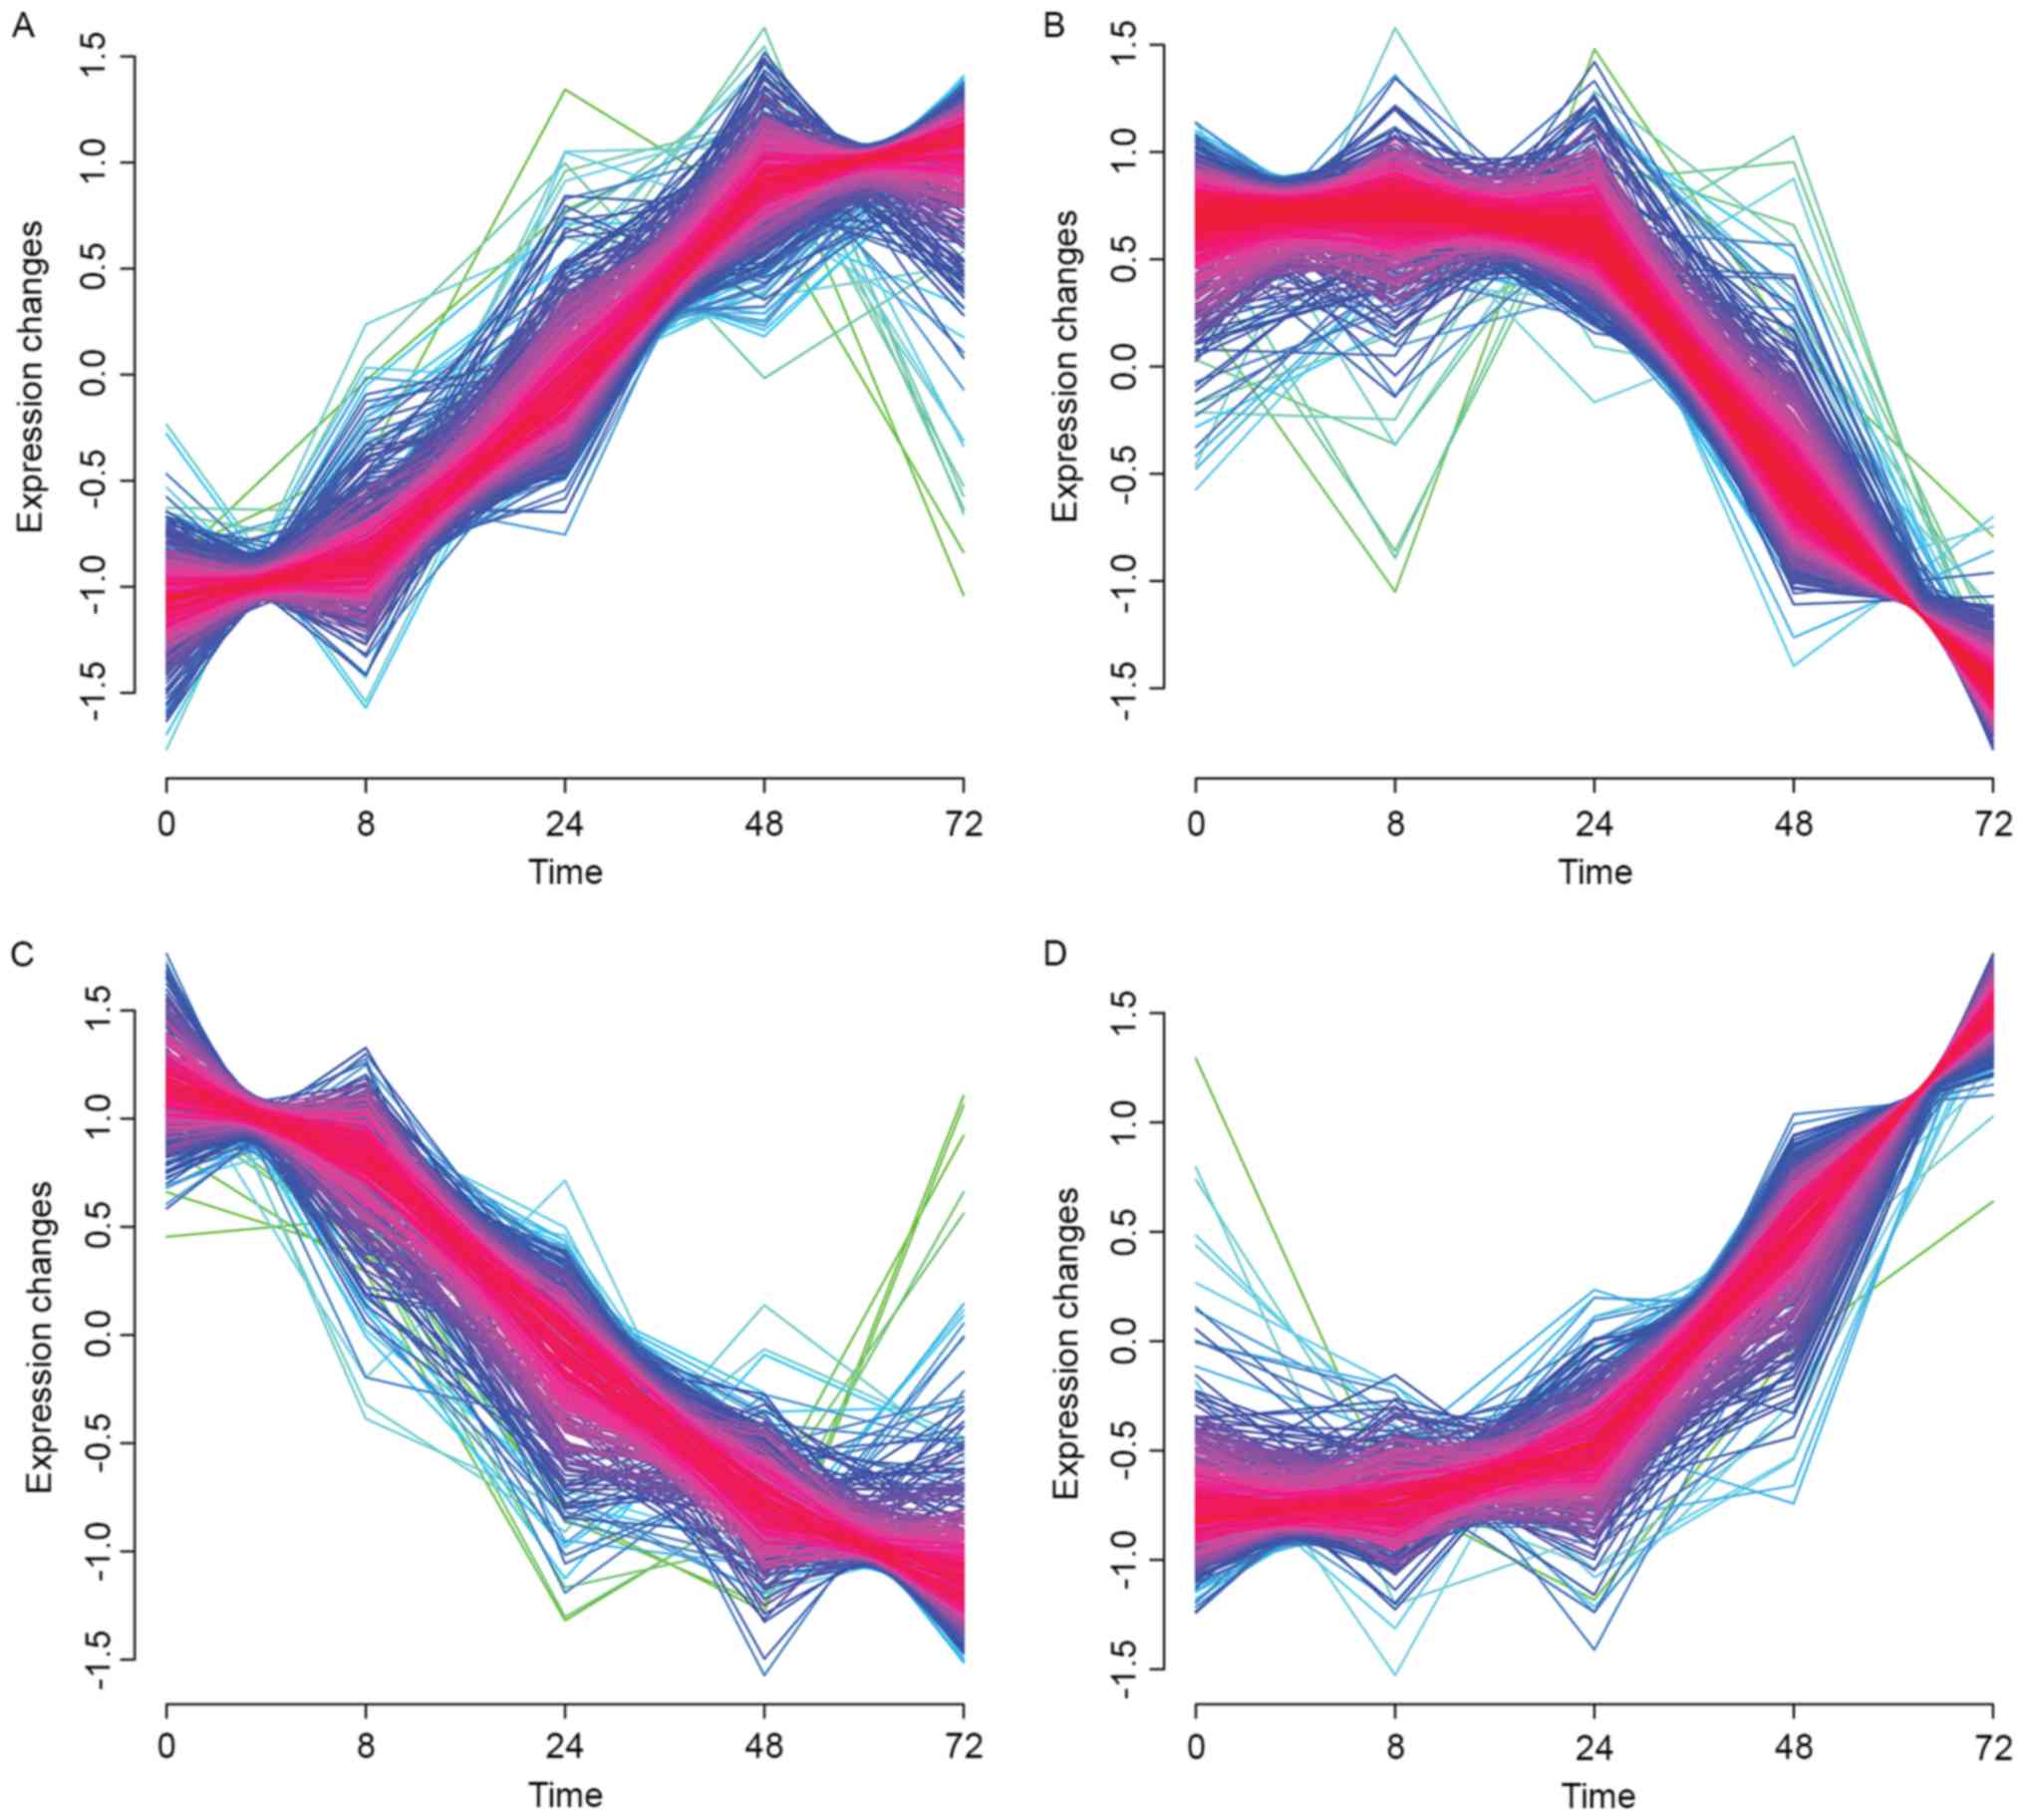
Soft clustering analysis
Soft clustering analysis of gene expression
time-course data identified 4 clusters with significant change
tendency (Fig. 1). Cluster 1
presented an increasing trend (Fig.
1A). Specifically, the expression levels of genes exhibited an
increase from 0 to 8 h; subsequently the levels increased
significantly from 8 to 48 h and remained constant from 48 to 72 h.
It is of note that the change tendency of gene expression in
Cluster 3 (Fig. 1C) at different
time points is evidently opposite to those observed in Cluster 1.
The expression levels of genes in Cluster 3 decreased slightly from
0 to 8 h, subsequently the levels decreased significantly from 8 to
48 h and remained constant from 48 to 72 h. In addition, the change
tendency of gene expression in Cluster 2 (Fig. 1B) at different time points was
evidently opposite to those observed in Cluster 4 (Fig. 1D). The expression levels of genes
in Cluster 2 decreased from 0 to 24 h and subsequently decreased
significantly from 24 to 72 h, whereas in Cluster 4 this trend was
reversed.
Additionally, DEGs with the same expression pattern
as change tendency of clusters was screened. A total of 1,683 DEGs
were identified, including 337 upregulated genes in Cluster 1, 649
downregulated genes in Cluster 2, 387 downregulated genes in
Cluster 3, and 387 upregulated genes in Cluster 4.
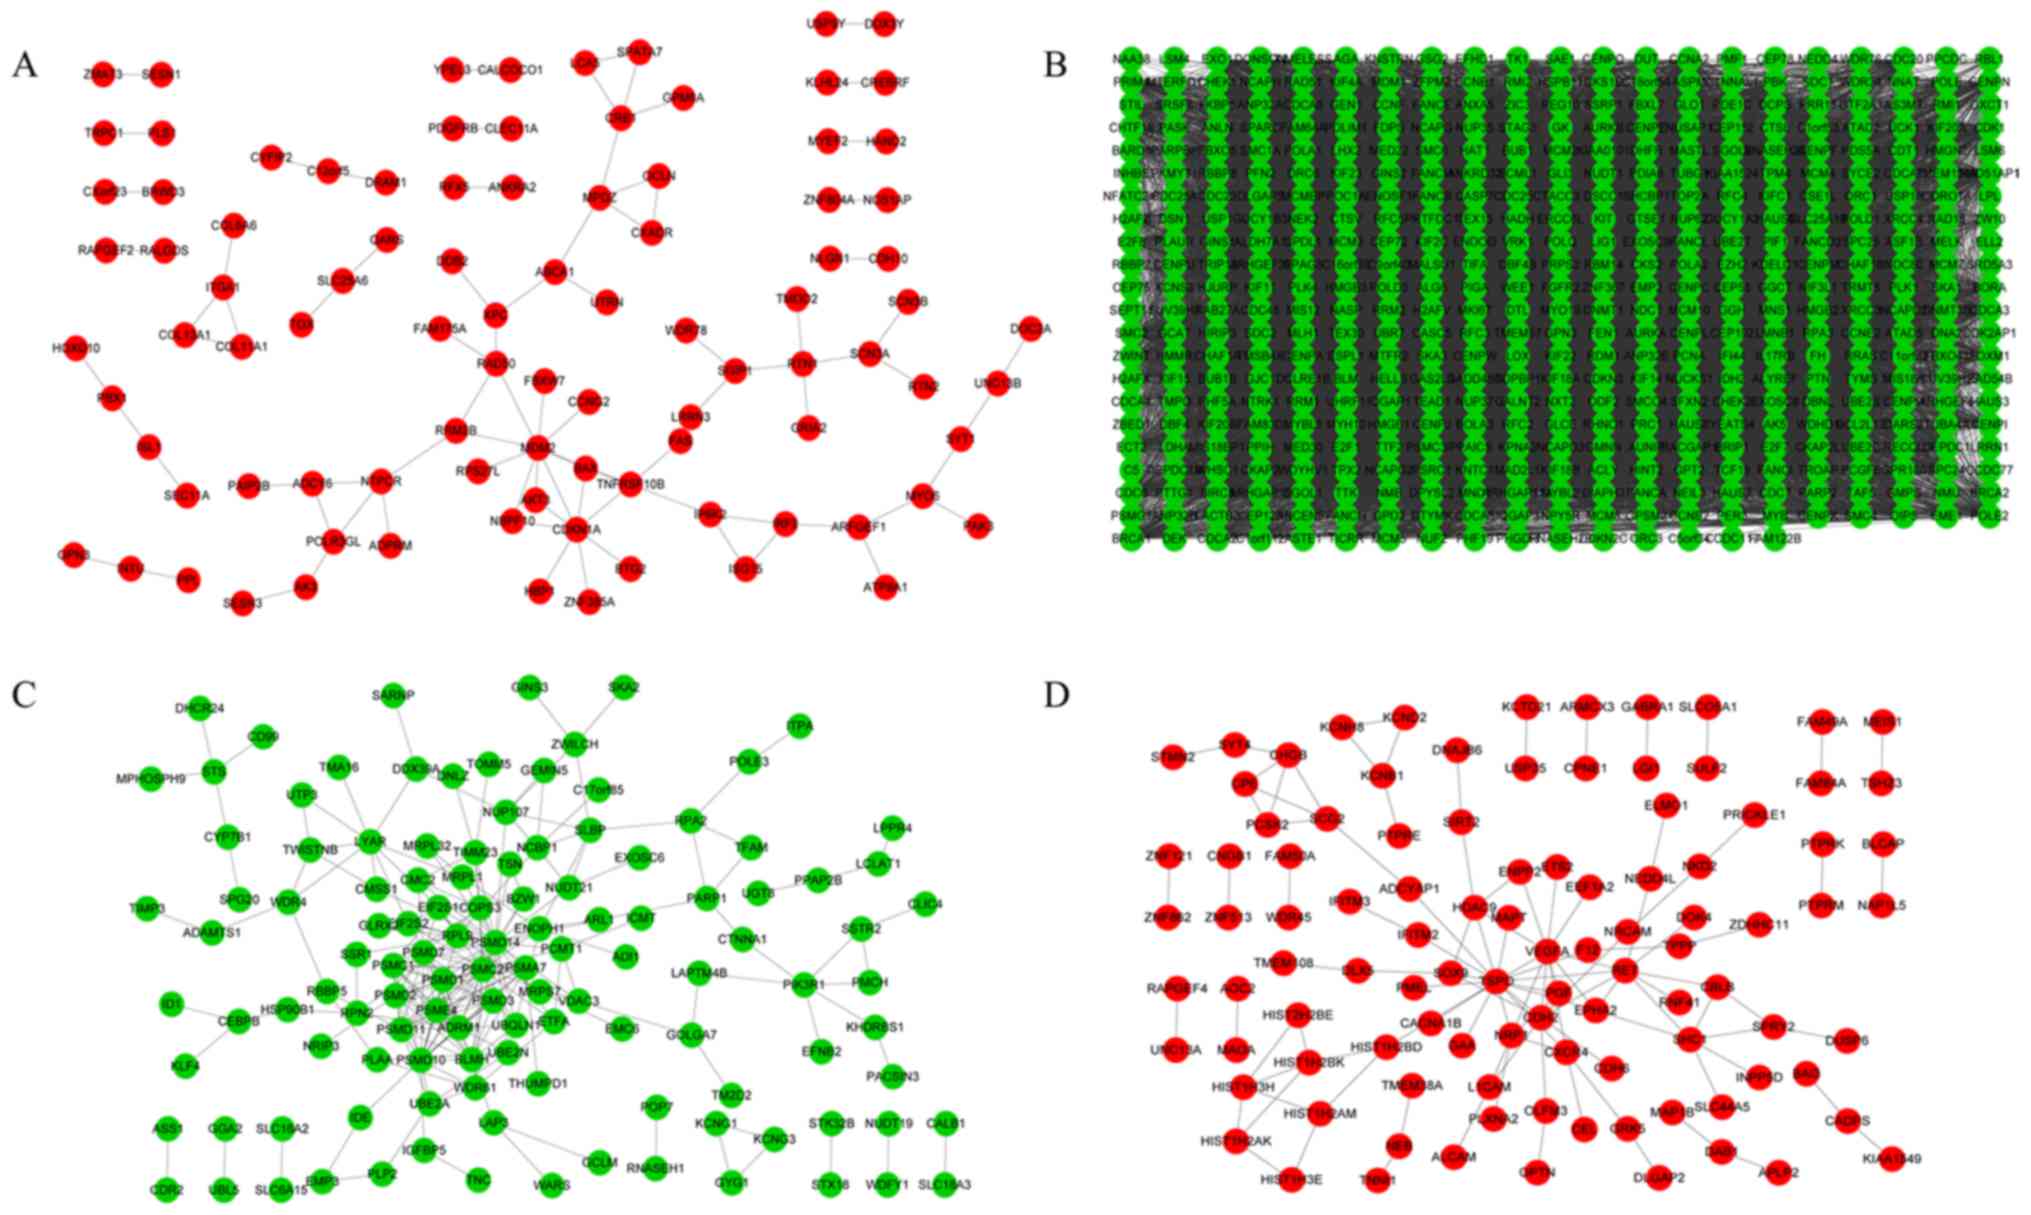
PPI network construction
The PPI networks of DEGs in Cluster 1 (Fig. 2A), 2 (Fig. 2B), 3 (Fig. 2C) and 4 (Fig. 2D) included 86, 18,875, 239 and 109
interactions, respectively. Based on connectivity degree, the hub
genes with the highest degrees in the four clusters were: MDM2
oncogene, E3 ubiquitin protein ligase (MDM2),
cyclin-dependent kinase 1 (CDK1), proteasome (prosome,
macropain) 26S subunit, non-ATPase, 14 (PSMD14),
translocator protein (18 kDa) (TSPO), respectively (Table I).
 | Table I.Top 10 nodes in the protein-protein
interaction network. |
Table I.
Top 10 nodes in the protein-protein
interaction network.
| A, Cluster 1 |
|---|
|
|---|
| Gene | Degree |
|---|
| MDM2 | 10 |
| CDKN1A | 8 |
| TNFRSF10B | 5 |
| CRB1 | 4 |
| MPDZ | 4 |
| NTPCR | 4 |
| RAD50 | 4 |
| RTN1 | 4 |
| ABCA1 | 3 |
| ADCY6 | 3 |
|
| B, Cluster
2 |
|
| Gene | Degree |
|
| CDK1 | 253 |
| MAD2L1 | 251 |
| RFC4 | 248 |
| BUB1 | 241 |
| NCAPG | 239 |
| CCNA2 | 238 |
| CHEK1 | 236 |
| CCNB1 | 233 |
| NDC80 | 232 |
| PBK | 232 |
|
| C, Cluster
3 |
|
| Gene | Degree |
|
| PSMD14 | 32 |
| PSMC2 | 23 |
| PSMD10 | 17 |
| PSMD7 | 15 |
| PSMC1 | 14 |
| PSMD11 | 14 |
| ADRM1 | 14 |
| BLMH | 13 |
| PSMD3 | 13 |
| PSMD1 | 13 |
|
| D, Cluster
4 |
|
| Gene | Degree |
|
| TSPO | 17 |
| VEGFA | 11 |
| RET | 9 |
| CDH2 | 8 |
| SHC1 | 6 |
| NRP1 | 6 |
| CXCR4 | 5 |
| HDAC9 | 5 |
| SCG2 | 4 |
| CHGB | 4 |
GO and pathway enrichment
analysis
The present study performed GO and KEGG pathway
analysis for DEGs in 4 clusters. The over-represented GO terms of
DEGs in Cluster 1, 2, 3 and 4 were response to DNA damage stimulus,
cell cycle, antigen processing and presentation of peptide antigen
via MHC class I, and cell surface receptor signaling pathway,
respectively (Table II). The
significantly enriched KEGG pathways of cluster genes in Cluster 1,
2, 3 and 4 were the p53 signaling pathway, cell cycle, proteasome,
and systemic lupus erythematosus, respectively (Table III).
| Table II.The top 10 enriched GO-biological
process terms of cluster genes. |
Table II.
The top 10 enriched GO-biological
process terms of cluster genes.
| A, Cluster 1 |
|---|
|
|---|
| ID | Description | Count | P-value |
|---|
| GO:0006974 | Response to DNA
damage stimulus | 15 |
2.71×10⁻⁶ |
| GO:0048699 | Generation of
neurons | 18 |
4.06×10⁻⁵ |
| GO:0009411 | Response to UV | 6 |
2.49×10⁻⁵ |
| GO:0097202 | Activation of
cysteine-type endopeptidase activity | 5 |
1.39×10⁻⁴ |
| GO:0051050 | Positive regulation
of transport | 11 |
1.40×10⁻⁴ |
| GO:0032270 | Positive regulation
of cellular protein metabolic process | 14 |
2.35×10⁻⁴ |
| GO:0007267 | Cell-cell
signaling | 16 |
3.86×10⁻⁴ |
| GO:0045937 | Positive regulation
of phosphate metabolic process | 11 |
1.30×10⁻³ |
| GO:0050877 | Neurological system
process | 16 |
1.56×10⁻³ |
| GO:0051146 | Striated muscle
cell differentiation | 6 |
3.94×10⁻³ |
|
| B, Cluster
2 |
|
| ID |
Description | Counts | P-value |
|
| GO:0007049 | Cell cycle | 231 | 0 |
| GO:0006281 | DNA repair | 81 | 0 |
| GO:0006260 | DNA
replication | 72 | 0 |
| GO:0006310 | DNA
recombination | 51 | 0 |
| GO:0000082 | G1/S transition of
mitotic cell cycle | 41 | 0 |
| GO:0000075 | Cell cycle
checkpoint | 38 | 0 |
| GO:0007051 | Spindle
organization | 35 | 0 |
| GO:0007126 | Meiosis | 32 | 0 |
| GO:0007088 | Regulation of
mitosis | 26 | 0 |
| GO:0000086 | G2/M transition of
mitotic cell cycle | 28 |
2.22×10⁻¹⁶ |
|
| C, Cluster
3 |
|
| ID |
Description | Count | P-value |
|
| GO:0002474 | Antigen processing
and presentation of peptide antigen via MHC class I | 13 |
3.21×10⁻¹³ |
| GO:0006521 | Regulation of
cellular amino acid metabolic process | 11 |
3.08×10⁻¹³ |
| GO:0006977 | DNA damage
response, signal transduction by p53 class mediator resulting in
cell cycle arrest | 11 |
1.38×10⁻¹² |
| GO:0031145 | Anaphase-promoting
complex-dependent proteasomal ubiquitin-dependent protein catabolic
process | 11 |
1.88×10⁻¹¹ |
| GO:0000209 | Protein
polyubiquitination | 14 |
2.32×10⁻¹¹ |
| GO:0016071 | mRNA metabolic
process | 19 |
1.07×10⁻⁷ |
| GO:0043248 | Proteasome
assembly | 3 |
2.04×10⁻⁵ |
| GO:0006406 | mRNA export from
nucleus | 4 |
1.35×10⁻³ |
| GO:0006369 | Termination of RNA
polymerase II transcription | 3 |
4.53×10⁻³ |
| GO:0006446 | Regulation of
translational initiation | 3 |
1.18×10⁻² |
|
| D, Cluster
4 |
| ID |
Description | Count | P-value |
|
| GO:0007166 | Cell surface
receptor signaling pathway | 38 |
1.79×10⁻⁸ |
| GO:0001525 | Angiogenesis | 12 |
2.81×10⁻⁶ |
| GO:0045773 | Positive regulation
of axon extension | 4 |
8.88×10⁻⁶ |
| GO:0009968 | Negative regulation
of signal transduction | 15 |
3.97×10⁻⁵ |
|
| D, Cluster
4 |
|
| ID |
Description | Count | P-value |
|
| GO:0006334 | Nucleosome
assembly | 6 |
5.21×10⁻⁵ |
| GO:0040013 | Negative regulation
of locomotion | 6 |
4.04×10⁻⁴ |
| GO:0001657 | Ureteric bud
development | 5 |
4.23×10⁻⁴ |
| GO:0042391 | Regulation of
membrane potential | 8 |
5.87×10⁻⁴ |
| GO:0090090 | Negative regulation
of canonical Wnt receptor signaling pathway | 4 |
1.60×10⁻³ |
| GO:0071495 | Cellular response
to endogenous stimulus | 12 |
3.16×10⁻³ |
| Table III.Enriched KEGG pathways of cluster
genes. |
Table III.
Enriched KEGG pathways of cluster
genes.
| A, Cluster 1 |
|---|
|
|---|
| ID | Description | Count | P-value |
|---|
| 115 | p53 signaling
pathway | 11 |
1.24×10⁻¹² |
| 5200 | Pathways in
cancer | 7 |
9.90×10⁻³ |
| 4510 | Focal adhesion | 6 |
3.48×10⁻³ |
| 230 | Purine
metabolism | 5 |
6.85×10⁻³ |
| 5214 | Glioma | 4 |
1.33×10⁻³ |
| 5218 | Melanoma | 4 |
1.85×10⁻³ |
| 4210 | Apoptosis | 4 |
3.89×10⁻³ |
| 5215 | Prostate
cancer | 4 |
4.22×10⁻³ |
| 5210 | Colorectal
cancer | 3 |
1.09×10⁻² |
| 5220 | Chronic myeloid
leukemia | 3 |
1.70×10⁻² |
| 4512 | ECM-receptor
interaction | 3 |
2.53×10⁻² |
| 4012 | ErbB signaling
pathway | 3 |
2.69×10⁻² |
| 240 | Pyrimidine
metabolism | 3 |
3.74×10⁻² |
| 5219 | Bladder cancer | 2 |
3.91×10⁻² |
| 3420 | Nucleotide excision
repair | 2 |
4.26×10⁻² |
|
| B, Cluster
2 |
|
| ID |
Description | Count | P-value |
|
| 4110 | Cell cycle | 38 | 0 |
| 3030 | DNA
replication | 23 | 0 |
| 4114 | Oocyte meiosis | 19 |
6.61×10⁻¹⁰ |
| 230 | Purine
metabolism | 16 |
2.72×10⁻⁵ |
| 240 | Pyrimidine
metabolism | 14 |
1.33×10⁻⁶ |
| 3430 | Mismatch
repair | 11 |
1.44×10⁻¹¹ |
| 3420 | Nucleotide excision
repair | 11 |
4.70×10⁻⁸ |
| 4914 |
Progesterone-mediated oocyte
maturation | 11 |
4.95×10⁻⁵ |
| 3410 | Base excision
repair | 10 |
2.58×10⁻⁸ |
| 3440 | Homologous
recombination | 9 |
7.45×10⁻⁸ |
| 4115 | p53 signaling
pathway | 9 |
1.87×10⁻⁴ |
| 3018 | RNA
degradation | 6 |
2.01×10⁻² |
| 310 | Lysine
degradation | 5 |
1.01×10⁻² |
| 790 | Folate
biosynthesis | 2 |
4.20×10⁻² |
|
| C, Cluster
3 |
|
| ID |
Description | Count | P-value |
|
| 3050 | Proteasome | 10 |
7.56×10⁻¹² |
| 3013 | RNA transport | 6 |
3.52×10⁻³ |
| 3030 | DNA
replication | 3 |
5.19×10⁻³ |
| 4141 | Protein processing
in endoplasmic reticulum | 6 |
5.44×10⁻³ |
| 3410 | Base excision
repair | 2 |
4.17×10⁻² |
| 270 | Cysteine and
methionine metabolism | 2 |
4.88×10⁻² |
|
| D, Cluster
4 |
|
| ID |
Description | Count | P-value |
|
| 5322 | Systemic lupus
erythematosus | 7 |
7.73×10⁻⁵ |
| 4144 | Endocytosis | 6 |
4.47×10⁻³ |
| 4360 | Axon guidance | 5 |
3.16×10⁻³ |
| 4514 | Cell adhesion
molecules (CAMs) | 5 |
3.60×10⁻³ |
| 5100 | Bacterial invasion
of epithelial cells | 3 |
1.71×10⁻² |
| 360 | Phenylalanine
metabolism | 2 |
7.58×10⁻³ |
| 260 | Glycine, serine and
threonine metabolism | 2 |
2.57×10⁻² |
| 350 | Tyrosine
metabolism | 2 |
4.06×10⁻² |
| 5219 | Bladder cancer | 2 |
4.24×10⁻² |
Functional annotation of DEGs in each
cluster
As presented in Table
IV the present study revealed that with increased time 5 TFs
and 13 TAGs in Cluster 1 were upregulated, 17 TFs and 49 TAGs in
Cluster 2 were downregulated, 3 TFs and 3 TAGs in Cluster 3 were
downregulated, 3 TFs and 15 TAGs in Cluster 4 were upregulated.
| Table IV.The functional annotation of cluster
genes in PPI network. |
Table IV.
The functional annotation of cluster
genes in PPI network.
| Cluster no. | TF | TS genes | Oncogene | Other |
|---|
| Cluster 1 | HAND2, RFX5,
HOXD10, PBX1, ISL1 | CDKN1A, ISG15,
TNFRSF10B, HBP1, YPEL3, FBXW7, BTG2 | IRF2, MDM2, AKT3,
PDGFRB, PBX1 | BAX |
| Cluster 2 | HMGB2, BRCA1,
BRIP1, EZH2, MYBL2, SSRP1, FOXM1, E2F7, HMGB1, BRCA2, TEAD1, TAF5,
RBL1, GLI3, GTF2A1, MYBL1, LHX2 | CHEK1, RBBP7,
BRCA1, BARD1, BLM, FANCD2, BUB1B, CHEK2, FANCG, E2F1, LPL, GADD45G,
BRCA2, RBL1, CDK2AP1, MLH1, ANP32A, LOX, RBM14, FH, CDKN2C | PTTG1, AURKA,
CEP55, CCNA2, WHSC1, MYBL2, DEK, HMMR, CSE1L, RRAS, MYB, FGFR2,
TEAD1, KIT, NTRK1, MYBL1 | DNMT3B, BUB1,
BIRC5, TACC3, PLK1, CCNE2, RAD54B, YEATS4, ANP32B, ANXA5, NIF3L1,
LHX2 |
| Cluster 3 | TFAM, KLF4,
ID1 | TIMP3, IGFBP5 |
| KLF4 |
| Cluster 4 | SOX9, MEIS1,
ETS2 | SPRY2, LGI1, BAI3,
NRCAM, BLCAP, DUSP6, PTPRK, SIRT2, PRICKLE1 | VEGFA, RET, MEIS1,
ETS2 | SHC1, CBLB |
Discussion
The present study identified significant DEGs in a
neuroblastoma cell line with CDK2 silencing, including MDM2,
CDK1, PSMD14 and TSPO. The genes with higher
degrees in the PPI network were significantly enriched in the p53
signaling pathway, cell cycle and proteasome.
MDM2 with the highest connectivity degrees in
Cluster 1 was significantly upregulated in the neuroblastoma
samples. The MDM2 gene encodes a nuclear-localized E3
ubiquitin ligase, which is a critical effector of the MYCN
oncogene in tumorigenesis and is a transcriptional target of MYCN
in neuroblastoma (7,22). Elevated MDM2 levels increase
MYCN-induced genomic instability via regulating centrosome
replication in the neuroblastoma (23). In addition, MDM2 may bind to p53 at
its transactivation domain with high affinity for negatively
modulating its transcriptional activity and stability (24). A previous study favored the idea
that the MDM2-p53 interaction was effectively involved in cellular
processes via the p53 pathway (25). The p53 signaling pathway and its
inactivation has a key regulatory role in neuroblastoma progression
(26). Additionally,
phosphorylation of MdmX by CDK2/Cdc2p34 effectively
regulates the nuclear export of MDM2, and thus has an important
role in the regulation of p53 transcription and stability (27). Inhibition of p53-mediated apoptosis
is a prerequisite for MYC-driven tumorigenesis in
neuroblastoma (7). This may be the
reason behind the upregulated expression of MDM2 in neuroblastoma
cells following CDK2 silencing. In the current study, MDM2 was
significantly enriched in the p53 signaling pathway. Therefore, the
findings of the current study suggest that MDM2 may function as an
oncogene for promoting neuroblastoma progression via the p53
signaling pathway, and CDK2 may inhibit MYC-driven
tumorigenesis in neuroblastoma by targeting MDM2 and activating the
p53 signaling pathway.
PSMD14 is the hub gene in Cluster 3 with the
higher degrees. This gene encodes a component of the 26S
proteasome, which catalyzes the degradation of ubiquitinated
intracellular proteins (28). The
26S proteasome may mediate the degradation of N-myc in
neuroblastoma cells in vivo (29). Increased expression of the
proteasome has an important role in the protective effects of
sulforaphane against hydrogen peroxide-mediated cytotoxicity in
neuroblastoma cells (30).
Additionally, a PSMD14 knockdown may restore sensitivity of
Mcl1-dependent neuroblastoma to ABT-737 (a small molecule inhibitor
of Bcl2, BclXL and BclW), thus decreasing the activity of Bcl2,
BclXL and BclW (31). Bcl2 family
proteins have important roles in neutralizing activated BCL2 like
11 and evading apoptosis in neuroblastoma cells (32,33).
Therefore, the findings of the current study suggest that
PSMD14 may contribute to neuroblastoma progression via the
proteasome. It is of note that the clustering analysis performed in
the current study revealed that the expression pattern of genes in
Cluster 3 at different time points was evidently opposite to the
one observed in Cluster 1. Therefore, it is possible that a
synthetic suppression effect occurred between these genes in
Cluster 3 and Cluster 1 to some extent. Liang et al
(34) demonstrated that
downregulation of PSMD14 was involved in the activation of
p53-regulated pro-apoptotic signaling pathways and the activity of
p53 was associated with MDM2 expression (34). Additionally, p53 regulates the
expression of cyclin dependent kinase inhibitor 1A, which mediates
the p53-dependent cell cycle arrest at the G1 phase via binding and
thus inhibiting the activity of CDK2. Therefore, the findings of
the present study also suggest that CDK2 may have a key role in
neuroblastoma progression by regulating the expression of p53,
which may be due to the synthetically lethal relationship between
MDM2 and PSMD14.
CDK1 has an important role in cell cycle regulation
by governing the transition from G2 to M phase and cell cycle
regulation is important for cell proliferation (35,36).
The CDK1 inhibitors induce G2 arrest in various cell types and
effectively downregulate the expression of MYCN, which in
turn reduce the transcriptional activation of MYCN on the
survivin promoter in neuroblastoma cells (37). In the present study, CDK1 was
significantly involved in cell cycle. Therefore, CDK1 may be
involved in neuroblastoma progression through the cell cycle.
However, previous studies have confirmed that CDK1 alone is
sufficient to drive the mammalian cell cycle and the genetic
ablation of CDK2 may be compensated for by CDK1 (38,39).
A previous study determined that despite CDK2 inhibition, the
proliferation of cancer cells was due to the expression of CDK1 to
some extent (39). In the current
study, the expression of CDK1 was downregulated following CDK2
silencing; therefore, it is possible for CDK2 to contribute to
neuroblastoma progression via regulation of CDK1 expression.
TSPO is a transmembrane protein associated with the
mitochondrial permeability pore, mitochondrial transport has an
important role in the initiation of the apoptotic cascade (40). A previous study revealed that TSPO
ligands are capable of inducing apoptosis in various types of
cancers, such as hepatocellular carcinoma, colorectal cancer,
esophageal cancer and glioma (41). TSPO ligand PK11195 induces
apoptosis and leads to cell cycle arrest in neuroblastoma cell
lines at micromolar concentrations (42). Therefore, TSPO may induce apoptosis
in neuroblastoma cells and is involved in cell cycle. However, with
CDK2 silencing, the expression of TSPO has been observed to be
upregulated. Therefore, CDK2 may promote neuroblastoma progression
by reducing TSPO expression. Due to the effect of synthetic
suppression observed between TSPO and CDK1 in the present study, it
is possible that CDK2 may be involved in neuroblastoma progression
via regulation of the interaction of TSPO and CDK1 in the cell
cycle.
However, the relatively small sample size is a
limitation of the current study. In addition, there is no
experimental evaluation of the present study. Additional
experiments, such as expression validation or knockdown assay are
required to confirm the current observations.
In conclusion, MDM2, CDK1,
PSMD14 and TSPO may be key target genes of CDK2, and
CDK2 may play an important role in neuroblastoma progression by
targeting these genes. MDM2 may function as an oncogene that
promotes neuroblastoma tumorigenesis via the p53 signaling pathway.
PSMD14 may allow neuroblastoma cells to evade apoptosis in
via proteasome. TSPO and CDK1 may be involved in
neuroblastoma progression by regulating the cell cycle. CDK2 may
promote neuroblastoma progression by regulating the expression of
MDM2, PSMD14, CDK1 and TSPO.
Acknowledgements
The present study was supported by The Natural
Science Foundation of Jilin Province (grant nos. 20150204086SF and
20150101160JC) and The High Technology Research and Development
Program of Jilin Province of China (grant nos: 2015Y032-4 and
2014G074).
References
|
1
|
Reck M, Popat S, Reinmuth N, De Ruysscher
D, Kerr KM and Peters S; ESMO Guidelines Working Group, :
Metastatic non-small-cell lung cancer (NSCLC): ESMO clinical
practice guidelines for diagnosis, treatment and follow-up. Ann
Oncol. 3 Suppl 25:iii27–iii39. 2014. View Article : Google Scholar
|
|
2
|
George RE, Sanda T, Hanna M, Fröhling S,
Luther W II, Zhang J, Ahn Y, Zhou W, London WB, McGrady P, et al:
Activating mutations in ALK provide a therapeutic target in
neuroblastoma. Nature. 455:975–978. 2008. View Article : Google Scholar : PubMed/NCBI
|
|
3
|
Mossé YP, Laudenslager M, Longo L, Cole
KA, Wood A, Attiyeh EF, Laquaglia MJ, Sennett R, Lynch JE, Perri P,
et al: Identification of ALK as a major familial neuroblastoma
predisposition gene. Nature. 455:930–935. 2008. View Article : Google Scholar : PubMed/NCBI
|
|
4
|
George RE, Li S, Medeiros-Nancarrow C,
Neuberg D, Marcus K, Shamberger RC, Pulsipher M, Grupp SA and
Diller L: High-risk neuroblastoma treated with tandem autologous
peripheral-blood stem cell-supported transplantation: Long-term
survival update. J Clin Oncol. 24:2891–2896. 2006. View Article : Google Scholar : PubMed/NCBI
|
|
5
|
Schwab M, Varmus HE, Bishop JM, Grzeschik
KH, Naylor SL, Sakaguchi AY, Brodeur G and Trent J: Chromosome
localization in normal human cells and neuroblastomas of a gene
related to c-myc. Nature. 308:288–291. 1984. View Article : Google Scholar : PubMed/NCBI
|
|
6
|
Cole MD and Cowling VH:
Transcription-independent functions of MYC: Regulation of
translation and DNA replication. Nat Rev Mol Cell Biol. 9:810–815.
2008. View
Article : Google Scholar : PubMed/NCBI
|
|
7
|
Slack A, Chen Z, Tonelli R, Pule M, Hunt
L, Pession A and Shohet JM: The p53 regulatory gene MDM2 is a
direct transcriptional target of MYCN in neuroblastoma. Proc Natl
Acad Sci USA. 102:pp. 731–736. 2005; View Article : Google Scholar : PubMed/NCBI
|
|
8
|
Meyer N, Kim SS and Penn LZ: The
Oscar-worthy role of Myc in apoptosis. Semin Cancer Biol.
16:275–287. 2006. View Article : Google Scholar : PubMed/NCBI
|
|
9
|
Molenaar JJ, Ebus ME, Geerts D, Koster J,
Lamers F, Valentijn LJ, Westerhout EM, Versteeg R and Caron HN:
Inactivation of CDK2 is synthetically lethal to MYCN
over-expressing cancer cells. Proc Natl Acad Sci USA. 106:pp.
12968–12973. 2009; View Article : Google Scholar : PubMed/NCBI
|
|
10
|
Vermeulen K, Van Bockstaele DR and
Berneman ZN: The cell cycle: A review of regulation, deregulation
and therapeutic targets in cancer. Cell Prolif. 36:131–149. 2003.
View Article : Google Scholar : PubMed/NCBI
|
|
11
|
Malumbres M and Barbacid M: Mammalian
cyclin-dependent kinases. Trends Biochem Sci. 30:630–641. 2005.
View Article : Google Scholar : PubMed/NCBI
|
|
12
|
Shapiro GI: Cyclin-dependent kinase
pathways as targets for cancer treatment. J Clin Oncol.
24:1770–1783. 2006. View Article : Google Scholar : PubMed/NCBI
|
|
13
|
Hall C, Nelson DM, Ye X, Baker K, DeCaprio
JA, Seeholzer S, Lipinski M and Adams PD: HIRA, the human homologue
of yeast Hir1p and Hir2p, is a novel cyclin-cdk2 substrate whose
expression blocks S-phase progression. Mol Cell Biol. 21:1854–1865.
2001. View Article : Google Scholar : PubMed/NCBI
|
|
14
|
Irizarry RA, Hobbs B, Collin F,
Beazer-Barclay YD, Antonellis KJ, Scherf U and Speed TP:
Exploration, normalization, and summaries of high density
oligonucleotide array probe level data. Biostatistics. 4:249–264.
2003. View Article : Google Scholar : PubMed/NCBI
|
|
15
|
Futschik ME and Carlisle B: Noise-robust
soft clustering of gene expression time-course data. J Bioinform
Comput Biol. 3:965–988. 2005. View Article : Google Scholar : PubMed/NCBI
|
|
16
|
Kumar L and Futschik E M: Mfuzz: A
software package for soft clustering of microarray data.
Bioinformation. 2:5–7. 2007. View Article : Google Scholar : PubMed/NCBI
|
|
17
|
von Mering C, Huynen M, Jaeggi D, Schmidt
S, Bork P and Snel B: STRING: A database of predicted functional
associations between proteins. Nucleic Acids Res. 31:258–261. 2003.
View Article : Google Scholar : PubMed/NCBI
|
|
18
|
Ashburner M, Ball CA, Blake JA, Botstein
D, Butler H, Cherry JM, Davis AP, Dolinski K, Dwight SS, Eppig JT,
et al: Gene ontology: Tool for the unification of biology. The gene
ontology consortium. Nat Genet. 25:25–29. 2000. View Article : Google Scholar : PubMed/NCBI
|
|
19
|
Kanehisa M and Goto S: KEGG: Kyoto
encyclopedia of genes and genomes. Nucleic Acids Res. 28:27–30.
2000. View Article : Google Scholar : PubMed/NCBI
|
|
20
|
Zhao M, Sun J and Zhao Z: TSGene: A web
resource for tumor suppressor genes. Nucleic Acids Res. 41(Database
Issue): D970–D976. 2013. View Article : Google Scholar : PubMed/NCBI
|
|
21
|
Chen JS, Hung WS, Chan HH, Tsai SJ and Sun
HS: In silico identification of oncogenic potential of fyn-related
kinase in hepatocellular carcinoma. Bioinformatics. 29:420–427.
2013. View Article : Google Scholar : PubMed/NCBI
|
|
22
|
Slack A and Shohet JM: MDM2 as a critical
effector of the MYCN oncogene in tumorigenesis. Cell Cycle.
4:857–860. 2005. View Article : Google Scholar : PubMed/NCBI
|
|
23
|
Slack AD, Chen Z, Ludwig AD, Hicks J and
Shohet JM: MYCN-directed centrosome amplification requires
MDM2-mediated suppression of p53 activity in neuroblastoma cells.
Cancer Res. 67:2448–2455. 2007. View Article : Google Scholar : PubMed/NCBI
|
|
24
|
Vassilev LT, Vu BT, Graves B, Carvajal D,
Podlaski F, Filipovic Z, Kong N, Kammlott U, Lukacs C, Klein C, et
al: In vivo activation of the p53 pathway by small-molecule
antagonists of MDM2. Science. 303:844–848. 2004. View Article : Google Scholar : PubMed/NCBI
|
|
25
|
Meek DW and Knippschild U:
Posttranslational modification of MDM2. Mol Cancer Res.
1:1017–1026. 2003.PubMed/NCBI
|
|
26
|
Tweddle DA, Pearson AD, Haber M, Norris
MD, Xue C, Flemming C and Lunec J: The p53 pathway and its
inactivation in neuroblastoma. Cancer Lett. 197:93–98. 2003.
View Article : Google Scholar : PubMed/NCBI
|
|
27
|
Elias B, Laine A and Ronai Z:
Phosphorylation of MdmX by CDK2/Cdc2(p34) is required for nuclear
export of Mdm2. Oncogene. 24:2574–2579. 2005. View Article : Google Scholar : PubMed/NCBI
|
|
28
|
Tanaka K: The proteasome: Overview of
structure and functions. Proc Jpn Acad Ser B Phys Biol Sci. 85:pp.
12–36. 2009; View Article : Google Scholar : PubMed/NCBI
|
|
29
|
Bonvini P, Nguyen P, Trepel J and Neckers
LM: In vivo degradation of N-myc in neuroblastoma cells is mediated
by the 26S proteasome. Oncogene. 16:1131–1139. 1998. View Article : Google Scholar : PubMed/NCBI
|
|
30
|
Kwak MK, Cho JM, Huang B, Shin S and
Kensler TW: Role of increased expression of the proteasome in the
protective effects of sulforaphane against hydrogen
peroxide-mediated cytotoxicity in murine neuroblastoma cells. Free
Radic Biol Med. 43:809–817. 2007. View Article : Google Scholar : PubMed/NCBI
|
|
31
|
Laetsch T, Liu X, Vu A, Sliozberg M, Vido
M, Elci OU, Goldsmith KC and Hogarty MD: Multiple components of the
spliceosome regulate Mcl1 activity in neuroblastoma. Cell Death
Dis. 5:e10722014. View Article : Google Scholar : PubMed/NCBI
|
|
32
|
Goldsmith KC, Lestini BJ, Gross M, Ip L,
Bhumbla A, Zhang X, Zhao H, Liu X and Hogarty MD: BH3 response
profiles from neuroblastoma mitochondria predict activity of small
molecule Bcl-2 family antagonists. Cell Death Differ. 17:872–882.
2010. View Article : Google Scholar : PubMed/NCBI
|
|
33
|
Goldsmith KC, Gross M, Peirce S, Luyindula
D, Liu X, Vu A, Sliozberg M, Guo R, Zhao H, Reynolds CP and Hogarty
MD: Mitochondrial Bcl-2 family dynamics define therapy response and
resistance in neuroblastoma. Cancer Res. 72:2565–2577. 2012.
View Article : Google Scholar : PubMed/NCBI
|
|
34
|
Liang J, Parchaliuk D, Medina S, Sorensen
G, Landry L, Huang S, Wang M, Kong Q and Booth SA: Activation of
p53-regulated pro-apoptotic signaling pathways in PrP-mediated
myopathy. BMC Genomics. 10:2012009. View Article : Google Scholar : PubMed/NCBI
|
|
35
|
Goga A, Yang D, Tward AD, Morgan DO and
Bishop JM: Inhibition of CDK1 as a potential therapy for tumors
over-expressing MYC. Nat Med. 13:820–827. 2007. View Article : Google Scholar : PubMed/NCBI
|
|
36
|
Bettayeb K, Oumata N, Echalier A, Ferandin
Y, Endicott JA, Galons H and Meijer L: CR8, a potent and selective,
roscovitine-derived inhibitor of cyclin-dependent kinases.
Oncogene. 27:5797–5807. 2008. View Article : Google Scholar : PubMed/NCBI
|
|
37
|
Chen Y, Tsai YH and Tseng SH: Inhibition
of cyclin-dependent kinase 1-induced cell death in neuroblastoma
cells through the microRNA-34a-MYCN-survivin pathway. Surgery.
153:4–16. 2013. View Article : Google Scholar : PubMed/NCBI
|
|
38
|
Santamaría D, Barrière C, Cerqueira A,
Hunt S, Tardy C, Newton K, Cáceres JF, Dubus P, Malumbres M and
Barbacid M: Cdk1 is sufficient to drive the mammalian cell cycle.
Nature. 448:811–815. 2007. View Article : Google Scholar : PubMed/NCBI
|
|
39
|
Tetsu O and McCormick F: Proliferation of
cancer cells despite CDK2 inhibition. Cancer Cell. 3:233–245. 2003.
View Article : Google Scholar : PubMed/NCBI
|
|
40
|
Casellas P, Galiegue S and Basile AS:
Peripheral benzodiazepine receptors and mitochondrial function.
Neurochem Int. 40:475–486. 2002. View Article : Google Scholar : PubMed/NCBI
|
|
41
|
Santidrián AF, Cosialls AM, Coll-Mulet L,
Iglesias-Serret D, de Frias M, González-Gironès DM, Campàs C,
Domingo A, Pons G and Gil J: The potential anticancer agent PK11195
induces apoptosis irrespective of p53 and ATM status in chronic
lymphocytic leukemia cells. Haematologica. 92:1631–1638. 2007.
View Article : Google Scholar : PubMed/NCBI
|
|
42
|
Mendonça-Torres MC and Roberts SS: The
translocator protein (TSPO) ligand PK11195 induces apoptosis and
cell cycle arrest and sensitizes to chemotherapy treatment in pre-
and post-relapse neuroblastoma cell lines. Cancer Biol Ther.
14:319–326. 2013. View Article : Google Scholar : PubMed/NCBI
|