Introduction
Ewing sarcoma (ES) is the second most common
malignant bone tumor, with the highest morbidity rates in children
aged 10–20 years and with undistinguishable features from another
Ewing family tumor, primitive neuroectodermal tumor (PNET)
(1,2). Surgery, radiation and chemotherapy
make up the standard treatments of ES; although there has been
significant improvement in prognosis for localized ES, the survival
rates of metastatic patients are low with only ~13–30% 5-year
survival rate (3,4). Early diagnosis would aid in improving
the prognosis of patients with ES, whereas traditional pathological
diagnosis has a number of limitations, such as subjectivity and an
absence of biological markers (5).
Besides, there are ~200 new cases among children and 20 new cases
among adults in USA per year. Therefore, it is necessary to develop
novel diagnostic and treatment methods to reduce ES morbidity and
mortality.
The development of genomic technologies has provided
unprecedented opportunities to detail the progression of ES and
biomarker identification. A common biomarker target in ES is Ewing
sarcoma breakpoint region 1-Friend leukemia integration 1
(EWS-FLI1), a fusion gene induced by t(11;22) (q24;q12) chromosome
translocation (6–8), which has been reported as an
independent prognosis determinant in ES (9). EWS-FLI1 may directly activate or
repress multi gene enhancer elements associated with ES through
different chromatin remodeling mechanisms that may promote tumor
cell growth and proliferation (10). In addition, as a transcription
factor, EWS-FLI1 binds to various genes and determines drug
response (11); and based on this
information several small bioactive molecules were developed for
the treatment of ES (12–14). Ciclopirox (CPX) is an antifungal
drug that isoften used for the treatment of fungal-induced skin and
nail diseases (15–17). A previous study reported on the
antitumoral activity of CPX in human breast cancer through a series
molecular level analyses, which may indicate its potential use in
cancer treatment (18). Another
study demonstrated the inhibitory activity of CPX on mammalian
target of rapamycin, which is useful for promoting parthenolide
anti leukemia activity (19).
However, there are few studies concerning the roles of CPX in
ES.
In the present study, the roles of CPX in ES were
explored through the combined analysis of genome and transcript me
datasets, and for the first time, to the best of our knowledge,
combined analysis of a CPX-regulated gene expression profile and an
EWS-FLI1 genome-binding profile was conducted. The transcript me
datasets comprised oxicycl in induced EWS-FLI1-knockdown and
wild-type ES samples (A673 cell lines without any treatment), which
aided in identifying targets that may be regulated by EWS-FLI1. The
genome datasets are chromatin immune precipitation coupled with
high-throughput sequencing (ChIP-seq) data of EWS-FLI1 in
CPX-treated A673 cell line. Through the genome datasets, we should
identify CPX-specific targets mediated by EWS-FLI1. Therefore, the
combined analysis of the two datasets may be able to obtain more
reliable targets of CPX in ES. In addition, the systemic
bioinformatics analysis performed in the present study, which
included functional and network analysis, may aid our understanding
of the underlying mechanisms of ES and to improve prognosis.
Materials and methods
High-throughput datasets
The present study used three high-throughput genome
and transcript me datasets that were downloaded from the Gene
Expression Omnibus online repository (https://www.ncbi.nlm.nih.gov/geo/). To investigate the
influence of EWS-FLI1 knockdown on genome-scale expression, gene
expression profiles in A673 ES cell lines with the accession number
of GSE27524 (20), which contained
six time points (0, 18, 36, 53, 72 and 96 h) following EWS-FLI1
doxycycline-inducible knockdown, and a total of 22,277 transcripts
were profiled based on the Affymetrix Human Genome U133A 2.0 Array.
Another genome-scale expression dataset, GSE79641 (21), was used to explore the influence of
CPX treatment in ES; this data set comprised 36 ES cell lines,
including 3CPX-treated A673 cell lines and three corresponding
dimethylsulfoxide-treated A673 cell lines as controls. In addition,
two sub-data sets of GSE61944 (10), including GSM1517562, which was
obtained through EWS-FLI1 chromatin immune precipitation followed
by high-throughput sequencing (ChIP-seq) in A673, and GSM1517568,
which was from A673 whole-cell extracts, were used for the
identification of EWS-FLI1 specific binding sites (peaks).
Gene expression profiles analysis
Raw gene expression profiles were normalized
according to the method described by Yang et al (22). Probesets were translated to gene
symbol through the gene microarray annotation file, and the
expression values for genes corresponding to multi-probesets were
summarized. The differentially expressed genes (DEGs) in
EWS-FLI1-knockdown and CPX-treated A673 cell lines were identified
using the linear models for microarray and RNA-sequencing data
(limma; http://www.bioconductor.org/packages/release/bioc/html/limma.html),
an open source R programming package using t-test for expression
values in EWS-FLI1 knockdown and control A673 cell lines, and using
the criteria of fold change >2 or <0.5, i.e. |log2FC|>1
and false discovery rate <0.05. Based on Heatplusbio conductor
package (https://www.bioconductor.org/packages/release/bioc/html/Heatplus.html),
we conducted two-way hierarchical clustering analysis of DEGs and
their expression profiles in all of the samples.
Functional enrichment analysis
To investigate the biological processes that may be
influenced by EWS-FLI1 or CPX in ES, gene ontology (GO) term
functional enrichment analysis was conducted for the DEGs
identified from EWS-FLI1-knockdown and CPX-treated A673 cell lines
through the Web Gestalt (23)
online database. In this study, only the biological processes that
satisfied the criteria of P<0.05 and hits count >5 were
obtained. For the interpretation of significantly enriched GO
terms, we submitted them to REVIGO online tool (24) with the default thresholds, i.e.
medium similarity (0.7) between GO terms.
Identification of EWS-FLI1 specific
binding sites
The present study identified EWS-FLI1-specific
binding sites, which were referred as peaks, through the analysis
of EWS-FLI1 ChIP-seq datasets. First, quality control was performed
for the raw datasets using Fast QC (http://www.bioinformatics.babraham.ac.uk/projects/fastqc),
and only those reads that contained >90% bases with a
satisfactory quality score >20 were retained. Second, the
remaining reads were mapped to the hg19 reference genome obtained
from the UCSC Genome Browser (http://genome.ucsc.edu/) using Bowtie version2 with
maximum mismatches of 2 (25).
Third, significantly enriched peaks were identified with the
Model-based Analysis of ChIP-seq (MACS; version2) (26), following the removal of duplicated
mappings with the default thresholds, including Q-value (FDR
adjusted P-value) <0.01. Finally, the peaks were annotated with
their corresponding genomic features using the ChIP seeker package
in R, in which the region spanning 3,000 bp downstream and upstream
of the transcription start site was considered to be the promoter
region (27). Binding profiles of
EWS-FLI1 in certain target genes were further visualized using
Integrative Genomics Viewer (IGV) (28).
Network analysis
Genes shared between DEGs of EWS-FLI1-knockdown and
CPX-treated A673 cell lines, which were referred as DECs, were
considered as common targets of EWS-FLI1 and CPX in ES. To obtain
more reliable results, DECs and genes that were specifically bound
by EWS-FLI1 in their promoters were intersected, and the overlaps
were considered as reliable EWS-FLI1 targets (EFTs) in A673 cells.
The potential interaction pairs among EFTs were obtained through
the STRING database (29) with the
minimum combined score >0.4. In addition, the predicted
regulatory relationships between EWS-FLI1 and the EFTs, and
interaction pairs among the EFTs were visualized with Cy to scape
software (30).
Results
Differential expression analysis
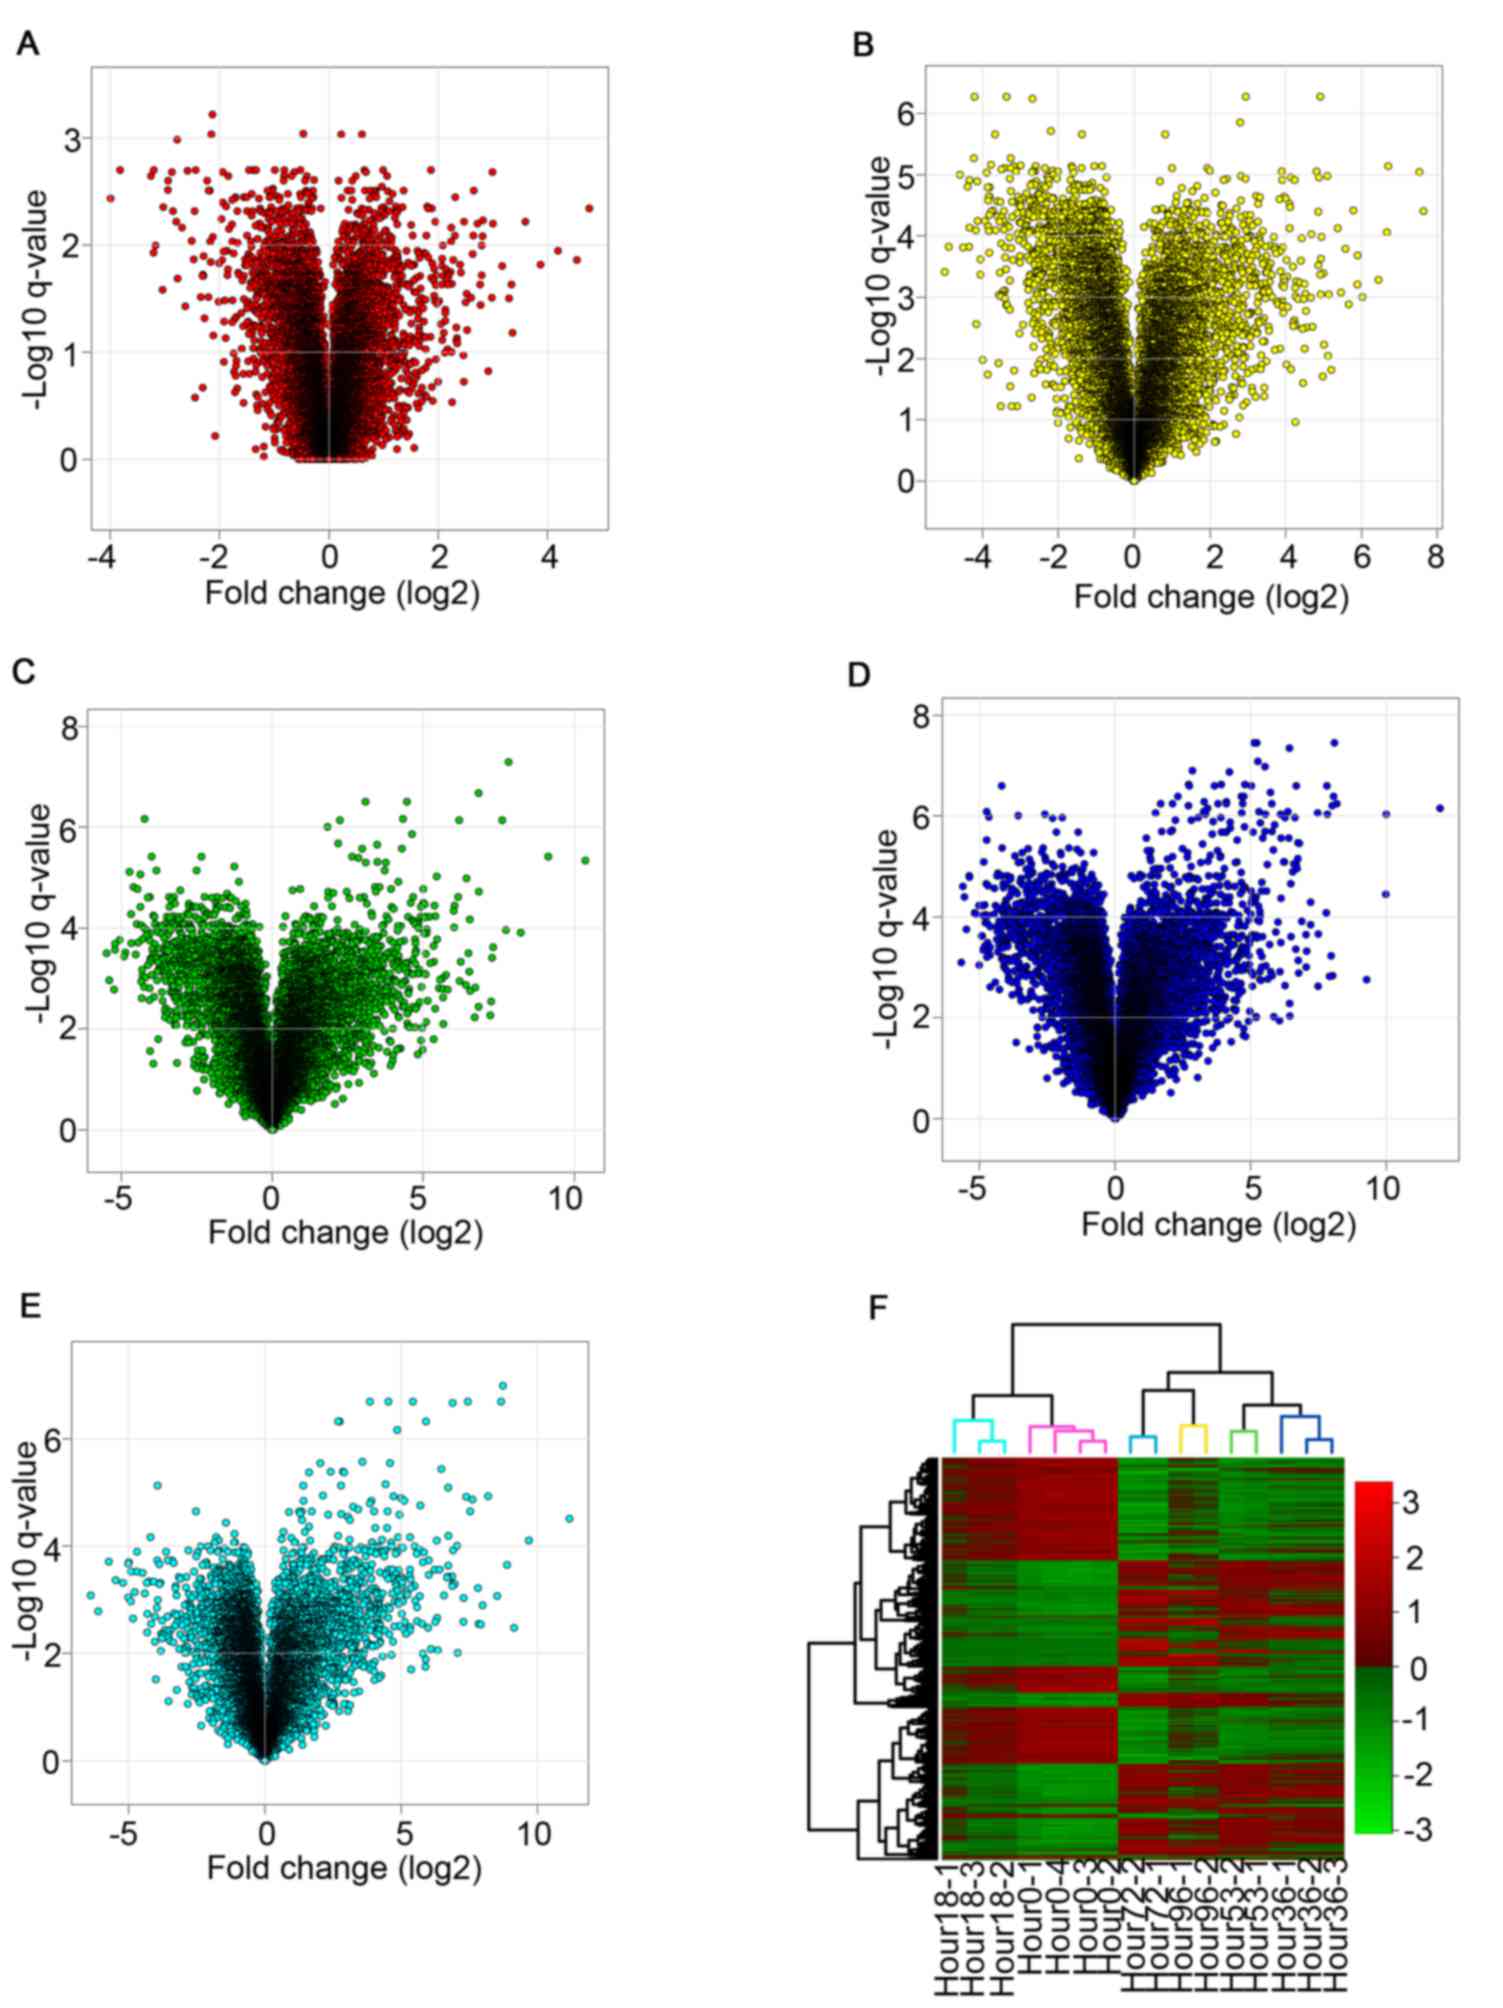
For the GSE27524EWS-FLI1-knockdown A673 cell lines,
5 lists of DEGs were identified for the 5 time points (18, 36, 53,
72 and 96 h) when they were compared with the 0 h cells following
EWS-FLI1 knockdown, and these were referred as DEG18, DEG36, DEG53,
DEG72 and DEG96, respectively. Volcano plots of the corresponding
fold change (log2 scale) against the transformed (-log10) Q-values
for every time point are illustrated in Fig. 1A-E. All volcano plots complied with
normal distribution with fold-change values ranging between-6.4 and
12.0 for both downregulated and upregulated genes. The volcano plot
changes as the length of time increases post-knockdown. The 18 h
plot appears similar to the 36 h plot, whereas the later time
points of 53, 72 and 96 h are more similar to each other,
particularly in the upregulated expression area (right side of
volcano plots). This observation was probably due to the knockdown
of EWS-FLI1 resulting in upregulated expression of tumor suppressor
genes. Unsupervised clustering based on the expression profiles of
the five lists of DEGs obtained consistent pattern with volcano
plots (Fig. 1F); two main clusters
are obtained: 0 and 18 h, 36, 53, 72 and 96 h. The two main
clusters were each further subdivided according to different time
points.
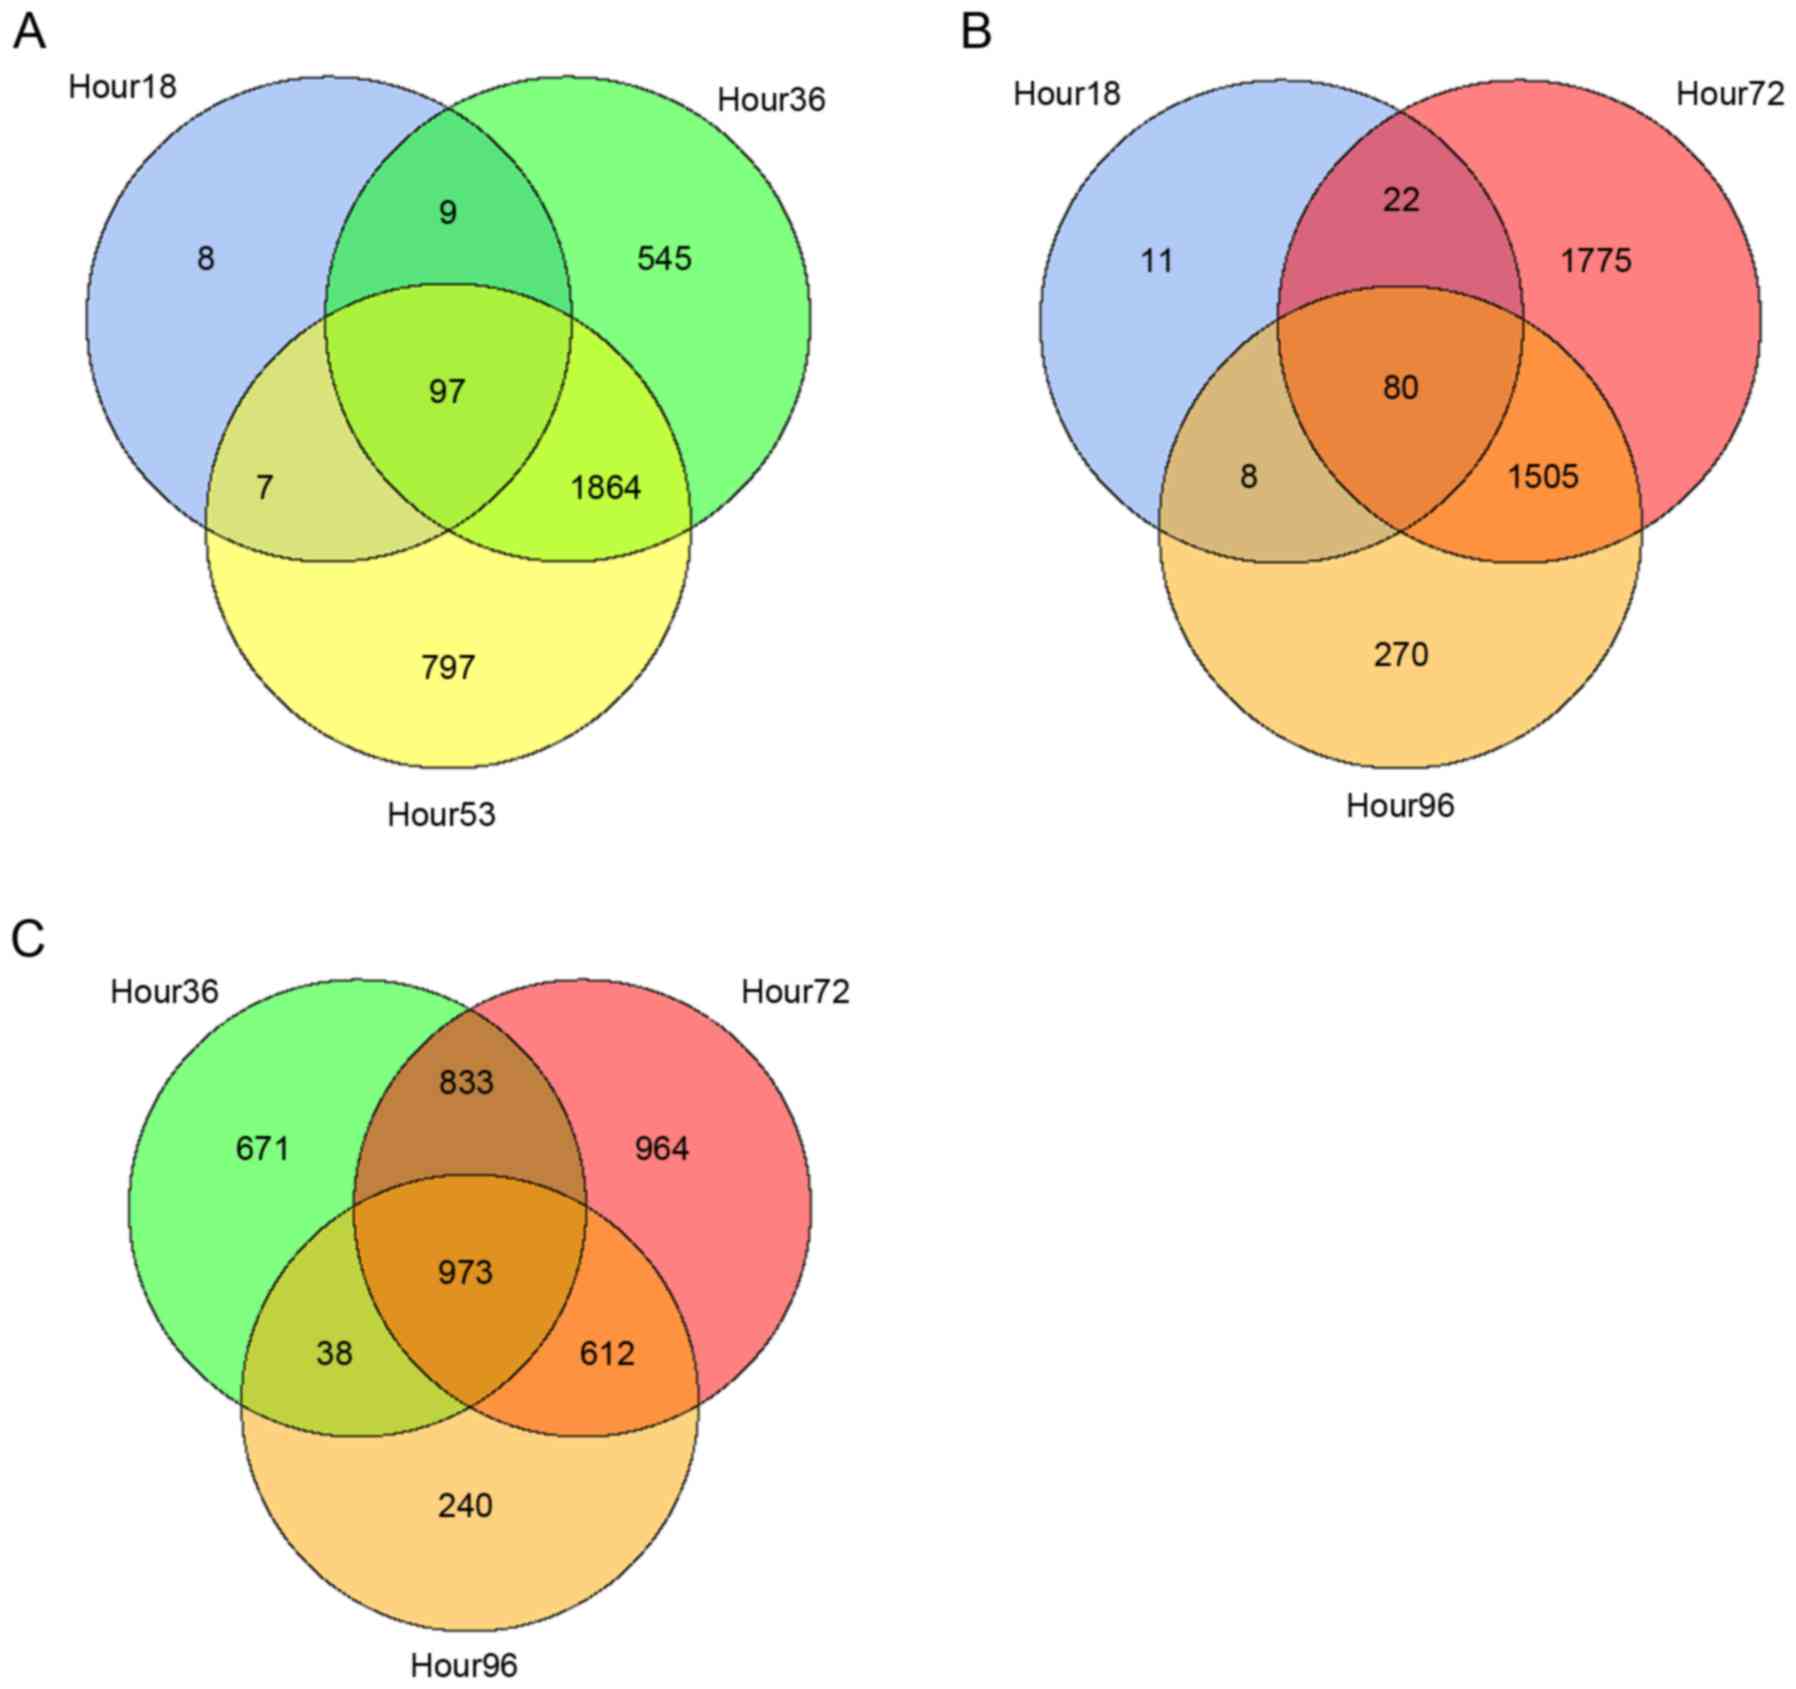
The relationships among different groups of DEGs
were also examined by creating Venn diagrams with overlapping
regions that represent the overlapping DEGs (Fig. 2). The gene contents were more
similar among the later time points, in which 973 overlapped genes
were identified among the 36, 72 and 96 h DEGs. For CPX-treated
A673 cell lines, a total of 466 DEGs (referred as DEG-CPX) were
obtained, which comprised 167 downregulated genes and 299
upregulated genes.
Enriched functions
The 5 lists of DEGs that were identified in the
EWS-FLI1-knockdown A673 cell lines were combined and the duplicates
were removed, which resulted in 4,500 unique DEGs. A total of 635
biological process (BP) GO terms with minimum hits >5 were
indicated to be significantly enriched in those genes. The 466
identified DEG-CPX DEGs were closely associated with 182 BP GO
terms. The GO terms present level information based on GO database
(http://amigo1.geneontology.org/cgi-bin/amigo/go.cgi)
where the root terms, biological process, molecular function and
cellular component, have level 1 and terms with higher level could
indicate more specific function. It is helpful to remove redundant
information for the interpretation of enriched functions. For this
purpose, the full lists of BP GO terms were submitted to REVIGO
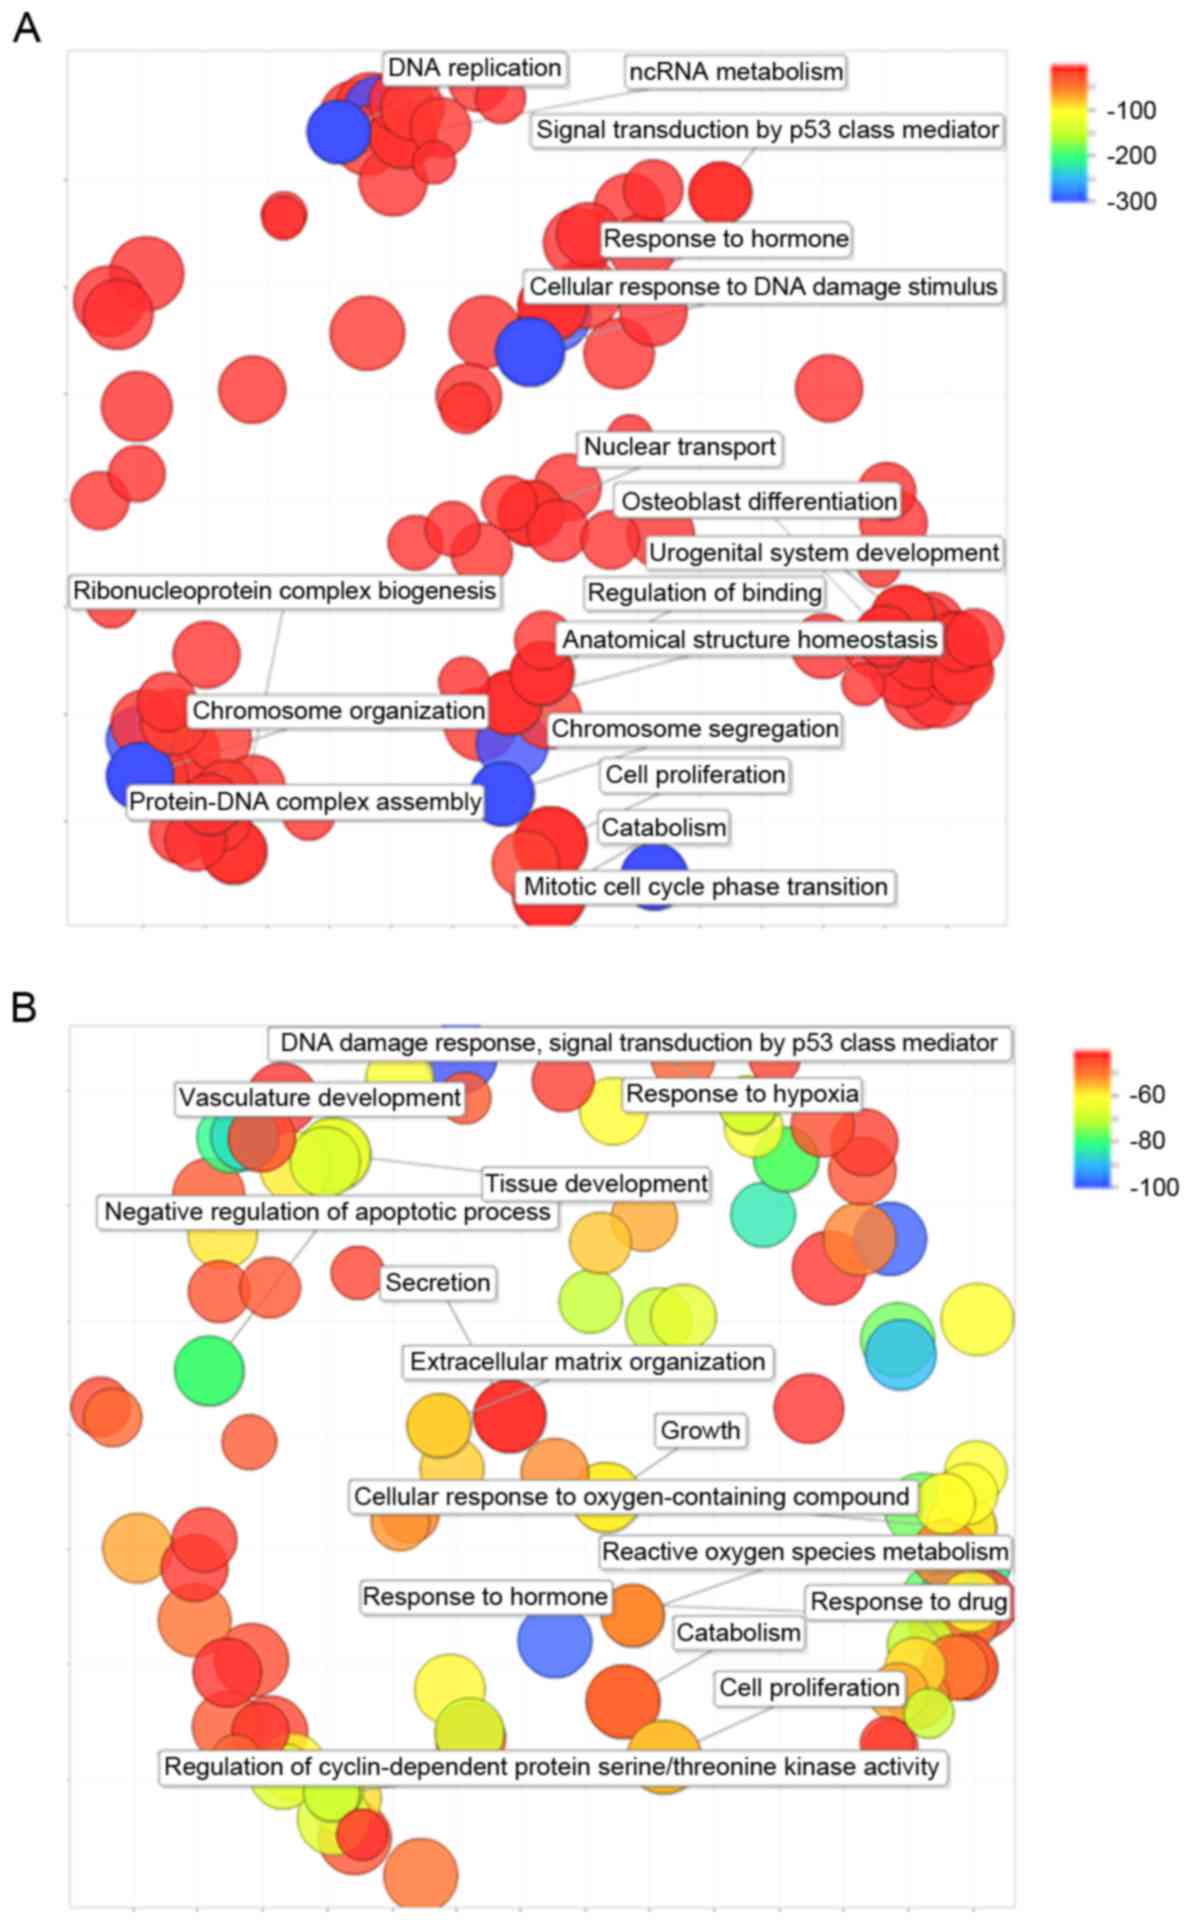
online tool to refine the enriched functions of DEGs. As a result,
the 4,500 EWS-FLI1-knockdown DEGs are revealed to be closely
associated with BPs that are related to cell activity, chromosome
structure and DNA replication (Fig.
3A). The 466 DEG-CPXDEGs are closely associated with
vasculature development, cell activity and response to drug
(Fig. 3B).
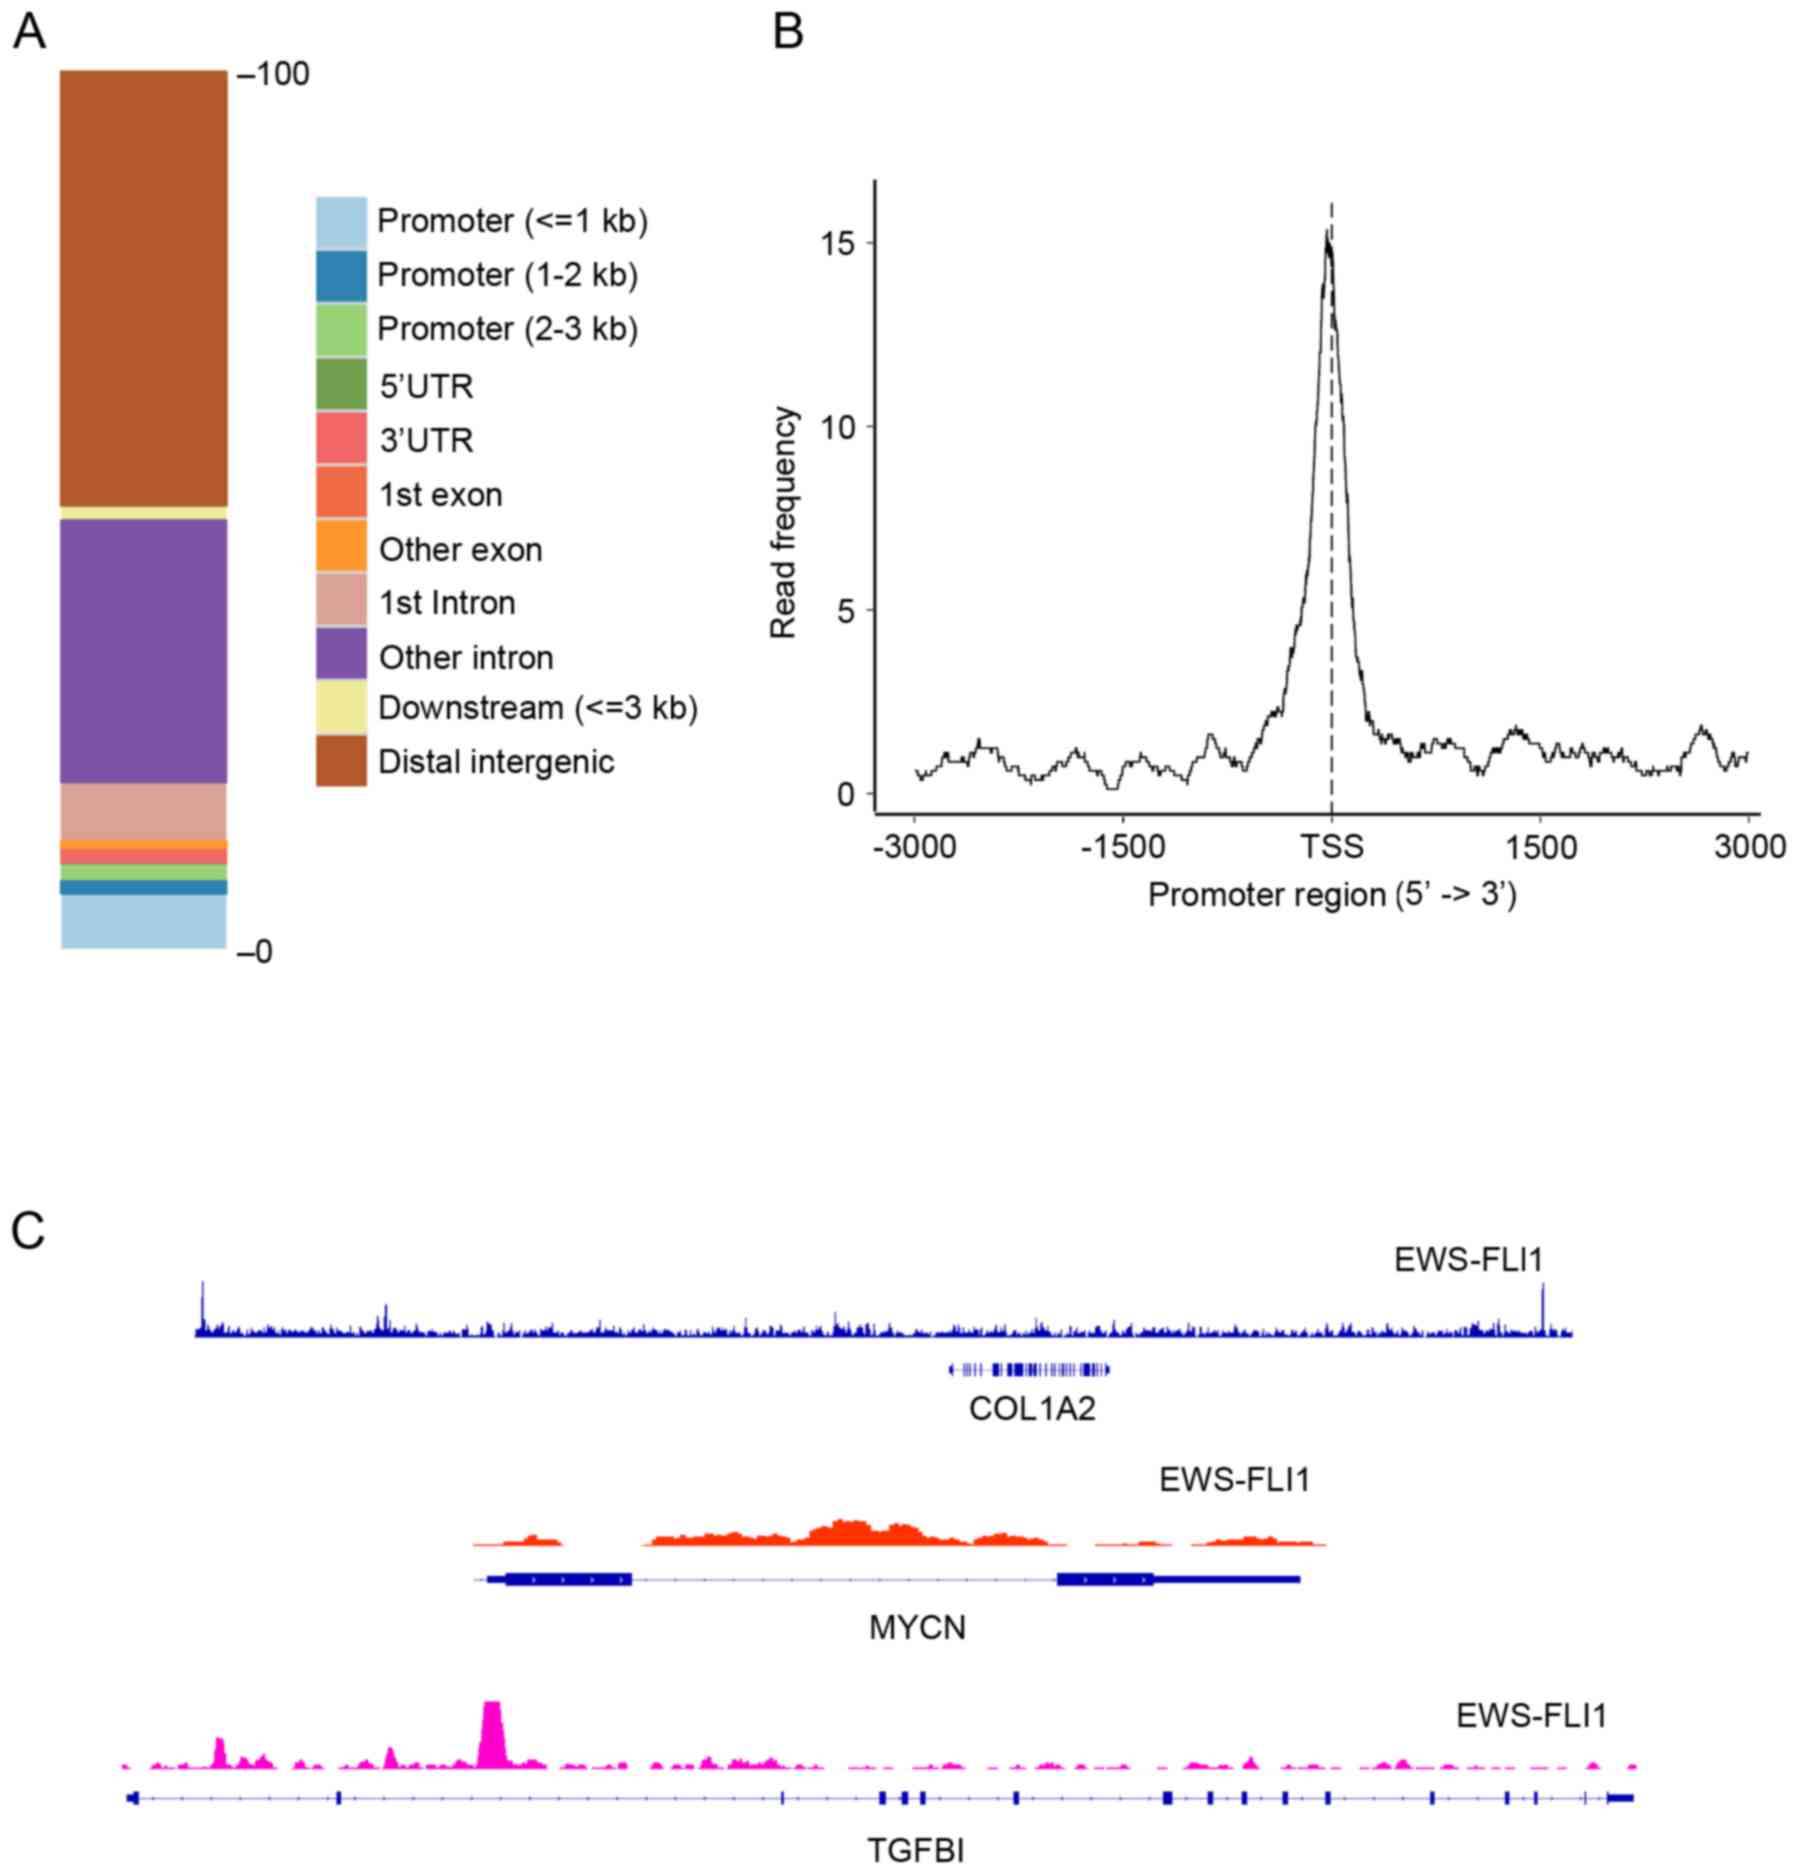
EWS-FLI1 specific binding sites
The present study used MACS version 2 to determine
the binding profiles of EWS-FLI1 in ES cell lines, in which
binomial distribution is used to testing enrichment significance of
the binding sites. ChIP-seq analysis identified 3,885 peaks for
EWS-FLI1, most of which mapped to the distal intergenic region
(Fig. 4A); however, the strongest
binding signals were detected in the promoter region (Fig. 4B), which indicated more reliable
targets of EWS-FLI1. DECs were intersected with genes that
contained EWS-FLI1 binding peaks in their promoters and 34
overlaps, that is EFTs. Table I
shows the CPX-induced fold change (log2 scale) of the 34 EFTs, of
which 8of them were revealed to be downregulated by CPX treatment.
To illustrate the binding profiles of EWS-FLI1 on the 34 EFTs, 3
targets were randomly selected, collagen type I α2 chain (COL1A2),
N-myc proto-oncogene and transforming growth factor β1 (TGFβ1), and
the EWS-FLI1 binding signals on them were visualized using the
Integrative Genomics Viewer (IGV). The results demonstrated that
certain parts of these three targets exhibited strong binding
signals in their promoter regions (Fig. 4C). For MYCN, a strong binding
signal was obtained across the whole gene body (Fig. 4C).
 | Table I.Ciclopirox-induced FC (log2 scale) of
the 34 identified Ewing sarcoma breakpoint region 1-Friend leukemia
integration 1 target genes. |
Table I.
Ciclopirox-induced FC (log2 scale) of
the 34 identified Ewing sarcoma breakpoint region 1-Friend leukemia
integration 1 target genes.
| Gene | FC (log2
scale) |
|---|
| GYG2 | −1.74 |
| ZNF423 | −1.74 |
| COL1A2 | −1.69 |
| MN1 | −1.30 |
| TRAF3IP2 | −1.23 |
| MAP2K5 | −1.10 |
| SLITRK5 | −1.03 |
| LMO3 | −1.02 |
| JMJD1C | 1.02 |
| DKK2 | 1.06 |
| TWIST1 | 1.06 |
| TLE4 | 1.07 |
| CLDN1 | 1.08 |
| MYCN | 1.09 |
| LYPD1 | 1.14 |
| TGFBI | 1.21 |
| SPRY2 | 1.23 |
| CTH | 1.24 |
| LAMB3 | 1.25 |
| DNAJC12 | 1.26 |
| MMP10 | 1.28 |
| PLOD2 | 1.28 |
| FN1 | 1.29 |
| TMEM45A | 1.42 |
| KLF6 | 1.44 |
| TSC22D3 | 1.56 |
| SLC2A3 | 1.58 |
| COL11A1 | 1.78 |
| NDRG1 | 1.93 |
| RFTN1 | 2.01 |
| ARC | 2.14 |
| TNFAIP3 | 2.22 |
| KLF5 | 2.42 |
| STC1 | 2.50 |
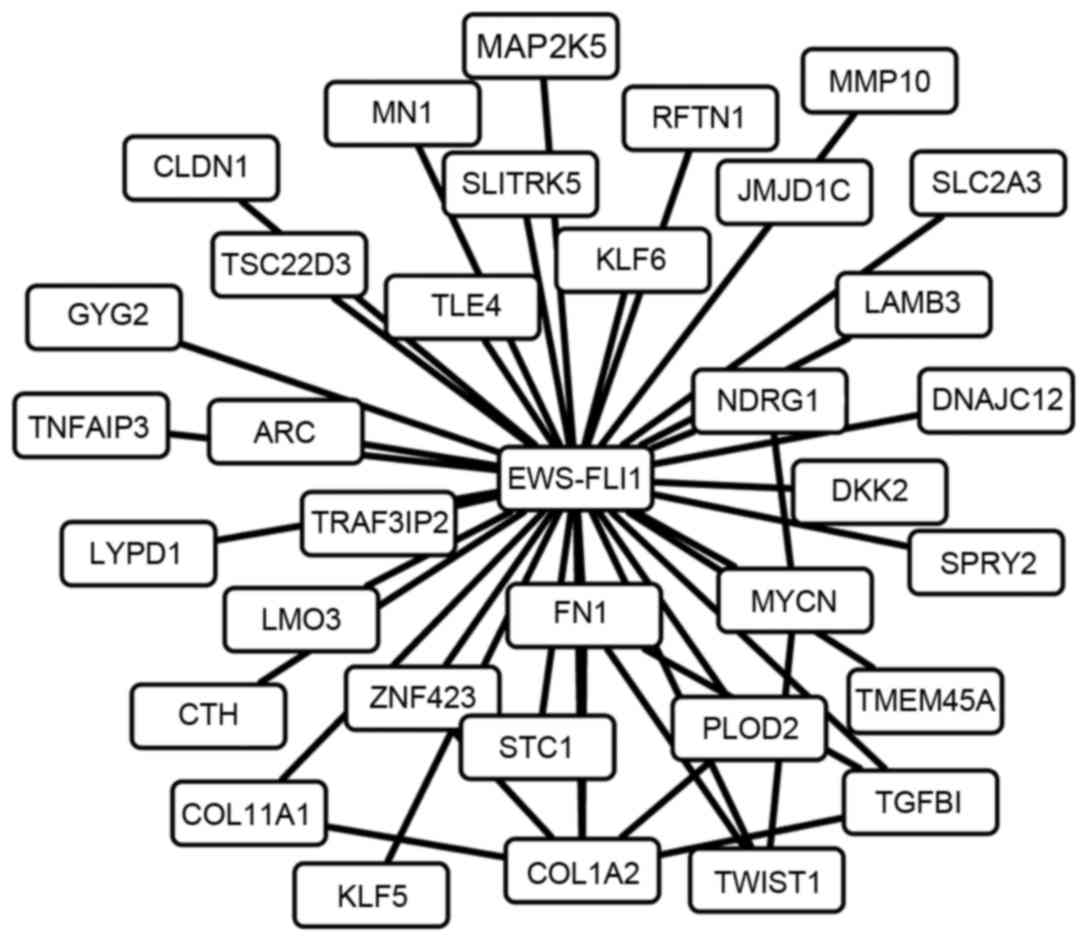
Network analysis
The 34 EFTs were considered as potential therapeutic
targets of CPX in ES and, as such, it was hypothesized that they
may interact with each other to promote or suppress the progression
of ES. A total of 10 interaction pairs were identified among the 34
EFTs, and a combined network of the 10 interaction pairs and the
regulatory relationships between EWS-FLI1 and the 34 EFTs was
created (Fig. 5).
Discussion
In 1973, Dittmar and Lohaus (31) first reported the antifungal
functions of CPX, and it has since been widely used to treat
fungal-induced skin and nail diseases (16,32,33).
In addition, a number of subsequent studies have also demonstrated
the antitumoral activity of CPX, particularly in hematologic
malignancies (17,34); however, only a few studies were
focused the activity of CPX on solid tumors (35,36).
The present study conducted combined analysis of gene expression
and genome binding profiles of CPX and EWS-FLI1 to screen potential
valuable therapeutic targets of CPX in ES. These results may be
helpful for the comprehensive understanding of the roles of CPX and
EWS-FLI1 in ES development.
EWS-FLI1 is a fusion transcript structure caused by
chromosome translocation of t(11;22) (q24;q12), which was
previously demonstrated to be closely associated with the
initiation and progression of ES (11,12,37,38).
In the present study, the combination of gene expression profiles
of CPX-treated and EWS-FLI1-knockdown ES A673 cell lines was used
to identify genes that were influenced by CPX treatment and
EWS-FLI1, that is, DECs. To make the results more reliable, the
potential binding targets of EWS-FLI1 in A673 cell lines were
identified through ChIP-seq analysis and these targets were
intersected with the DECs; the resulting overlaps, the EFTs, should
be CPX-targeted genes in ES through EWS-FLI1. Network analysis
identified COL1A2, TWIST1 and TGFβ1 as core nodes for they have
more direct neighborhoods. Consistent with the present study
results, these three genes were previously demonstrated to be
regulated by EWS-FLI1 and interacted with each other (39–42).
TGFβ1 promotes expression of COL1A2 and is involved in the
progression of several diseases, including lung fibrosis (43), skin fibrosis (44) and dermal fibrosis (45), and the inhibited expression of
TGFβ-type genes by EWS-FLI1 is an important cause of ES initiation
(46). Treatment with CPX also
resulted in the upregulation of TGFβ1, which indicated a putative
role of TGFβ1 in ES.
DEGs that were influenced by EWS-FLI1-knockdown were
closely associated with BPs related to cell activity and DNA
replication, which may affect the progression of numerous forms of
cancer. DEGs in the CPX-treated A673 cell lines were associated
with tissue development, particularly vascular development.
Vasculature is important for oxygen and nutrient transportation for
cancer cells (47–49). TWIST1 is one of the core genes in
the network and serves a role in embryonic vascular development and
tumor metastasis, and it is a direct target of hypoxia-inducible
factor-2α (HIF2α) (50,51). HIF2α is closely associated with
oxygen metabolism in cancer, which is associated with cancer
progression (52,53). In the present study, TWIST1 is a
core gene of the network and it was previously reported to be a
direct target of HIF2α, so it may be important for the progression
of ES. Therefore, CPX may influence the progression of ES by
controlling the process of vascular development. In this study,
MYCN was identified to be a target of EWS-FLI1 with significantly
enriched peaks across the gene body. MYCN is a member of the MYC
family and encodes a protein with a basic helix-loop-helix (bHLH)
domain. The amplification of MYCN is closely associated with a
number of cancer types, including ES (54). The present study demonstrated that
CPX could affect progression of ES by regulating the binding of
EWS-FLI1 in MYCN for the enrichment of EWS-FLI1 binding sites in
MYCN in CPX-treated A673 cell line.
In conclusion, the present study performed systemic
analysis of gene expression and genome binding profiles in ES A673
cell lines. The results may shed light on the influence of EWS-FLI1
on ES development and progression, and may provide a novel
therapeutic method, such as CPX-target therapy, which may aid in
improving the prognosis of patients with ES.
References
|
1
|
Grier HE: The Ewing family of tumors.
Ewing's sarcoma and primitive neuroectodermal tumors. Pediatr Clin
North Am. 44:991–1004. 1997. View Article : Google Scholar : PubMed/NCBI
|
|
2
|
Esiashvili N, Goodman M and Marcus RB Jr:
Changes in incidence and survival of Ewing sarcoma patients over
the past 3 decades: Surveillance epidemiology and end results data.
J Pediatr Hematol Oncol. 30:425–430. 2008. View Article : Google Scholar : PubMed/NCBI
|
|
3
|
Rosen G, Wollner N, Tan C, Wu SJ, Hajdu
SI, Cham W, D'Angio GJ and Murphy ML: Proceedings: Disease-free
survival in children with Ewing's sarcoma treated with radiation
therapy and adjuvant four-drug sequential chemotherapy. Cancer.
33:384–393. 1974. View Article : Google Scholar : PubMed/NCBI
|
|
4
|
Ng VY, Jones R, Bompadre V, Louie P, Punt
S and Conrad EU III: The effect of surgery with radiation on pelvic
Ewing sarcoma survival. J Surg Oncol. 112:861–865. 2015. View Article : Google Scholar : PubMed/NCBI
|
|
5
|
Brohl AS, Solomon DA, Chang W, Wang J,
Song Y, Sindiri S, Patidar R, Hurd L, Chen L, Shern JF, et al: The
genomic landscape of the Ewing Sarcoma family of tumors reveals
recurrent STAG2 mutation. PLoS Genet. 10:e10044752014. View Article : Google Scholar : PubMed/NCBI
|
|
6
|
May WA, Arvand A, Thompson AD, Braun BS,
Wright M and Denny CT: EWS/FLI1-induced manic fringe renders NIH
3T3 cells tumorigenic. Nat Genet. 17:495–497. 1997. View Article : Google Scholar : PubMed/NCBI
|
|
7
|
Delattre O, Zucman J, Plougastel B,
Desmaze C, Melot T, Peter M, Kovar H, Joubert I, de Jong P, Rouleau
G, et al: Gene fusion with an ETS DNA-binding domain caused by
chromosome translocation in human tumours. Nature. 359:162–165.
1992. View
Article : Google Scholar : PubMed/NCBI
|
|
8
|
Tanaka K, Iwakuma T, Harimaya K, Sato H
and Iwamoto Y: EWS-Fli1 antisense oligodeoxynucleotide inhibits
proliferation of human Ewing's sarcoma and primitive
neuroectodermal tumor cells. J Clin Invest. 99:239–247. 1997.
View Article : Google Scholar : PubMed/NCBI
|
|
9
|
de Alava E, Kawai A, Healey JH, Fligman I,
Meyers PA, Huvos AG, Gerald WL, Jhanwar SC, Argani P, Antonescu CR,
et al: EWS-FLI1 fusion transcript structure is an independent
determinant of prognosis in Ewing's sarcoma. J Clin Oncol.
16:1248–1255. 1998. View Article : Google Scholar : PubMed/NCBI
|
|
10
|
Riggi N, Knoechel B, Gillespie SM,
Rheinbay E, Boulay G, Suvà ML, Rossetti NE, Boonseng WE, Oksuz O,
Cook EB, et al: EWS-FLI1 utilizes divergent chromatin remodeling
mechanisms to directly activate or repress enhancer elements in
Ewing sarcoma. Cancer Cell. 26:668–681. 2014. View Article : Google Scholar : PubMed/NCBI
|
|
11
|
Tang SW, Bilke S, Cao L, Murai J, Sousa
FG, Yamade M, Rajapakse V, Varma S, Helman LJ, Khan J, et al:
SLFN11 Is a transcriptional target of EWS-FLI1 and a determinant of
drug response in Ewing sarcoma. Clin Cancer Res. 21:4184–4193.
2015. View Article : Google Scholar : PubMed/NCBI
|
|
12
|
He T, Surdez D, Rantala JK, Haapa-Paananen
S, Ban J, Kauer M, Tomazou E, Fey V, Alonso J, Kovar H, et al:
High-throughput RNAi screen in Ewing sarcoma cells identifies
leucine rich repeats and WD repeat domain containing 1 (LRWD1) as a
regulator of EWS-FLI1 driven cell viability. Gene. 596:137–146.
2017. View Article : Google Scholar : PubMed/NCBI
|
|
13
|
Niedan S, Kauer M, Aryee DN, Kofler R,
Schwentner R, Meier A, Pötschger U, Kontny U and Kovar H:
Suppression of FOXO1 is responsible for a growth regulatory
repressive transcriptional sub-signature of EWS-FLI1 in Ewing
sarcoma. Oncogene. 33:3927–3938. 2014. View Article : Google Scholar : PubMed/NCBI
|
|
14
|
Tancredi R, Zambelli A, DaPrada GA,
Fregoni V, Pavesi L, Riccardi A, Burdach S, Grohar PJ and D'Incalci
M: Targeting the EWS-FLI1 transcription factor in Ewing sarcoma.
Cancer Chemother Pharmacol. 75:1317–1320. 2015. View Article : Google Scholar : PubMed/NCBI
|
|
15
|
Gupta AK, Fleckman P and Baran R:
Ciclopirox nail lacquer topical solution 8% in the treatment of
toenail onychomycosis. J Am Acad Dermatol. 43 4 Suppl:S70–S80.
2000. View Article : Google Scholar : PubMed/NCBI
|
|
16
|
Bohn M and Kraemer KT: Dermatopharmacology
of ciclopirox nail lacquer topical solution 8% in the treatment of
onychomycosis. J Am Acad Dermatol. 43 4 Suppl:S57–S69. 2000.
View Article : Google Scholar : PubMed/NCBI
|
|
17
|
Clement PM, Hanauske-Abel HM, Wolff EC,
Kleinman HK and Park MH: The antifungal drug ciclopirox inhibits
deoxyhypusine and proline hydroxylation, endothelial cell growth
and angiogenesis in vitro. Int J Cancer. 100:491–498. 2002.
View Article : Google Scholar : PubMed/NCBI
|
|
18
|
Zhou H, Shen T, Luo Y, Liu L, Chen W, Xu
B, Han X, Pang J, Rivera CA and Huang S: The antitumor activity of
the fungicide ciclopirox. Int J Cancer. 127:2467–2477. 2010.
View Article : Google Scholar : PubMed/NCBI
|
|
19
|
Sen S, Hassane DC, Corbett C, Becker MW,
Jordan CT and Guzman ML: Novel mTOR inhibitory activity of
ciclopirox enhances parthenolide antileukemia activity. Exp
Hematol. 41:799–807.e4. 2013. View Article : Google Scholar : PubMed/NCBI
|
|
20
|
Bilke S, Schwentner R, Yang F, Kauer M,
Jug G, Walker RL, Davis S, Zhu YJ, Pineda M, Meltzer PS and Kovar
H: Oncogenic ETS fusions deregulate E2F3 target genes in Ewing
sarcoma and prostate cancer. Genome Res. 23:1797–1809. 2013.
View Article : Google Scholar : PubMed/NCBI
|
|
21
|
Goss KL and Gordon DJ: Gene expression
signature based screening identifies ribonucleotide reductase as a
candidate therapeutic target in Ewing sarcoma. Oncotarget.
7:63003–63019. 2016. View Article : Google Scholar : PubMed/NCBI
|
|
22
|
Yang YH, Dudoit S, Luu P, Lin DM, Peng V,
Ngai J and Speed TP: Normalization for cDNA microarray data: A
robust composite method addressing single and multiple slide
systematic variation. Nucleic Acids Res. 30:e152002. View Article : Google Scholar : PubMed/NCBI
|
|
23
|
Wang J, Vasaikar S, Shi Z, Greer M and
Zhang B: WebGestalt 2017: A more comprehensive, powerful, flexible
and interactive gene set enrichment analysis toolkit. Nucleic Acids
Res. May 3–2017. View Article : Google Scholar
|
|
24
|
Supek F, Bošnjak M, Škunca N and Šmuc T:
REVIGO summarizes and visualizes long lists of gene ontology terms.
PLoS One. 6:e218002011. View Article : Google Scholar : PubMed/NCBI
|
|
25
|
Langmead B and Salzberg SL: Fast
gapped-read alignment with Bowtie 2. Nat Methods. 9:357–359. 2012.
View Article : Google Scholar : PubMed/NCBI
|
|
26
|
Feng J, Liu T, Qin B, Zhang Y and Liu XS:
Identifying ChIP-seq enrichment using MACS. Nat Protoc.
7:1728–1740. 2012. View Article : Google Scholar : PubMed/NCBI
|
|
27
|
Yu G, Wang LG and He QY: ChIPseeker: An
R/Bioconductor package for ChIP peak annotation, comparison and
visualization. Bioinformatics. 31:2382–2383. 2015. View Article : Google Scholar : PubMed/NCBI
|
|
28
|
Thorvaldsdóttir H, Robinson JT and Mesirov
JP: Integrative genomics viewer (IGV): High-performance genomics
data visualization and exploration. Brief Bioinform. 14:178–192.
2013. View Article : Google Scholar : PubMed/NCBI
|
|
29
|
Szklarczyk D, Morris JH, Cook H, Kuhn M,
Wyder S, Simonovic M, Santos A, Doncheva NT, Roth A, Bork P, et al:
The STRING database in 2017: Quality-controlled protein-protein
association networks, made broadly accessible. Nucleic Acids Res.
45:D362–D368. 2017. View Article : Google Scholar : PubMed/NCBI
|
|
30
|
Shannon P, Markiel A, Ozier O, Baliga NS,
Wang JT, Ramage D, Amin N, Schwikowski B and Ideker T: Cytoscape: A
software environment for integrated models of biomolecular
interaction networks. Genome Res. 13:2498–2504. 2003. View Article : Google Scholar : PubMed/NCBI
|
|
31
|
Dittmar W and Lohaus G: HOE 296, a new
antimycotic compound with a broad antimicrobial spectrum.
Laboratory results. Arzneimittelforschung. 23:670–674.
1973.PubMed/NCBI
|
|
32
|
Ceschin-Roques CG, Hänel H, Pruja-Bougaret
SM, Luc J, Vandermander J and Michel G: Ciclopirox nail lacquer 8%:
In vivo penetration into and through nails and in vitro effect on
pig skin. Skin Pharmacol. 4:89–94. 1991. View Article : Google Scholar : PubMed/NCBI
|
|
33
|
Gupta AK: Ciclopirox: An overview. Int J
Dermatol. 40:305–310. 2001. View Article : Google Scholar : PubMed/NCBI
|
|
34
|
Minden MD, Hogge DE, Weir SJ, Kasper J,
Webster DA, Patton L, Jitkova Y, Hurren R, Gronda M, Goard CA, et
al: Oral ciclopirox olamine displays biological activity in a phase
I study in patients with advanced hematologic malignancies. Am J
Hematol. 89:363–368. 2014. View Article : Google Scholar : PubMed/NCBI
|
|
35
|
Zhou HY, Shen T, Luo Y, Liu L, Chen W, Xu
B, Han X, Pang J, Rivera CA and Huang S: The antitumor activity of
the fungicide ciclopirox. Int J Cancer. 10:2467–2477. 2010.
View Article : Google Scholar
|
|
36
|
Eberhard Y, McDermott SP, Wang X, Gronda
M, Venugopal A, Wood TE, Hurren R, Datti A, Batey RA, Wrana J, et
al: Chelation of intracellular iron with the antifungal agent
ciclopirox olamine induces cell death in leukemia and myeloma
cells. Blood. 114:3064–3073. 2009. View Article : Google Scholar : PubMed/NCBI
|
|
37
|
Grohar PJ, Segars LE, Yeung C, Pommier Y,
D'Incalci M, Mendoza A and Helman LJ: Dual targeting of EWS-FLI1
activity and the associated DNA damage response with trabectedin
and SN38 synergistically inhibits Ewing sarcoma cell growth. Clin
Cancer Res. 20:1190–1203. 2014. View Article : Google Scholar : PubMed/NCBI
|
|
38
|
Grohar PJ, Kim S, Rangel Rivera GO, Sen N,
Haddock S, Harlow ML, Maloney NK, Zhu J, O'Neill M, Jones TL, et
al: Functional genomic screening reveals splicing of the EWS-FLI1
fusion transcript as a vulnerability in Ewing Sarcoma. Cell Rep.
14:598–610. 2016. View Article : Google Scholar : PubMed/NCBI
|
|
39
|
Minas TZ, Surdez D, Javaheri T, Tanaka M,
Howarth M, Kang HJ, Han J, Han ZY, Sax B, Kream BE, et al: Combined
experience of six independent laboratories attempting to create an
Ewing sarcoma mouse model. Oncotarget. 8:34141–34163. 2016.
|
|
40
|
Asano Y, Markiewicz M, Kubo M, Szalai G,
Watson DK and Trojanowska M: Transcription factor Fli1 regulates
collagen fibrillogenesis in mouse skin. Mol Cell Biol. 29:425–434.
2009. View Article : Google Scholar : PubMed/NCBI
|
|
41
|
Tsai YP and Wu KJ: Hypoxia-regulated
target genes implicated in tumor metastasis. J Biomed Sci.
19:1022012. View Article : Google Scholar : PubMed/NCBI
|
|
42
|
Elzi DJ, Song M, Hakala K, Weintraub ST
and Shiio Y: Proteomic analysis of the EWS-Fli-1 interactome
reveals the role of the Lysosome in EWS-Fli-1 turnover. J Proteome
Res. 13:3783–3791. 2014. View Article : Google Scholar : PubMed/NCBI
|
|
43
|
Cutroneo KR, White SL, Phan SH and Ehrlich
HP: Therapies for bleomycin induced lung fibrosis through
regulation of TGF-beta1 induced collagen gene expression. J Cell
Physiol. 211:585–589. 2007. View Article : Google Scholar : PubMed/NCBI
|
|
44
|
Chen SJ, Yuan W, Mori Y, Levenson A,
Trojanowska M and Varga J: Stimulation of type I collagen
transcription in human skin fibroblasts by TGF-beta: Involvement of
Smad 3. J Invest Dermatol. 112:49–57. 1999. View Article : Google Scholar : PubMed/NCBI
|
|
45
|
Verrecchia F, Chu ML and Mauviel A:
Identification of novel TGF-β/Smad gene targets in dermal
fibroblasts using a combined cDNA microarray/promoter
transactivation approach. J Biol Chem. 276:17058–17062. 2001.
View Article : Google Scholar : PubMed/NCBI
|
|
46
|
Hahm KB: Repression of the gene encoding
the TGF-beta type II receptor is a major target of the EWS-FLI1
oncoprotein. Nat Genet. 23:4811999. View
Article : Google Scholar : PubMed/NCBI
|
|
47
|
Semenza GL: Hypoxia-inducible factor 1:
Oxygen homeostasis and disease pathophysiology. Trends Mol Med.
7:345–350. 2001. View Article : Google Scholar : PubMed/NCBI
|
|
48
|
Liu LZ, Hu XW, Xia C, He J, Zhou Q, Shi X,
Fang J and Jiang BH: Reactive oxygen species regulate epidermal
growth factor-induced vascular endothelial growth factor and
hypoxia-inducible factor-1 alpha expression through activation of
AKT and P70S6K1 in human ovarian cancer cells. Free Radic Biol Med.
41:1521–1533. 2006. View Article : Google Scholar : PubMed/NCBI
|
|
49
|
Simon MC and Keith B: The role of oxygen
availability in embryonic development and stem cell function. Nat
Rev Mol Cell Biol. 9:285–296. 2008. View Article : Google Scholar : PubMed/NCBI
|
|
50
|
Low-Marchelli JM, Ardi VC, Vizcarra EA,
van Rooijen N, Quigley JP and Yang J: Twist1 induces CCL2 and
recruits macrophages to promote angiogenesis. Cancer Res.
73:662–671. 2013. View Article : Google Scholar : PubMed/NCBI
|
|
51
|
Gort EH, van Haaften G, Verlaan I, Groot
AJ, Plasterk RH, Shvarts A, Suijkerbuijk KP, van Laar T, van der
Wall E, Raman V, et al: The TWIST1 oncogene is a direct target of
hypoxia-inducible factor-2alpha. Oncogene. 27:1501–1510. 2008.
View Article : Google Scholar : PubMed/NCBI
|
|
52
|
Dehne N and Brüne B: Sensors,
transmitters, and targets in mitochondrial oxygen shortage-a
hypoxia-inducible factor relay story. Antioxidants Redox Signal.
20:339–352. 2014. View Article : Google Scholar
|
|
53
|
Zhdanov AV, Waters AH, Golubeva AV and
Papkovsky DB: Differential contribution of key metabolic substrates
and cellular oxygen in HIF signalling. Exp Cell Res. 330:13–28.
2015. View Article : Google Scholar : PubMed/NCBI
|
|
54
|
Somers GR, Zielenska M, Abdullah S,
Sherman C, Chan S and Thorner PS: Expression of MYCN in pediatric
synovial sarcoma. Modern Pathol. 20:734–741. 2007. View Article : Google Scholar
|