Introduction
Huntington's disease (HD) is a fatal
neurodegenerative disease characterized by choreiform movements,
personality changes, and dementia. HD is caused by a CAG
trinucleotide expansion in exon 1 of the huntingtin gene (HTT)
(1). Degenerative changes and cell
death occur in extensive brain regions and outside the central
nervous system (CNS), particularly involving the striatum; HD
currently lacks effective treatment (2). As a consequence, HD results in
cognitive and motor dysfunctions, involving speech, thought,
psychiatric problems and involuntary muscle movements (3).
Over the years, studies on various pathological
mechanisms including endoplasmic reticulum stress, oxidative
stress, axonal transport, autophagy, excitotoxicity, mitochondrial
function, the ubiquitin proteasome system (4), transcriptional deregulation and
apoptosis have been implicated in HD (5). Among these, various molecular and
cellular dysfunctions were shown to originate from mutant HTT
(mHTT); transcriptional dysregulation is considered to be one of
the most important events (6).
Transcription factors (TFs) including CBP (7), p53 (8), Sp1 (9), NFkB, and TBP are recruited to
aggregates formed by mHTT (10).
Furthermore, HTT and mHTT are expressed in multiple tissues and can
alter the transcription of miRNAs, such as miRNA-214, −150, −146a,
and −137, which have been shown to target the HTT gene (11).
Gene expression profile analysis is a fast,
high-throughput method for detecting mRNA expression in tissues or
cells. By comparing the different gene expression between HD models
and healthy controls, a better understanding of the pathogenesis of
HD can be acquired, facilitating the identification of potential
target genes for therapy. Recent studies have suggested that
bioinformatics mining and network analysis play an important role
in studying and predicting the etiology in various
neurodegenerative diseases, including HD (12–14).
The present study used the data from Sadri-Vakili
et al (15) and the DEGs
between STHdh111/111 and STHdh7/7 were identified. Possible
functions were predicted using enrichment analysis; protein-protein
interaction (PPI) networks were visualized and module analysis was
conducted to screen for key genes in STHdh111/111. In addition, we
predicted a new regulatory pathway involving miRNAs, TFs, and their
target genes. We aimed to explore the pathogenesis of HD using a
computational bioinformatics analysis of gene expression.
Materials and methods
Affymetrix microarray data
Derivation of genetic data gene expression profile
(GSE11358) was downloaded from a national center for biotechnology
information GEO (http://www.ncbi.nlm.nih.gov/geo/) database.
Experiments were designed to compare the changes of mRNA expression
between wild and mutant HD mouse models by histone
acetyltransferase inhibitor intervention. Four STHdh cell lines
were used, expressing full-length versions of mutant 111 glutamines
(STHdh111/111), along with four wild-type cell lines containing
seven glutamines (STHdh7/7). The base data was built on the
platform of GPL1261 and analyzed based on the affymetrix mouse
genome 430 2.0 array. In this study, GSE11358 was downloaded from a
public database; therefore, patient consent ethics committee
approval was not required.
Data pre-processing and analysis of
DEGs
Original data was first converted into identifiable
expression forms; the limma package (linear models for microarray
data) in R language was used to identify DEGs between STHdh111/111
and STHdh7/7 (16). P-values of
the DEGs were calculated separately and adjusted using the t-test
method, and testing correction was performed using a
Benjamini-Hochberg false discovery rate (HB FDR) (17), DEGs with FDR<0.05 and |log fold
change (FC)|>2 were used as thresholds.
Functional and pathway enrichment
analysis
DAVID (database for annotation visualization and
integrated discovery) online analysis tools constitute a
comprehensive biological information database. The system can mine
biological functions of a large number of genes and protein ID, and
play a key role in further gene biological information extraction.
Its website is http://david.abcc.ncifcrf.gov (18). Gene ontology database (GO;
www.geneontology.org) depicts basic
characteristics of genes and gene products (19). The Kyoto encyclopedia of genes and
genomes (KEGG; www.genome.jp/kegg/) (20) pathway enrichment analysis was
performed for identified DEGs using DAVID. Enriched terms with more
than two genes and P values <0.01 were considered to be
statistically significant.
Construction of a PPI network and
analysis
The search tool for the retrieval of interacting
genes (STRING http:/string.embl.de/) is an online
database that has been designed as a comprehensive perspective to
evaluate interaction information of proteins (21). In the present study, STRING was
used to obtain a protein-protein interaction (PPI) network of DEGs,
and subsequently visualized using Cytoscape (22). A confidence score of 0.4 was
selected as the cut-off criterion. Molecular complex detection
(MCODE) was then performed to screen modules of the PPI network
with a degree cut-off=2, node score cut-off=0.2, k-core=2, and max,
depth=100 (23). The functional
enrichment analysis of genes was performed by DAVID in each
module.
MicroRNAs prediction and transcription
factor analysis
Biological targets of miRNAs were predicted by using
TargetScan, which is one of the most commonly used bioinformatics
target prediction tools (24). In
the present study, we chose the threshold of a region of 8mer
seeds, which were completely matched for miRNA prediction. The
TRANSFAC database is one of the most commonly used platform for the
description and analysis of gene regulatory events and networks. It
provides information about eukaryotic TFs, DNA-binding sites and
DNA-binding profiles (25). In
this study, we selected the TRANSFAC database for the description
and prediction of TFs.
Results
Identification of DEGs
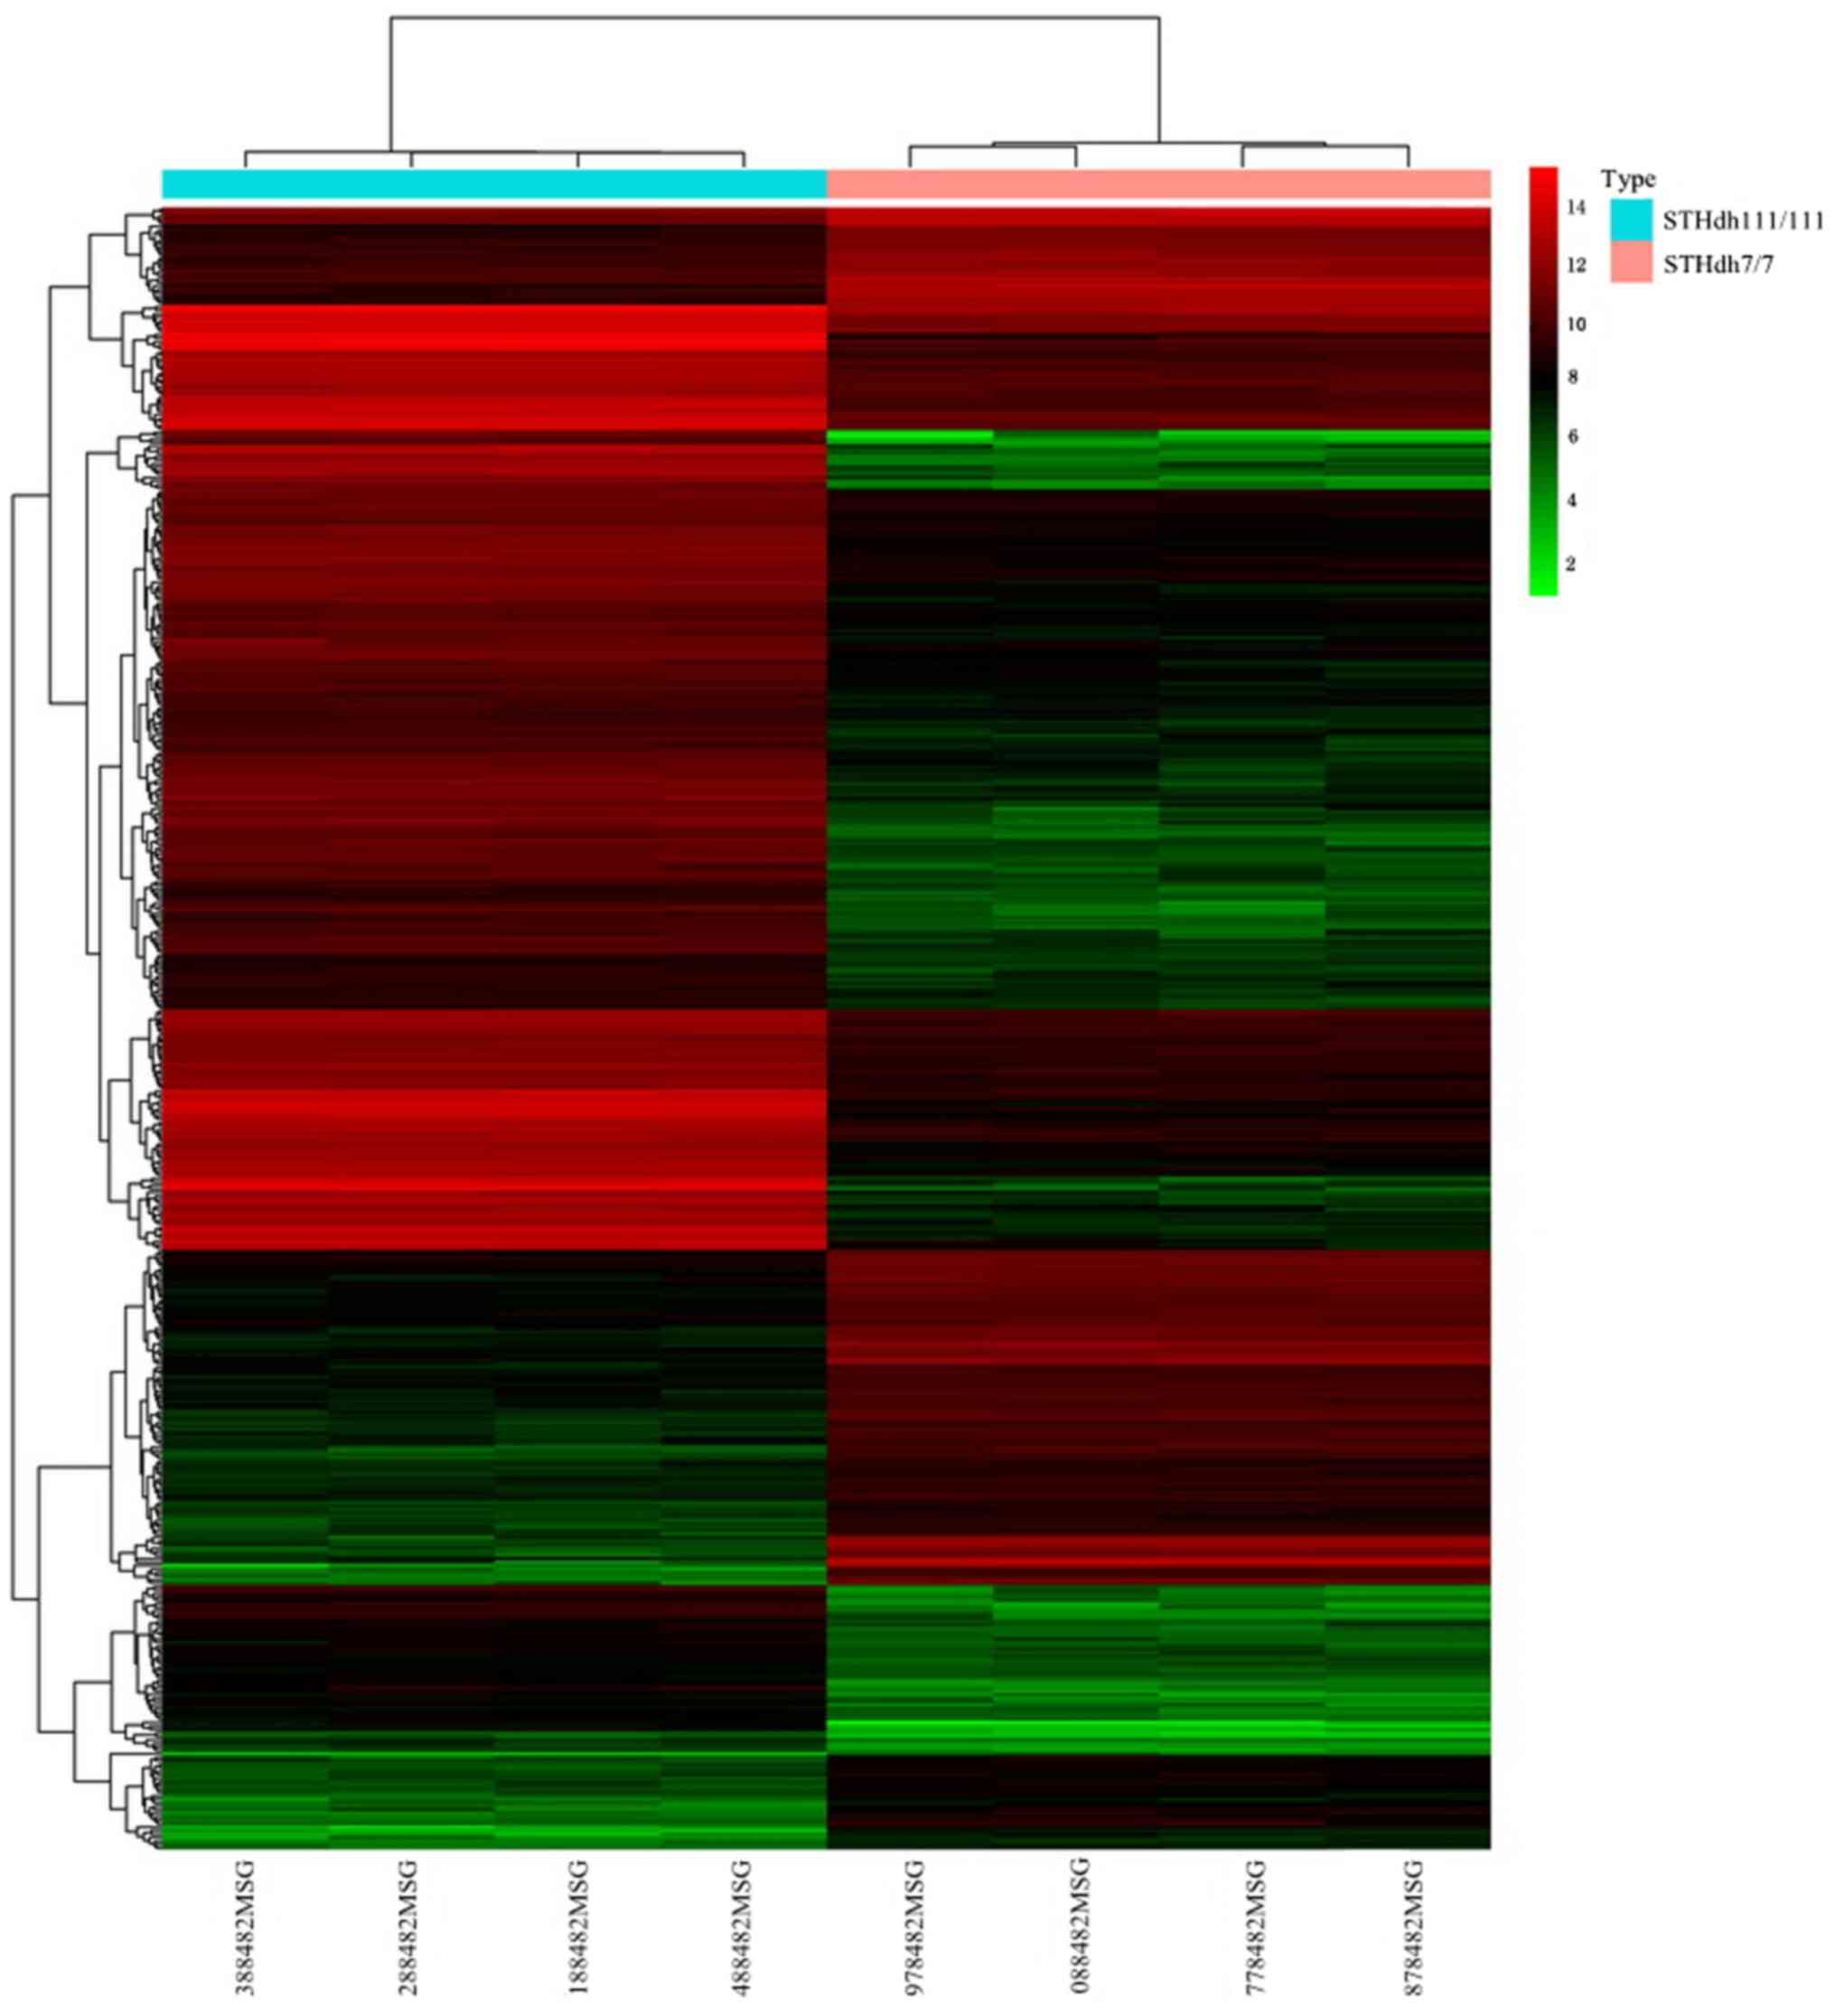
A total of 471 DEGs including 319 upregulated and
152 downregulated DEGs were selected. This set of DEGs was used for
hierarchical clustering analysis (Fig.
1).
Functional and pathway enrichment
analysis
Upregulated genes in the STHdh111/111 cells were
significantly enriched in 208 GO terms and 25 KEGG pathways. The
top ten functions enriched for upregulated genes are presented in
Table I, including extracellular
region (P=1.49×10⁻²⁸) and immune system process
(P=2.53×10⁻¹⁹). Downregulated genes in the STHdh111/111
cells were significantly enriched in 159 GO terms and 16 KEGG
pathways. The top ten functions enriched for downregulated genes
are presented in Table II,
including cell adhesion (P=5.06×10⁻⁷), protein binding
(P=3.08×10⁻⁷), and cytoplasm
(P=3.28×10⁻⁶).
 | Table I.Top 10 functions enriched for the
upregulated genes in the STHdh111/111 cells. |
Table I.
Top 10 functions enriched for the
upregulated genes in the STHdh111/111 cells.
| ID | Description | P-value | Total no. of
genes | Genes |
|---|
| GO:0005576 | Extracellular
region |
1.49×10⁻²⁸ | 93 | ASPN, AEBP1, FGF7,
FAM3C, ARSJ, POSTN, LRRC17, MMP3, CXCL10, LOC100861978, NOV, OGN,
C1RA, WISP2, C1RB, TNFRSF11B, CASP4, ISG15, SERPINE2, APOD, APOF,
TGFBI, SEMA3E, RSPO2, CFH, BC028528, ANGPT1, SEMA3B, ITIH2, SEPP1,
LBP, LOX, COL10A1, C4A, SPARCL1, ANG3, LIFR, MGP, NDNF, VEGFC,
SERPINA3N, BGN, C4BP, SERPINA3M, ADM, EREG, COL1A2, ADAMTS1,
ADAMTS5, HSD17B11, CXCL1, RBP4, IL1R1, WNT16, C3, ENPP2, LUM, CPQ,
CLU, CXCL9, IL33, DCN, GBP2B, CCL5, ISLR, SMOC2, LGALS3BP, GLIPR1,
FBN2, PTX3, COL8A2, THBS2, SVEP1, RNASE4, EFEMP1, IL1RN, IGF2,
CLEC11A, LGALS9, GAS6, THSD7A, TSLP, OMD, LAMA4, SNED1, PENK,
CLEC3B, CXCL15, TGFBR3, APOL9A, C1S1, IGFBP4, IGFBP5 |
| GO:0009615 | Response to
virus |
7.68×10⁻²³ | 24 | IFIH1, BST2, CLU,
OAS3, RSAD2, OAS2, CCL5, CXCL10, ISG20, DDX58, IFIT3, IFIT2, IFIT1,
OASL2, DDX60, IFI27L2A, TGTP2, OAS1A, EIF2AK2, MX1, MX2, DHX58,
DCLK1, ADAR |
| GO:0051607 | Defense response to
virus |
2.82×10⁻²¹ | 29 | IFIH1, SLFN9,
CXCL9, OAS3, SLFN8, RSAD2, OAS2, IL33, GBP2B, CXCL10, ISG20, ISG15,
OASL2, DDX60, MX1, MX2, DHX58, ZBP1, BST2, TRIM25, STAT2, H2×Q9,
IFIT3, DDX58, IFIT2, IFIT1, OAS1A, EIF2AK2, ADAR |
| GO:0002376 | Immune system
process |
2.53×10⁻¹⁹ | 38 | IFIH1, C3, OAS3,
H2×D1, RSAD2, OAS2, GBP2B, ISG20, C1RA, C1RB, CASP4, OASL2, TAP1,
CFH, IIGP1, LBP, MX1, MX2, DHX58, ZBP1, H2×K1, IRGM1, H2×L, BST2,
HERC6, TRIM25, PSMB8, LGALS9, PSMB9, IFIT3, DDX58, IFIT2, IFIT1,
C4BP, IRF7, C1S1, EIF2AK2, ADAR |
| GO:0035458 | Cellular response
to interferonxbeta |
4.27×10⁻¹⁹ | 17 | GBP6, IRGM1, IRGM2,
LOC100044068, IFI47, STAT1, GBP2B, IFIT3, IFI202B, IFIT1, IGTP,
IIGP1, TGTP2, GBP3, GM4951, GBP2, IFI204 |
| GO:0045087 | Innate immune
response |
5.67×10⁻¹⁷ | 36 | IFIH1, C3, TRIM14,
OAS3, RSAD2, OAS2, ISG20, C1RA, C1RB, CASP4, OASL2, CFH, IIGP1,
VNN1, LBP, PTX3, MX1, MX2, DHX58, ZBP1, IRGM1, LOC100044068, BST2,
HERC6, TRIM25, IFI202B, DDX58, IFIT3, IFIT2, IFIT1, C4BP, IRF7,
OAS1A, C1S1, EIF2AK2, ADAR |
| GO:0005615 | Extracellular
space |
1.01×10⁻¹⁶ | 68 | AEBP1, FGF7, POSTN,
LRRC17, DLK1, CXCL11, MMP3, CXCL10, LOC100861978, OGN, TNFRSF11B,
WISP2, SERPINE2, APOD, SEMA3E, TGFBI, CFH, VNN1, ANGPT1, SEMA3B,
CES1D, SEPP1, LOX, LBP, CTSZ, C4A, SPARCL1, MGP, VEGFC, SERPINA3N,
THBD, SERPINA3M, ADM, EREG, PPBP, COL1A2, CTSH, ADAMTS5, CXCL1,
RBP4, WNT16, IL1R1, ENPP2, C3, LUM, CPQ, CLU, CXCL9, OAS3, IL33,
DCN, CCL5, ABI3BP, LGALS3BP, COL6A3, PTX3, EFEMP1, IL1RN, LMCD1,
IGF2, GAS6, CLEC11A, TSLP, OMD, CLEC3B, CXCL15, TGFBR3, IGFBP4 |
| GO:0005578 | Proteinaceous
extracellular matrix |
5.89×10⁻¹⁶ | 31 | ASPN, WNT16, LUM,
POSTN, DCN, MMP3, ABI3BP, NOV, SMOC2, OGN, TNFRSF11B, LGALS3BP,
WISP2, TGFBI, COL6A3, FBN2, LOX, THBS2, COL8A2, COL10A1, SPARCL1,
EFEMP1, NDNF, LAMA4, OMD, BGN, CLEC3B, COL1A2, TGFBR3, ADAMTS1,
ADAMTS5 |
| GO:0008201 | Heparin
binding |
1.79×10⁻¹² | 20 | FGF7, POSTN, CCL5,
CXCL11, ABI3BP, NDNF, CXCL10, NOV, SMOC2, OGN, WISP2, SERPINE2,
CLEC3B, RSPO2, CFH, TGFBR3, ADAMTS1, GPNMB, THBS2, ADAMTS5 |
| GO:0031012 | Extracellular
matrix |
1.32×10⁻¹¹ | 25 | ASPN, AEBP1, LUM,
CLU, POSTN, DCN, MMP3, NOV, OGN, LGALS3BP, CD93, SERPINE2, COL6A3,
TGFBI, FBN2, COL8A2, THBS2, EFEMP1, LMCD1, MGP, OMD, BGN, COL1A2,
ADAMTS1, ADAMTS5 |
| Table II.Top 10 functions enriched for the
down regulated genes in the STHdh111/111 cells. |
Table II.
Top 10 functions enriched for the
down regulated genes in the STHdh111/111 cells.
| ID | Description | P-value | Total no. of
genes | Genes |
|---|
| GO:0007155 | Cell adhesion |
5.06×10⁻⁷ | 17 | FLRT2, CADM1,
NUAK1, PDPN, ITGB5, ITGA3, NECTIN4, CDH2, MEGF10, NCAM1, HES1,
WISP1, PKP1, CD34, TENM3, ITGA7, HAS2 |
| GO:0005515 | Protein
binding |
3.08×10⁻⁷ | 56 | ALDH1L1, CADM1,
ATL2, AQP5, PAX6, PMAIP1, PRKG2, ANKRD1, CKB, WNT4, UNC5B, TIAM1,
BOK, EMID1, PID1, KIF5C, BASP1, ECT2, HES1, NCAM1, KRT19, UHRF1,
SIX1, BUB1B, WNT9A, KIF26B, MAP3K11, SOX2, BEX1, CDH2, SOX6, CEP55,
IVNS1ABP, PEX5L, VDR, LHX2, POU3F3, SCN5A, OLFM1, DTNA, FLRT2, NES,
TRPC6, IGF1, BIRC5, DPYSL3, ITGA3, SOD3, NREP, BMPER, PKP1, SFRP2,
SALL1, ITGA7, ID4, FCGBP |
| GO:0005737 | Cytoplasm |
3.28×10⁻⁶ | 75 | ALDH1L1, CRABP1,
PTGS2, TUBB2B, NUAK1, CRABP2, PTGS1, PAX6, RPRM, ANKRD1, CKB, WNT4,
WISP1, BOK, TIAM1, PID1, CDC6, SGOL1, KIF5C, BASP1, UBE2C, ECT2,
HES1, TNNT2, NCAM1, PPM1E, TAGLN, SPAG5, CD34, SIX1, BUB1B, HAS2,
FILIP1L, GRB14, CASQ2, KIF26B, MAP3K11, FHL1, SOX2, DIAPH3, BEX1,
ANLN, CDH2, DENND2A, CEP55, SERPINB1B, IVNS1ABP, PEX5L, TK1,
ACSBG1, NCAPG, FNDC1, ENO3, DTNA, FLRT2, PTGR1, NES, GSTA4, TRPC6,
IGF1, BIRC5, DPYSL3, C330027C09RIK, RGS16, SOD3, CENPI, FAM64A,
NREP, SALL1, PRKAR1B, ITGA7, ID4, FAM84B, BTBD11, PLEKHA1 |
| GO:0000902 | Cell
morphogenesis |
2.80×10⁻⁵ | 7 | VDR, CAP2, PDPN,
TENM3, SOX6, GREM1, ECT2 |
| GO:0051301 | Cell division |
9.48×10⁻⁵ | 12 | CCNE2, CDC6,
FAM64A, SPAG5, SGOL1, NUF2, BUB1B, BIRC5, ANLN, CEP55, UBE2C,
ECT2 |
| GO:0007275 | Multicellular
organism development |
1.72×10⁻⁴ | 20 | FLRT2, NES, CADM1,
PDPN, FHL1, SOX2, PAX6, BEX1, SOX6, SHOX2, VDR, WNT4, UNC5B, SFRP2,
SEMA7A, SIX1, POU3F3, WNT9A, OLFM1, KIF26B |
| GO:0045165 | Cell fate
commitment |
1.82×10⁻⁴ | 6 | HES1, WNT4, SOX2,
PAX6, SOX6, WNT9A |
| GO:0007067 | Mitotic nuclear
division |
2.00×10⁻⁴ | 10 | CDC6, FAM64A,
SPAG5, SGOL1, NUF2, BUB1B, BIRC5, ANLN, CEP55, UBE2C |
| GO:0008283 | Cell
proliferation |
2.14×10⁻⁴ | 9 | UHRF1, PDPN, BOK,
CD34, PRKAR1B, SIX1, IGF1, ID4, MAP3K11 |
| GO:0005911 | Cell-cell
junction |
6.26×10⁻⁴ | 8 | NCAM1, FLRT2,
CADM1, TIAM1, FNDC1, CDH2, NECTIN4, ECT2 |
Pathways enriched for upregulated genes included
cytokine-cytokine receptor interaction (P=9.18×10⁻⁸),
the cytosolic DNA-sensing pathway (P=3.39×10⁻⁷) and the
Jak-STAT signaling pathway (P=5.15×10⁻⁵), presented in
Table III. In addition,
downregulated genes were significantly enriched in the p53
signaling pathway (P=2.23×10⁻³), the regulation of actin
cytoskeleton (P=0.032) and the hippo signaling pathway (P=0.036),
presented in Table IV.
| Table III.Top 10 enriched pathways for the
upregulated genes. |
Table III.
Top 10 enriched pathways for the
upregulated genes.
| ID | Description | P-value | Total no. of
genes | Genes |
|---|
| mmu05168 | Herpes simplex
infection |
1.70×10⁻¹¹ | 21 | H2-K1, IFIH1,
SP100, SOCS3, C3, OAS3, H2-D1, OAS2, STAT1, CCL5, H2-Q6, STAT2,
IRF9, DDX58, IKBKE, IFIT1, IRF7, TAP1, LOC101056305, OAS1A,
EIF2AK2 |
| mmu05164 | Influenza A |
4.28×10⁻¹¹ | 19 | IFIH1, SOCS3, OAS3,
RSAD2, TRIM25, IL33, OAS2, STAT1, CCL5, STAT2, CXCL10, IRF9, DDX58,
IKBKE, IRF7, OAS1A, EIF2AK2, MX2, ADAR |
| mmu04060 | Cytokine-cytokine
receptor interaction |
9.18×10⁻⁸ | 18 | IL1R1, LTBR, OSMR,
IL6ST, LIFR, CXCL9, ACKR3, CCL5, CXCL11, CXCL10, LOC100861969,
LOC100861978, VEGFC, TSLP, TNFRSF11B, PPBP, CXCL15, IL13RA1 |
| mmu04623 | Cytosolic
DNA-sensing pathway |
3.39×10⁻⁷ | 10 | IFI202B, DDX58,
IKBKE, LOC100044068, IRF7, IL33, CCL5, ZBP1, ADAR, CXCL10 |
| mmu05160 | Hepatitis C |
6.55×10⁻⁷ | 13 | SOCS3, OAS3, OAS2,
STAT1, STAT2, IRF9, DDX58, IKBKE, IFIT1, IRF7, CLDN1, OAS1A,
EIF2AK2 |
| mmu05162 | Measles |
6.55×10⁻⁷ | 13 | IFIH1, OAS3, OAS2,
STAT1, STAT2, IRF9, DDX58, IKBKE, IRF7, OAS1A, EIF2AK2, MX2,
ADAR |
| mmu04630 | Jak-STAT signaling
pathway |
5.15×10⁻⁵ | 11 | STAT6, IRF9, TSLP,
OSMR, IL6ST, SOCS3, LIFR, STAT1, IL13RA1, STAT2, LOC100861969 |
| mmu04622 | RIG-I-like receptor
signaling pathway |
5.87×10⁻⁵ | 8 | DDX58, IKBKE,
IFIH1, ISG15, IRF7, TRIM25, DHX58, CXCL10 |
| mmu04620 | Toll-like receptor
signaling pathway |
6.98×10⁻⁴ | 8 | IKBKE, IRF7, CXCL9,
LBP, STAT1, CCL5, CXCL11, CXCL10 |
| mmu05203 | Viral
carcinogenesis |
2.17×10⁻³ | 11 | H2-K1, IRF9, LTBR,
SP100, IL6ST, C3, IRF7, H2-D1, LOC101056305, EIF2AK2, H2-Q6 |
| Table IV.Top 10 enriched pathways for the
downregulated genes. |
Table IV.
Top 10 enriched pathways for the
downregulated genes.
| ID | Description | P-value | Total no. of
genes | Genes |
|---|
| mmu05414 | Dilated
cardiomyopathy |
5.90×10⁻⁴ | 6 | TNNT2, ADCY7,
ITGA7, IGF1, ITGB5, ITGA3 |
| mmu04550 | Signaling pathways
regulating pluripotency of stem cells |
9.37×10⁻⁴ | 7 | INHBB, WNT4, SOX2,
PAX6, IGF1, ID4, WNT9A |
| mmu04923 | Regulation of
lipolysis in adipocytes |
1.22×10⁻³ | 5 | ADCY7, PTGS2,
PTGS1, PDE3B, PRKG2 |
| mmu04115 | p53 signaling
pathway |
2.23×10⁻³ | 5 | CCNE2, RPRM, IGF1,
PMAIP1, IGFBP3 |
| mmu05412 | Arrhythmogenic
right ventricular cardiomyopathy (ARVC) |
2.75×10⁻³ | 5 | TCF7, ITGA7, ITGB5,
ITGA3, CDH2 |
| mmu05410 | Hypertrophic
cardiomyopathy (HCM) |
4.05×10⁻³ | 5 | TNNT2, ITGA7, IGF1,
ITGB5, ITGA3 |
| mmu05200 | Pathways in
cancer | 0.016 | 9 | CCNE2, TCF7, WNT4,
ADCY7, PTGS2, IGF1, BIRC5, ITGA3, WNT9A |
| mmu05205 | Proteoglycans in
cancer | 0.026 | 6 | WNT4, TIAM1, IGF1,
ITGB5, WNT9A, GPC1 |
| mmu04810 | Regulation of actin
cytoskeleton | 0.032 | 6 | TIAM1, ITGA7,
DIAPH3, ITGB5, ITGA3, MYL9 |
| mmu04390 | Hippo signaling
pathway | 0.036 | 5 | TCF7, WNT4, SOX2,
BIRC5, WNT9A |
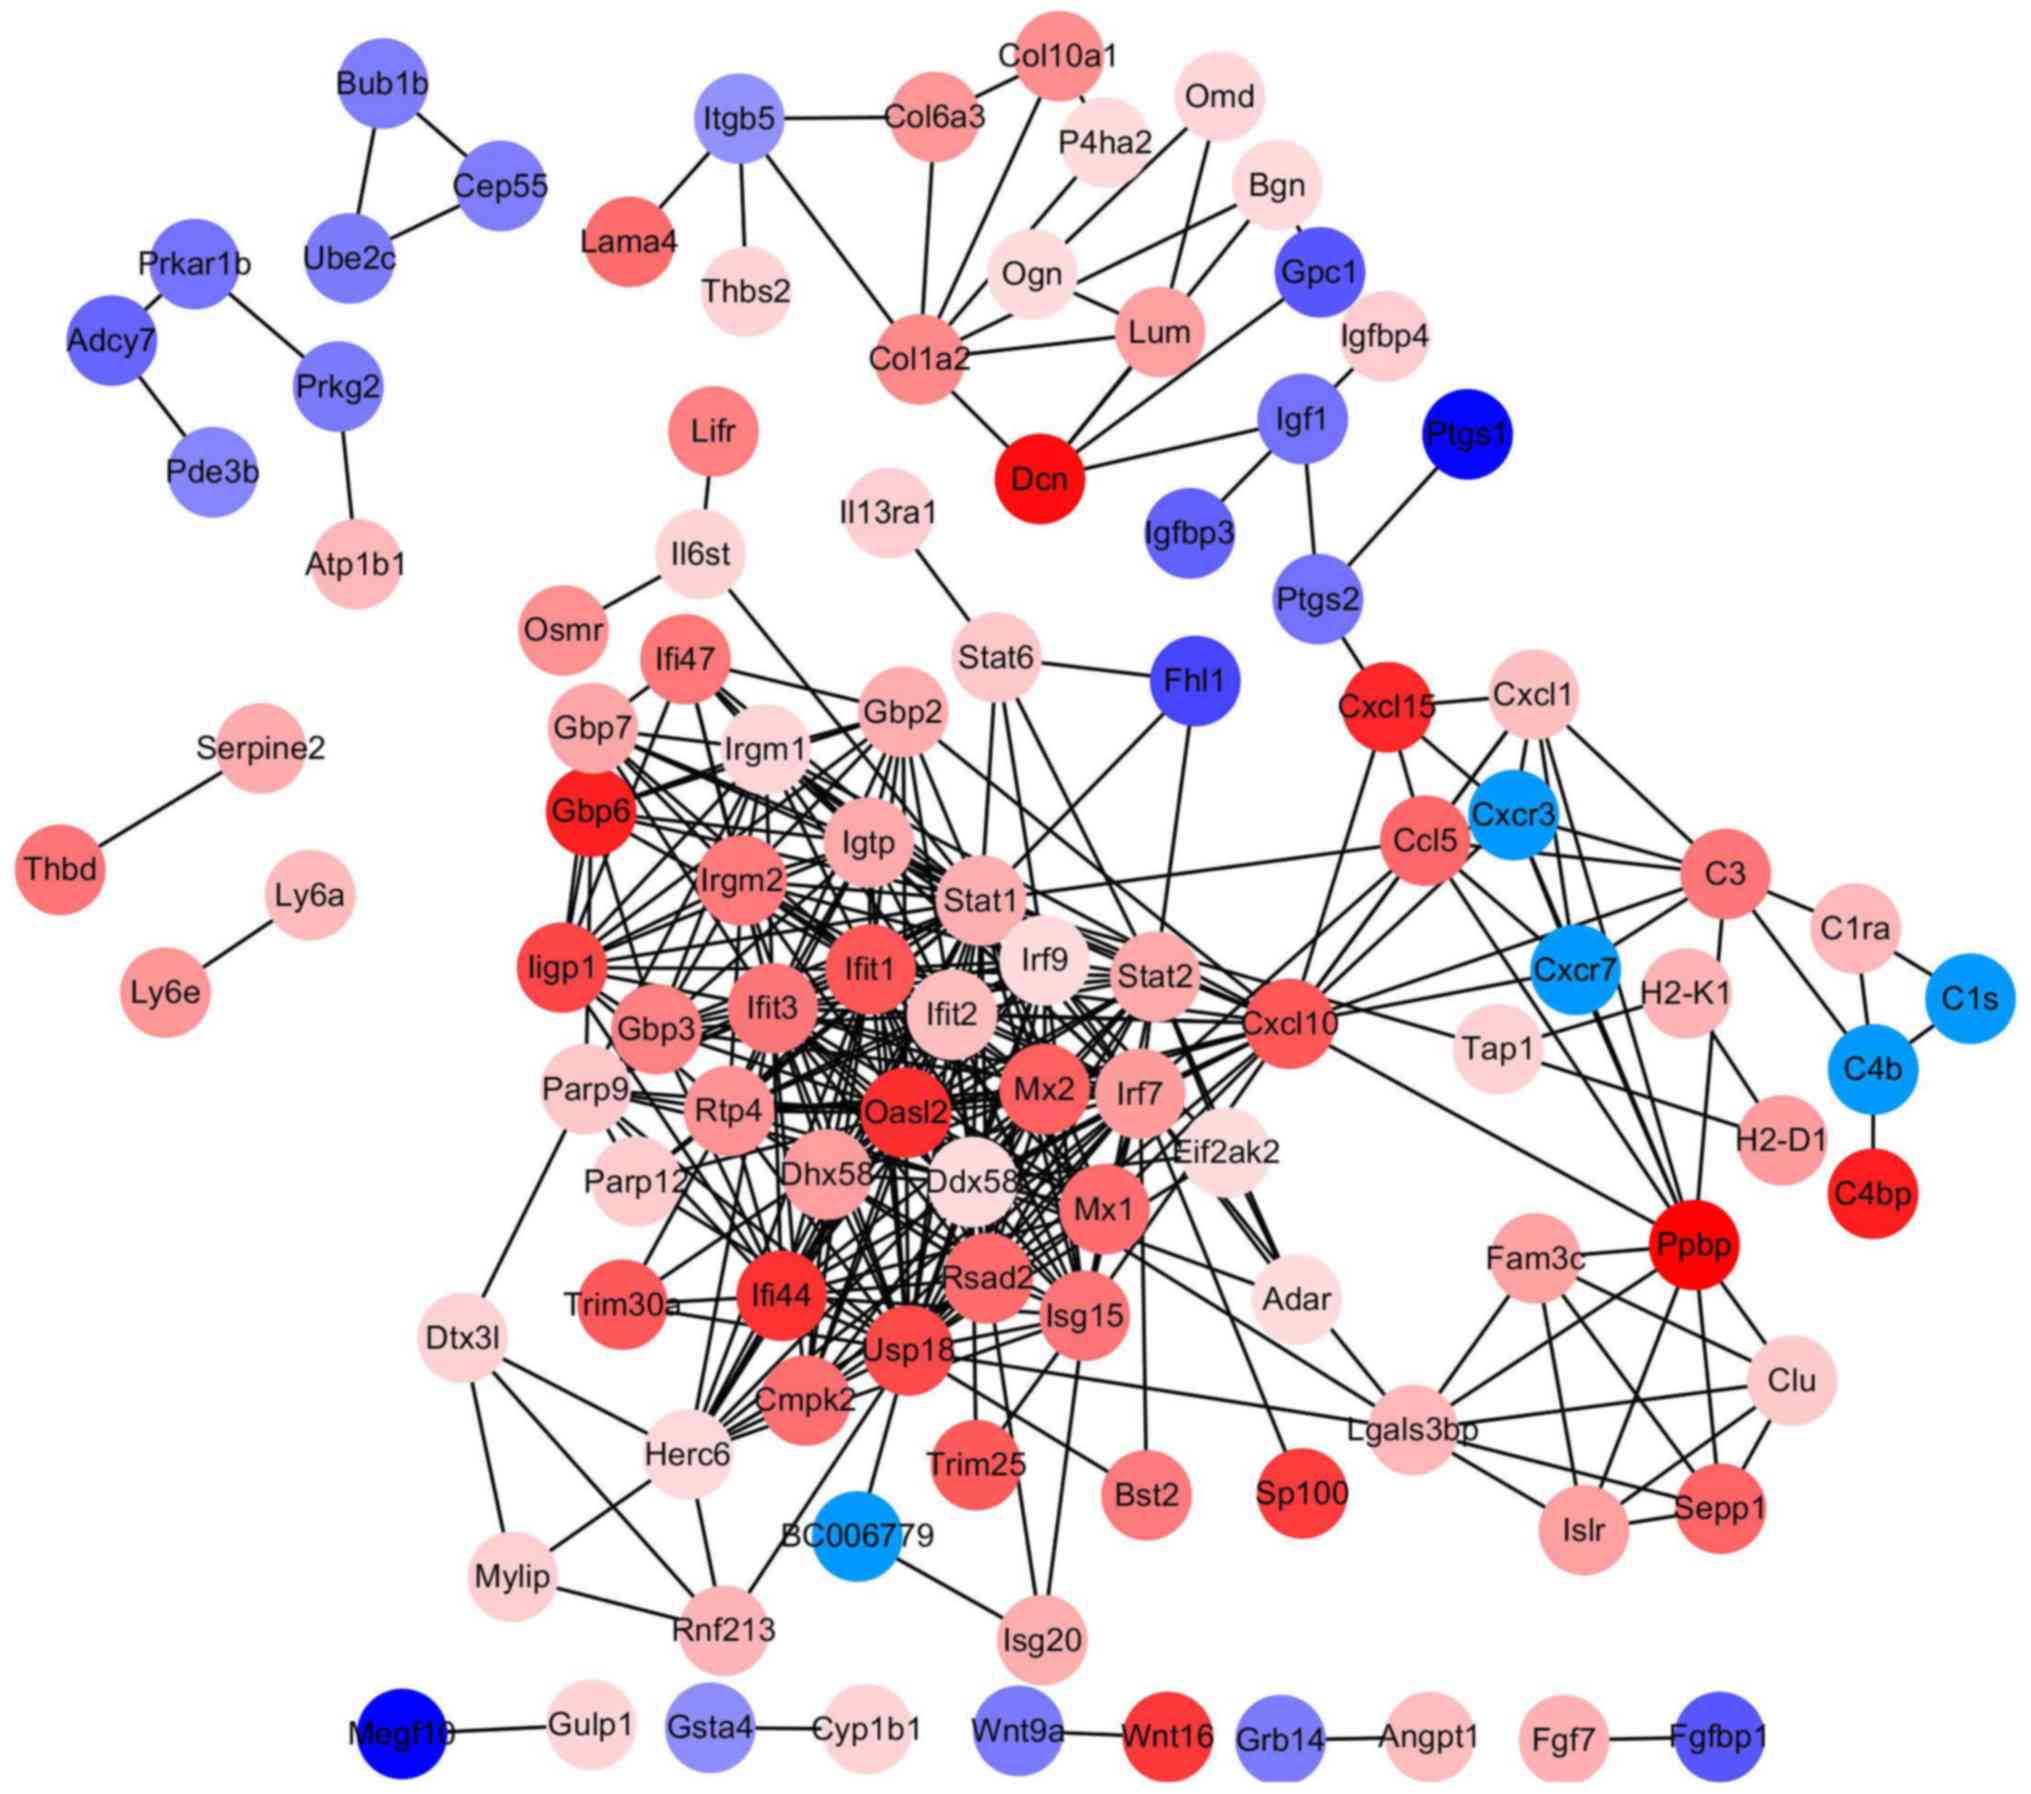
PPI network construction and
analysis
The PPI network of DEGs was constructed by Cytoscape
software following a PPI search (Fig.
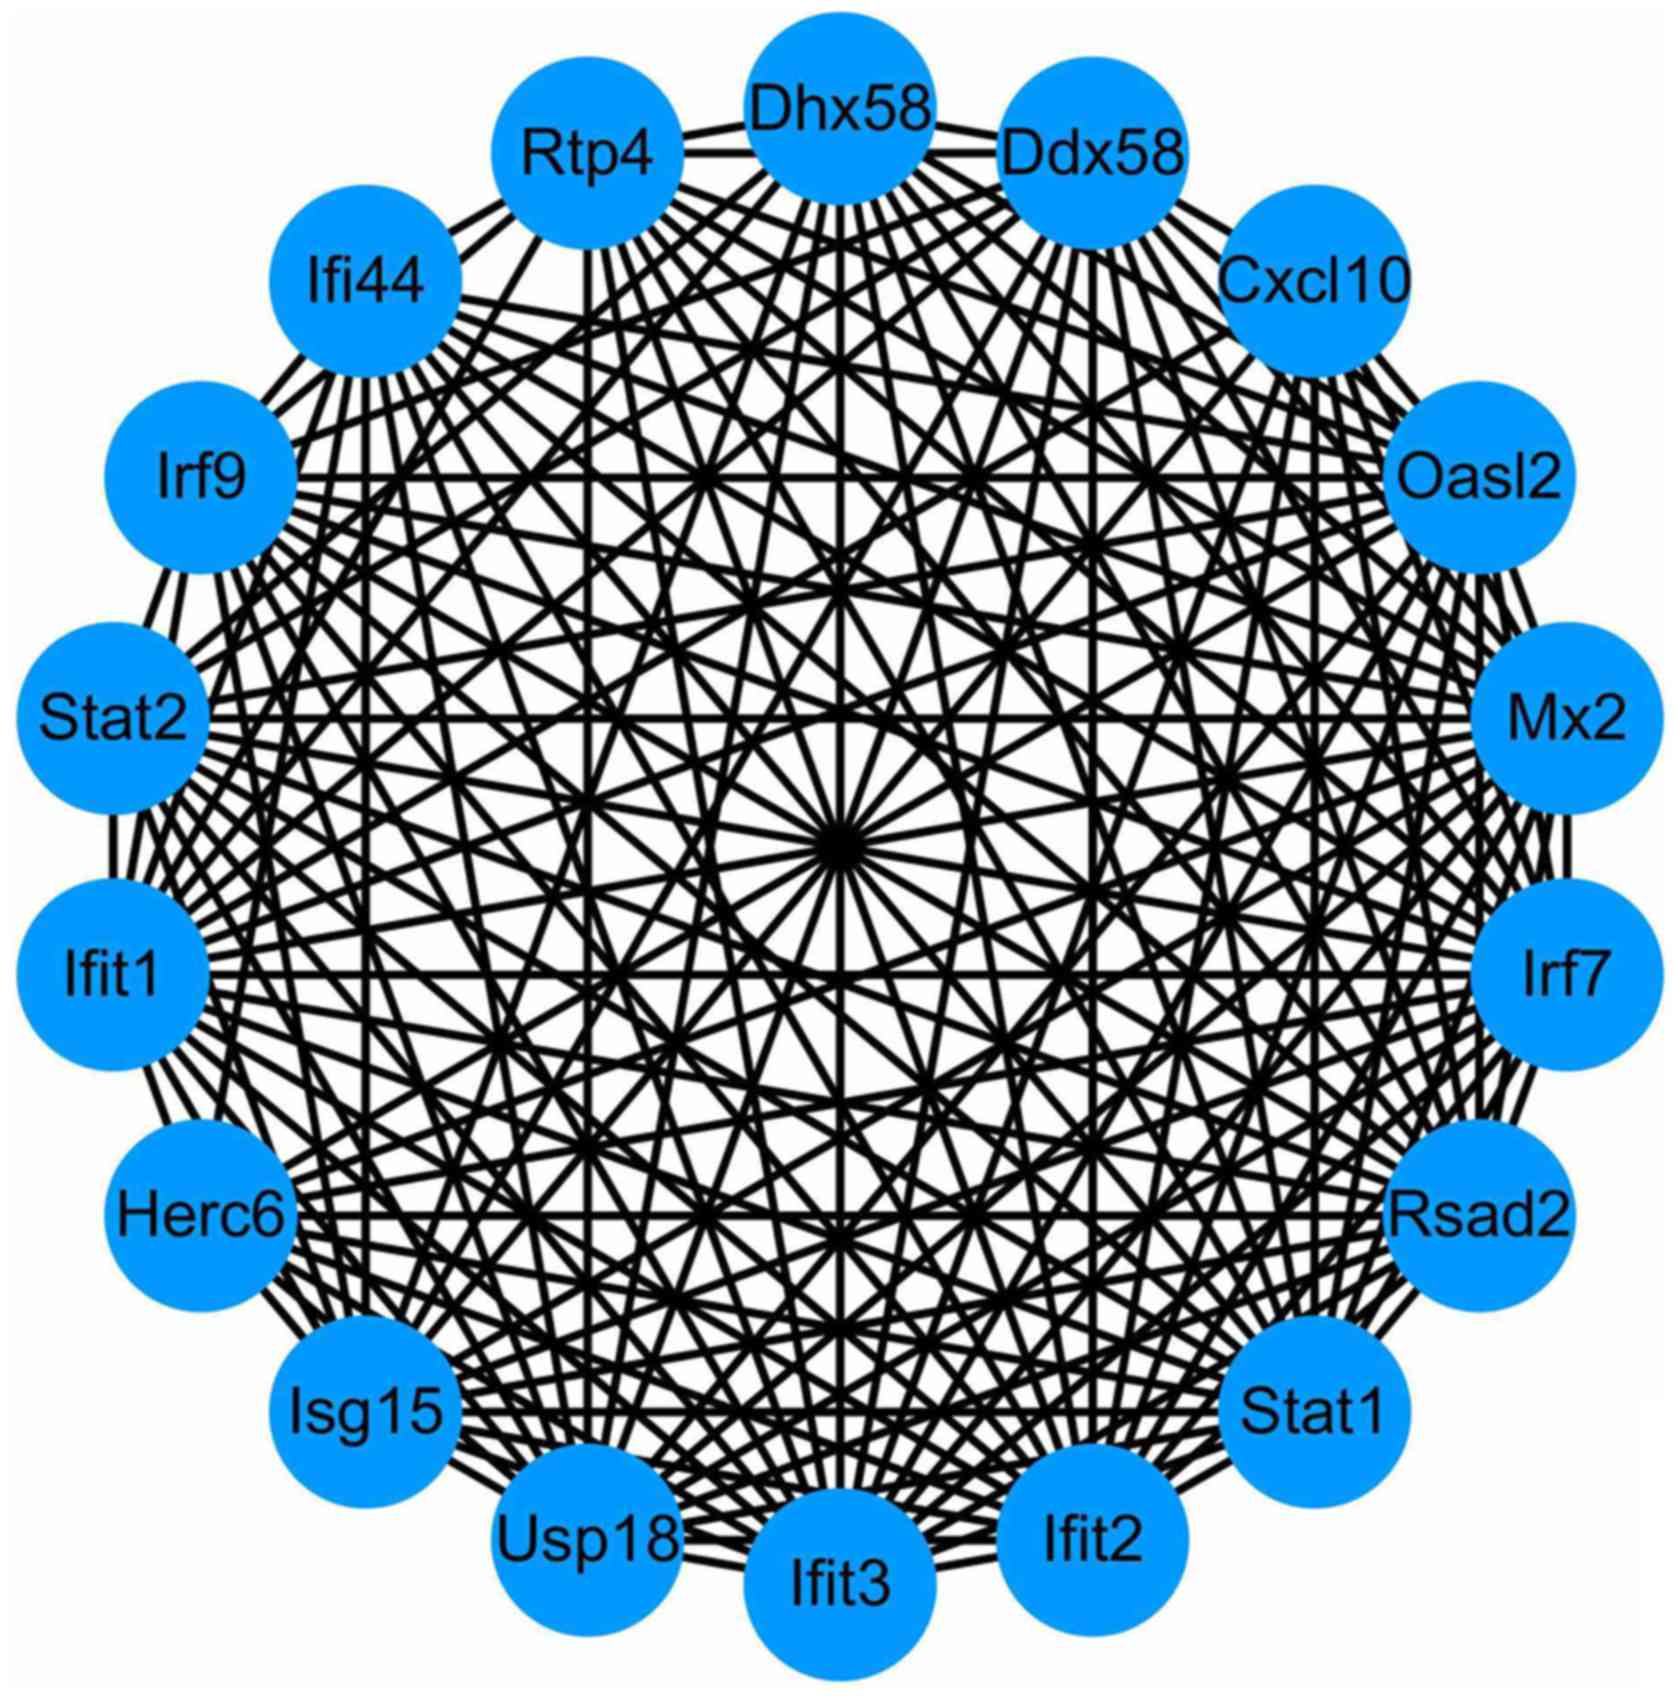
2). Using the MCODE in Cytoscape, degrees≥10 was set as the
cutoff criterion and a total of 18 genes were selected as hub genes
(DHX58, HERC6, RTP4, IFI44, STAT2, MX2, STAT1, IRF9, CXCL10, IFIT2,
USP18, ISG15, OASL2, IFIT1, RSAD2, IRF7, DDX58, and IFIT3) were
identified from the PPI network (Fig.
3). Notably, there were higher degrees in IFIT1 and OASL2
(degree=20) in the PPI network for upregulated genes, and in DDX58
and HERC6 (degree=20) in the PPI network for downregulated
genes.
miRNA prediction of DEGs
From the 471 DEGs investigated by this study, we
chose a DEG with the largest log fold change (FC) value for miRNA
prediction and analysis, which was RNASE4. We mapped the RNASE4
(log FC=9.11, P Value=1.32×10−07) in the TargetScan
database for predicting the miRNAs of this gene. By choosing the
strict cutoff of 8mer seeds, we found two miRNAs: miRNA-124a and
miRNA-124a2.
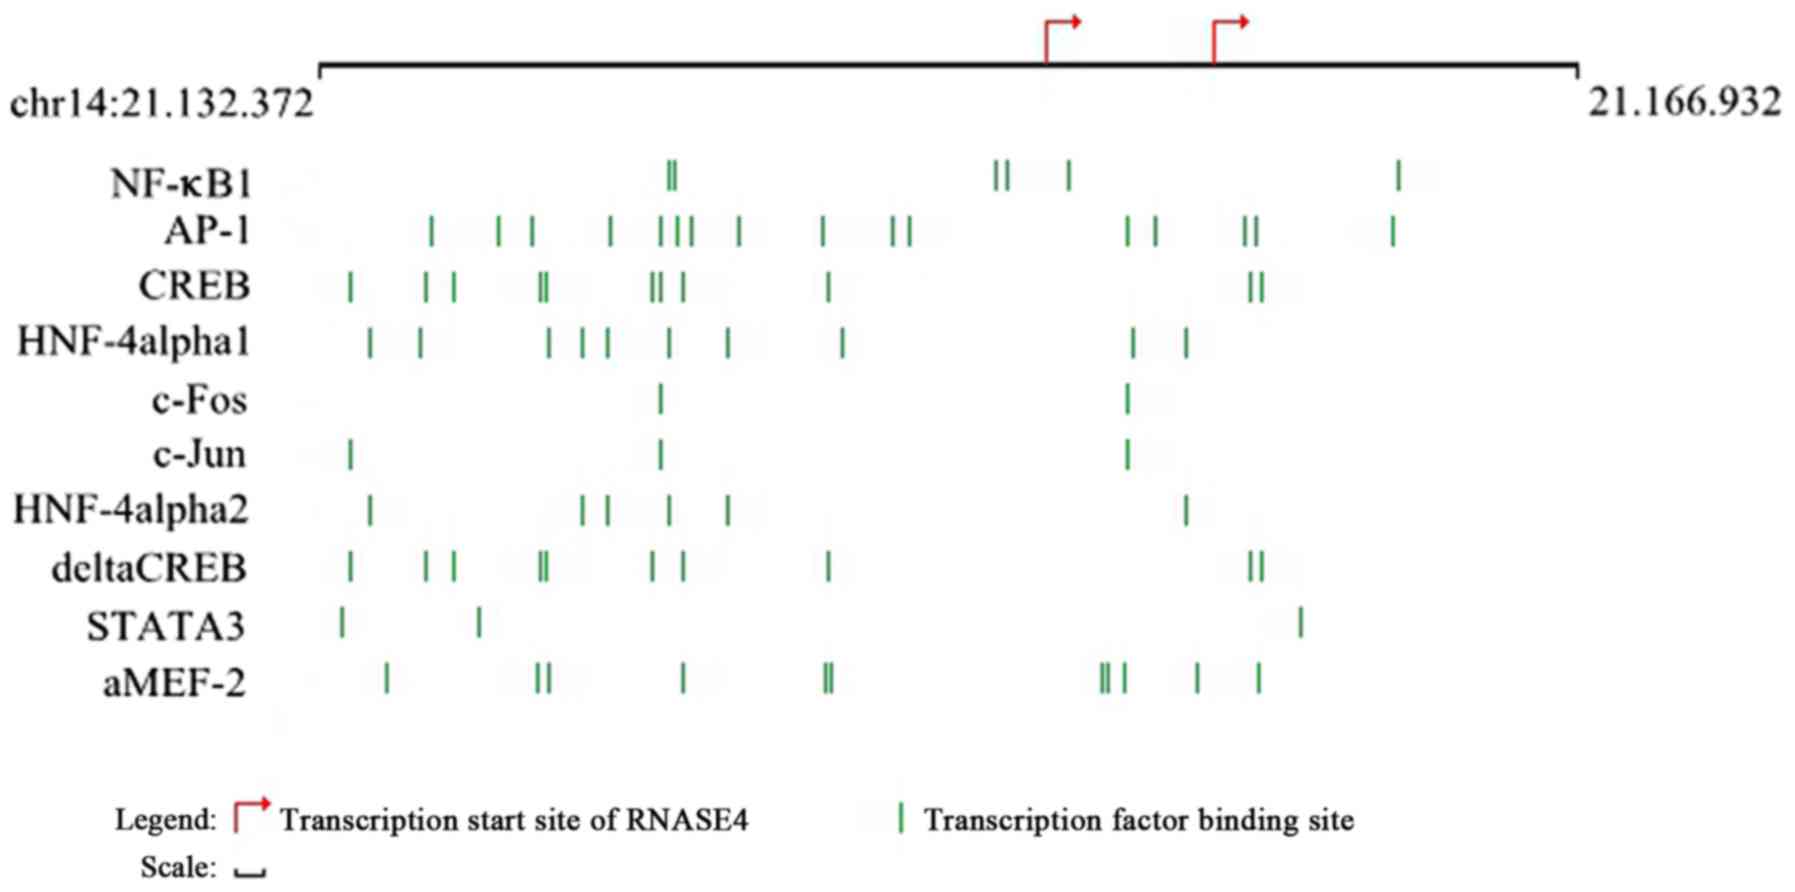
Transcription factor prediction of
DEG
We searched the TFs of the RNASE4 gene by using the
TRANSFAC database. Ten TFs were identified, including nuclear
factor (NF)-κB1, c-Jun, c-Fos, hepatocyte nuclear factor (HNF)-4
α1, HNF-4 α2, activating protein-1 (AP-1), myocyte enhancer binding
factor 2 (aMEF-2), signal transducer and activator of transcription
3 (STAT3), and cAMP-response element binding protein (δCREB;
Fig. 4). The image displays the
most relevant transcription factor binding sites in the promoter
region of this gene as predicted by TRANSFAC database (25). We predicted the miRNAs of these
identified TFs and found that only STAT3 was associated with
miRNA-124.
Discussion
In this study, bioinformatics analysis of GSE11358
was carried out; we identified a total of 471 DEGs in STHdh111/111
cells compared with normal STHdh7/7 cells, including 319
upregulated and 152 downregulated genes. Upon analysis by MCODE in
Cytoscape, 18 modules were identified from the PPI network,
including DHX58, HERC6, RTP4, IFI44, STAT2, MX2, STAT 1, IRF9,
CXCL10, IFIT2, USP18, ISG15, OASL2, IFIT1, RSAD2, IRF7, DDX58, and
IFIT3. Of these, IFIT1 and OASL2 had the highest degree in
upregulated genes, while DDX58 and HERC6 had the highest degree in
downregulated genes.
IFIT1 was identified as a member of a macrophage
‘core response module’, which was commonly differentially expressed
in response to multiple stimulatory signals in the immune system
(26). Interestingly, previous
studies have demonstrated that both innate and adaptive immune
systems were activated during progression of HD (27). Dysregulation of IFIT1 can cause a
measurable effect in the expression of downstream targets, acting
either directly or indirectly, and IFIT1 was associated with a
cluster of genes related to the innate immune response.
Bayram-Weston et al found that IFIT1 was highly expressed in
the striatum of the YAC128 and HdhQ150 mouse models of Huntington's
disease (28); Jordanovski et
al also found that high expression of IFIT1 was correlated with
Huntington's disease in the study of the TF ZNF395 (29). All these results suggested that
IFIT1 plays an important role in the immune response by regulating
macrophage function, and its abnormal regulation could be involved
in the pathophysiological changes of HD. However, the exact
regulatory mechanism is unclear, and further experiments are needed
to define the mechanism in HD. OASL2, as an interferon-stimulated
gene is another gene related to the innate immune response
(30), and was shown to be an
important response module in macrophage activation (31). In the BACHD mouse model of HD,
impaired migration of macrophages in response to an inflammatory
stimulus was shown, which predicted one of the underlying
mechanisms of HD (32). McDermott
et al reported that OASL2 participates in interactions that
are important for macrophage activation and migration (33). Dysregulation of OASL2 may interrupt
migration of macrophages in the HD mice model or interact with mHTT
fragments in their immunological functions.
DDX58, also known as retinoic acid inducible gene-I
(RIG-I), has been validated by immunofluorescence labeling of motor
neurons in an amyotrophic lateral sclerosis mouse(TDP-43A315T)
spinal cord (34). DDX58 is a
direct target of TDP-43, and abnormalities of TDP-43 were shown to
lead to deregulation of DDX58. Tauffenberger et al confirmed
the results that inappropriate cytoplasmic accumulations of TDP-43
are observed in HD (35). In our
study, we found that DDX58 was clearly downregulated, which
inferred that abnormal accumulations of TDP-43 in HD could be
responsible for this result. Other studies also found that DDX58
was involved in immune regulation (36).
HERC6 is a HerC protein family member; a previous
study found that HERC6 was the main E3 ligase for global ISG15
conjugation in mouse cells (37).
ISG15, an interferon (IFN)-stimulated gene, was reported to
participate in activation of IFN signaling in the CNS and was
usually associated with inflammation (38). Together, some studies indicated
that ISG15 could activate autophagy by various means (39). Although there were no exact studies
reporting a correlation between HERC6 and HD, it has been
established that aberrant inflammation and autophagy may both
participate in the pathogenesis of HD; therefore, we believe that
HERC6 may play a role in the etiology of HD by influencing the
function of ISG15.
KEGG pathways, in our present study, including the
Jak-STAT signaling pathway (37),
the toll-like receptor signaling pathway (13,40),
and the RIG-I-like receptor signaling pathway (41) have been confirmed to be associated
with HD and neurodegenerative diseases. Although we did not explore
these pathways further in the present study, they are critical for
understanding the pathogenesis of HD.
MicroRNA (miRNA) is a small non-coding RNA molecule
containing about 22 nucleotides, and mediates the
post-transcriptional regulation of gene expression (42). It has been reported that miRNA is
abundantly expressed in the CNS (43) and may participate in diverse
biological processes in neuronal cell differentiation and functions
(44). A number of different
miRNAs have been found to be abnormally regulated in cellular and
mice models of HD, including miRNA-137, −214 (45), −146a (46), and −27a (47). Therefore, deregulated miRNAs could
be attributed in etiology and therapeutic targets in the HD. Here,
we tried to predict the miRNAs and TFs of DEGs in the HD mice
model. We chose ribonuclease 4 (RNASE4), which is most
significantly upregulated in HD (log FC=9.11). RNASE4, the fourth
member of this superfamily, shares the same promoters as angiogenin
(ANG), and is co-expressed with ANG (48). It has been reported that RNASE4
protects neuron degeneration by promoting angiogenesis,
neurogenesis, and neuronal survival under stress (49). The neuroprotective activity of
RNASE4 is similar to that of ANG, which can upregulate Bcl-2
(50) and inhibit nuclear
translocation of apoptosis-inducing factor (51).
To strictly predict the miRNAs of the target gene
RNASE4, we chose an exact match (8mer seed) to positions 2–8 of the
mature miRNA. We found that miRNA-124 had the highest score,
suggesting that miRNA-124 could play an important role in HD, which
was in line with previous studies (52). MicroRNA-124 has been implicated in
HD by a mechanism that involves the regulation of CCNA2, and is
involved in regulating the cell cycle (53).
By searching TRANSFAC databases, we found STAT3 was
also regulated by miRNA-124. Astrocyte reactivity is a hallmark of
neurodegenerative diseases (ND); activation of the JAK/STAT3
pathway can promote astrocyte reactivity and decrease the number of
huntington aggregates, a neuropathological hallmark of HD (54). By analyzing new regulatory
relationships between miRNA-124, STAT3 and RNASE4, we predicted a
novel regulatory pathway that miRNA-124 regulates TF STAT3, and TF
STAT3 regulates RNASE4, that is, miRNA-124→STAT3→RNASE4, which
could be a possible target for HD treatment.
In the present study, we investigated the underlying
mechanisms of HD via bioinformatics analysis. A total 471 DEGs were
identified, and 18 hub genes including DHX58, HERC6, RTP4, IFI44,
STAT2, MX2, STAT 1, IRF9, CXCL10, IFIT2, USP18, ISG15, OASL2,
IFIT1, RSAD2, IRF7, DDX58, and IFIT3 may be involved in the
progression of HD. Meanwhile, we found a new regulatory
relationship between miRNA-124, STAT3 and RNASE4. All these
findings can shed light on the complex pathogenesis of HD and
provide a potential novel therapeutic strategy for patients with
HD, but the bioinformatics findings obtained in this study require
further conformation via experimental studies.
Acknowledgements
The present study was supported by the National
Natural Science Foundation of China (no. 81371271), and was also
sponsored by ‘Liaoning BaiQianWan Talents Program’.
References
|
1
|
A novel gene containing a trinucleotide
repeat that is expanded and unstable on Huntington's disease
chromosomes. The Huntington's Disease Collaborative Research Group.
Cell. 72:971–983. 1993. View Article : Google Scholar : PubMed/NCBI
|
|
2
|
Sinha M, Mukhopadhyay S and Bhattacharyya
NP: Mechanism(s) of alteration of Micro RNA expressions in
huntington's disease and their possible contributions to the
observed cellular and molecular dysfunctions in the disease.
Neuromolecular Med. 14:221–243. 2012. View Article : Google Scholar : PubMed/NCBI
|
|
3
|
Azambuja MJ, Haddad MS, Radanovic M,
Barbosa ER and Mansur LL: Semantic, phonologic, and verb fluency in
Huntington's disease. Dement Neuropsychol. 1:381–385. 2007.
View Article : Google Scholar : PubMed/NCBI
|
|
4
|
Tabrizi SJ, Langbehn DR, Leavitt BR, Roos
RA, Durr A, Craufurd D, Kennard C, Hicks SL, Fox NC, Scahill RI, et
al: Biological and clinical manifestations of Huntington's disease
in the longitudinal TRACK-HD study: Cross-sectional analysis of
baseline data. Lancet Neurol. 8:791–801. 2009. View Article : Google Scholar : PubMed/NCBI
|
|
5
|
Orford K, Crockett C, Jensen JP, Weissman
AM and Byers SW: Serine phosphorylation-regulated ubiquitination
and degradation of beta-catenin. J Biol Chem. 272:24735–24738.
1997. View Article : Google Scholar : PubMed/NCBI
|
|
6
|
Seredenina T and Luthi-Carter R: What have
we learned from gene expression profiles in Huntington's disease?
Neurobiol Dis. 45:83–98. 2012. View Article : Google Scholar : PubMed/NCBI
|
|
7
|
Cong SY, Pepers BA, Evert BO, Rubinsztein
DC, Roos RA, van Ommen GJ and Dorsman JC: Mutant huntingtin
represses CBP, but not p300, by binding and protein degradation.
Mol Cell Neurosci. 30:12–23. 2005. View Article : Google Scholar : PubMed/NCBI
|
|
8
|
Bae BI, Xu H, Igarashi S, Fujimuro M,
Agrawal N, Taya Y, Hayward SD, Moran TH, Montell C, Ross CA, et al:
p53 mediates cellular dysfunction and behavioral abnormalities in
Huntington's disease. Neuron. 47:29–41. 2005. View Article : Google Scholar : PubMed/NCBI
|
|
9
|
Dunah AW, Jeong H, Griffin A, Kim YM,
Standaert DG, Hersch SM, Mouradian MM, Young AB, Tanese N and
Krainc D: Sp1 and TAFII130 transcriptional activity disrupted in
early Huntington's disease. Science. 296:2238–2243. 2002.
View Article : Google Scholar : PubMed/NCBI
|
|
10
|
Li JL, Hayden M, Almqvist EW, Brinkman RR,
Durr A, Dodé C, Morrison PJ, Suchowersky O, Ross CA, Margolis RL,
et al: A genome scan for modifiers of age at onset in Huntington's
disease: The HD MAPS study. Am J Hum Genet. 73:682–687. 2003.
View Article : Google Scholar : PubMed/NCBI
|
|
11
|
Sinha M, Ghose J and Bhattarcharyya NP:
Micro RNA-214,-150,-146a and-125b target Huntingtin gene. RNA Biol.
8:1005–1021. 2011. View Article : Google Scholar : PubMed/NCBI
|
|
12
|
Santiago JA and Potashkin JA: A network
approach to clinical intervention in neurodegenerative diseases.
Trends Mol Med. 20:694–703. 2014. View Article : Google Scholar : PubMed/NCBI
|
|
13
|
Nguyen TP, Caberlotto L, Morine MJ and
Priami C: Network analysis of neurodegenerative disease highlights
a role of Toll-like receptor signaling. Biomed Res Int.
2014:6865052014. View Article : Google Scholar : PubMed/NCBI
|
|
14
|
Hofmann-Apitius M, Ball G, Gebel S,
Bagewadi S, de Bono B, Schneider R, Page M, Kodamullil AT, Younesi
E, Ebeling C, et al: Bioinformatics mining and modeling methods for
the identification of disease mechanisms in neurodegenerative
disorders. Int J Mol Sci. 16:29179–29206. 2015. View Article : Google Scholar : PubMed/NCBI
|
|
15
|
Sadri-Vakili G, Bouzou B, Benn CL, Kim MO,
Chawla P, Overland RP, Glajch KE, Xia E, Qiu Z, Hersch SM, et al:
Histones associated with downregulated genes are hypo-acetylated in
Huntington's disease models. Hum Mol Genet. 16:1293–1306. 2007.
View Article : Google Scholar : PubMed/NCBI
|
|
16
|
Smyth GK: Limma: Linear models for
microarray data. 2005.
|
|
17
|
Guo W and Rao MB: On control of the false
discovery rate under no assumption of dependency. J Statistical
Plan Inference. 138:3176–3188. 2008. View Article : Google Scholar
|
|
18
|
Huang Da W, Sherman BT and Lempicki RA:
Systematic and integrative analysis of large gene lists using DAVID
bioinformatics resources. Nat Protocols. 4:44–57. 2009. View Article : Google Scholar : PubMed/NCBI
|
|
19
|
Carbon S, Ireland A, Mungall CJ, Shu S,
Marshall B and Lewis S; AmiGO Hub, ; Web Presence Working Group, :
AmiGO: Online access to ontology and annotation data.
Bioinformatics. 25:288–289. 2009. View Article : Google Scholar : PubMed/NCBI
|
|
20
|
Kanehisa M, Araki M, Goto S, Hattori M,
Hirakawa M, Itoh M, Katayama T, Kawashima S, Okuda S, Tokimatsu T
and Yamanishi Y: KEGG for linking genomes to life and the
environment. Nucleic Acids Res. 36(Database Issue): D480–D484.
2008.PubMed/NCBI
|
|
21
|
Szklarczyk D, Franceschini A, Kuhn M,
Simonovic M, Roth A, Minguez P, Doerks T, Stark M, Muller J, Bork
P, et al: The STRING database in 2011: Functional interaction
networks of proteins, globally integrated and scored. Nucleic Acids
Res. 39(Database Issue): D561–D568. 2011. View Article : Google Scholar : PubMed/NCBI
|
|
22
|
Smoot ME, Ono K, Ruscheinski J, Wang PL
and Ideker T: Cytoscape 2.8: New features for data integration and
network visualization. Bioinformatics. 27:431–432. 2011. View Article : Google Scholar : PubMed/NCBI
|
|
23
|
Bader GD and Hogue CW: An automated method
for finding molecular complexes in large protein interaction
networks. BMC Bioinformatics. 4:22003. View Article : Google Scholar : PubMed/NCBI
|
|
24
|
Lewis BP, Burge CB and Bartel DP:
Conserved seed pairing, often flanked by adenosines, indicates that
thousands of human genes are microRNA targets. Cell. 120:15–20.
2005. View Article : Google Scholar : PubMed/NCBI
|
|
25
|
Wingender E: The TRANSFAC project as an
example of framework technology that supports the analysis of
genomic regulation. Brief Bioinform. 9:326–332. 2008. View Article : Google Scholar : PubMed/NCBI
|
|
26
|
Zhang JF, Chen Y, Lin GS, Zhang JD, Tang
WL, Huang JH, Chen JS, Wang XF and Lin ZX: High IFIT1 expression
predicts improved clinical outcome, and IFIT1 along with MGMT more
accurately predicts prognosis in newly diagnosed glioblastoma. Hum
Pathol. 52:136–144. 2016. View Article : Google Scholar : PubMed/NCBI
|
|
27
|
Squitieri F, Cannella M, Sgarbi G,
Maglione V, Falleni A, Lenzi P, Baracca A, Cislaghi G, Saft C,
Ragona G, et al: Severe ultrastructural mitochondrial changes in
lymphoblasts homozygous for Huntington disease mutation. Mech
Ageing Dev. 127:217–220. 2006. View Article : Google Scholar : PubMed/NCBI
|
|
28
|
Bayram-Weston Z, Stone TC, Giles P,
Elliston L, Janghra N, Higgs GV, Holmans PA, Dunnett SB, Brooks SP
and Jones L: Similar striatal gene expression profiles in the
striatum of the YAC128 and HdhQ150 mouse models of Huntington's
disease are not reflected in mutant Huntingtin inclusion
prevalence. BMC Genomics. 16:10792015. View Article : Google Scholar : PubMed/NCBI
|
|
29
|
Jordanovski D, Herwartz C, Pawlowski A,
Taute S, Frommolt P and Steger G: The hypoxia-inducible
transcription factor ZNF395 is controlled by IκB kinase-signaling
and activates genes involved in the innate immune response and
cancer. PLoS One. 8:e749112013. View Article : Google Scholar : PubMed/NCBI
|
|
30
|
Ellrichmann G, Reick C, Saft C and Linker
RA: The role of the immune system in Huntington's disease. Clin Dev
Immunol. 2013:5412592013. View Article : Google Scholar : PubMed/NCBI
|
|
31
|
Zhu J, Zhang Y, Ghosh A, Cuevas RA, Forero
A, Dhar J, Ibsen MS, Schmid-Burgk JL, Schmidt T, Ganapathiraju MK,
et al: Antiviral activity of human OASL protein is mediated by
enhancing signaling of the RIG-I RNA sensor. Immunity. 40:936–948.
2014. View Article : Google Scholar : PubMed/NCBI
|
|
32
|
Kwan W, Träger U, Davalos D, Chou A,
Bouchard J, Andre R, Miller A, Weiss A, Giorgini F, Cheah C, et al:
Mutant huntingtin impairs immune cell migration in Huntington
disease. J Clin Invest. 122:4737–4747. 2012. View Article : Google Scholar : PubMed/NCBI
|
|
33
|
McDermott JE, Archuleta M, Thrall BD,
Adkins JN and Waters KM: Controlling the response: Predictive
modeling of a highly central, pathogen-targeted core response
module in macrophage activation. PLoS One. 6:e146732011. View Article : Google Scholar : PubMed/NCBI
|
|
34
|
MacNair L, Xiao S, Miletic D, Ghani M,
Julien JP, Keith J, Zinman L, Rogaeva E and Robertson J: MTHFSD and
DDX58 are novel RNA-binding proteins abnormally regulated in
amyotrophic lateral sclerosis. Brain. 139:86–100. 2016. View Article : Google Scholar : PubMed/NCBI
|
|
35
|
Tauffenberger A, Chitramuthu BP, Bateman
A, Bennett HP and Parker JA: Reduction of polyglutamine toxicity by
TDP-43, FUS and progranulin in Huntington's disease models. Hum Mol
Genet. 22:782–794. 2013. View Article : Google Scholar : PubMed/NCBI
|
|
36
|
de Rivero Vaccari JP, Brand FJ III,
Sedaghat C, Mash DC, Dietrich WD and Keane RW: RIG-1 receptor
expression in the pathology of Alzheimer's disease. J Neuroinflam.
11:672014. View Article : Google Scholar
|
|
37
|
Oudshoorn D, van Boheemen S,
Sánchez-Aparicio MT, Rajsbaum R, Garcia-Sastre A and Versteeg GA:
HERC6 is the main E3 ligase for global ISG15 conjugation in mouse
cells. PLoS One. 7:e298702012. View Article : Google Scholar : PubMed/NCBI
|
|
38
|
Wang RG, Kaul M and Zhang DX:
Interferon-stimulated gene 15 as a general marker for acute and
chronic neuronal injuries. Sheng Li Xue Bao. 64:577–583.
2012.PubMed/NCBI
|
|
39
|
Desai SD, Reed RE, Babu S and Lorio EA:
ISG15 deregulates autophagy in genotoxin-treated ataxia
telangiectasia cells. J Biol Chem. 288:2388–2402. 2013. View Article : Google Scholar : PubMed/NCBI
|
|
40
|
Nicolas CS, Amici M, Bortolotto ZA,
Doherty A, Csaba Z, Fafouri A, Dournaud P, Gressens P, Collingridge
GL and Peineau S: The role of JAK-STAT signaling within the CNS.
JAKSTAT. 2:e229252013.PubMed/NCBI
|
|
41
|
Fu MH, Li CL, Lin HL, Tsai SJ, Lai YY,
Chang YF, Cheng PH, Chen CM and Yang SH: The potential regulatory
mechanisms of miR-196a in Huntington's disease through
bioinformatic analyses. PLoS One. 10:e01376372015. View Article : Google Scholar : PubMed/NCBI
|
|
42
|
Ruvkun G: The perfect storm of tiny RNAs.
Nat Med. 14:1041–1045. 2008. View Article : Google Scholar : PubMed/NCBI
|
|
43
|
Krichevsky AM, King KS, Donahue CP,
Khrapko K and Kosik KS: A microRNA array reveals extensive
regulation of microRNAs during brain development. RNA. 9:1–1281.
2003. View Article : Google Scholar : PubMed/NCBI
|
|
44
|
Berezikov E, Thuemmler F, van Laake LW,
Kondova I, Bontrop R, Cuppen E and Plasterk RH: Diversity of
microRNAs in human and chimpanzee brain. Nat Genet. 38:1375–1377.
2006. View
Article : Google Scholar : PubMed/NCBI
|
|
45
|
Kozlowska E, Krzyzosiak WJ and Koscianska
E: Regulation of huntingtin gene expression by
miRNA-137,-214,-148a, and their respective isomiRs. Int J Mol Sci.
14:16999–17016. 2013. View Article : Google Scholar : PubMed/NCBI
|
|
46
|
Sinha M, Ghose J, Das E and Bhattarcharyya
NP: Altered microRNAs in STHdh(Q111)/Hdh(Q111) cells: miR-146a
targets TBP. Biochem Biophys Res Commun. 396:742–747. 2010.
View Article : Google Scholar : PubMed/NCBI
|
|
47
|
Ban JJ, Chung JY, Lee M, Im W and Kim M:
MicroRNA-27a reduces mutant hutingtin aggregation in an in vitro
model of Huntington's disease. Biochem Biophys Res Commun.
488:316–321. 2017. View Article : Google Scholar : PubMed/NCBI
|
|
48
|
Sheng J, Luo C, Jiang Y, Hinds PW, Xu Z
and Hu GF: Transcription of angiogenin and ribonuclease 4 is
regulated by RNA polymerase III elements and a CCCTC binding factor
(CTCF)-dependent intragenic chromatin loop. J Biol Chem.
289:12520–12534. 2014. View Article : Google Scholar : PubMed/NCBI
|
|
49
|
Li S, Sheng J, Hu JK, Yu W, Kishikawa H,
Hu MG, Shima K, Wu D, Xu Z, Xin W, et al: Ribonuclease 4 protects
neuron degeneration by promoting angiogenesis, neurogenesis, and
neuronal survival under stress. Angiogenesis. 16:387–404. 2013.
View Article : Google Scholar : PubMed/NCBI
|
|
50
|
Fay A, Misulovin Z, Li J, Schaaf CA, Gause
M, Gilmour DS and Dorsett D: Cohesin selectively binds and
regulates genes with paused RNA polymerase. Curr Biol.
21:1624–1634. 2011. View Article : Google Scholar : PubMed/NCBI
|
|
51
|
Li S, Yu W and Hu GF: Angiogenin inhibits
nuclear translocation of apoptosis inducing factor in a
Bcl-2-dependent manner. J Cell Physiol. 227:1639–1644. 2012.
View Article : Google Scholar : PubMed/NCBI
|
|
52
|
Johnson R and Buckley NJ: Gene
dysregulation in Huntington's disease: REST, microRNAs and beyond.
Neuromolecular Med. 11:183–199. 2009. View Article : Google Scholar : PubMed/NCBI
|
|
53
|
Das E, Jana NR and Bhattacharyya NP:
MicroRNA-124 targets CCNA2 and regulates cell cycle in
STHdh(Q111)/Hdh(Q111) cells. Biochem Biophys Res Commun.
437:217–224. 2013. View Article : Google Scholar : PubMed/NCBI
|
|
54
|
Ben Haim L, Ceyzériat K, Carrillo-de
Sauvage MA, Aubry F, Auregan G, Guillermier M, Ruiz M, Petit F,
Houitte D, Faivre E, et al: The JAK/STAT3 pathway is a common
inducer of astrocyte reactivity in Alzheimer's and Huntington's
diseases. J Neurosci. 35:2817–2829. 2015. View Article : Google Scholar : PubMed/NCBI
|