Introduction
Recent studies in the field of liver regeneration
have focused on how pattern recognition receptors and a variety of
molecules are activated after partial hepatectomy (PH) (1,2).
Transmembrane and ubiquitin-like domain containing protein 1
(Tmub1), also named hepatocyte odd protein shuttling (HOPS)/DULP,
is a key factor regulating liver-specific biological events, such
as protein synthesis during liver regeneration, by binding to
elongation factor eEF-1A (3).
Tmub1 contains 3 transmembrane domains, a ubiquitin-like (UBL)
domain and a nuclear export signal (NLS) that are critical during
hepatocyte proliferation (4).
Tmub1 is upregulated in the regenerating liver (3) and is actively exported from the
nucleus in dividing cells but predominantly located in the nucleus
during growth arrest (5).
Ubiquitylation is the major mechanism of protein degradation via
the proteasome and can be regarded as a posttranslational
modification (6), and some UBLs
domain-containing proteins such as SUMO have demonstrated crosstalk
with ubiquitylation (7). The
functions of Tmub1 have been reported to be involved in a wide
range of cellular processes not only in regenerating liver cells
but also in other tissues. For instance, Tmub1 is involved in the
IL-6-induced proliferation pathway in the liver (8), regulates locomotor activity and
wakefulness by interacting with calcium modulating ligand (CAMLG)
(9), and facilitates the recycling
of the AMPAR subunit GluR2 to the cell surface in the mouse brain
(10). Tmub1 is also an essential
component of the centrosome assembly during the cell cycle
(5). However, the physiological
and molecular functions of Tmub1 are far from being clear at the
whole-gene transcriptional profiling level. The aim of this study
was to investigate the influence of Tmub1 expression on the
transcriptional profile and its possible roles in the cell cycle in
the rat hepatocyte cell line BRL-3A. Our data showed that Tmub1 is
primarily a cell cycle-related regulatory protein in rat
hepatocytes.
Materials and methods
Antibodies
Specific rabbit anti-rat polyclonal antibodies to
Tmub1 (no. ab180586), cyclin D1 (no. ab134175) and GAPDH (no.
ab181602) were provided by Abcam (Cambridge, MA, UK). The rabbit
anti-rat polyclonal cyclin A2 antibody (no. GTX103042) was provided
by GeneTex Inc. (Irvine, CA, US). Rabbit anti-rat polyclonal cyclin
B1 (no. wl01760) and cyclin E1 (no. wl01072) antibodies were
provided by Wanleibio Inc. (Shenyang, China). HRP-conjugated
secondary goat anti-mouse (no. SA00001-1) and goat anti-rabbit (no.
SA00001-2) antibodies were provided by Proteintech Inc. (Rosemont,
IL, US). All the primary antibodies above were used at a 1:1,000
dilution with a secondary antibody at a 1:5,000 dilution for
western blot analysis.
Cell culture and cell cycle
synchronization
Normal rat hepatocyte cells (BRL-3A; Cell Bank of
Chinese Academy of Sciences, Shanghai, China) were maintained in
Dulbecco's modified Eagle's medium (Invitrogen; Thermo Fisher
Scientific, Inc., Waltham, MA, USA) containing 10% fetal bovine
serum (Invitrogen; Thermo Fisher Scientific, Inc.), 100 U/ml
penicillin, and 100 µg/ml streptomycin, and cultured in a
humidified atmosphere of 5% CO2 at 37°C. For G1 phase
synchronization, cells were grown in FBS-free medium for 48 h. For
S phase synchronization, cells were grown in the presence of 2 mM
thymidine for 18 h, washed twice with PBS and released into
thymidine-free media for 6–8 h, and finally grown again for 12 h in
the presence of 2 mM thymidine. For M phase synchronization, cells
were grown in the presence of 330 nM nocodazole for 18 h. Release
from the arrest were accomplished by 2 washes with PBS followed by
growth in fresh medium (11).
Construction of Tmub1 recombinant
lentiviral vectors
The Tmub1 overexpression and knockdown recombinant
lentiviral vectors were constructed and purchased from Shanghai
GeneChem Co., Ltd. (Shanghai, China). Full length of rat Tmub1
complementary DNA was cloned into GV287 vector (GeneChem, Co.,
Ltd.) and the resulting vector was designated as flag-Tmub1. The
knockdown lentiviral vector GV115 (GeneChem, Shanghai, Co., Ltd.)
was constructed with the following shRNA sequence:
GGTCTCAACACATACGACTGA. Negative control lentiviral vectors were
constructed in both the overexpression and knockdown lentiviral
vectors.
Microarrays and computational
analysis
BRL-3A cells were divided into five groups and
cultured as follows: Tmub1 overexpression lentivirus-transduced
[Lv-Tmub1(+)], Tmub1 knockdown lentivirus-transduced [Lv-Tmub1(−)],
Lv-Tmub1(+)-Negative Control, Lv-Tmub1(−)-Negative Control and
normal control. The cells were harvested 48 h post-infection and
total RNA for microarray analysis was extracted using an extraction
reagent (TRIzol; Invitrogen). Then, complementary DNA was
synthesized and labeled before it was purified and hybridized to
the microarray (Arraystar, Rockville, MD). The microarray scanning
data were extracted using Agilent Feature Extraction software. The
quantile normalization and subsequent data processing were
performed using the GeneSpring GX v12.1 software package (Agilent
Technologies). Overlapped differentially expressed genes with at
least a 2.5-fold-change in either direction were considered to be
up- or downregulated. Hierarchical clustering was conducted based
on differentially expressed mRNAs using Multiple Experiment Viewer
(MeV) v4.6 software. Gene Ontology (GO) (12) and pathway analyses were applied to
determine the roles of these differentially expressed mRNAs in the
biological GO terms or pathways. The functional analysis of the
differentially expressed genes was performed using GO and the KEGG
pathway database (13) with the
online tool DAVID (http://david.abcc.ncifcrf.gov/home.jsp) (14). The protein interaction network and
nodes were determined based on the number of connections between
differentially expressed mRNAs using STRING (http://string.embl.de) and the open source software
platform Cytoscape_v3.2.1 (National Institute of General Medical
Sciences, USA) (15). The
microarray data were deposited in NCBI Gene Expression Omnibus and
are accessible through GEO series accession number GSE97040.
Reverse transcription-quantitative
polymerase chain reaction (RT-qPCR)
Total RNA was extracted from the cells using an
extraction reagent (TRIzol; Invitrogen; Thermo Fisher Scientific,
Inc.). The reverse transcription was performed with PrimeScript™ RT
reagent Kit with gDNA Eraser (Takara Biotechnology Co., Ltd.,
Dalian, China) according to the manufacturer's instructions, and
PCR amplification reactions were performed with SYBR®
Premix Ex Taq™ II (Takara Biotechnology Co., Ltd.) according to the
manufacturer's instructions. Primers for qPCR are listed in
Table I. The relative
quantification of the mRNA levels was normalized to the rat GAPDH
(glyceraldehyde-3-phosphate dehydrogenase) levels and calculated
with the ΔΔCq method (16).
 | Table I.Sequences of primers for RT-qPCR
assays. |
Table I.
Sequences of primers for RT-qPCR
assays.
| Gene | Forward primer | Reverse primer |
|---|
| AURKB |
5′-CGGATGCATAATGAGATGGTAGAT-3′ |
5′-TCCCCACCATCAGTTCATAGC-3′ |
| MCM5 |
5′-GTTCCTGGGAACAGGGTCAC-3′ |
5′-CATCTGGGAGCCAGAACCATC-3′ |
| INCENP |
5′-GGACTGGAATCGGAGTGGTC-3′ |
5′-TCTCCTCAACAACAGCACCC-3′ |
| Ns5atp9 |
5′-GCAAAAAGGCATCGGGGAAT-3′ |
5′-TCAGGTTGCAAAGGACATGC-3′ |
| TTK |
5′-AGGCTGATAAAGAGTCACCACC-3′ |
5′-GCTTCTGGGGCCATGTAGTT-3′ |
| STAT1 |
5′-AACGGTCCCAAAATGGAGGT-3′ |
5′-TGTAGGGCTCAACAGCATGG-3′ |
| SERPINE |
5′-GTGGTTCGGCACAATCCAAC-3′ |
5′-TGCTGAGTGAAGGCGTAGTG-3′ |
| VEGFA |
5′-TTCGTCCAACTTCTGGGCTC-3′ |
5′-GCTTTCTGCTCCCCTTCTGT-3′ |
| NOS2 |
5′-TGGTGAAAGCGGTGTTCTTTG-3′ |
5′-CTTATACTGTTCCATGCAGACAACCTT-3′ |
| Pla2g2a |
5′-CATGGCCTTTGGCTCAATTCAGGT-3′ |
5′-ACAGTCATGAGTCACACAGCACCA-3′ |
| CCNA2 |
5′-GTCAACCCCGAAAAAGTGGC-3′ |
5′-GGGGTGATTCAAAACTACCATCC-3′ |
| Rrm2 |
5′-TTTGTCCCCTTGCCATTA-3′ |
5′-GCAGTGACCATCAAGCAAG-3′ |
| Sirt1 |
5′GAATTCTTAACCAGCATTGGGAACTTTAGC-3′ |
5′GGATCCTTGGAGGAAGATAATCCAGTCA-3′ |
| MCM3 |
5′-TGTCTCGGTTTGACCTGCTC-3′ |
5′-TCCAGTGTCCGTGCTGTAAC-3′ |
| PLK4 |
5′-AGGGAAGCTAGGCACTTCATG-3′ |
5′-GGAAGACCACCTTTTGAC-3′ |
| GAPDH |
5′-GCCATCAACGACCCCTTCATT-3′ |
5′-CGCCTGCTTCACCACCTTCTT-3′ |
Western blot analysis
Cells were collected and then lysed in 2X SDS
(sodium dodecyl sulfate) sample buffer [100 mM Tris-HCl, pH 6.8, 10
mM EDTA (ethylene diamine tetraacetic acid), 4% SDS, and 10%
glycine] and were then separated by 10% sodium dodecyl
sulfate-polyacrylamide gel electrophoresis, with 30 µg of protein
in each lane, at 70 V for 30 min and then 90 V for 90 min. Then,
the proteins were transferred onto PVDF (polyvinylidene fluoride)
membranes for 1.5 h at 300 mA. After blocking in 5% non-fat milk
for 1 h at room temperature, the membranes were incubated with the
indicated primary antibodies at 4°C overnight and horseradish
peroxidase-conjugated secondary antibodies at room temperature for
2 h. The GAPDH protein was used as a loading control.
Flow cytometry analysis
After 48 h of infection, cells were collected and
then fixed in 75% ethanol. Then, the fixed cells were resuspended
in propidium iodide/RNase/PBS buffer and incubated in the dark
(37°C, 30 min). The cells were then passed through a flow cytometer
(FACSCalibur; BD Biosciences, San Diego, CA, USA) equipped with a
488-nm argon laser to measure the DNA content. The data analysis
was performed with the appropriate ModFit LT 2.0 software (Verity
Software House, Topsham, ME, USA).
Co-immunoprecipitation
First, 107 cells were collected and lysed
with 500 µl of cell lysis buffer (20 mM Tris (pH 7.5), 150 mM NaCl
and 1% Triton X-100 with sodium pyrophosphate, β-glycerophosphate,
EDTA, Na3VO4 and leupeptin) containing 1:50 protease inhibitor
cocktail and 1:50 phosphatase inhibitor cocktail. Next, 60 µl of
SureBeads™ protein G magnetic beads (no. 1614023; Bio-Rad
Laboratories, Inc., Hercules, CA, USA) were incubated with 3 µg of
antibody on a rotating platform for 30 min at room temperature and
then incubated with 500 µl of (1 mg) cell lysate and rotated
overnight at 4°C. The IP products were eluted by 40 µl of 1X
Laemmli buffer and incubated for 10 min at 95°C. Western blot
analysis was used for the subsequent protein detection.
5-Ethynyl-20-deoxyuridine (EdU)
assays
BRL-3A cells were seeded onto 24-well plates.
Twenty-four h later, the BRL-3A cells were infected with either
Lv-Tmub1 (+), Lv-Tmub1 (−) or NC vectors accordingly. Forty-eight h
after infection, the cell proliferation was determined in
vitro via the EdU DNA Proliferation in Detection kit (Nanjing
KeyGen Biotech Co., Ltd., Nanjing, China) based on the
manufacturer's instructions.
Cell Counting Kit-8 (CCK-8) assay
Cells were seeded at a concentration of
103/ml with 5 replicates in a 96-well plate and cultured
overnight. On the following day, the cell viability was measured by
the CCK-8 (Dojindo Molecular Technologies, Inc., Kumamoto, Japan).
A volume of 10 µl of CCK-8 solution was added to each well at 0,
24, 48, or 72 h after culture. The cells were incubated at 37°C for
2 h, and the absorbance values at 450 nm were measured using an
enzyme-linked analyzer (Thermo Fisher Scientific, Inc.).
Statistical analysis
All experimental data were analyzed by Graphad Prism
5.1 (GraphPad Software, Inc., La Jolla, CA, USA) or SPSS version 19
(IBM Corp., Armonk, NY, USA). Data were presented as the mean ± SD
of three independent experiments. Statistical analyses shown in the
figures were performed using t-tests or one-way analysis of
variance with least significant difference post hoc tests. All
graphs were plotted by the use of Graphad Prism 5.1 (GraphPad
Software, Inc.). P<0.05 was considered to indicate a
statistically significant difference.
Results
Transcriptional profiling in Tmub1
overexpressed or knockdown BRL-3A cells
We analyzed the mRNA expression profiles of cells
infected with lentivirus either overexpressing or knocking down
Tmub1 and of normal control BRL-3A cells (Tmub1 expression were
shown in Fig. 1D). The microarray
analysis identified 836 differentially expressed genes that were
either up- or downregulated, and 127 node genes were screened by
STRING. The GO and KEGG pathway analysis using the DAVID database
demonstrated that the top five regulated GO categories targeted by
Tmub1 overexpression and knockdown were response to cellular
process, biological regulation, regulation of biological process,
response to stimulus, and regulation of cellular process. The most
significant pathway of the differentially expressed genes was cell
cycle pathway (Fig. 1C). The node
gene network was screened by the number of interaction edges by
Cytoscape software (Fig. 1B), and
the clustering analysis showed distinct trends in the expression of
node genes and key node genes among the 5 groups (Fig. 1A). Seventeen key node genes were
identified, and RT-qPCR analysis confirmed the microarray data
(Fig. 1E). These data demonstrated
the close relation among Tmub1 and the cell cycle related
genes.
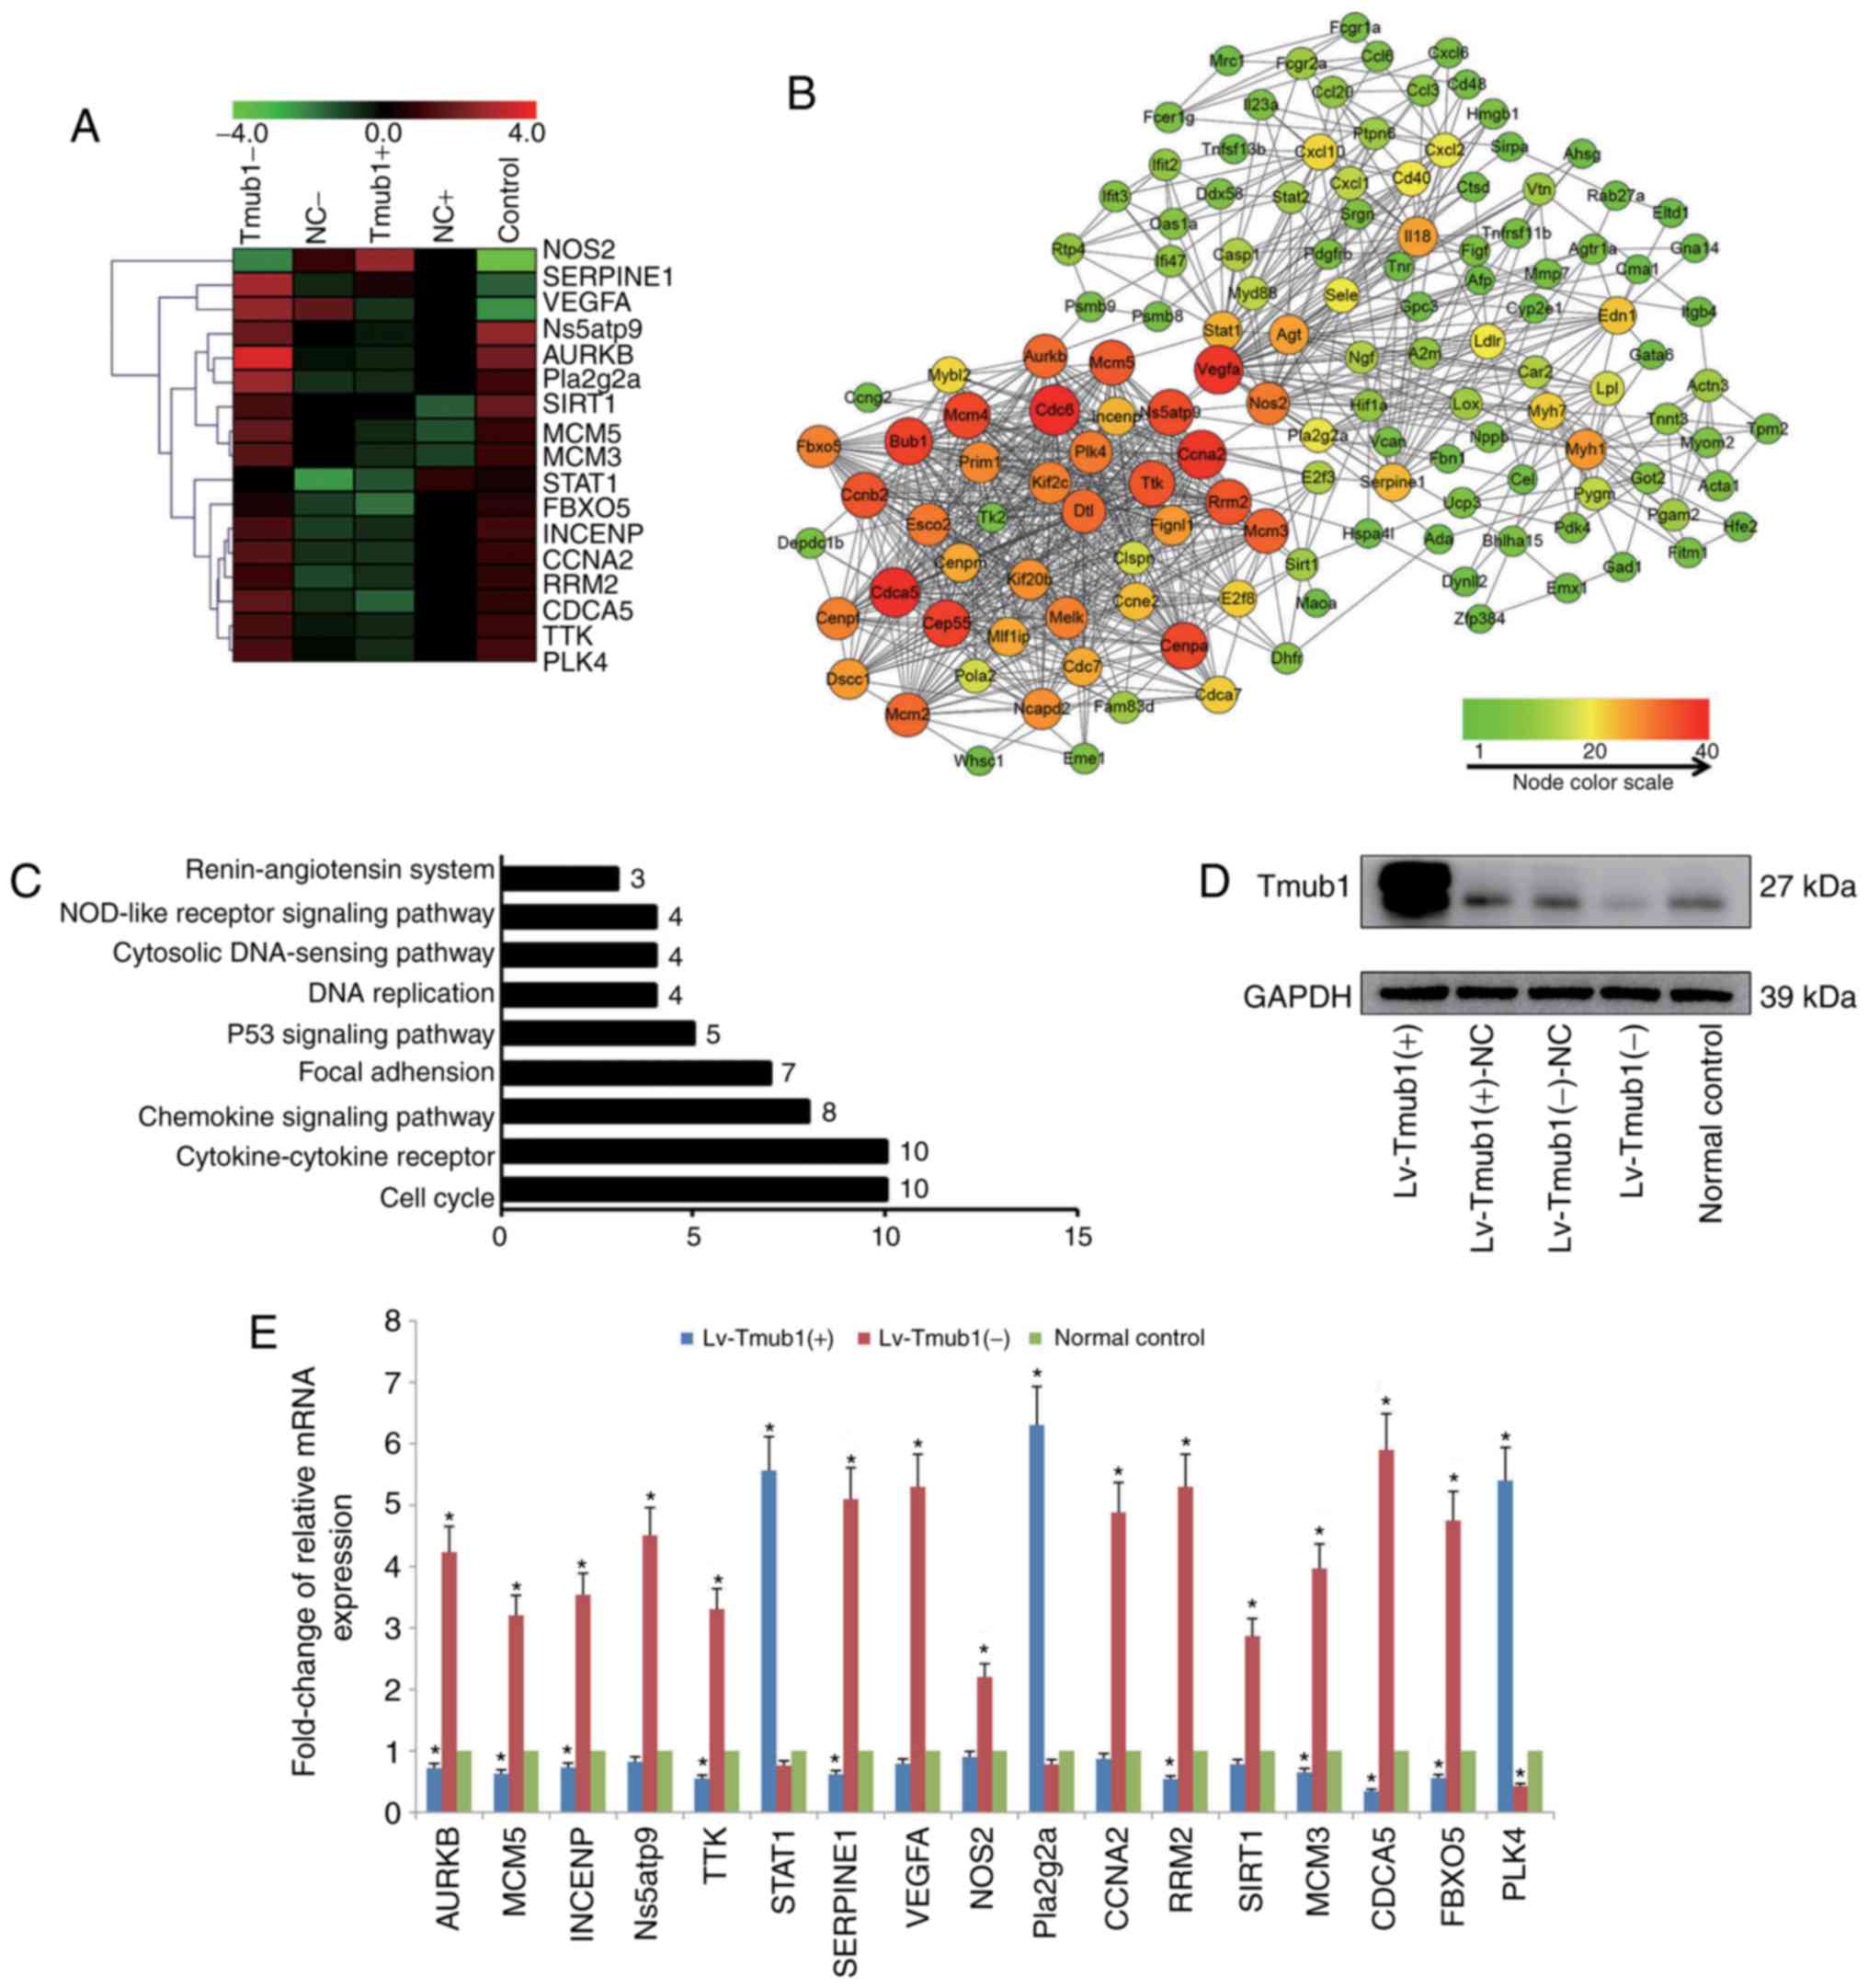 | Figure 1.Differentially expressed genes after
Tmub1 overexpression or knockdown. (A) Hierarchical clustering of
Tmub1-, NC-, Tmub1+, NC+ and control BRL-3A cells (columns) and 17
key node genes (rows). Up-regulated genes were marked in red and
down-regulated genes were marked in green. (B) Network of node
genes. The differentially expressed genes after Tmub1
overexpression or knockdown were subjected to STRING (http://string.embl.de) to screen the node genes,
network of node genes was demonstrated by software Cytoscape
v3.2.1. The color brightness and shape size of nodes were
determined by the number of interaction edges. (C) Counts of
diffident genes in KEGG pathways analysis by the DAVID database.
(D) Tmub1 protein expression by Western blotting assay. Cell
lysates were collected 2 days after lentivirus vector infection.
(E) Reverse transcription-quantitative polymerase chain reaction
validation of 17 key node genes. The results were normalized to the
GAPDH values for each gene, samples were normalized to the normal
control. The fold-changes were shown as mean ± standard deviation
in three independent experiments. Compared with control group,
statistically significant differences were determined by one-way
analysis of variance with least significant difference post hoc
test, indicated as: *P<0.05 vs. the normal control. Tmub1,
transmembrane and ubiquitin-like domain containing protein 1; NC,
normal control; KEGG, Kyoto Encyclopedia of Genes and Genomes;
DAVID, Database for Annotation, Visualization, and Integrated
Discovery. |
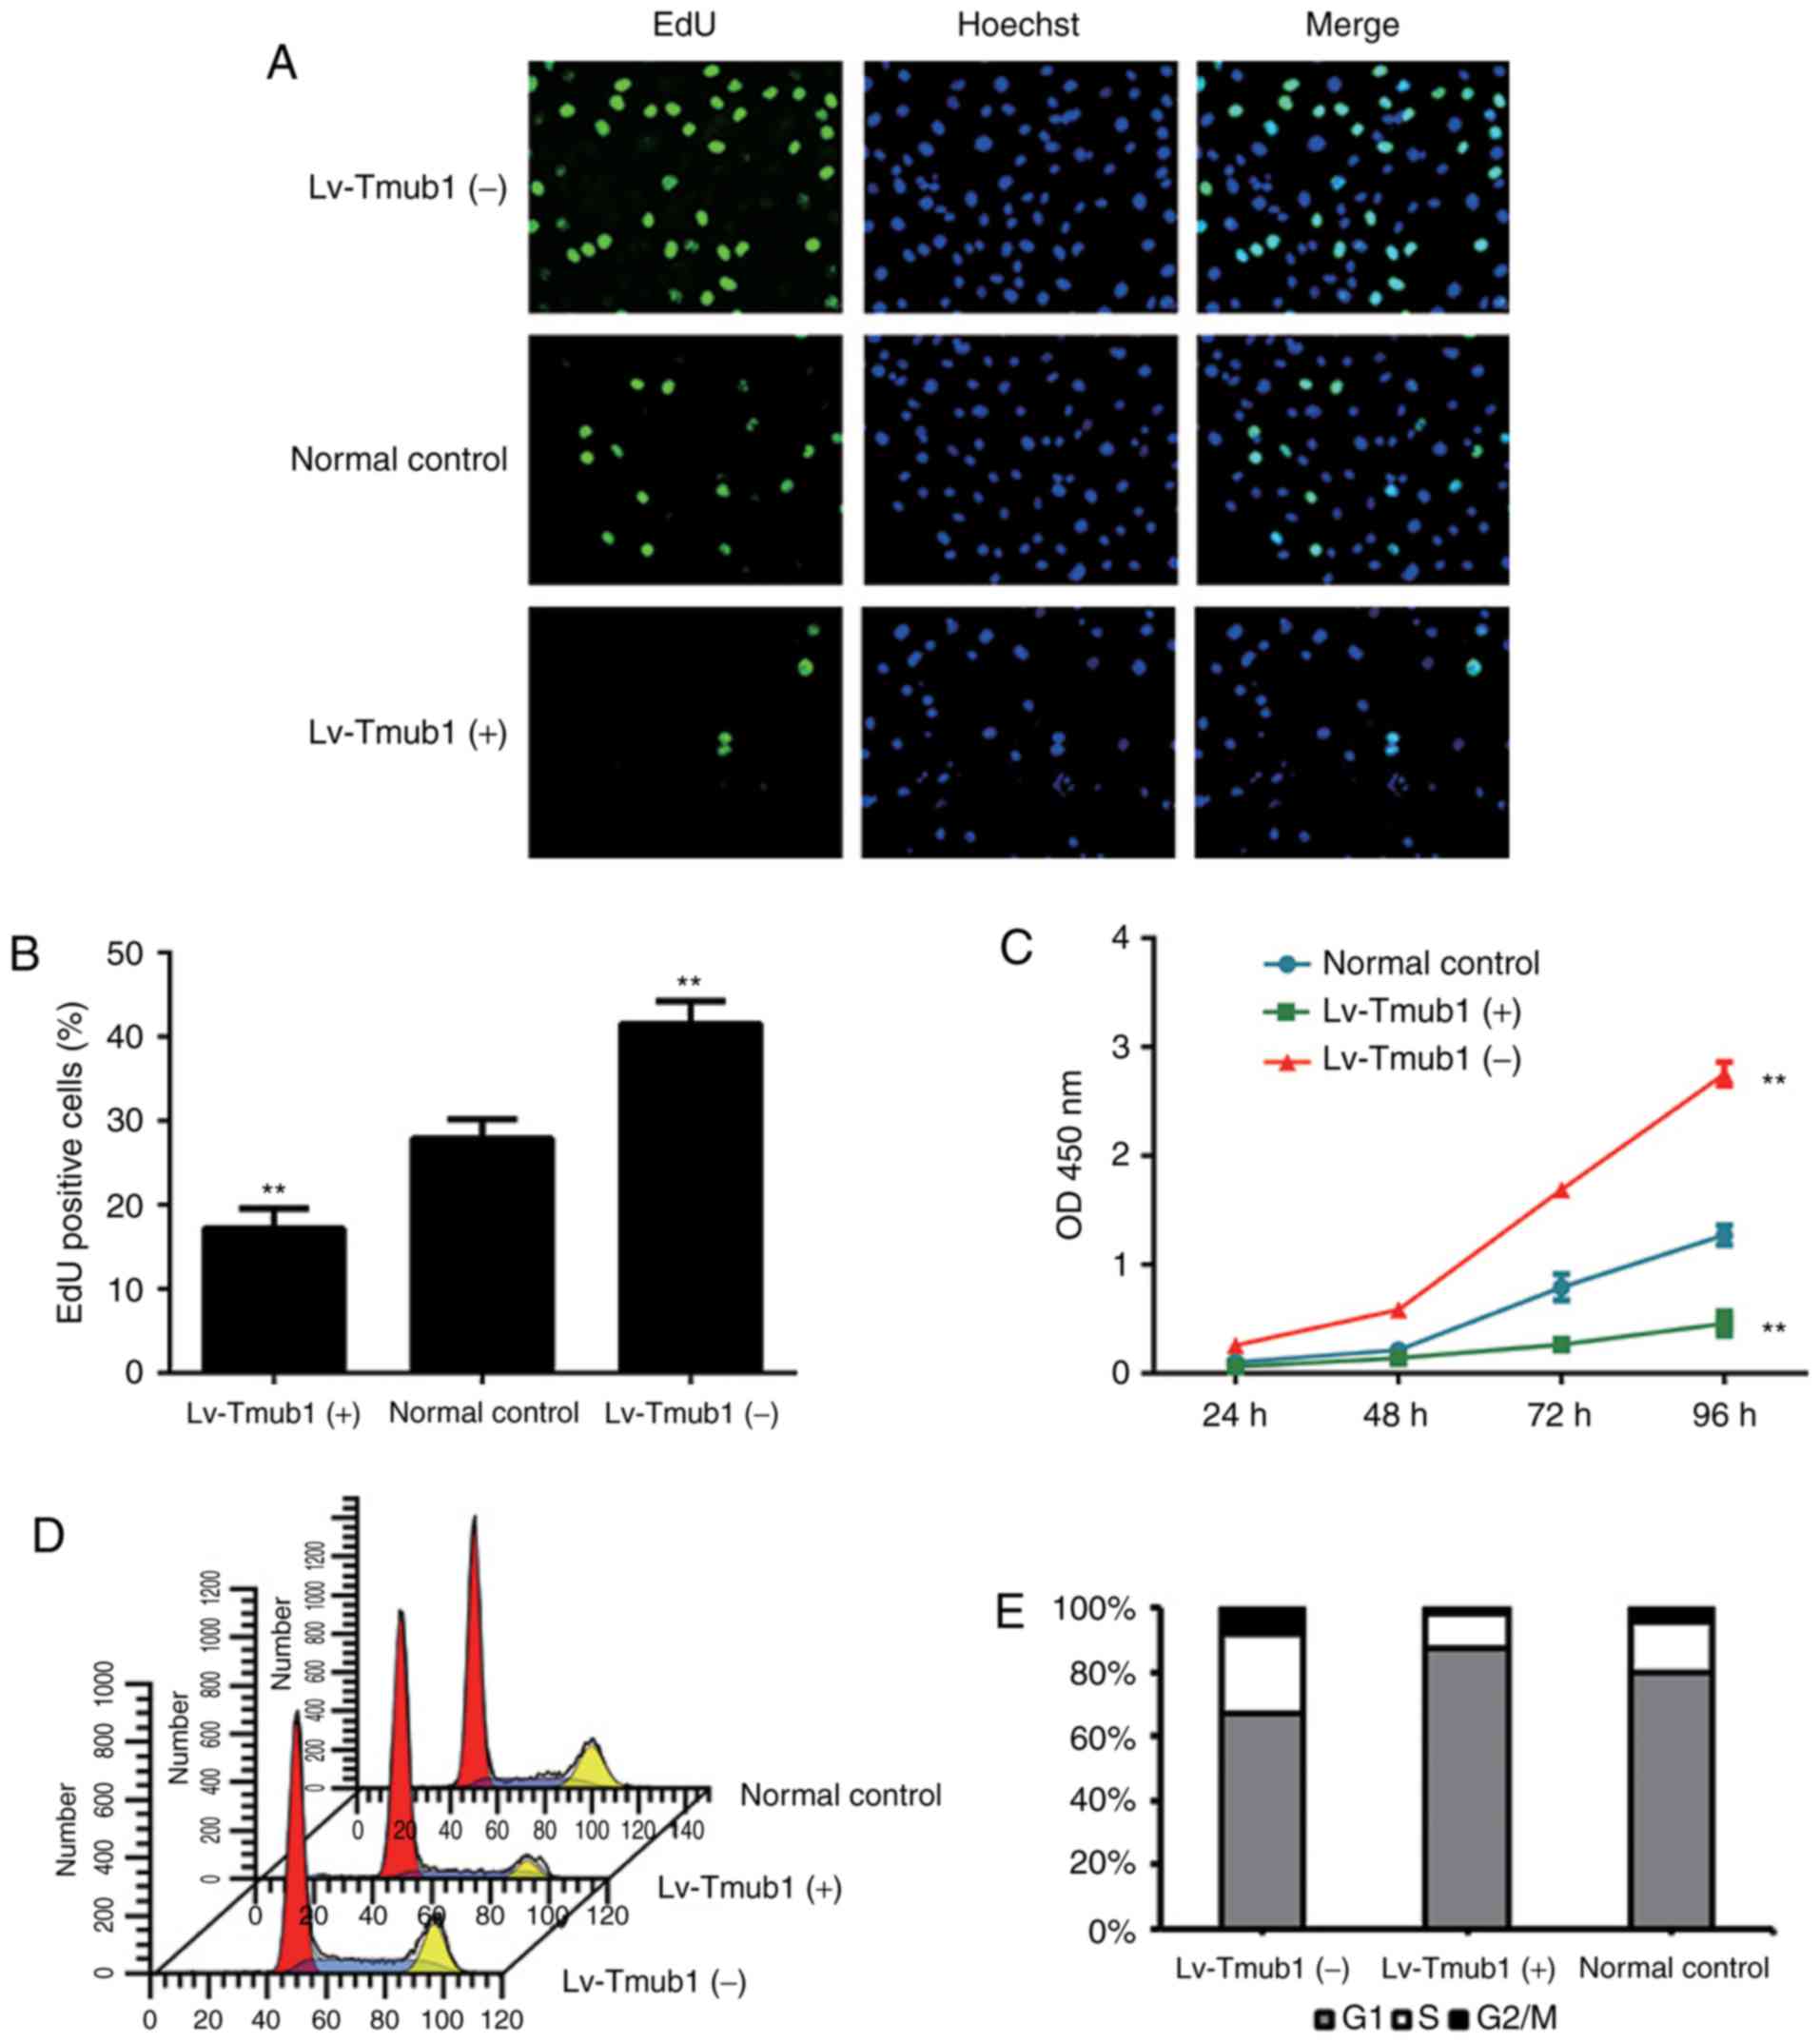
Tmub1 is a negative regulator of the
cell cycle and proliferation in hepatocyte cells
In order to investigate whether Tmub1 influences
cell proliferation in BRL-3A cells, we conducted EdU and CCK-8
assays. The results showed that, compared to the normal control
group, The cell proliferation rate of Lv-Tmub1 (−) cells was
significantly higher and the cell proliferation rate of Lv-Tmub1
(+) cells was significantly lower (Fig. 2A-C). These findings demonstrated
that Tmub1 has a negative impact on the BRL-3A cell
proliferation.
In order to investigate how the cell cycle pathway
was affected by Tmub1 expression, cell cycle analysis were
conducted. The proportion cells in S phase of the Lv-Tmub1 (−)
group increased significantly compared to that of the Lv-Tmub1 (+)
and normal control groups, while the proportion of cells in G1
phase decreased significantly; the proportion of Lv-Tmub1 (+) cells
in G1 phase increased significantly, while the proportion of cells
in S phase decreased significantly (Fig. 2D and E). These results indicated
that Tmub1 may affect the G1/S phase transition.
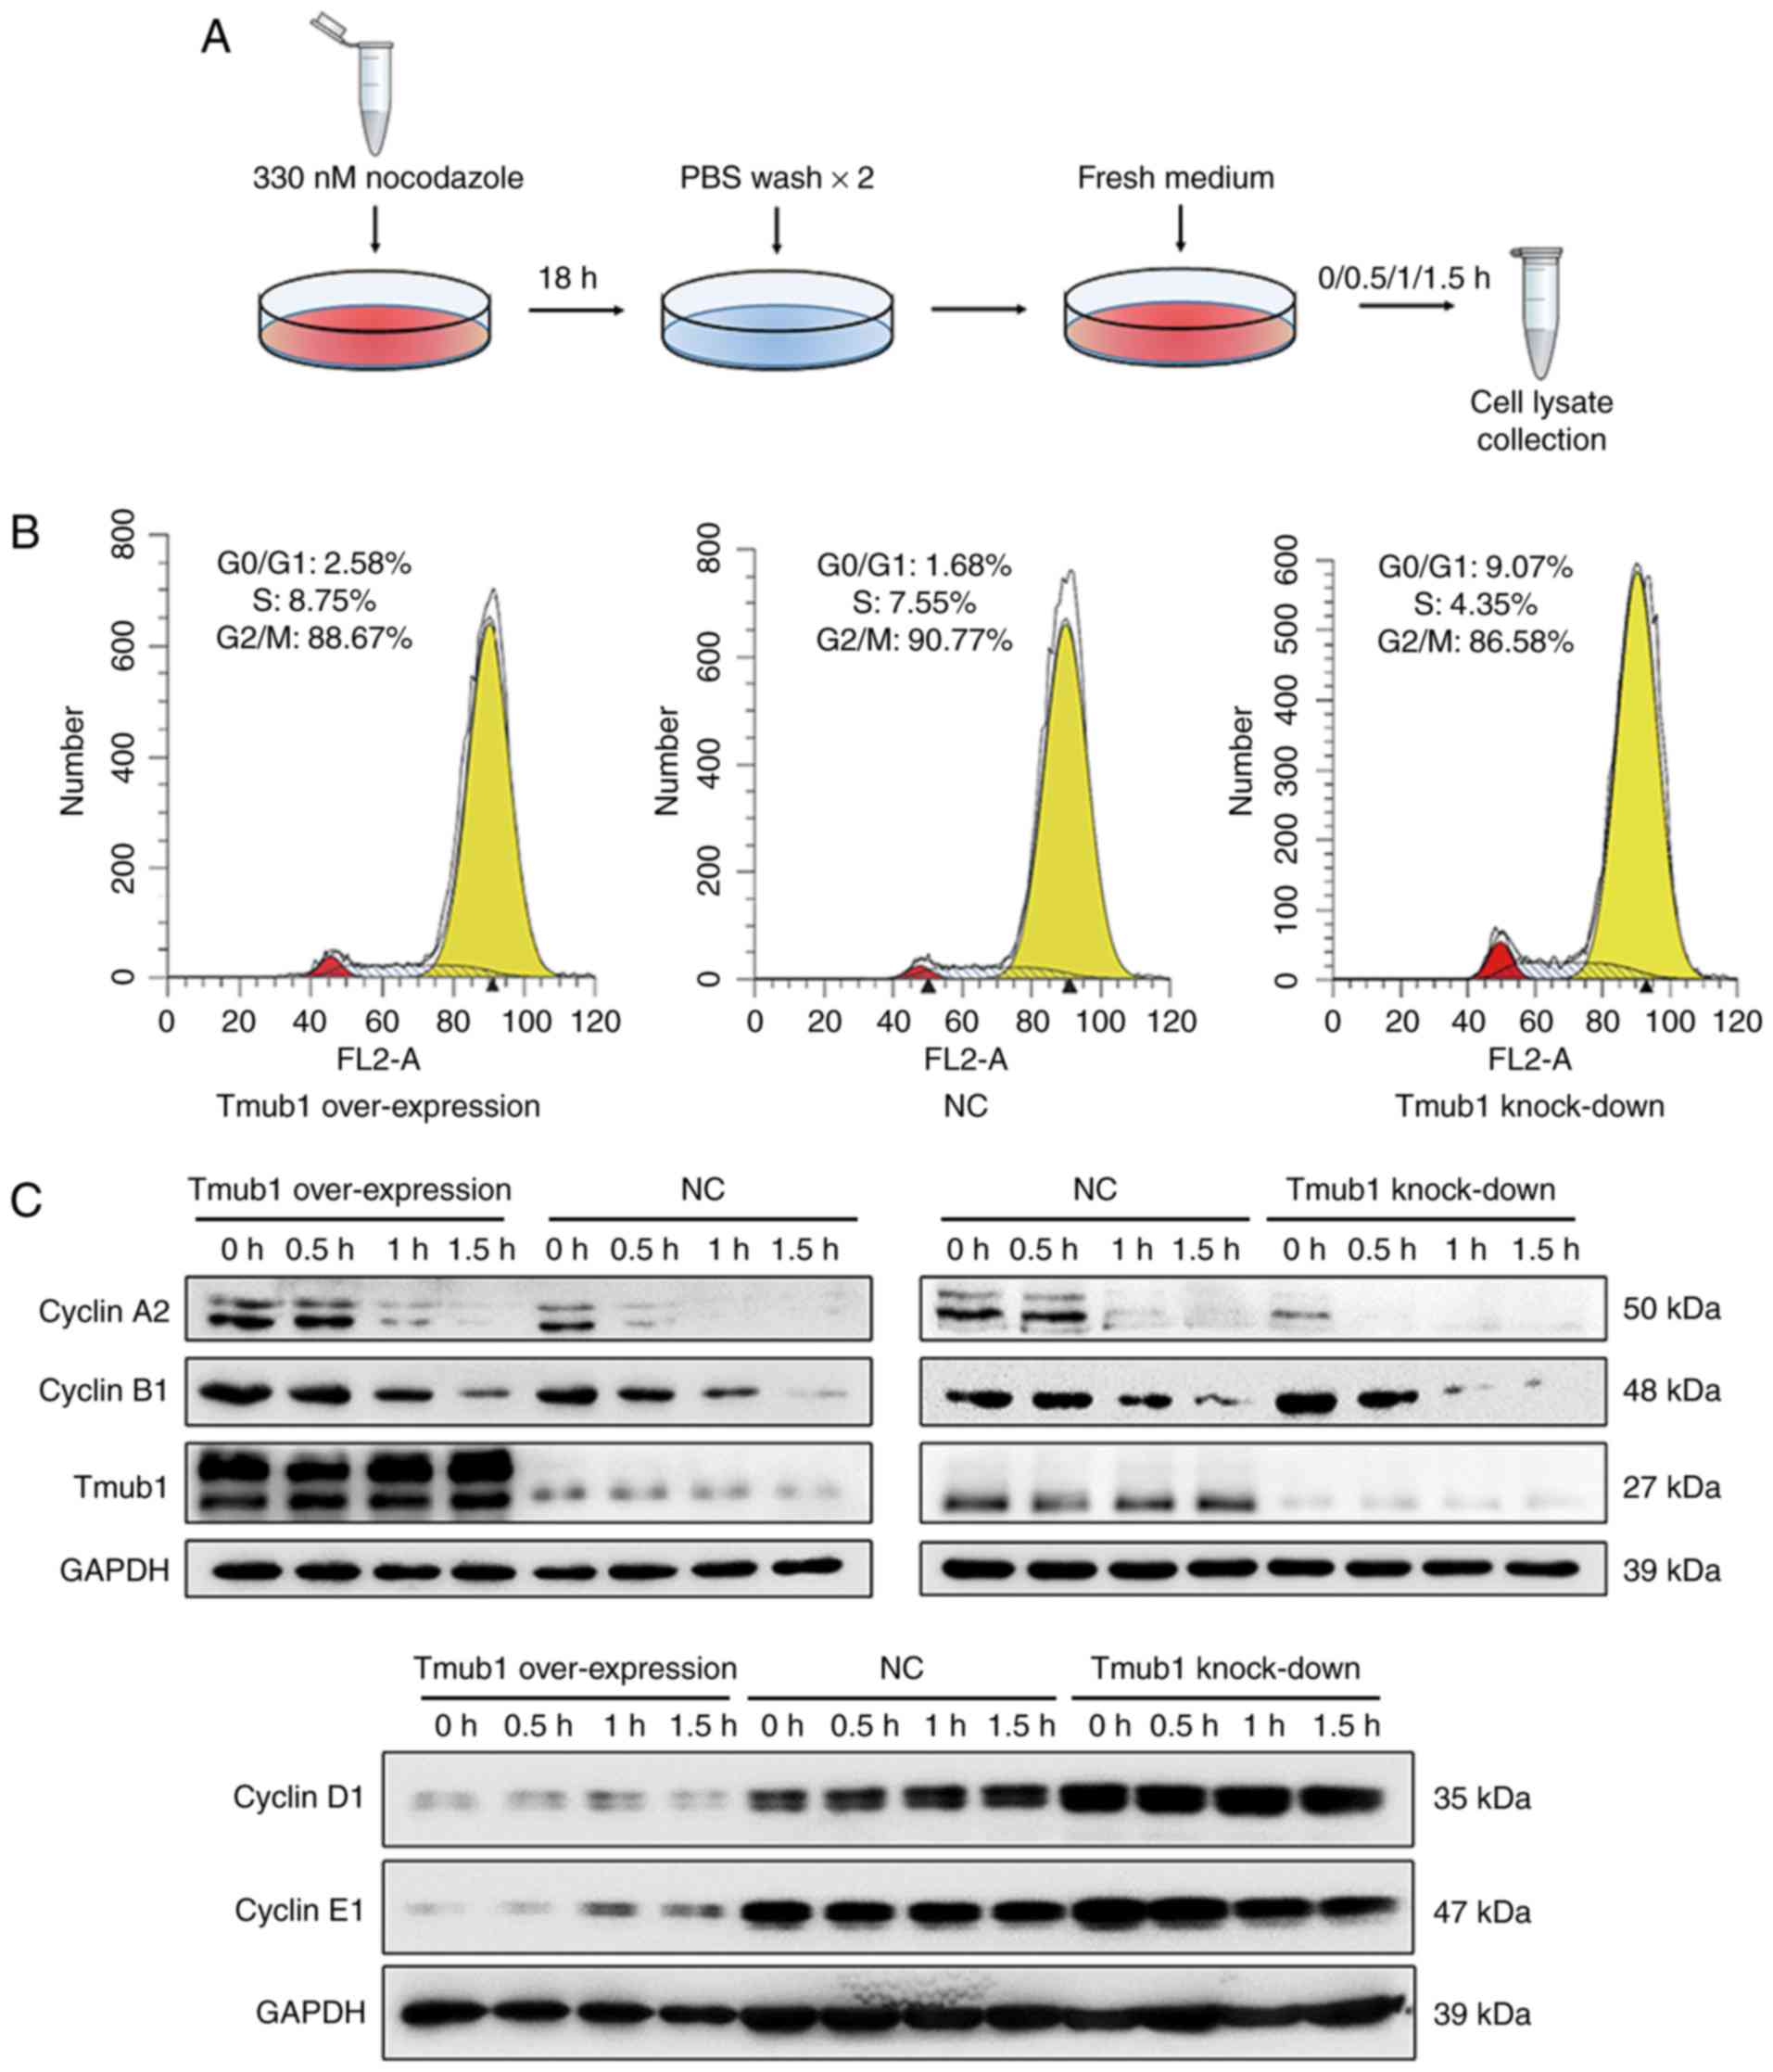
Tmub1 interacts with cyclin A2 in the
cell cycle
Cyclin A plays important roles in the G1/S and G2/M
transitions. Cyclin A-CDK2 complexes are active through S phase,
while cyclin A-CDC2 and cyclin B-CDC2 complexes are active during
the G2 and M phases (17). Cyclin
A and cyclin B1 must be degraded in M phase for a proper G2/M
transition (18). To investigate
the possible relationship between Tmub1 and cell cycle cyclins in M
phase, Lv-Tmub1 (+), Lv-Tmub1(−) and normal control BRL-3A cells
were synchronized in M phase by nocodazole treatment (Fig. 3A, the synchronization efficiency of
all cell groups were shown in Fig.
3B) and then lysed 0, 0.5, 1, 1.5 h after being released from
the arrest. The expression of cyclin A2, cyclin B1, cyclin D1 and
cyclin E1 was detected by Western blot analysis. In
Tmub1-overexpressing BRL-3A cells, the level of cyclin A2 remained
high at 1 h, while the cyclin A2 level in the negative control
cells significantly dropped at 1 h. In contrast, the cyclin A2
level in the Tmub1-knockdown BRL-3A cells dropped even earlier. The
same result was observed for cyclin B1, which indicated that Tmub1
may inhibit cyclin A2 and cyclin B1 degradation in M phase
(Fig. 3C, upper panel). The
expression patterns of cyclin D1 and cyclin E1 showed no difference
between the three groups, However, the results showed that the
expression of cyclin D1 and cyclin E1 was negatively associated
with that of Tmub1 (Fig. 3C, lower
panel).
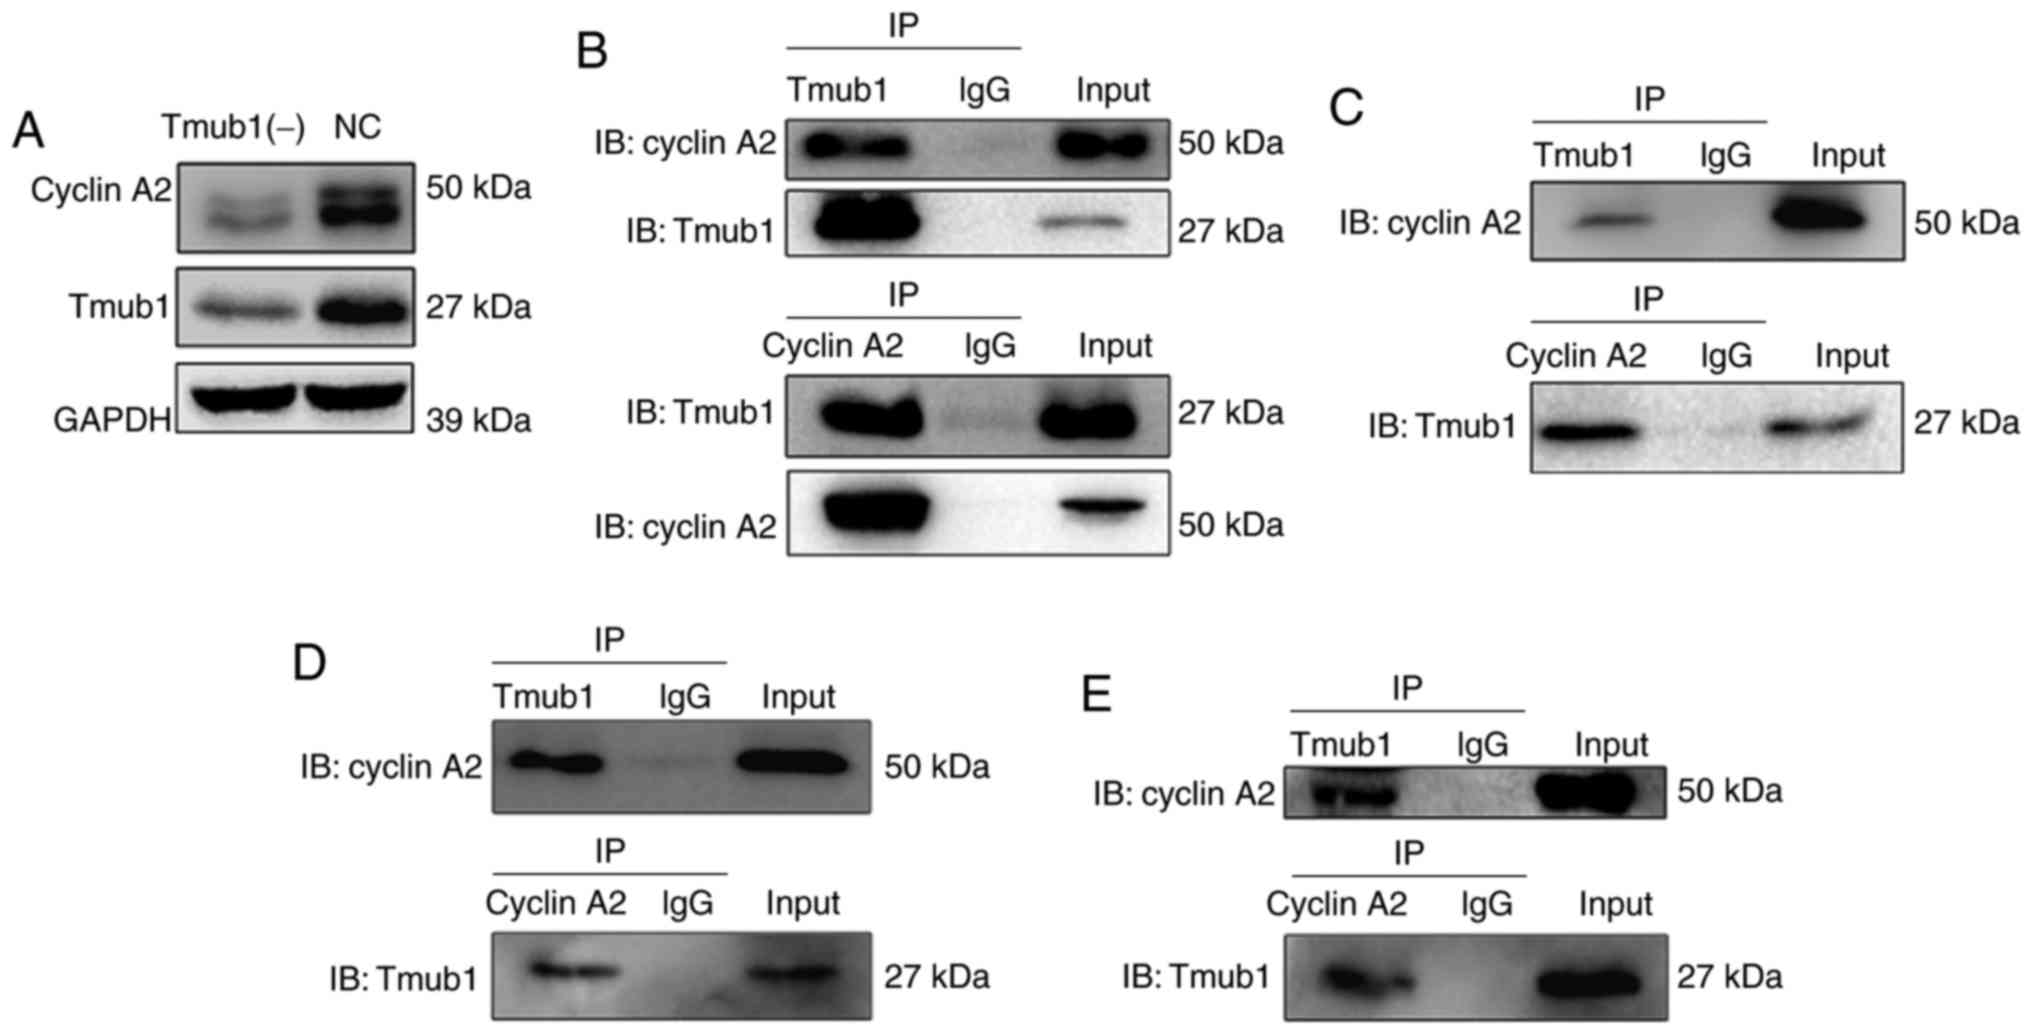
Next, we conducted co-immunoprecipitation assays to
examine the possible interaction between Tmub1 and cyclins A2, B1,
D1 and E1. Interestingly, Only cyclin A2 showed the possible
interaction with Tmub1 (Fig. 4B).
Further cell cycle synchronization and co-immunoprecipitation
assays were conducted to explore the phases in which Tmub1 and
cyclin A2 specifically interact. As shown in Fig. 4C-E, Tmub1 bound to cyclin A2 in G1,
S and M phases. These results indicated that the interaction
between Tmub1 and cyclin A2 may be close throughout the cell cycle,
Tmub1 may interact with Cyclin A2 for both G1/S transition and M
phase progression. The results in Fig.
4A show that cyclin A2 expression was significantly lower in
the Tmub1-knockdown BRL-3A cells, indicating that Tmub1 may
function as a positive regulator of cyclin A2 during the cell
cycle.
Discussion
Tmub1 was first described as a hepatocyte shuttling
protein that is ubiquitously expressed and moves between the
nucleus and cytoplasm. However, the studies on Tmub1 in the past
decade since its discovery are scattered and the main biological
function of Tmub1 still has not been revealed yet. Within the
nucleus of resting cells, Tmub1 overexpression causes cell cycle
arrest in G0/G1, and Tmub1 knockdown causes centrosome
hyperamplification, leading to multinucleated cells and the
formation of micronuclei (5).
Recent studies have indicated that the Tmub1 gene was overexpressed
in cultured primary neurons (9).
Tmub1 acts as a bridge in the NPM and p19Arf interaction,
indicating the possible ability to oppose tumor cell proliferation
(4). Our previous study shows that
IL-6 is the upstream regulator of Tmub1, and Tmub1 knockdown
synergizes with IL-6 in inducing hepatocyte proliferation (8). Moreover, C/EBPβ is a key
transcription factor involved in the regulation of Tmub1 expression
(19). To investigate the role of
Tmub1 in the cell cycle, whether Tmub1 functions as a key
transcriptional regulatory molecule of the cell cycle-related genes
is the first question to be answered.
In this study, stable liver cells (Tmub1 gene
overexpression or knockdown) were used to study the influence of
Tmub1 expression on the genome-wide transcriptional profile by mRNA
microarray analysis. By comparing these gene expression profiles to
that of the normal rat liver cell line BRL-3A, 836 differentially
expressed genes (up- or downregulated) with 127 node genes were
identified. These data demonstrated that overexpression or
knockdown of Tmub1 may affect the expression of many genes with
important functions in regenerating liver cells. Further pathway
analysis identified pathways with important roles in the regulation
of cellular proliferation and the cell cycle (20–24).
Among the node genes, 17 key node genes (AURKB, MCM5, INCENP,
Ns5atp9, TTK, STAT1, SERPINE1, VEGFA, NOS2, Pla2g2a, CCNA2, RRM2,
SIRT1, MCM3, CDCA5, FBXO5, and PLK4) were screened and validated by
RT-qPCR, and because most of these genes are related to the cell
cycle (25–30), Tmub1 may be a crucial regulatory
protein in the cell cycle-regulating network.
Many proteins regulating cell cycle transitions and
progression through checkpoints have been studied in the past few
decades (31). Among these
proteins, cyclin-CDK complexes are basic regulators of cell cycle
progression (32). Cyclins A and B
play a central role in the control of mitosis, with cyclin A being
degraded in prometaphase before cyclin B in metaphase by the
ubiquitin-proteasome-system or autophagy (33). Mammalian cells have two types of
cyclins As; cyclin A1 is specifically expressed in the testis,
while cyclin A2 ubiquitously expressed. Accordingly, cyclin A2 is
usually linked to cell proliferation and as such is often found
expressed at a high level in human cancers (34). Cyclin A also mediates the
progression through S phase by forming the CDK2-cyclin A complex
(35). P21 binds and inactivates
cyclin-CDK complexes that mediate G1/S progression, resulting in
the lack of phosphorylation of Rb, E2F sequestration and cell cycle
arrest at the G1/S transition (36). Our findings indicated that Tmub1
may participate in the G1/S transition and S phase progression by
interacting with cyclin A2 and may delay cyclin A2 and cyclin B
degradation in M phase, which strongly suggested that Tmub1 is a
cell cycle-associated protein.
In addition to the canonical ubiquitylation pathway,
proteins can also be modified through attachment to ubiquitin-like
proteins (UBLs), which have conserved ubiquitin-like sequences and
control different types of biological processes (37,38).
Although UBLs are found to have diverse roles in various processes,
the studies on the functions of many members in this family are
only beginning. As a ubiquitin-like protein, Tmub1 was found to
mediate the ubiquitylation and degradation of the HMG-CoA reductase
HMGCR (39). In this process,
Tmub1 bridges SPFH2 to a membrane-bound ubiquitin ligase gp78 in
endoplasmic reticulum membranes. Our results showed that Tmub1 may
inhibit the degradation of cyclin A2 and B1, indicating that Tmub1
may play different roles in ubiquitylation by interacting with
different proteins. Therefore, the question of how Tmub1 functions
as an ubiquitin-like protein remains to be answered. The UBL domain
of Tmub1 may contribute to the posttranslational modification of
several cell cycle proteins, and Tmub1 may function as an
‘effector’ in the complicated and precise network of cell cycle
regulation. In further studies, we intend to investigate how Tmub1
regulates cell cycle proteins, specifically focusing on the
interaction between Tmub1 and cyclin A2, and the possible
regulatory role of Tmub1 in cyclin ubiquitylation and
degradation.
In conclusion, our study identified Tmub1 as a cell
cycle-associated protein. Tmub1 regulates gene expression, inhibits
hepatocyte proliferation and affects the cell cycle by interacting
with cyclins.
Acknowledgements
This study was supported by the National Natural
Science Foundation of China (grant number: 81270523).
Glossary
Abbreviations
Abbreviations:
|
Tmub1
|
transmembrane and ubiquitin-like
domain containing protein 1
|
|
Lv
|
lentiviral vectors
|
|
GO
|
gene ontology
|
|
KEGG
|
kyoto encyclopedia of genes and
genomes
|
|
DAVID
|
database for annotation,
visualization, and integrated discovery
|
|
IP
|
immunoprecipitation
|
References
|
1
|
Riehle KJ, Dan YY, Campbell JS and Fausto
N: New concepts in liver regeneration. J Gastroenterol Hepatol. 26
Suppl 1:S203–S212. 2011. View Article : Google Scholar
|
|
2
|
Fausto N, Campbell JS and Riehle KJ: Liver
regeneration. J Hepatol. 57:692–694. 2012. View Article : Google Scholar : PubMed/NCBI
|
|
3
|
Della Fazia MA, Castelli M, Bartoli D,
Pieroni S, Pettirossi V, Piobbico D, Viola-Magni M and Servillo G:
HOPS: A novel cAMP-dependent shuttling protein involved in protein
synthesis regulation. J Cell Sci. 118:3185–3194. 2005. View Article : Google Scholar : PubMed/NCBI
|
|
4
|
Castelli M, Pieroni S, Brunacci C,
Piobbico D, Bartoli D, Bellet MM, Colombo E, Pelicci PG, Della
Fazia MA and Servillo G: Hepatocyte odd protein shuttling (HOPS) is
a bridging protein in the nucleophosmin-p19 Arf network. Oncogene.
32:3350–3358. 2013. View Article : Google Scholar : PubMed/NCBI
|
|
5
|
Pieroni S, Della Fazia MA, Castelli M,
Piobbico D, Bartoli D, Brunacci C, Bellet MM, Viola-Magni M and
Servillo G: HOPS is an essential constituent of centrosome
assembly. Cell Cycle. 7:1462–1466. 2008. View Article : Google Scholar : PubMed/NCBI
|
|
6
|
Herrmann J, Lerman LO and Lerman A:
Ubiquitin and ubiquitin-like proteins in protein regulation. Circ
Res. 100:1276–1291. 2007. View Article : Google Scholar : PubMed/NCBI
|
|
7
|
Eifler K and Vertegaal AC: Mapping the
SUMOylated landscape. FEBS J. 282:3669–3680. 2015. View Article : Google Scholar : PubMed/NCBI
|
|
8
|
Liu M, Liu H, Wang X, Chen P and Chen H:
IL-6 induction of hepatocyte proliferation through the
Tmub1-regulated gene pathway. Int J Mol Med. 29:1106–1112.
2012.PubMed/NCBI
|
|
9
|
Zhang W, Savelieva KV, Suwanichkul A,
Small DL, Kirkpatrick LL, Xu N, Lanthorn TH and Ye GL:
Transmembrane and ubiquitin-like domain containing 1 (Tmub1)
regulates locomotor activity and wakefulness in mice and interacts
with CAMLG. PLoS One. 5:e112612010. View Article : Google Scholar : PubMed/NCBI
|
|
10
|
Yang H, Takagi H, Konishi Y, Ageta H,
Ikegami K, Yao I, Sato S, Hatanaka K, Inokuchi K, Seog DH and Setou
M: Transmembrane and ubiquitin-like domain-containing protein 1
(Tmub1/HOPS) facilitates surface expression of GluR2-containing
AMPA receptors. PLoS One. 3:e28092008. View Article : Google Scholar : PubMed/NCBI
|
|
11
|
Cedeno C, La Monaca E, Esposito M and
Gutierrez GJ: Detection and analysis of cell cycle-associated
APC/C-mediated cellular ubiquitylation in vitro and in vivo.
Methods Mol Biol. 1449:251–265. 2016. View Article : Google Scholar : PubMed/NCBI
|
|
12
|
Ashburner M, Ball CA, Blake JA, Botstein
D, Butler H, Cherry JM, Davis AP, Dolinski K, Dwight SS, Eppig JT,
et al: Gene ontology: Tool for the unification of biology. The gene
ontology consortium. Nat Genet. 25:25–29. 2000. View Article : Google Scholar : PubMed/NCBI
|
|
13
|
Kanehisa M and Goto S: KEGG: Kyoto
encyclopedia of genes and genomes. Nucleic Acids Res. 28:27–30.
2000. View Article : Google Scholar : PubMed/NCBI
|
|
14
|
Huang DW, Sherman BT and Lempicki RA:
Bioinformatics enrichment tools: Paths toward the comprehensive
functional analysis of large gene lists. Nucleic Acids Res.
37:1–13. 2009. View Article : Google Scholar : PubMed/NCBI
|
|
15
|
Shannon P, Markiel A, Ozier O, Baliga NS,
Wang JT, Ramage D, Amin N, Schwikowski B and Ideker T: Cytoscape: A
software environment for integrated models of biomolecular
interaction networks. Genome Res. 13:2498–2504. 2003. View Article : Google Scholar : PubMed/NCBI
|
|
16
|
Livak KJ and Schmittgen TD: Analysis of
relative gene expression data using real-time quantitative PCR and
the 2(-Delta Delta C(T)) method. Methods. 25:402–408. 2001.
View Article : Google Scholar : PubMed/NCBI
|
|
17
|
Coller HA: What's taking so long? S-phase
entry from quiescence versus proliferation. Nat Rev Mol Cell Biol.
8:667–670. 2007. View
Article : Google Scholar : PubMed/NCBI
|
|
18
|
van Leuken R, Clijsters L and Wolthuis R:
To cell cycle, swing the APC/C. Biochim Biophys Acta. 1786:49–59.
2008.PubMed/NCBI
|
|
19
|
Liu M, Yuan T, Liu H and Chen P:
CCAAT/enhancer-binding protein β regulates interleukin-6-induced
transmembrane and ubiquitin-like domain containing 1 gene
expression in hepatocytes. Mol Med Rep. 10:2177–2183. 2014.
View Article : Google Scholar : PubMed/NCBI
|
|
20
|
Vansaun MN, Mendonsa AM and Lee Gorden D:
Hepatocellular proliferation correlates with inflammatory cell and
cytokine changes in a murine model of nonalchoholic fatty liver
disease. PLoS One. 8:e730542013. View Article : Google Scholar : PubMed/NCBI
|
|
21
|
Chiu YS, Wei CC, Lin YJ, Hsu YH and Chang
MS: IL-20 and IL-20R1 antibodies protect against liver fibrosis.
Hepatology. 60:1003–1014. 2014. View Article : Google Scholar : PubMed/NCBI
|
|
22
|
Liu W, Li X, Chu ES, Go MY, Xu L, Zhao G,
Li L, Dai N, Si J, Tao Q, et al: Paired box gene 5 is a novel tumor
suppressor in hepatocellular carcinoma through interaction with p53
signaling pathway. Hepatology. 53:843–853. 2011. View Article : Google Scholar : PubMed/NCBI
|
|
23
|
Mirzayans R, Pollock S, Scott A, Gao CQ
and Murray D: Metabolic labeling of human cells with tritiated
nucleosides results in activation of the ATM-dependent p53
signaling pathway and acceleration of DNA repair. Oncogene.
22:5562–5571. 2003. View Article : Google Scholar : PubMed/NCBI
|
|
24
|
Marra F and Tacke F: Roles for chemokines
in liver disease. Gastroenterology. 147:577–594.e1. 2014.
View Article : Google Scholar : PubMed/NCBI
|
|
25
|
Malumbres M and Barbacid M: Cell cycle,
CDKs and cancer: A changing paradigm. Nat Rev Cancer. 9:153–166.
2009. View
Article : Google Scholar : PubMed/NCBI
|
|
26
|
Magatti M, De Munari S, Vertua E and
Parolini O: Amniotic membrane-derived cells inhibit proliferation
of cancer cell lines by inducing cell cycle arrest. J Cell Mol Med.
16:2208–2218. 2012. View Article : Google Scholar : PubMed/NCBI
|
|
27
|
Uren AG, Wong L, Pakusch M, Fowler KJ,
Burrows FJ, Vaux DL and Choo KH: Survivin and the inner centromere
protein INCENP show similar cell-cycle localization and gene
knockout phenotype. Curr Biol. 10:1319–1328. 2000. View Article : Google Scholar : PubMed/NCBI
|
|
28
|
Li K, Ma Q, Shi L, Dang C, Hong Y, Wang Q,
Li Y, Fan W, Zhang L and Cheng J: NS5ATP9 gene regulated by
NF-kappaB signal pathway. Arch Biochem Biophys. 479:15–19. 2008.
View Article : Google Scholar : PubMed/NCBI
|
|
29
|
Terme M, Pernot S, Marcheteau E, Sandoval
F, Benhamouda N, Colussi O, Dubreuil O, Carpentier AF, Tartour E
and Taieb J: VEGFA-VEGFR pathway blockade inhibits tumor-induced
regulatory T-cell proliferation in colorectal cancer. Cancer Res.
73:539–549. 2013. View Article : Google Scholar : PubMed/NCBI
|
|
30
|
Cho RJ, Huang M, Campbell MJ, Dong H,
Steinmetz L, Sapinoso L, Hampton G, Elledge SJ, Davis RW and
Lockhart DJ: Transcriptional regulation and function during the
human cell cycle. Nat Genet. 27:48–54. 2001. View Article : Google Scholar : PubMed/NCBI
|
|
31
|
Mukherji M, Bell R, Supekova L, Wang Y,
Orth AP, Batalov S, Miraglia L, Huesken D, Lange J, Martin C, et
al: Genome-wide functional analysis of human cell-cycle regulators.
Proc Natl Acad Sci USA. 103:pp. 14819–14824. 2006; View Article : Google Scholar : PubMed/NCBI
|
|
32
|
Bloom J and Cross FR: Multiple levels of
cyclin specificity in cell-cycle control. Nat Rev Mol Cell Biol.
8:149–160. 2007. View
Article : Google Scholar : PubMed/NCBI
|
|
33
|
Loukil A, Zonca M and Rebouissou C:
High-resolution live-cell imaging reveals novel cyclin A2
degradation foci involving autophagy. J Cell Sci. 127:2145–2150.
2014. View Article : Google Scholar : PubMed/NCBI
|
|
34
|
Bendris N, Loukil A, Cheung C, Arsic N,
Rebouissou C, Hipskind R, Peter M, Lemmers B and Blanchard JM:
Cyclin A2: A genuine cell cycle regulator? Biomol Concepts.
3:535–543. 2012. View Article : Google Scholar : PubMed/NCBI
|
|
35
|
Lee RS, Sohn S, Shin KH, Kang MK, Park NH
and Kim RH: Bisphosphonate inhibits the expression of cyclin A2 at
the transcriptional level in normal human oral keratinocytes. Int J
Mol Med. 40:623–630. 2017. View Article : Google Scholar : PubMed/NCBI
|
|
36
|
Besson A, Dowdy SF and Roberts JM: CDK
inhibitors: Cell cycle regulators and beyond. Dev Cell. 14:159–169.
2008. View Article : Google Scholar : PubMed/NCBI
|
|
37
|
Hochstrasser M: Origin and function of
ubiquitin-like proteins. Nature. 458:422–429. 2009. View Article : Google Scholar : PubMed/NCBI
|
|
38
|
Kerscher O, Felberbaum R and Hochstrasser
M: Modification of proteins by ubiquitin and ubiquitin-like
proteins. Annu Rev Cell Dev Biol. 22:159–180. 2006. View Article : Google Scholar : PubMed/NCBI
|
|
39
|
Jo Y, Sguigna PV and DeBose-Boyd RA:
Membrane-associated ubiquitin ligase complex containing gp78
mediates sterol-accelerated degradation of
3-hydroxy-3-methylglutaryl-coenzyme A reductase. J Biol Chem.
286:15022–15031. 2011. View Article : Google Scholar : PubMed/NCBI
|