Introduction
Induced pluripotent stem cells (iPSCs), which are
reverted from somatic cells via nuclear transfer and transcription
factor-based reprogramming, are pluripotent stem cells that are
able to differentiate into all cell types (1). They are successfully derived from
somatic cells through viral transduction using the transcription
factors sex-determining region Y-box 2, octamer-binding
transcription factor 4 (Oct4), and either NANOG and
lineage protein 28 (2) or
c-MYC and Krüppel-like factor 4 (3,4). The
treatment of end-stage liver disease is severely impaired by the
shortage of potential organs, therefore, hepatocellular
transplantation substituting for whole organ transplant may hold
potential as an alternative treatment strategy (5). Similar to embryonic stem cells
(ESCs), iPSCs exhibit pluripotent properties and are able to
differentiate into all cell lineages in vitro, including
hepatocytes, suggesting that iPSCs may be a valuable cell source
for hepatocellular transplantation (6,7).
Several studies have investigated the mechanisms
underlying differentiation of PSCs. The expression of the hepatic
marker albumin has been reported to contribute to the efficient
differentiation of iPSCs to hepatocyte-like cells (8). Transforming growth factor-β has been
revealed to correlate with the differentiation of iPSCs into
functional endothelial cells, whereas the phosphatase and tensin
homolog/Akt pathway targeted by microRNA (miR)-21 can assist the
endothelial differentiation of iPSCs (9). E-cadherin and several other crucial
cell adhesion molecules, including classic cadherins, heparin
sulfate proteoglycans, members of the immunoglobulin (IgG)
superfamily and integrins, have been demonstrated to regulate the
differentiation and survival of human PSCs, including human ESCs
and iPSCs (10,11). Through activating
mesenchymal-to-epithelial transition, hepatocyte nuclear factor 4α
(HNF4A) may be implicated in the generation of hepatocytes
from human ESC-derived hepatoblasts, which may represent a
favorable pathway for the efficient differentiation of human ESCs
and iPSCs into functional hepatocytes (12). Bone morphogenetic protein
(BMP) is regulated by Brachyury and caudal-related homeobox
2 (CDX2), and mainly promotes mouse and human PSC
differentiation to mesoderm, not trophoblasts (13). However, the exact mechanisms
guiding iPSC differentiation into hepatocytes remain to be
elucidated.
Wilson et al (14) investigated the differentially
expressed genes (DEGs) in iPSCs derived from patients with liver
disease and healthy subjects upon in vitro differentiation
to hepatocytes, and identified 419 DEGs at false discovery rate
(FDR) <0.25 and 85 DEGs at FDR<0.1. In the present study,
using the more restrictive thresholds of adjusted P-value, i.e.
FDR<0.01 and |log2fold change (FC)|≥2, the DEGs
between undifferentiated samples and definitive endoderm or early
hepatocyte samples were identified, and their potential functions
were predicted using enrichment analyses. Subsequently, the DEGs
between the two groups were merged, and weighted correlation
network analysis (WGCNA) was performed to identify gene clusters
for the merged DEGs. Furthermore, the protein-protein interaction
(PPI) networks for the DEGs belonging to the significant gene
clusters were constructed, the common genes between the two
comparison groups were identified, and their functional interaction
(FI) network was analyzed.
Materials and methods
Microarray data
The GSE66076 expression profile (http://www.ncbi.nlm.nih.gov/geo/query/acc.cgi?acc=GSE66076)
deposited by Wilson et al (14), was downloaded from the National
Center for Biotechnology Information Gene Expression Omnibus
database, which was based on the GPL6244 [HuGene-1_0-st] Affymetrix
Human Gene 1.0 ST Array [transcript (gene) version] platform. To
study the differentiation mechanisms of iPSCs to hepatocytes, iPSCs
across three stages of hepatic-directed differentiation were
selected from GSE66076, including 3 undifferentiated (T0), 3
definitive endoderm (T5), and 3 early hepatocyte (T24) samples.
Data preprocessing and DEG
screening
Following the download of GSE66076, raw data was
preprocessed with background correction, normalization and
expression calculation by Oligo package (15) in Bioconductor. The org.Hs.eg.db
(16) and
hugene10sttranscriptcluster.db (17) annotation packages were used to
transform probe identifications (IDs) into gene symbols. For one
gene symbol corresponding to several probe IDs, the mean value of
probes was used as the final gene expression value.
The linear models for microarray data (limma)
package (18) in Bioconductor was
applied to identify the DEGs between T0 and T5 or T24 samples. The
P-values for the DEGs were calculated using the t-test method in
the limma package and were then adjusted using the method described
by Benjamini and Hochberg (19).
An FDR<0.01 and |log2FC|≥2 were considered as the
thresholds for significance.
Functional and pathway enrichment
analysis
The ToppGene database (https://toppgene.cchmc.org/) (20) integrates pathway information in
BioSystems [including BioCyc, Kyoto Encyclopedia of Genes and
Genomes (KEGG), REACTOME, WikiPathways], GenMAPP, MSigDB C2
(including BioCarta, SigmaAldrich and Signaling Gateway),
PantherDB, Pathway Ontology and Small Molecule Pathway Database
databases, and can be used for functional and pathway enrichment
analyses. Gene Ontology (GO, http://www.geneontology.org/) describes functions of
genes and their products in molecular function (MF), biological
process (BP) and cellular component (CC) aspects (21). The KEGG (http://www.genome.jp/kegg/) database integrates
chemical, genomic and systemic functional information of biological
systems (22). Combined with the
ToppGene database, GO functional and KEGG pathway enrichment
analyses were carried out for the DEGs between T0 and T5 samples,
as well as those between T0 and T24 samples. An FDR≤0.05 and the
involvement of at least 2 genes were used as the cut-off
criteria.
WGCNA analysis
WGCNA is usually applied for identifying highly
correlated gene clusters, for summarizing the clusters using the
intramodular hub gene or module eigengene, for linking modules to
other modules and to external sample characteristics, and for
calculating module membership measures (23). The DEGs in the T0 vs. T5 and the T0
vs. T24 comparison groups were merged. Subsequently, the WGCNA
package (23) in R was used to
identify gene clusters for the merged DEGs. The clusters with
|Correlation coefficient|>0.8 and P<0.05 were identified as
significant gene clusters.
PPI network construction
The Search Tool for the Retrieval of Interacting
Genes (STRING) database contains easily accessed and uniquely
comprehensive experimental and predicted interaction information
(24). The STRING database
(http://string-db.org/) (24) was used to identify PPI
relationships among the significant gene clusters, and a required
confidence (combined score)>0.7 was set as the cut-off
criterion. Subsequently, the PPI network was visualized using the
Cytoscape software (http://www.cytoscape.org/) (25). The proteins in the network were
represented as nodes, whereas their degrees corresponded to the
number of edges associated with that node.
Common gene analysis
The Venny 2.0 online tool (http://bioinfogp.cnb.csic.es/tools/venny/index.html)
was used to identify the common genes between the two comparison
groups. The gene FI network was constructed by merging interactions
predicted using a machine learning approach with interactions
extracted from human curated pathways (24). ReactomeFI can be used for
network-based data analysis through the highly reliable Reactome FI
network (26). According to the
expression profiles data, the ReactomeFI plugin (26) in Cytoscape was used to analyze the
FI network for the common genes.
Results
DEG analysis
Using a threshold of FDR<0.01 and
|log2FC|≥2, the DEGs between T0 and T5 or T24 samples
were investigated. Compared with T0 samples, 433 (including 268
upregulated and 165 downregulated genes) and 1,342 (including 729
upregulated and 613 downregulated genes) DEGs were identified in
the T5 and T24 samples, respectively.
Functional and pathway enrichment
analysis
The upregulated genes in T5 samples were
significantly enriched in 567 GO_BP terms, 12 GO_CC terms, 29 GO_MF
terms and 7 KEGG pathways. The top 3 functions and pathways are
presented in Table I, including
tissue development (GO_BP, FDR=2.70E-13), extracellular space
(GO_CC, FDR=2.85E-07), molecular transducer activity (GO_MF,
FDR=2.50E-04; which involved HNF4A) and extracellular matrix
organization (pathway, FDR=1.10E-02). Meanwhile, the downregulated
genes in T5 samples were significantly enriched in 3 GO_BP terms
and 15 GO_CC terms, including cell-cell signaling (GO_BP,
FDR=1.20E-02) and synapse (GO_CC, FDR=1.42E-03).
 | Table I.Top 3 functions and pathways enriched
for differentially expressed genes in T5 samples. |
Table I.
Top 3 functions and pathways enriched
for differentially expressed genes in T5 samples.
| Category | ID | Description | FDR | Gene no. | Gene symbol |
|---|
| Upregulated |
|
|
|
|
|
|
GO_BP | GO:0009888 | tissue
development | 2.70E-13 | 72 | HHEX,
ARHGAP24, FOXQ1…… |
|
| GO:0072359 | circulatory system
development | 2.88E-11 | 46 | EPHB3,
HHEX, ARHGAP24…… |
|
| GO:0072358 | cardiovascular
system development | 2.88E-11 | 46 | ADAM19,
GATA4, GATA6…… |
|
GO_CC | GO:0005615 | extracellular
space | 2.85E-07 | 47 | PRSS2,
RELN, ABCA1…… |
|
| GO:0002116 | semaphorin receptor
complex | 2.12E-04 | 4 | NRP2,
NRP1, PLXNA2, PLXNA4 |
|
| GO:0009897 | external side of
plasma membrane | 5.50E-04 | 15 | ABCA1,
DLK1, ITGA5…… |
|
GO_MF | GO:0060089 | molecular
transducer activity | 2.50E-04 | 50 | EPHB3,
ABCA1, WLS…… |
|
| GO:0004871 | signal transducer
activity | 2.50E-04 | 50 | HNF4A,
IL18R1, RXRG…… |
|
| GO:0004872 | receptor
activity | 7.51E-04 | 46 | SORCS1,
FZD4, FZD8…… |
| KEGG
pathway | 119526 | other semaphorin
interactions | 5.42E-03 | 5 | SEMA6D,
PLXNA2, SEMA5A…… |
|
| 576262 | extracellular
matrix organization | 1.10E-02 | 15 | PRSS2,
MATN3, ITGA5…… |
|
| 198832 | adipogenesis | 5.42E-03 | 11 | SPOCK1,
CYP26A1, GATA4…… |
| Downregulated | GO:0007267 | cell-cell
signaling | 1.20E-02 | 28 | SOX2,
LPAR3, SFRP2…… |
|
GO_BP | GO:0007268 | synaptic
transmission | 2.03E-02 | 20 | LPAR3,
CHRNA9, RASGRF2…… |
|
| GO:0045766 | positive regulation
of angiogenesis | 4.82E-02 | 7 | FLT1,
SFRP2, VASH2…… |
|
GO_CC | GO:0045202 | synapse | 1.42E-03 | 18 | NMNAT2,
CHRNA9, GAP43…… |
|
| GO:0097060 | synaptic
membrane | 1.42E-03 | 11 | CHRNA9,
GABRQ, CNKSR2…… |
|
| GO:0045211 | postsynaptic
membrane | 1.42E-03 | 10 | LRRTM3,
VRL3, MET…… |
Upregulated genes in T24 samples were significantly
enriched in 1,145 GO_BP terms, 88 GO_CC terms, 146 GO_MF terms and
142 KEGG pathways. The top 3 functions and pathways are presented
in Table II, including
extracellular matrix organization (GO_BP, FDR=1.39E-21),
extracellular space (GO_CC, FDR=8.05E-44), receptor binding (GO_MF,
FDR=1.16E-11; which involved HNF4A) and complement and
coagulation cascades (pathway, FDR=1.27E-16). Meanwhile,
downregulated genes in T24 samples were significantly enriched in
317 GO_BP terms, 70 GO_CC terms, 41 GO_MF terms and 152 KEGG
pathways. The top 3 functions and pathways are presented in
Table II, including cell cycle
(GO_BP, FDR=1.55E-51), chromosome (GO_CC, FDR=1.18E-44),
ribonucleotide binding (GO_MF, FDR=1.40E-07) and cell cycle
(pathway, FDR=1.67E-49).
| Table II.Top 3 functions and pathways enriched
for differentially expressed genes in T24 samples. |
Table II.
Top 3 functions and pathways enriched
for differentially expressed genes in T24 samples.
| Category | ID | Description | FDR | Gene no. | Gene symbol |
|---|
| Upregulated |
|
|
|
|
|
|
GO_BP | GO:0030198 | extracellular
matrix organization | 1.39E-21 | 66 | TTR,
FAP, MFI2…… |
|
| GO:0043062 | extracellular
structure organization | 1.39E-21 | 66 | FBN1,
EFEMP1, HPN…… |
|
| GO:0009611 | response to
wounding | 6.97E-19 | 122 | CFH,
EPHX2, SERPINA3…… |
|
GO_CC | GO:0005615 | extracellular
space | 8.05E-44 | 165 | ABCA1,
IL32, FSTL3…… |
|
| GO:0031012 | extracellular
matrix | 1.34E-18 | 63 | SERPINF1,
CHI3L1, F2…… |
|
| GO:0005578 | proteinaceous
extracellular matrix | 2.12E-17 | 55 | SERPINA1,
FBN1, EFEMP1…… |
|
GO_MF | GO:0005102 | receptor
binding | 1.16E-11 | 113 | EPHX2,
ABCA1, IL32…… |
|
| GO:1901681 | sulfur compound
binding | 6.03E-09 | 34 | CFH,
ACADL, HNF4A…… |
|
| GO:0050839 | cell adhesion
molecule binding | 7.59E-09 | 29 | NDRG1,
FGA, FGB…… |
| KEGG
pathway | 83073 | complement and
coagulation cascades | 1.27E-16 | 28 | CFH,
F2, F3…… |
|
| 198880 | complement and
coagulation cascades | 7.64E-15 | 23 | SERPINA1,
FGB, PLG…… |
|
| M4470 | extrinsic
prothrombin activation pathway | 7.08E-13 | 12 | FGB,
FGG, SERPINC1…… |
| Downregulated | GO:0000278 | mitotic cell
cycle | 8.81E-55 | 141 | NUSAP1,
CDKN3, KIF18A…… |
|
|
GO_BP | GO:0007049 | cell cycle | 1.55E-51 | 180 | BRIP1,
MIS18BP1, CENPW…… |
|
| GO:0022402 | cell cycle
process | 1.06E-48 | 151 | CENPW,
CENPE, CENPF…… |
|
GO_CC | GO:0005694 | chromosome | 1.18E-44 | 116 | NUSAP1,
CHAF1B, MIS18BP1…… |
|
| GO:0044427 | chromosomal
part | 1.44E-36 | 97 | CHAF1B,
MIS18BP1, CENPW…… |
|
| GO:0032993 | protein-DNA
complex | 6.76E-32 | 62 | MIS18BP1,
CENPW, CENPE…… |
|
GO_MF | GO:0032559 | adenyl
ribonucleotide binding | 1.40E-07 | 94 | KIF18A,
BRIP1, CENPE…… |
|
| GO:0005524 | ATP binding | 1.40E-07 | 92 | ATAD5, MARK1,
MCM2…… |
|
| GO:0030554 | adenyl nucleotide
binding | 1.52E-07 | 94 | MCM4,
PFAS, MCM5…… |
|
KEGG | 530733 | cell cycle | 1.67E-49 | 105 | KIF18A,
PTTG1, MIS18BP1…… |
|
pathway | 105765 | cell cycle,
mitotic | 1.57E-35 | 81 | KIF18A,
PTTG1, CENPE…… |
|
| 105750 | G2/M
checkpoints | 7.54E-21 | 24 | MCM2,
MCM3, MCM4…… |
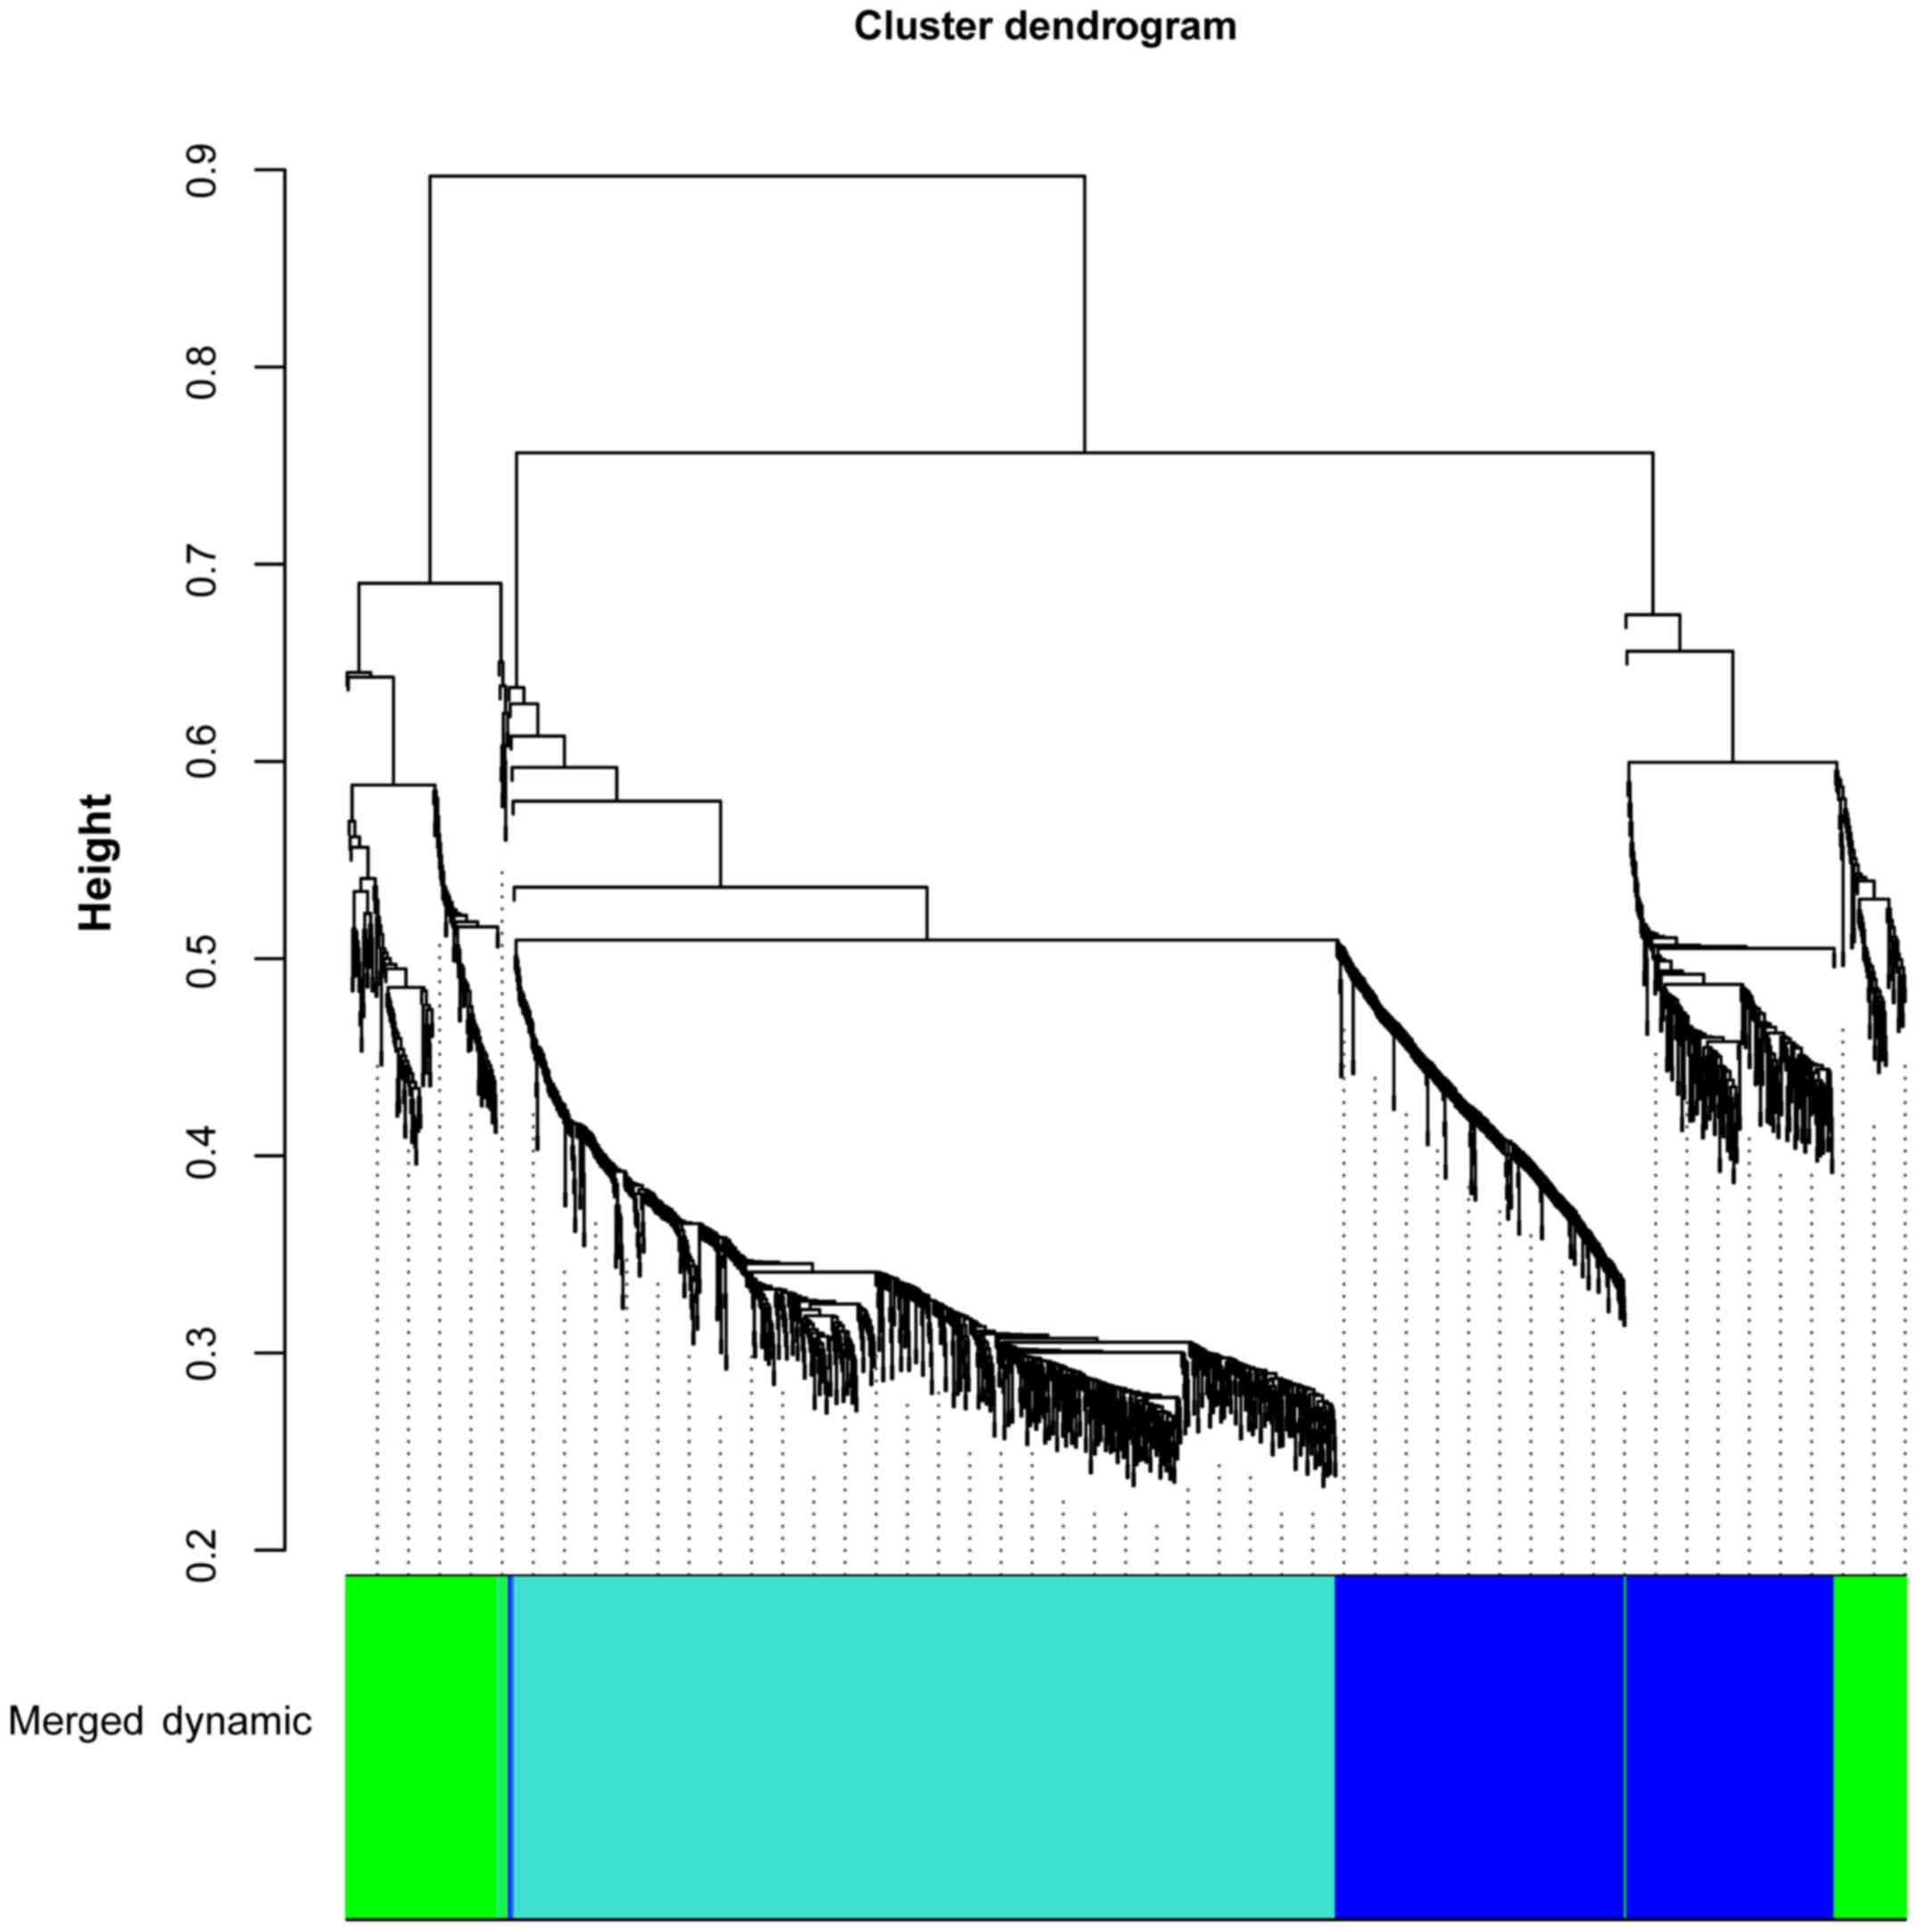
WGCNA analysis
The DEGs in the T0 vs. T5 and T0 vs. T24 comparison
groups were merged and 1,569 DEGs were obtained. Based on WGCNA, 3
gene clusters were identified, including blue (correlation
coefficient, −0.98; P=3.07E-06), green (correlation coefficient,
0.25; P=5.16E-01), and turquoise (correlation coefficient, 0.89;
P=1.14E-03) clusters (Fig. 1).
Blue and turquoise gene clusters were significant.
The 504 DEGs in the blue cluster were significantly
enriched in 274 GO_BP terms, 36 GO_CC terms and 33 KEGG pathways.
The top 5 functions and pathways are presented in Table III, including regulation of
multicellular organismal development (GO_BP; FDR=5.97E-06; which
involved BMP2), chromosome (GO_CC, FDR=3.79E-03) and
systemic lupus erythematosus (pathway, FDR=1.00E-03). Meanwhile,
the 833 DEGs in the turquoise cluster were significantly enriched
in 802 GO_BP terms, 87 GO_CC terms, 78 GO_MF terms and 166 KEGG
pathways. The top 5 functions and pathways are presented in
Table IV, including mitotic cell
cycle [GO_BP; FDR=3.93E-28; which involved cyclin-dependent kinase
1 (CDK1)], extracellular space (GO_CC, FDR=3.10E-23),
receptor binding (GO_MF, FDR=2.47E-04) and cell cycle (pathway,
FDR=4.76E-16; which involved CDK1).
| Table III.Top 5 functions and pathways enriched
for differentially expressed genes in the blue cluster. |
Table III.
Top 5 functions and pathways enriched
for differentially expressed genes in the blue cluster.
| Category | ID | Description | FDR | Gene no. | Gene symbol |
|---|
| GO_BP | GO:2000026 | regulation of
multicellular organismal development | 5.97E-06 | 78 | CDKN2B,
LPAR3, RAMP2…… |
|
| GO:0001763 | morphogenesis of a
branching structure | 1.17E-05 | 24 | FOXA1,
FGF2, FGFR1…… |
|
| GO:0048589 | developmental
growth | 1.17E-05 | 30 | LPAR3,
BCL11A, DRAXIN…… |
|
| GO:0061138 | morphogenesis of a
branching epithelium | 1.17E-05 | 23 | FOXA1,
FGF2, FGFR1…… |
|
| GO:0048754 | branching
morphogenesis of an epithelial tube | 1.17E-05 | 21 | FOXA1,
FGF2, COL4A1…… |
| GO_CC | GO:0044420 | extracellular
matrix component | 1.46E-03 | 15 | COL4A1,
COL4A2, COL4A5…… |
|
| GO:0000785 | chromatin | 2.27E-03 | 26 | MCM2,
HIST1H2AJ, HIST1H2AB…… |
|
| GO:0005604 | basement
membrane | 2.36E-03 | 12 | COL4A1,
COL4A2, COL4A5…… |
|
| GO:0005694 | chromosome | 3.79E-03 | 40 | MCM2,
MCM3, HIST1H4I…… |
|
| GO:0044427 | chromosomal
part | 4.60E-03 | 35 | MCM2,
MCM3, HIST1H2AJ…… |
| KEGG | 106540 | telomere
maintenance | 7.80E-04 | 13 | HIST1H4I,
HIST1H2AJ, HIST1H2AB…… |
| pathway | 366238 | amyloids | 9.81E-04 | 13 | HIST1H4I,
HIST1H2AJ, HIST1H2AB…… |
|
| 106548 | packaging of
telomere ends | 9.81E-04 | 10 | HIST1H4I,
HIST1H2AJ, HIST1H2AB…… |
|
| 477134 | meiotic
synapsis | 9.81E-04 | 12 | HIST1H4I,
HIST1H2AJ, HIST1H2AB…… |
|
| 83122 | systemic lupus
erythematosus | 1.00E-03 | 16 | HLA-DOA,
HIST1H4I, HIST1H2AJ…… |
| Table IV.Top 5 functions and pathways enriched
for differentially expressed genes in the turquoise cluster. |
Table IV.
Top 5 functions and pathways enriched
for differentially expressed genes in the turquoise cluster.
| Category | ID | Description | FDR | Gene no. | Gene symbol |
|---|
| GO_BP | GO:0000278 | mitotic cell
cycle | 3.93E-28 | 127 | NUSAP1,
KIF18A, MIS18BP1…… |
|
| GO:0007067 | mitotic nuclear
division | 1.58E-26 | 77 | CENPW,
SPC25, SGOL1…… |
|
| GO:0000280 | nuclear
division | 1.61E-25 | 90 | FANCD2,
NDC80, MKI67…… |
|
| GO:1903047 | mitotic cell cycle
process | 8.19E-25 | 111 | MCM10,
RRM2, EZH2…… |
|
| GO:0048285 | organelle
fission | 7.14E-24 | 90 | SPC24,
RUVBL1, TPX2…… |
| GO_CC | GO:0005615 | extracellular
space | 3.10E-23 | 141 | SERPINA3,
FSTL3, ACTA2…… |
|
| GO:0000775 | chromosome,
centromeric region | 1.99E-16 | 39 | MIS18BP1,
CENPW, HJURP…… |
|
| GO:0005694 | chromosome | 9.93E-16 | 90 | CENPW,
HJURP, SPC25…… |
|
| GO:0000793 | condensed
chromosome | 3.71E-15 | 40 | SPC24,
CDCA5, CENPK…… |
|
| GO:0000779 | condensed
chromosome, centromeric region | 7.92E-15 | 28 | BUB1,
BUB1B, KIF2C…… |
| GO_MF | GO:0005102 | receptor
binding | 2.47E-04 | 100 | EPHX2,
S100A14, F2…… |
|
| GO:0030414 | peptidase inhibitor
activity | 2.47E-04 | 24 | SERPINA3,
RPS6KA3, CD109…… |
|
| GO:0004867 | serine-type
endopeptidase inhibitor activity | 2.47E-04 | 17 | SERPINA3,
CD109, AGT…… |
|
| GO:0004866 | endopeptidase
inhibitor activity | 2.47E-04 | 23 | SERPINA3,
RPS6KA3, CD109…… |
|
| GO:0061135 | endopeptidase
regulator activity | 3.74E-04 | 23 | AGT, AHSG,
AMBP, SERPINA11…… |
| KEGG | 530733 | cell cycle | 4.76E-16 | 80 | KIF18A,
MIS18BP1, HJURP…… |
| pathway | 105765 | cell cycle,
mitotic | 1.16E-14 | 68 | KIF18A,
SPC25, MCM5…… |
|
| 83073 | complement and
coagulation cascades | 1.44E-13 | 26 | FGB,
FGG, SERPINC1…… |
|
| 105815 | mitotic
prometaphase | 2.98E-12 | 31 | KIF18A,
SPC25, SGOL1…… |
|
| 198880 | complement and
coagulation cascades | 8.46E-12 | 21 | FGB,
SERPINC1, C1S…… |
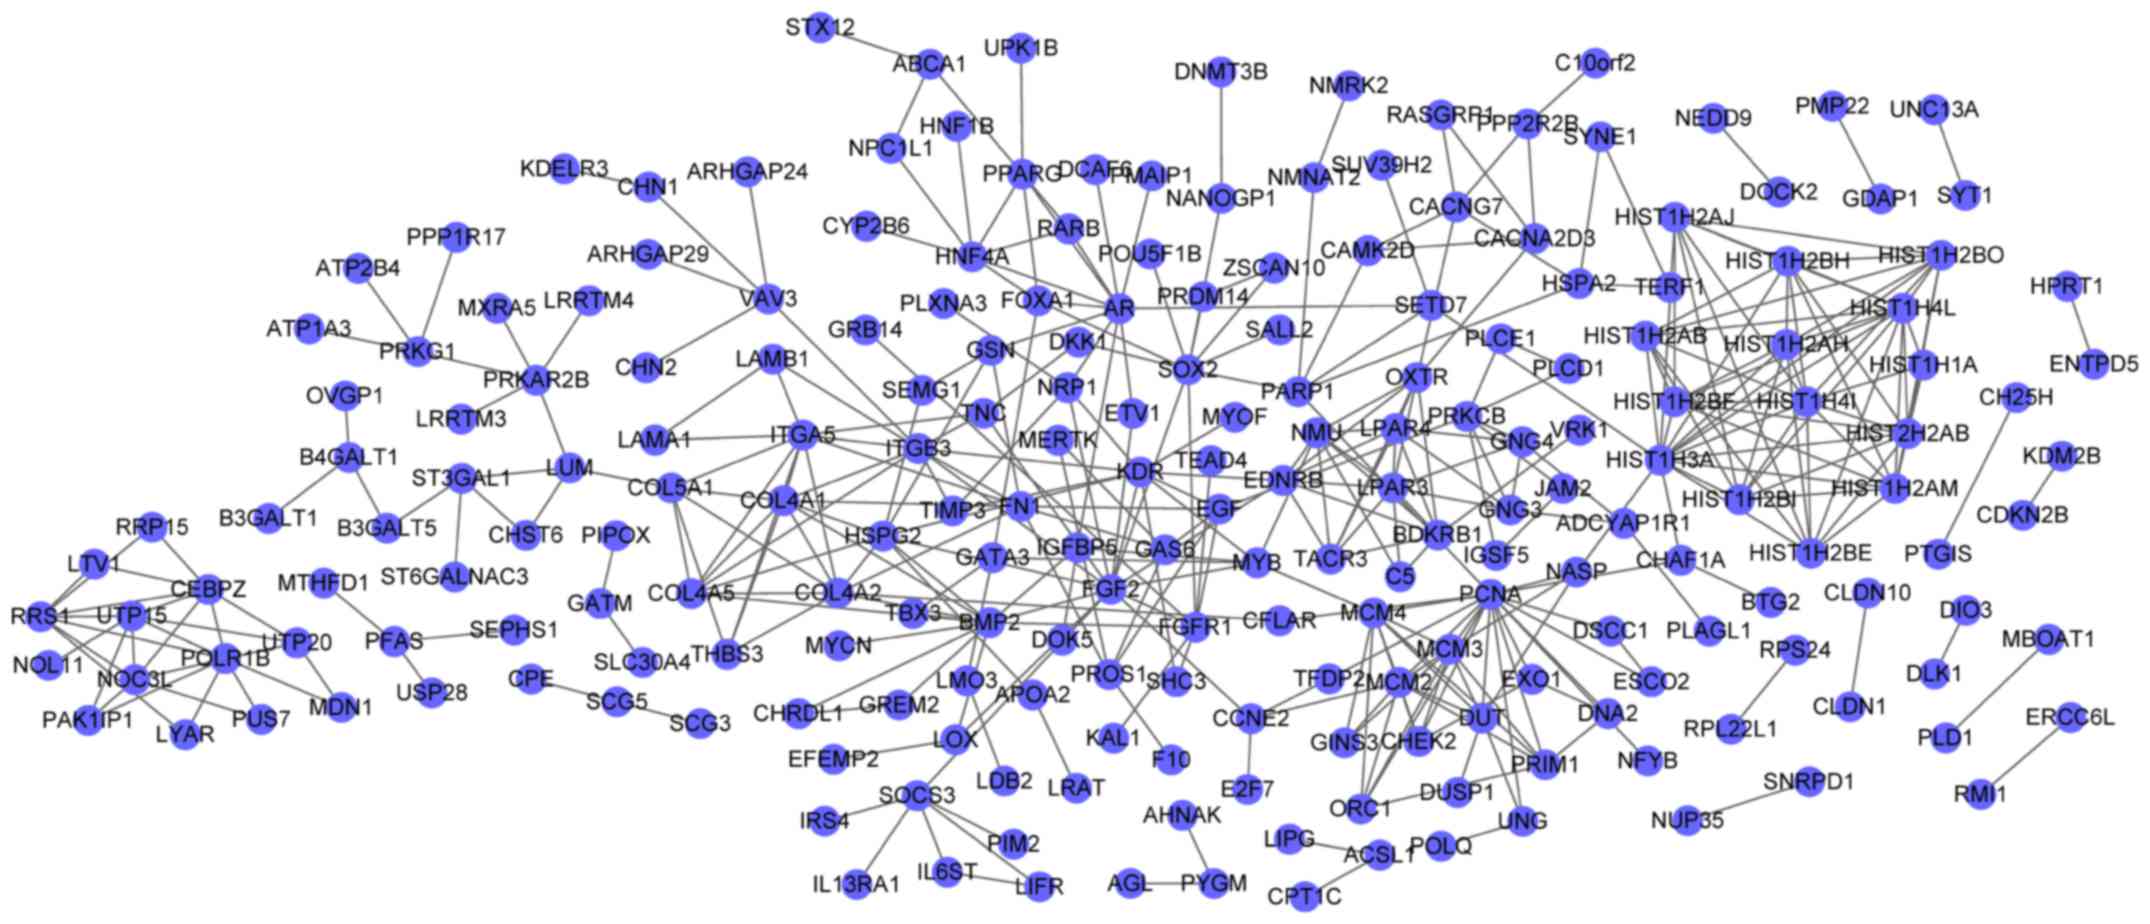
PPI network analysis for genes in the
blue and turquoise clusters
The PPI network for DEGs in the blue cluster
demonstrated 218 nodes and 388 interactions (Fig. 2). In the PPI network, fibroblast
growth factor 2 (FGF2, degree=14) and BMP2 (degree=12) were the
nodes with the higher degrees, and FGF2 had interactions with BMP2
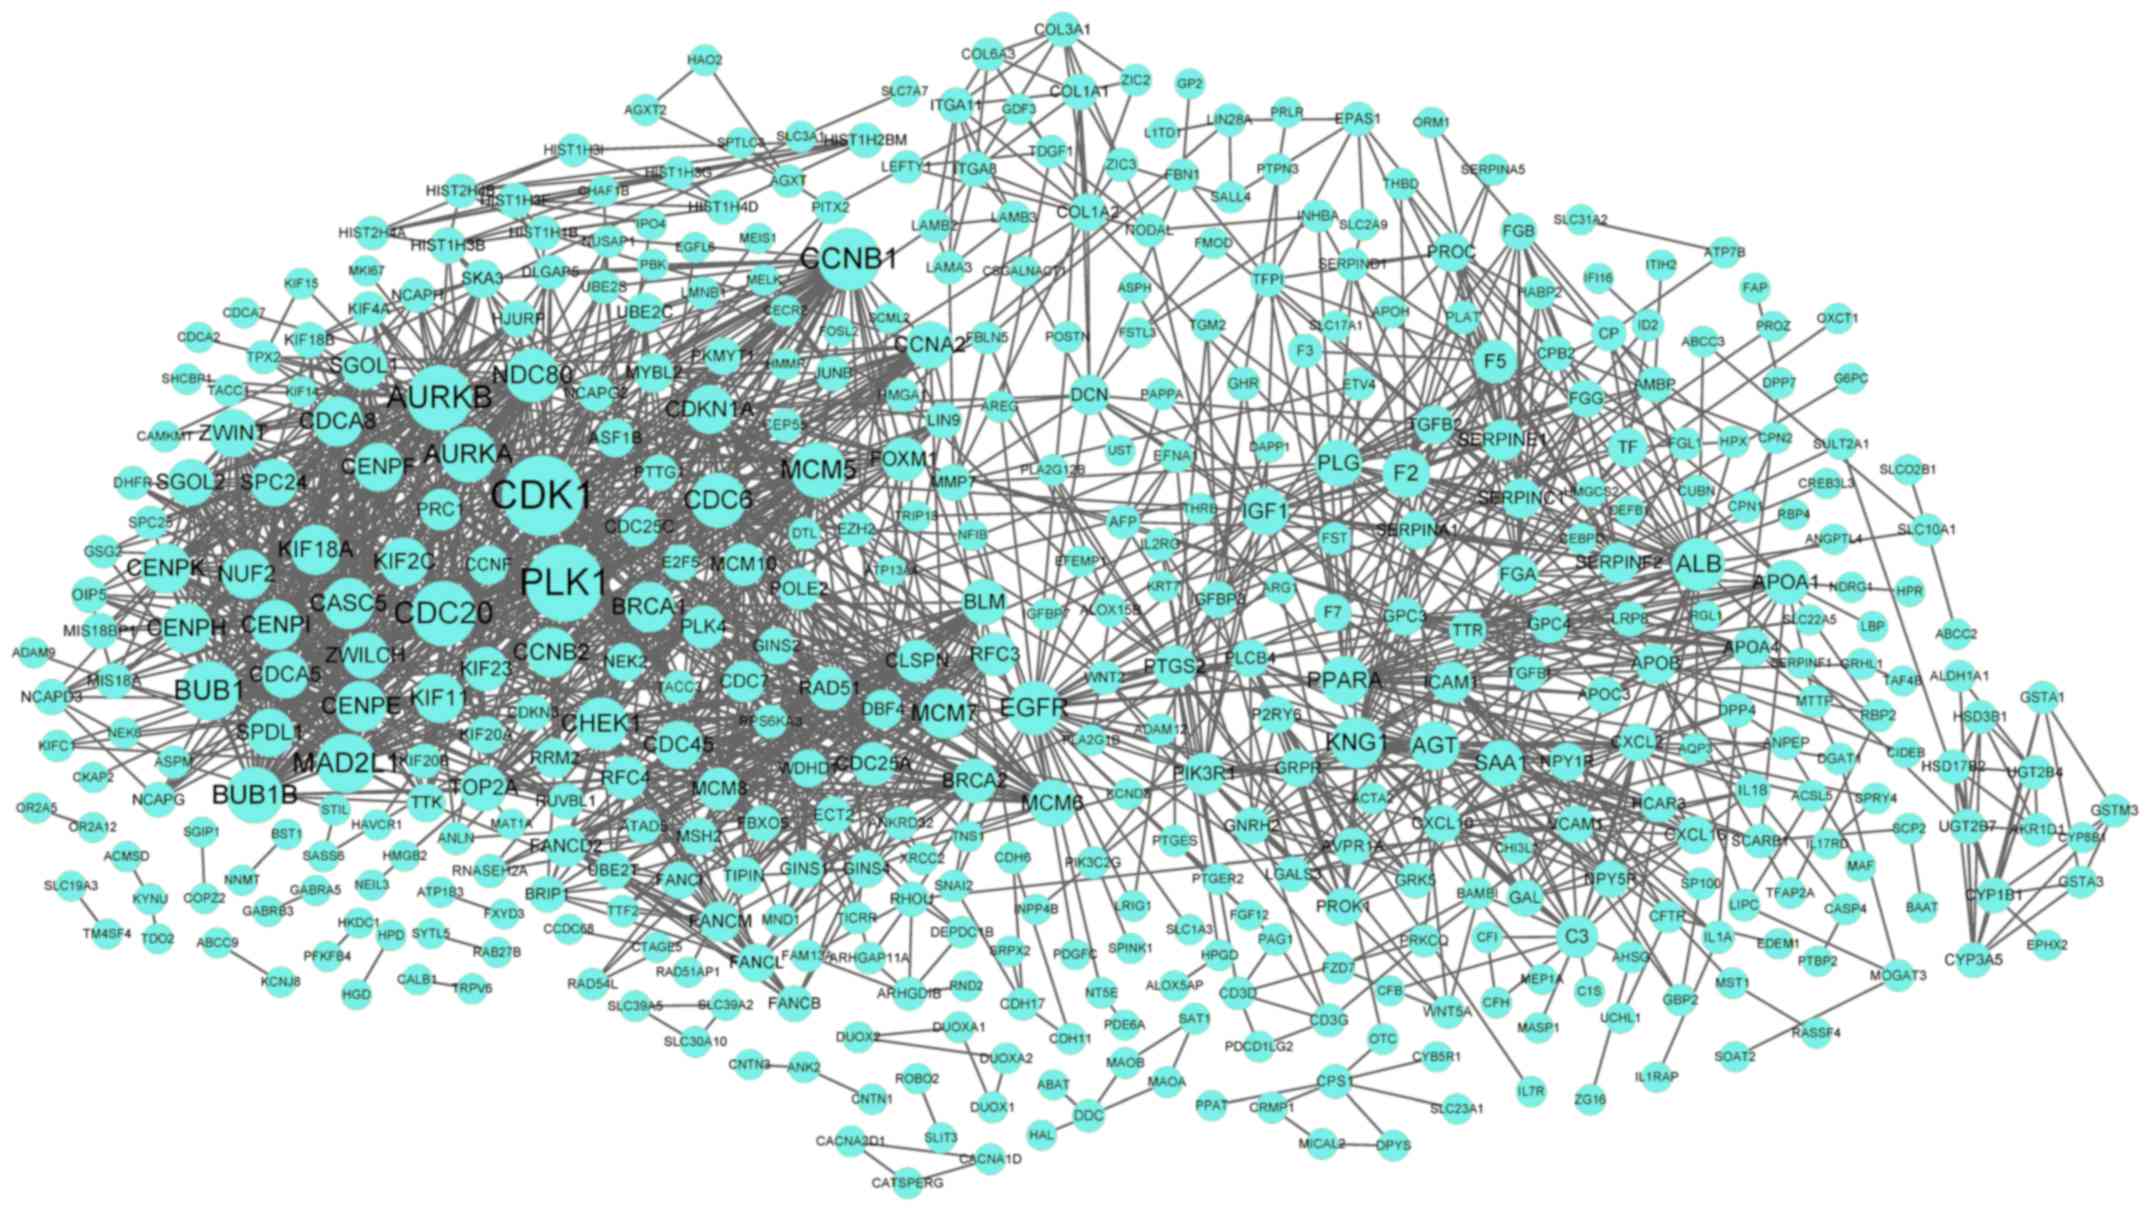
in the PPI network. Furthermore, the PPI network for DEGs in the
turquoise cluster demonstrated 488 nodes and 1,803 interactions
(Fig. 3). Notably, CDK1
(degree=71) was the node with the highest degree in the PPI
network.
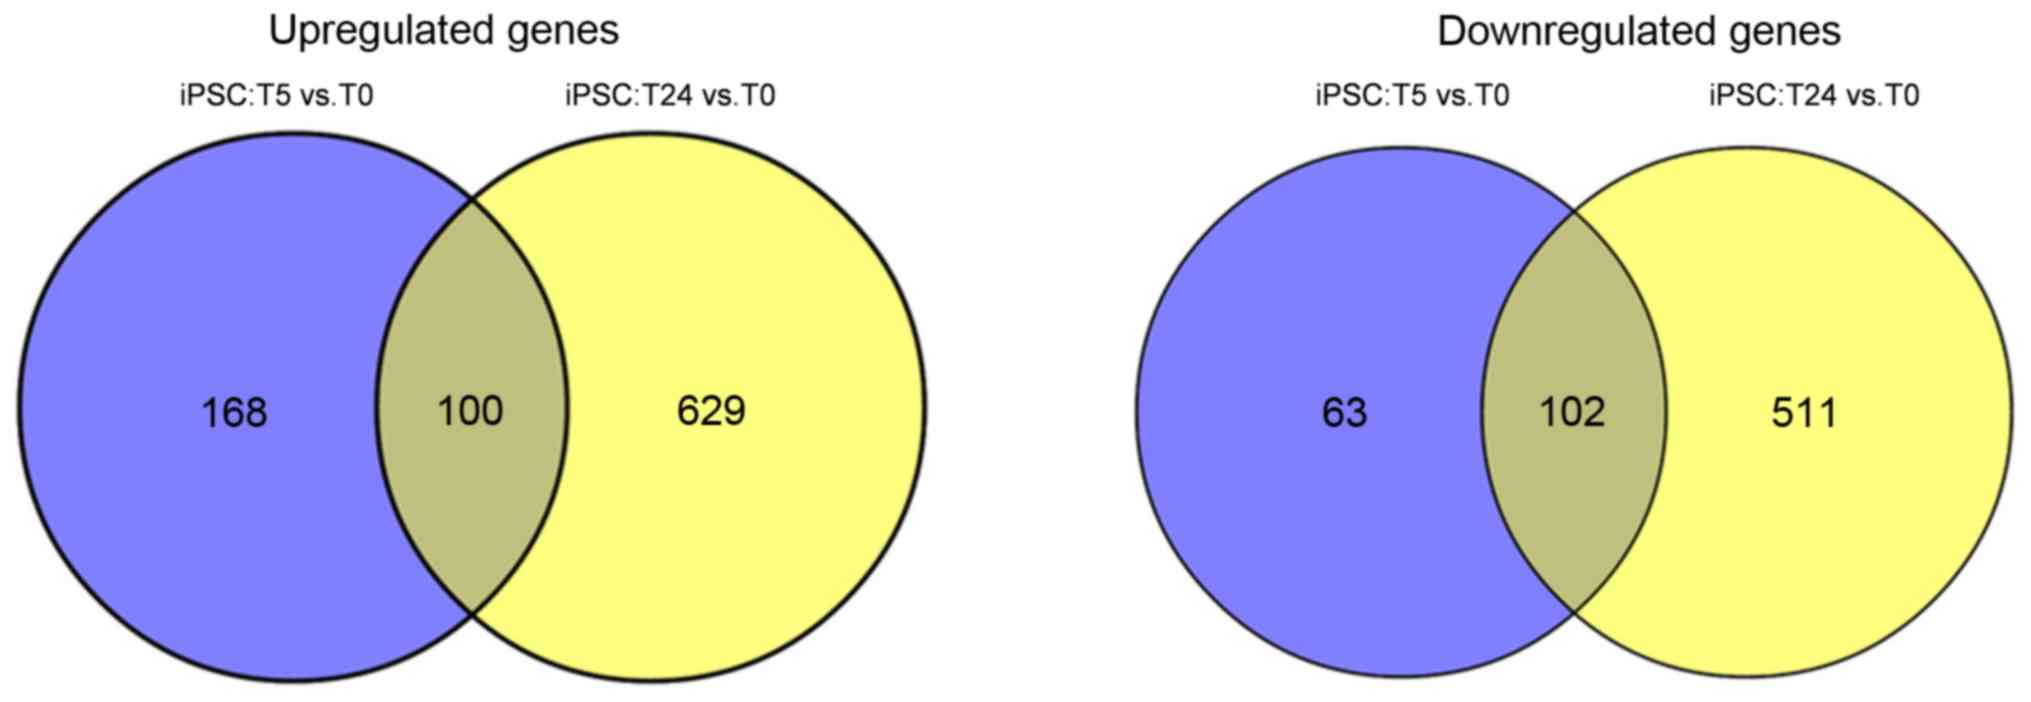
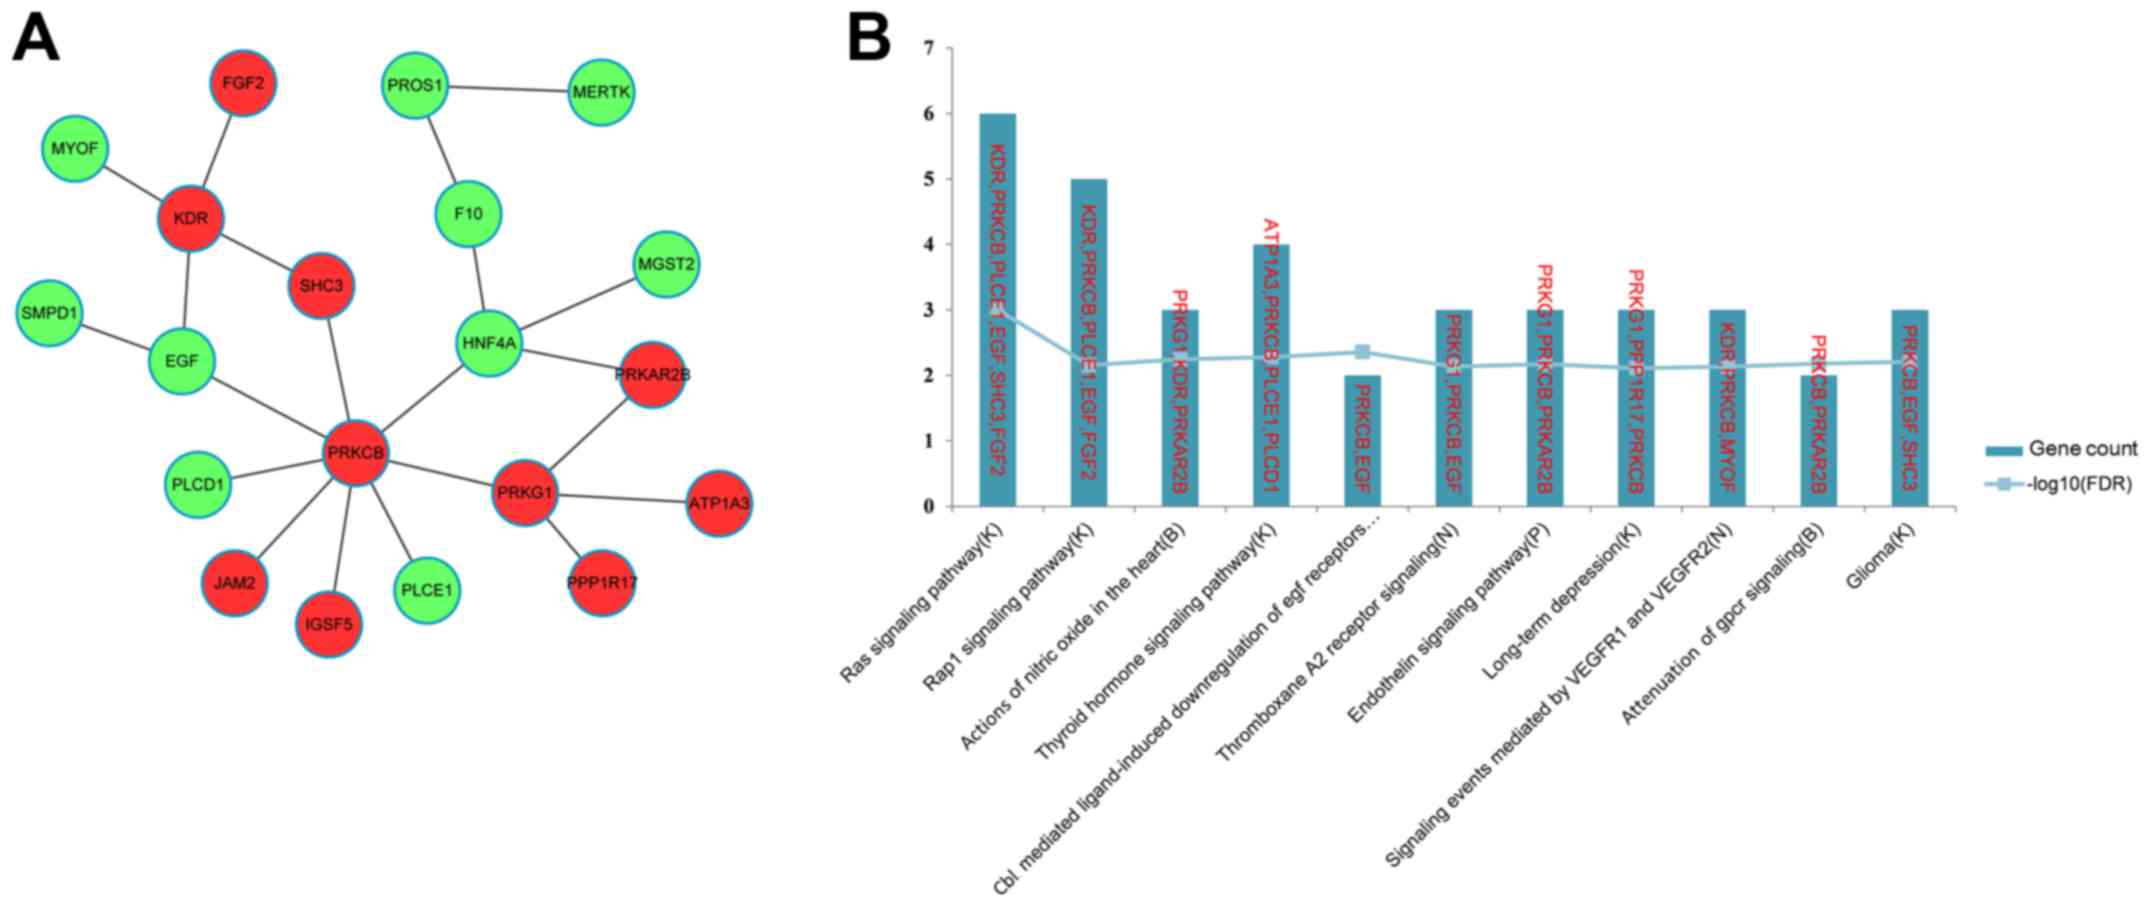
Common gene analysis
A total of 202 common genes, including HNF4A,
epidermal growth factor (EGF) and FGF2 were
identified between the two comparison groups, of which 100 were
upregulated and 102 were downregulated (Fig. 4). According to the expression
profile data of the common genes, a gene FI network was constructed
(Fig. 5A). The top 11 most
significant pathways enriched for the genes in the FI network are
presented in Fig. 5B, and include
the Ras signaling pathway (K), the Rap1 signaling pathway (K) and
actions of nitric oxide in the heart (B). Notably, EGF and
FGF2 were enriched in the Ras (K) and Rap1 signaling
pathways (K).
Discussion
In the present study, 433 DEGs were identified
between the T5 and T0 samples, including 268 up- and 165
downregulated genes, whereas 1,342 DEGs were identified between the
T24 and T0 samples, including 729 up- and 613 downregulated genes.
Based on WGCNA, blue and turquoise clusters were identified as
significant gene clusters. A total of 202 common genes, including
100 up- and 102 downregulated genes, were identified between the
two comparison groups, and a gene FI network was constructed.
In the PPI network for DEGs in the blue cluster,
upregulated FGF2 (degree=14) and downregulated BMP2 (degree=12)
were the nodes with the higher degrees. Exogenous FGF2 has
been reported to enhance the role of intracrine FGF2
signaling in the maintenance of pluripotency; conversely, a
downregulation of endogenous FGF2 has been demonstrated
during the differentiation of human ESCs, whereas its knockdown has
been revealed to contribute to hESC differentiation (27,28).
It has previously been reported that FGF2 signaling controls
BMP4-mediated hESCs differentiation by maintaining levels of
NANOG via the mitogen-activated protein kinase
kinase/extracellular signal-regulated kinase pathway (29). In the present study, functional
enrichment of the DEGs in the blue cluster demonstrated that
BMP2 was enriched in the regulation of multicellular
organismal development. Previous studies have reported that
BMP2 may participate in hESC differentiation through the
control of an important early commitment step, which may provide
the route for differentiation of pluripotent cells into neural
precursors (30). It has been
revealed that BMP-2/6 was more successful in inducing hESCs
differentiation than BMP-2 or BMP-6, and it was able
to substitute these BMPs during in vitro differentiation
guidance (31). In addition, the
FGF pathway serves an important role in directing the
BMP4-induced generation of syncytiotrophoblasts from hESCs
(32). These findings suggested
that FGF2 and BMP2 may serve key roles in the
differentiation of iPSCs. In the PPI network for DEGs in the blue
cluster, FGF2 could interact with BMP2, suggesting that FGF2
may participate in iPSC differentiation through interacting with
BMP2.
Upregulated CDK1 (degree=71) was the node with the
highest degree in the PPI network for DEGs in the turquoise
cluster. In human mesenchymal stem cells (MSCs), CDK1
activation has been reported to facilitate the differentiation of
MSCs into osteoblasts by phosphorylating the enhancer of zeste
homologue 2 at Thr 487 (33).
Through promoting the binding between Oct4 and the
trophectoderm marker CDX2, CDK1 has been demonstrated
to prevent the generation of trophectoderm from ESCs and
accordingly maintain stemness (34). CDK1 suppression conferred by
p57, as well as the inhibition of the DNA damage response caused by
p21, can trigger the differentiation of trophoblast stem cells into
giant cells (35). CDK1/2
have been considered critical for the regulation of self-renewal
and lineage specification of hESCs (36). CDK1 expression has been
reported to markedly decrease during ESC differentiation, whereas
its knockdown reduced the colony formation potential and
proliferation of ESCs, suggesting that CDK1 may contribute
to maintaining the self-renewing and unique undifferentiated state
of mouse ESCs (37). In the
present study, enrichment analysis for DEGs in the turquoise
cluster revealed that CDK1 was enriched in mitosis and cell
cycle pathways. Therefore, it may be hypothesized that CDK1
is involved in iPSC differentiation.
HNF4A and EGF were common genes
between the two comparison groups, as they were revealed to be
consistently downregulated in T5 and T24 samples. HNF4A
serves an important role in specifying hepatic progenitor cells
from hPSCs, via establishing the expression of the transcription
factor network regulating the initiation of hepatocyte
differentiation (38). The
miR-122/forkhead box A1/HNF4A-positive feedback loop has
been reported to promote maturation and differentiation of mouse
ESCs into hepatocytes, via controlling the balance between
epithelial-to-mesenchymal and mesenchymal-to-epithelial transition,
as well as the balance between differentiation and proliferation
(39,40). Previous studies demonstrated that
EGF promoted proliferation of mouse ESCs through
Ca2+ influx, phospholipase C-protein kinase C, and
p44/42 mitogen-activated protein kinases signaling pathways, via
the phosphorylation of the EGF receptor (41,42).
Heparin-binding epidermal growth factor-like growth factor can
induce proliferation, as well as inhibit the adipogenic,
chondrogenic and osteogenic differentiation of ESCs (43). In the present study, enrichment
analysis for genes in the FI network revealed that EGF was
enriched in the Ras (K) and Rap1 signaling pathways (K). These
results suggested that HNF4A and EGF may also be
implicated in the differentiation of iPSCs into hepatocytes.
In conclusion, in the present study, a comprehensive
bioinformatics analysis was performed to investigate the mechanisms
involved in the differentiation of iPSCs to hepatocytes. A total of
433 and 1,342 DEGs were identified in T5 and T24 samples
respectively, compared with T0 samples. The results indicated that
FGF2, BMP2, CDK1, HNF4A and EGF may participate in
the differentiation of iPSCs into hepatocytes. However, further
experiments are required to elucidate their exact roles in the
generation of hepatocytes from iPSCs.
References
|
1
|
Kim K, Doi A, Wen B, Ng K, Zhao R, Cahan
P, Kim J, Aryee MJ, Ji H, Ehrlich LI, et al: Epigenetic memory in
induced pluripotent stem cells. Nature. 467:285–290. 2010.
View Article : Google Scholar : PubMed/NCBI
|
|
2
|
Yu J, Vodyanik MA, Smuga-Otto K,
Antosiewicz-Bourget J, Frane JL, Tian S, Nie J, Jonsdottir GA,
Ruotti V, Stewart R, et al: Induced pluripotent stem cell lines
derived from human somatic cells. Science. 318:1917–1920. 2007.
View Article : Google Scholar : PubMed/NCBI
|
|
3
|
Takahashi K, Tanabe K, Ohnuki M, Narita M,
Ichisaka T, Tomoda K and Yamanaka S: Induction of pluripotent stem
cells from adult human fibroblasts by defined factors. Cell.
131:861–872. 2007. View Article : Google Scholar : PubMed/NCBI
|
|
4
|
Park IH, Zhao R, West JA, Yabuuchi A, Huo
H, Ince TA, Lerou PH, Lensch MW and Daley GQ: Reprogramming of
human somatic cells to pluripotency with defined factors. Nature.
451:141–146. 2008. View Article : Google Scholar : PubMed/NCBI
|
|
5
|
Zheng YW, Ohkohchi N and Taniguchi H:
Quantitative evaluation of long-term liver repopulation and the
reconstitution of bile ductules after hepatocellular
transplantation. World J Gastroenterol. 11:6176–6181. 2005.
View Article : Google Scholar : PubMed/NCBI
|
|
6
|
Chen YF, Tseng CY, Wang HW, Kuo HC, Yang
VW and Lee OK: Rapid generation of mature hepatocyte-like cells
from human induced pluripotent stem cells by an efficient
three-step protocol. Hepatology. 55:1193–1203. 2012. View Article : Google Scholar : PubMed/NCBI
|
|
7
|
Liu H, Kim Y, Sharkis S, Marchionni L and
Jang YY: In vivo liver regeneration potential of human induced
pluripotent stem cells from diverse origins. Sci Transl Med.
3:82ra392011. View Article : Google Scholar : PubMed/NCBI
|
|
8
|
Si-Tayeb K, Noto FK, Nagaoka M, Li J,
Battle MA, Duris C, North PE, Dalton S and Duncan SA: Highly
efficient generation of human hepatocyte-like cells from induced
pluripotent stem cells. Hepatology. 51:297–305. 2010. View Article : Google Scholar : PubMed/NCBI
|
|
9
|
Di Bernardini E, Campagnolo P, Margariti
A, Zampetaki A, Karamariti E, Hu Y and Xu Q: Endothelial lineage
differentiation from induced pluripotent stem cells is regulated by
microRNA-21 and transforming growth factor β2 (TGF-β2) pathways. J
Biol Chem. 289:3383–3393. 2014. View Article : Google Scholar : PubMed/NCBI
|
|
10
|
Li L, Bennett SA and Wang L: Role of
E-cadherin and other cell adhesion molecules in survival and
differentiation of human pluripotent stem cells. Cell Adh Migr.
6:59–70. 2012. View Article : Google Scholar : PubMed/NCBI
|
|
11
|
Chen HF, Chuang CY, Lee WC, Huang HP, Wu
HC, Ho HN, Chen YJ and Kuo HC: Surface marker epithelial cell
adhesion molecule and E-cadherin facilitate the identification and
selection of induced pluripotent stem cells. Stem Cell Rev.
7:722–735. 2011. View Article : Google Scholar : PubMed/NCBI
|
|
12
|
Takayama K, Inamura M, Kawabata K,
Katayama K, Higuchi M, Tashiro K, Nonaka A, Sakurai F, Hayakawa T,
Furue MK and Mizuguchi H: Efficient generation of functional
hepatocytes from human embryonic stem cells and induced pluripotent
stem cells by HNF4α transduction. Mol Ther. 20:127–137. 2012.
View Article : Google Scholar : PubMed/NCBI
|
|
13
|
Bernardo AS, Faial T, Gardner L, Niakan
KK, Ortmann D, Senner CE, Callery EM, Trotter MW, Hemberger M,
Smith JC, et al: BRACHYURY and CDX2 mediate BMP-induced
differentiation of human and mouse pluripotent stem cells into
embryonic and extraembryonic lineages. Cell Stem Cell. 9:144–155.
2011. View Article : Google Scholar : PubMed/NCBI
|
|
14
|
Wilson AA, Ying L, Liesa M, Segeritz CP,
Mills JA, Shen SS, Jean J, Lonza GC, Liberti DC, Lang AH, et al:
Emergence of a stage-dependent human liver disease signature with
directed differentiation of alpha-1 antitrypsin-deficient iPS
cells. Stem Cell Reports. 4:873–885. 2015. View Article : Google Scholar : PubMed/NCBI
|
|
15
|
Irizarry RA, Hobbs B, Collin F,
Beazer-Barclay YD, Antonellis KJ, Scherf U and Speed TP:
Exploration, normalization, and summaries of high density
oligonucleotide array probe level data. Biostatistics. 4:249–264.
2003. View Article : Google Scholar : PubMed/NCBI
|
|
16
|
Carlson M, Falcon S, Pages H and Li N:
org. Hs. eg. db: Genome wide annotation for Human. R package
version. 2013.
|
|
17
|
MacDonald JW:
hugene10sttranscriptcluster.db: Affymetrix hugene10 annotation data
(chip hugene10sttranscriptcluster). R package version 8.4.0.
2016.
|
|
18
|
Smyth GK: Limma: linear models for
microarray dataBioinformatics and computational biology solutions
using R and Bioconductor. Springer; New York, NY: pp. 397–420.
2005, View Article : Google Scholar
|
|
19
|
Benjamini Y and Hochberg Y: Controlling
the false discovery rate: A practical and powerful approach to
multiple testing. Journal of the royal statistical society. Series
B (Methodological). 57:289–300. 1995.
|
|
20
|
Chen J, Bardes EE, Aronow BJ and Jegga AG:
ToppGene Suite for gene list enrichment analysis and candidate gene
prioritization. Nucleic Acids Res. 37(Web Server issue): W305–W311.
2009. View Article : Google Scholar : PubMed/NCBI
|
|
21
|
Harris MA, Clark J, Ireland A, Lomax J,
Ashburner M, Foulger R, Eilbeck K, Lewis S, Marshall B, Mungall C,
et al: The gene ontology (GO) database and informatics resource.
Nucleic Acids Res. 32(Database issue): D258–D261. 2004.PubMed/NCBI
|
|
22
|
Kanehisa M, Araki M, Goto S, Hattori M,
Hirakawa M, Itoh M, Katayama T, Kawashima S, Okuda S, Tokimatsu T
and Yamanishi Y: KEGG for linking genomes to life and the
environment. Nucleic Acids Res. 36(Database issue): D480–D484.
2008.PubMed/NCBI
|
|
23
|
Langfelder P and Horvath S: WGCNA: An R
package for weighted correlation network analysis. BMC
Bioinformatics. 9:5592008. View Article : Google Scholar : PubMed/NCBI
|
|
24
|
Szklarczyk D, Franceschini A, Kuhn M,
Simonovic M, Roth A, Minguez P, Doerks T, Stark M, Muller J, Bork
P, et al: The STRING database in 2011: Functional interaction
networks of proteins, globally integrated and scored. Nucleic Acids
Res. 39(Database issue): D561–D568. 2011. View Article : Google Scholar : PubMed/NCBI
|
|
25
|
Saito R, Smoot ME, Ono K, Ruscheinski J,
Wang PL, Lotia S, Pico AR, Bader GD and Ideker T: A travel guide to
Cytoscape plugins. Nat Methods. 9:1069–1076. 2012. View Article : Google Scholar : PubMed/NCBI
|
|
26
|
Wu G, Dawson E, Duong A, Haw R and Stein
L: ReactomeFIViz: A Cytoscape app for pathway and network-based
data analysis. Version 2. F1000Res. 3:1462014.PubMed/NCBI
|
|
27
|
Eiselleova L, Matulka K, Kriz V, Kunova M,
Schmidtova Z, Neradil J, Tichy B, Dvorakova D, Pospisilova S, Hampl
A and Dvorak P: A complex role for FGF-2 in self-renewal, survival,
and adhesion of human embryonic stem cells. Stem Cells.
27:1847–1857. 2009. View
Article : Google Scholar : PubMed/NCBI
|
|
28
|
Diecke S, Quiroga-Negreira A, Redmer T and
Besser D: FGF2 signaling in mouse embryonic fibroblasts is crucial
for self-renewal of embryonic stem cells. Cells Tissues Organs.
188:52–61. 2008. View Article : Google Scholar : PubMed/NCBI
|
|
29
|
Yu P, Pan G, Yu J and Thomson JA: FGF2
sustains NANOG and switches the outcome of BMP4-induced human
embryonic stem cell differentiation. Cell Stem Cell. 8:326–334.
2011. View Article : Google Scholar : PubMed/NCBI
|
|
30
|
Pera MF, Andrade J, Houssami S, Reubinoff
B, Trounson A, Stanley EG, Ward-van Oostwaard D and Mummery C:
Regulation of human embryonic stem cell differentiation by BMP-2
and its antagonist noggin. J Cell Sci. 117:1269–1280. 2004.
View Article : Google Scholar : PubMed/NCBI
|
|
31
|
Valera E, Isaacs MJ, Kawakami Y, Izpisúa
Belmonte JC and Choe S: BMP-2/6 heterodimer is more effective than
BMP-2 or BMP-6 homodimers as inductor of differentiation of human
embryonic stem cells. PLoS One. 5:e111672010. View Article : Google Scholar : PubMed/NCBI
|
|
32
|
Sudheer S, Bhushan R, Fauler B, Lehrach H
and Adjaye J: FGF inhibition directs BMP4-mediated differentiation
of human embryonic stem cells to syncytiotrophoblast. Stem Cells
Dev. 21:2987–3000. 2012. View Article : Google Scholar : PubMed/NCBI
|
|
33
|
Wei Y, Chen YH, Li LY, Lang J, Yeh SP, Shi
B, Yang CC, Yang JY, Lin CY, Lai CC and Hung MC: CDK1-dependent
phosphorylation of EZH2 suppresses methylation of H3K27 and
promotes osteogenic differentiation of human mesenchymal stem
cells. Nat Cell Biol. 13:87–94. 2011. View Article : Google Scholar : PubMed/NCBI
|
|
34
|
Li L, Wang J, Hou J, Wu Z, Zhuang Y, Lu M,
Zhang Y, Zhou X, Li Z, Xiao W and Zhang W: Cdk1 interplays with
Oct4 to repress differentiation of embryonic stem cells into
trophectoderm. FEBS Lett. 586:4100–4107. 2012. View Article : Google Scholar : PubMed/NCBI
|
|
35
|
Ullah Z, Kohn MJ, Yagi R, Vassilev LT and
DePamphilis ML: Differentiation of trophoblast stem cells into
giant cells is triggered by p57/Kip2 inhibition of CDK1 activity.
Genes Dev. 22:3024–3036. 2008. View Article : Google Scholar : PubMed/NCBI
|
|
36
|
Van Hoof D, Muñoz J, Braam SR, Pinkse MW,
Linding R, Heck AJ, Mummery CL and Krijgsveld J: Phosphorylation
dynamics during early differentiation of human embryonic stem
cells. Cell Stem Cell. 5:214–226. 2009. View Article : Google Scholar : PubMed/NCBI
|
|
37
|
Zhang WW, Zhang XJ, Liu HX, Chen J, Ren
YH, Huang DG, Zou XH and Xiao W: Cdk1 is required for the
self-renewal of mouse embryonic stem cells. J Cell Biochem.
112:942–948. 2011. View Article : Google Scholar : PubMed/NCBI
|
|
38
|
DeLaForest A, Nagaoka M, Si-Tayeb K, Noto
FK, Konopka G, Battle MA and Duncan SA: HNF4A is essential for
specification of hepatic progenitors from human pluripotent stem
cells. Development. 138:4143–4153. 2011. View Article : Google Scholar : PubMed/NCBI
|
|
39
|
Deng XG, Qiu RL, Wu YH, Li ZX, Xie P,
Zhang J, Zhou JJ, Zeng LX, Tang J, Maharjan A and Deng JM:
Overexpression of miR-122 promotes the hepatic differentiation and
maturation of mouse ESCs through a miR-122/FoxA1/HNF4a-positive
feedback loop. Liver Int. 34:281–295. 2014. View Article : Google Scholar : PubMed/NCBI
|
|
40
|
Liu T, Zhang S, Xiang D and Wang Y:
Induction of hepatocyte-like cells from mouse embryonic stem cells
by lentivirus-mediated constitutive expression of Foxa2/Hnf4a. J
Cell Biochem. 114:2531–2541. 2013. View Article : Google Scholar : PubMed/NCBI
|
|
41
|
Heo JS, Lee YJ and Han HJ: EGF stimulates
proliferation of mouse embryonic stem cells: Involvement of Ca2+
influx and p44/42 MAPKs. Am J Physiol Cell Physiol. 290:C123–C133.
2006. View Article : Google Scholar : PubMed/NCBI
|
|
42
|
Park JH and Han HJ: Caveolin-1 plays
important role in EGF-induced migration and proliferation of mouse
embryonic stem cells: Involvement of PI3K/Akt and ERK. Am J Physiol
Cell Physiol. 297:C935–C944. 2009. View Article : Google Scholar : PubMed/NCBI
|
|
43
|
Krampera M, Pasini A, Rigo A, Scupoli MT,
Tecchio C, Malpeli G, Scarpa A, Dazzi F, Pizzolo G and Vinante F:
HB-EGF/HER-1 signaling in bone marrow mesenchymal stem cells:
Inducing cell expansion and reversibly preventing multilineage
differentiation. Blood. 106:59–66. 2005. View Article : Google Scholar : PubMed/NCBI
|