Introduction
Hypertensive nephrosclerosis (HNS), also termed
hypertensive nephropathy or ‘benign’ nephrosclerosis, is one of the
major risk factors for end-stage renal disease (ESRD) (1). The development of HNS has previously
been reported to be closely associated with hypertension, race and
aging (2–4), for which the diagnosis is
predominantly based on clinical manifestations (5). However, despite numerous studies
investigating HNS, the underlying pathogenic mechanisms of this
disease remain to be elucidated, which limits the ability to
pertinently treat and improve prognosis. Therefore, clarifying the
molecular mechanisms of HNS is imperative for the development of
effective diagnostics and therapeutic strategies.
In a disease network, a systems biology approach can
be adopted as a means to reveal complex molecular interactions,
rather than single molecular components (6). The ‘omics’ analyses, which represent
major cornerstones of systems biology research, are considered to
be unbiased methods for the identification of biomarkers and to
elucidate the pathological mechanisms of chronic kidney disease
(7). These analyses are invaluable
tools in nephrology research, and greatly facilitate the work of
scientists (8). Bioinformatics has
the potential to enable scientists to comprehensively analyze
altered mRNA or microRNA expression patterns in a disease and
identify key genes and pathways via construction of correlative
networks (9). This analytical
approach has been widely used in order to reveal the potential
mechanisms of renal diseases, including lupus nephritis (10), membranous nephropathy (11) and diabetic nephropathy (12). The findings of these analyses have
greatly contributed to the development of knowledge with regards to
renal diseases. However, to the best of our knowledge, the
bioinformatics network analysis of HNS has not previously been
reported.
The present study aimed to use different
bioinformatics approaches in order to determine the differentially
expressed genes (DEGs) in HNS. The original GSE20602 dataset was
downloaded in order to identify the DEGs between glomeruli
specimens from patients with HNS and normal glomeruli specimens.
This dataset was published by Neusser et al (13). Subsequently, pathway enrichment and
network analysis were performed in order to identify the key genes
and signaling pathways implicated in HNS. The results of the
present study may improve understanding of the pathogenesis of HNS
and be valuable for future studies investigating HNS.
Materials and methods
Microarray data
The gene expression profile GSE20602 was downloaded
from the Gene Expression Omnibus (GEO, www.ncbi.nlm.nih.gov/geo/) database, and it was based
on the platform of GPL96 [HG-U133A] Affymetrix Human Genome U133A
Array. The dataset included 14 renal biopsy samples from patients
with HNS and four healthy control samples. Identification of HNS
samples was based upon light and electron microscopy analysis and
associated predetermined clinical and histological criteria, as
well as immunofluorescence examination (14–16).
The control samples were derived from normal kidney tissues of
patients with tumor nephrectomy (13). The patient glomeruli were
microdissected from biopsy tissues for RNA isolation and further
microarray experiments (13).
Data pre-processing and differential
analysis
Based on the Gene-Cloud Biotechnology Information
(www.gcbi.com.cn) platform, the raw CEL files were
transformed into probe-level data, and subsequently converted into
corresponding gene symbols. According to the algorithms described
by Bolstad (17), the Robust
Multi-chip Average method was used in order to compute expression
levels of probes, which consisted of three steps: Background
correction, data normalization and expression measure. Briefly, the
background corrected intensities on every GeneChip were computed
for every perfect match cell. Following this, normalization data
was then acquired using the quantile normalization algorithm, among
which individual values were replaced with the mean of original
values if the values were the same as another perfectly matched
cell. Finally, the expression level for each probe was determined
via an additive linear model. The Student's t-test was used in
order to calculate the P-values of genes, and Hochberg's method
(18) was used to adjust the raw
P-value via calculation of the false discovery rate (FDR). Only
genes with |log2 fold-change (FC)|>1 and FDR<0.05
were selected as DEGs for further investigation (19). Hierarchical clustering analyses of
DEGs were performed as previously described (20).
Gene ontology (GO) and pathway
enrichment analyses
GO analysis may be applied for the annotation of
genes of high-throughput genomic or transcriptomic data (21). It is capable of predicting the
function of genes in three aspects, including biological processes,
molecular function and cellular components. The Kyoto Encyclopedia
of Genes and Genomes (KEGG, www.genome.jp)
is a recognized pathway-associated database for the systematic
analysis of gene function (22).
The Database for Annotation, Visualization and Integrated Discovery
(DAVID, david.ncifcrf.gov) is an online
bioinformatics resource for the systematic extraction of biological
function from large gene or protein lists (23). In the present study, DAVID was
applied in order to conduct GO and KEGG pathway enrichment analyses
of the 483 identified DEGs. Fisher's exact test was used to
calculate the P-value, and the FDR was calculated to correct this.
The P<0.05 and FDR<0.05 were set as the significance
threshold.
Network construction and hub module
identification
Hub nodes have increased complex correlativity
compared with other genes within the networks, therefore the are
more likely to be involved in the underlying mechanisms of disease
(24). Pathway relation network
analysis can simultaneously reveal the pathway that has the
greatest regulatory effect on both the highest and lowest stream
pathways. Gene co-expression network analysis determines the
association between genes, and can aid in the search for the key
gene from complex regulatory associations. The networks in the
present study were constructed by Genminix Informatics Co., Ltd.
(Shanghai, China) (25). The
algorithms heavily reference previously published methods (26). Briefly, in networks, the nodes
represent genes or pathways, and the edges indicate interactional
relationships among them. The centrality of a network is
represented by the central degree, which is the contribution of one
gene (or pathway) to the genes (or pathways) in the vicinity and is
represented by the area of nodes. The greater the degree value, the
greater the area of the node. Therefore, the key genes and pathways
may be distinctly identified from the networks.
Results
Clinical and histological
characteristics
Of the 14 patients with HNS, 11 were males, and 3
were females. The mean age was 58 years. The mean systolic blood
pressure was 143 mmHg, and the mean diastolic blood pressure was 86
mmHg. The mean creatinine, estimated glomerular filtration rate
(eGFR) and proteinuria level were 2.3 mg/dl, 42 ml/min and 1.6 g/24
h, respectively. In the control group, the mean age, creatinine and
eGFR level were 65 years, 1.0 mg/dl and 59 ml/min, respectively.
The mean systolic and diastolic blood pressures were not available
for this group. No proteinuria was detected in the control group
(Table I). The clinical and
histological characteristics of patients with HNS and controls were
presented in a study by Neusser et al (13).
 | Table I.Characteristics of patients with HNS
(n=14) and controls (n=4). Data are presented as mean ± standard
deviation. |
Table I.
Characteristics of patients with HNS
(n=14) and controls (n=4). Data are presented as mean ± standard
deviation.
| Category | HNS | Control |
|---|
| Gender
(male/female/NA) | 11/3/0 | 0/2/2 |
| Age (years) |
58±12 | 65±9 |
| BP systolic
(mmHg) | 143±18 | NA |
| BP diastolic
(mmHg) |
86±13 | NA |
| Creatinine
(mg/dl) |
2.3±1.7 | 1.0±0 |
| Estimated
glomerular filtration rate (ml/min) |
42±24 |
59±1 |
| Proteinuria (g/24
h) |
1.6±1.7 | 0 |
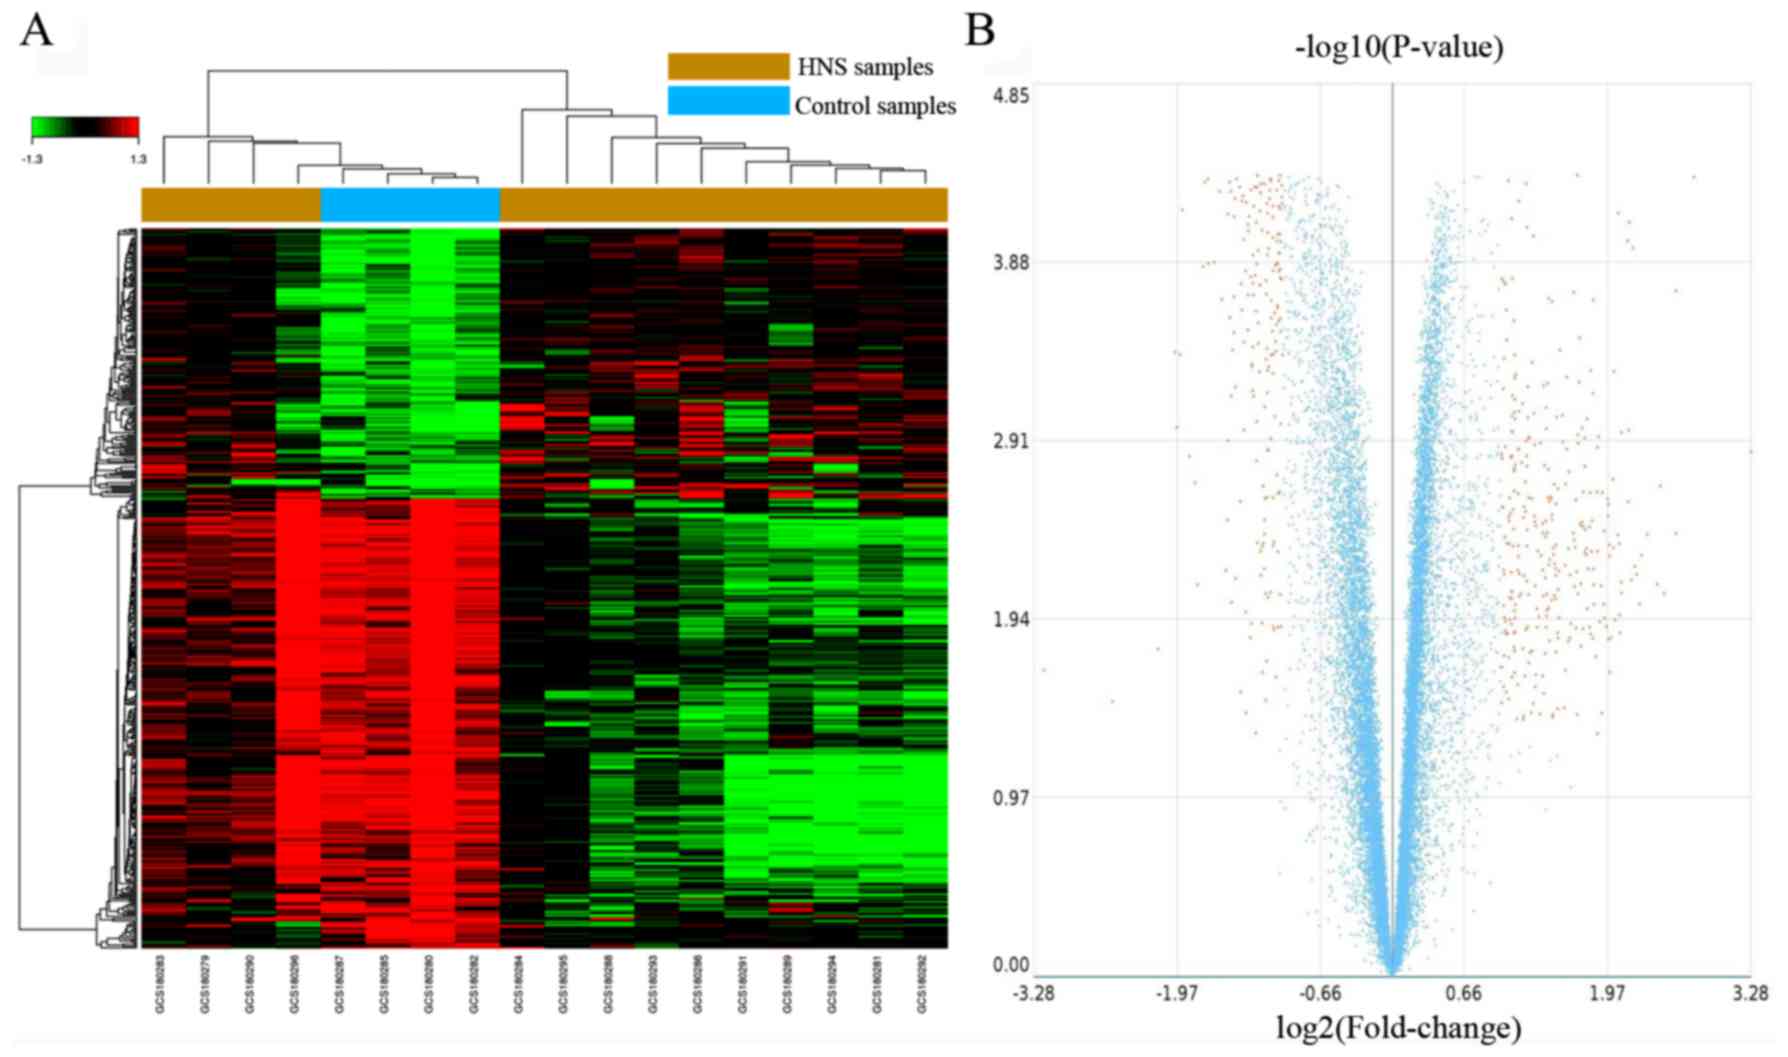
Identification of DEGs
According to the cut-off criteria of
|log2FC|>1 and FDR<0.05, a total of 483 DEGs were
identified in HNS samples compared with control samples, including
302 upregulated genes and 181 downregulated genes. The results of
DEG identification are presented in the form of a heat map and a
volcano plot (Fig. 1), and the top
10 dysregulated genes are presented in Table II. As revealed by Fig. 1A, the 4 control samples form a
sub-cluster with some of the HNS samples. The most significantly
upregulated and downregulated genes are albumin (ALB;
FC=9.74) and DEAD-box helicase 3, Y linked (DDX3Y; FC=−9.14)
(Table III).
| Table II.Top 10 differentially expressed genes
associated with hypertensive nephrosclerosis. |
Table II.
Top 10 differentially expressed genes
associated with hypertensive nephrosclerosis.
| Gene symbol | Gene
description | Fold-change | P-value | False discovery
rate |
|---|
| ALB | Albumin | 9.74 |
1.42×10⁻³ |
1.24×10⁻³ |
| DDX3Y | DEAD-box helicase
3, Y-linked | −9.14 |
2.18×10⁻² |
2.11×10⁻² |
| EGR1 | Early growth
response 1 | 6.78 |
4.60×10⁻⁵ | 0 |
| FOS | FBJ murine
osteosarcoma viral oncogene homolog | 6.06 |
1.90×10⁻⁴ | 0 |
| HPD |
4-hydroxyphenylpyruvate dioxygenase | 6.04 |
3.95×10⁻³ |
1.83×10⁻³ |
| RPS4Y1 | Ribosomal protein
S4, Y-linked 1 | −5.92 |
3.23×10⁻² |
3.17×10⁻² |
| ABP1 | Amiloride binding
protein 1 (amine oxidase (copper-containing)) | 5.62 |
8.38×10⁻³ |
5.04×10⁻³ |
| CYP4A11 | Cytochrome P450,
family 4, subfamily A, polypeptide 11 | 5.48 |
2.18×10⁻³ |
1.24×10⁻³ |
| ALDOB | Aldolase B,
fructose-bisphosphate | 5.37 |
7.44×10⁻³ |
5.04×10⁻³ |
| BBOX1 | γ-butyrobetaine
hydroxylase 1 | 5.05 |
4.00×10⁻³ |
3.23×10⁻³ |
| Table III.Top 10 significant gene ontology
terms of differentially expressed genes associated with
hypertensive nephrosclerosis. |
Table III.
Top 10 significant gene ontology
terms of differentially expressed genes associated with
hypertensive nephrosclerosis.
| Gene ontology
name | Differentially
expressed genes | P-value | False discovery
rate |
|---|
| Small molecule
metabolic process | 76 |
1.10×10−37 |
2.14×10⁻³⁴ |
| Cellular nitrogen
compound metabolic process | 21 |
6.42×10⁻¹⁷ |
6.25×10⁻¹⁴ |
| Transmembrane
transport | 30 |
4.48×10⁻¹⁵ |
2.91×10⁻¹² |
| Xenobiotic
metabolic process | 16 |
2.80×10⁻¹³ |
1.36×10⁻¹⁰ |
| Response to
drug | 20 |
1.72×10⁻¹² |
6.71×10⁻¹⁰ |
| Cellular response
to calcium ion | 9 |
7.68×10⁻¹² |
2.49×10⁻⁹ |
| Platelet
degranulation | 12 |
1.68×10⁻¹¹ |
4.67×10⁻⁹ |
| Platelet
activation | 16 |
1.16×10⁻¹⁰ |
2.82×10⁻⁸ |
| Steroid metabolic
process | 10 |
1.36×10⁻¹⁰ |
2.95×10⁻⁸ |
|
Gluconeogenesis | 9 |
3.41×10⁻¹⁰ |
6.64×10⁻⁸ |
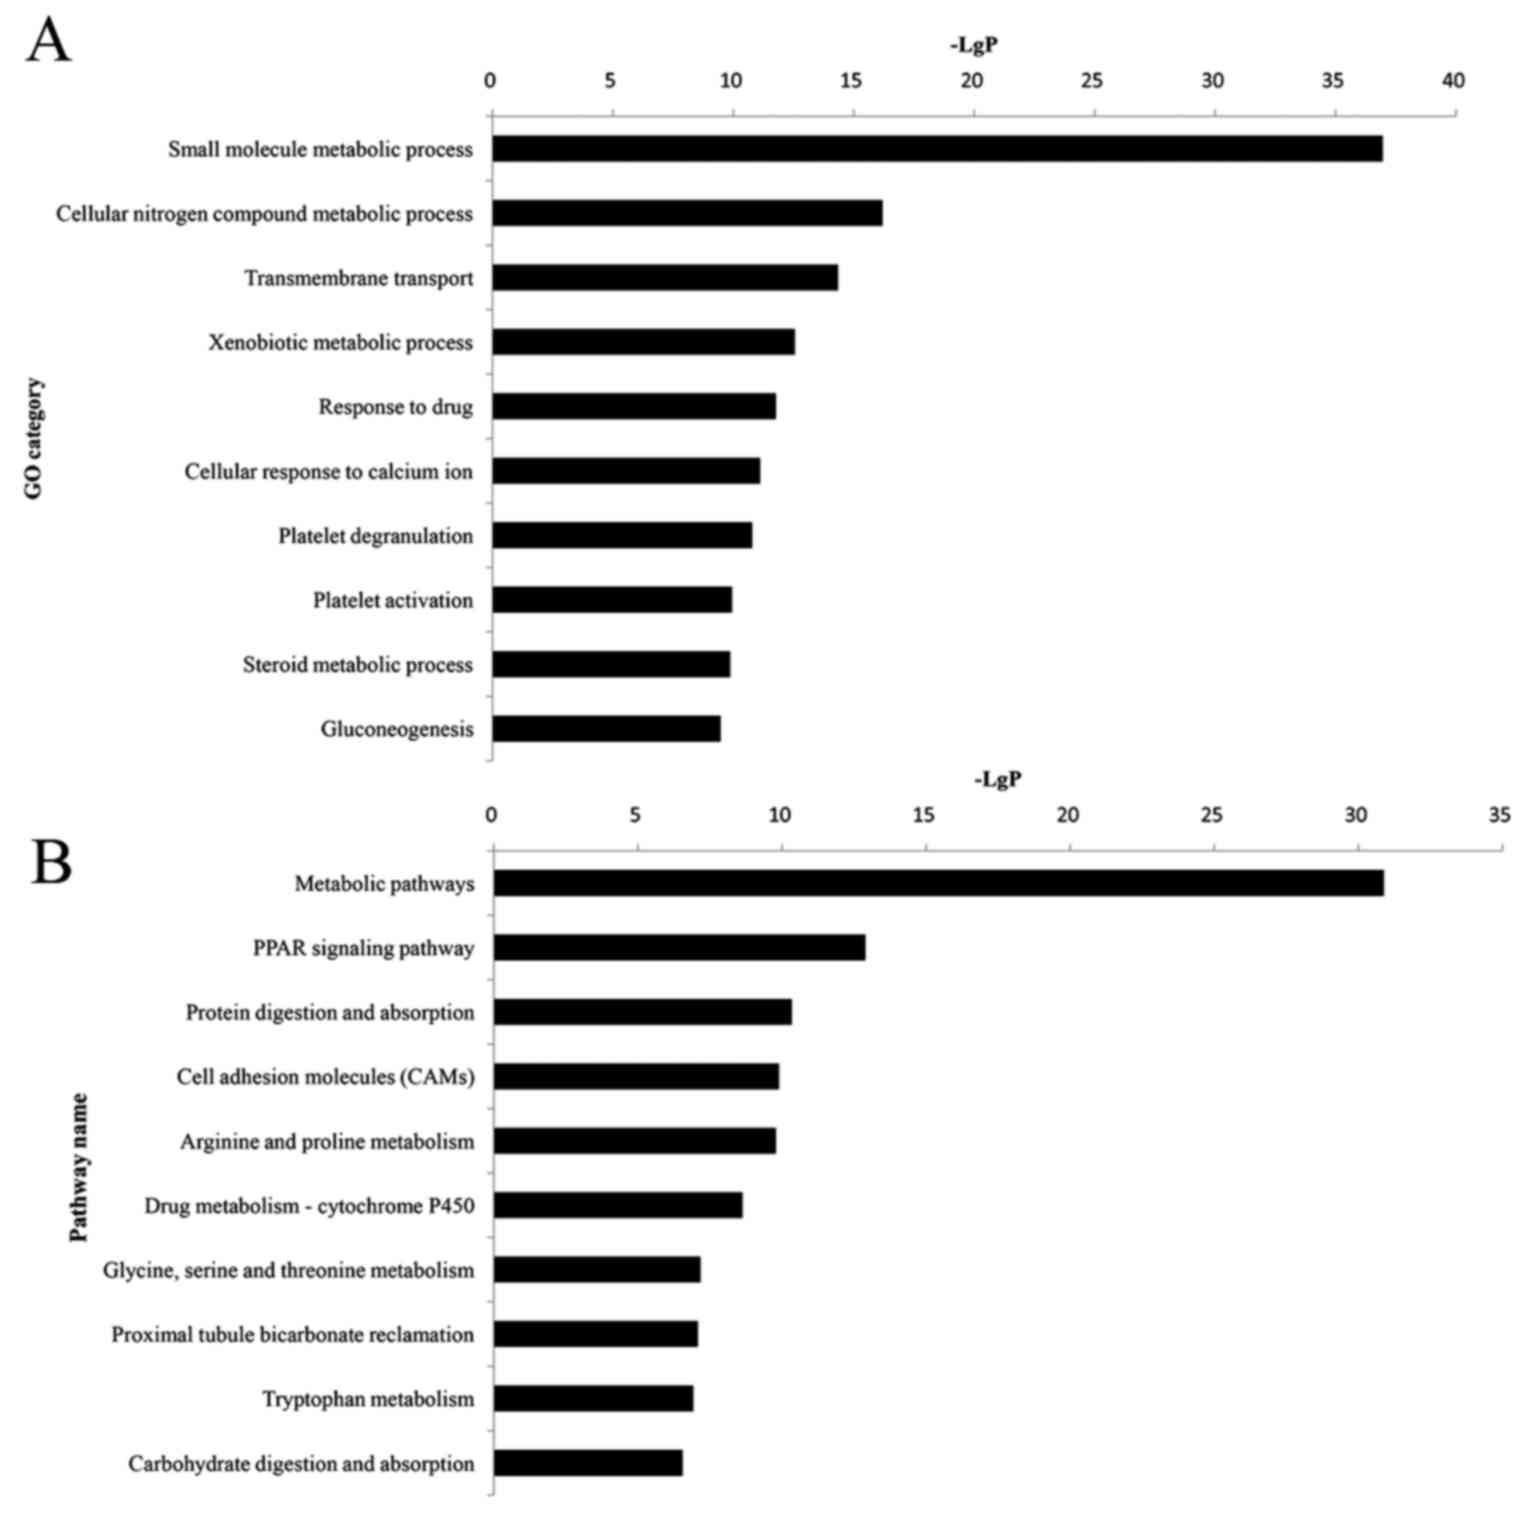
GO and KEGG pathway enrichment
analyses
All DEGs were uploaded to the DAVID software in
order to perform GO and KEGG analyses. GO analysis revealed that
384 significant GO categories (FDR<0.05) were regulated by DEGs,
and the top 10 significantly enriched GO terms are presented in
Fig. 2A and Table IV. Among them, the small molecule
metabolic process (P=1.10×10−37) was most significantly
associated with HNS, which contained 76 DEGs. Pathway analysis
demonstrated that 112 pathway categories (FDR<0.05) were
affected by DEGs. Both Fig. 2B and
Table IV present the top 10
significantly enriched pathways, the most prominent of which were
the metabolic pathways (P=1.32×10⁻³¹), with 65 DEGs.
| Table IV.Top 10 significant pathways of
differentially expressed genes associated with hypertensive
nephrosclerosis. |
Table IV.
Top 10 significant pathways of
differentially expressed genes associated with hypertensive
nephrosclerosis.
| Pathway name | Differentially
expressed genes | P-value | False detection
rate |
|---|
| Metabolic
pathways | 65 |
1.32×10⁻³¹ |
2.69×10⁻²⁹ |
| PPAR signaling
pathway | 13 |
1.29×10⁻¹³ |
1.32×10⁻¹¹ |
| Protein digestion
and absorption | 12 |
4.61×10⁻¹¹ |
3.13×10⁻⁹ |
| Cell adhesion
molecules | 14 |
1.27×10⁻¹⁰ |
6.50×10⁻⁹ |
| Arginine and
proline metabolism | 10 |
1.64×10⁻¹⁰ |
6.68×10⁻⁹ |
| Drug
metabolism-cytochrome P450 | 10 |
2.38×10⁻⁹ |
8.10×10⁻⁸ |
| Glycine, serine and
threonine metabolism | 7 |
6.81×10⁻⁸ |
1.98×10⁻⁶ |
| Proximal tubule
bicarbonate reclamation | 6 |
8.44×10⁻⁸ |
2.15×10⁻⁶ |
| Tryptophan
metabolism | 7 |
1.20×10⁻⁷ |
2.73×10⁻⁶ |
| Carbohydrate
digestion and absorption | 7 |
2.82×10⁻⁷ |
5.76×10⁻⁶ |
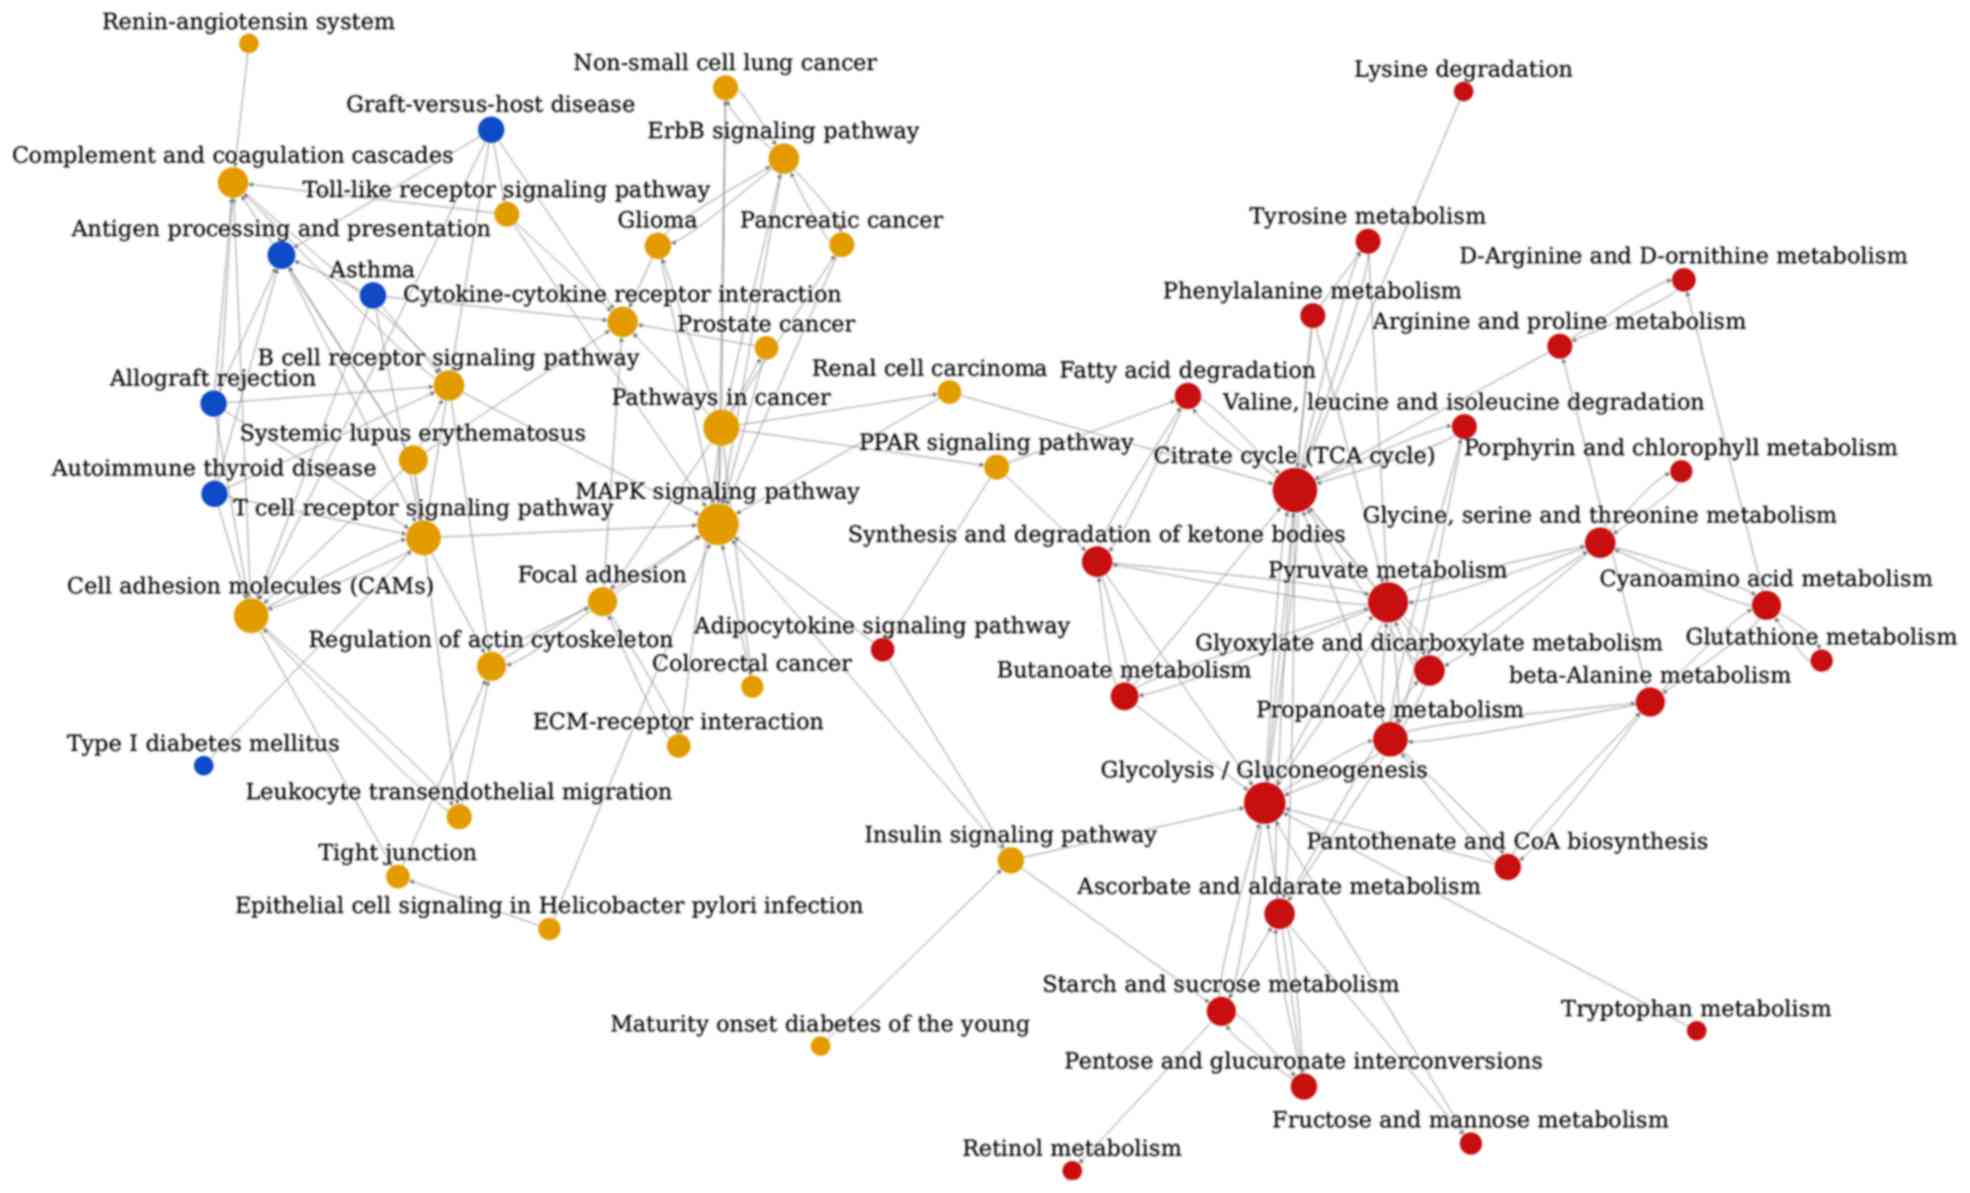
Pathway association network
analysis
The pathway association network analysis was
conducted based on the interrelation of the aforementioned 112
enriched pathway categories from KEGG, and this analysis revealed
that the 59 nodes (representing pathways) and 172 edges
(representing line connections between pathways) were assigned to
the network (Fig. 3). The top ten
hub nodes with higher degrees included the tricarboxylic acid (TCA)
cycle, glycolysis/gluconeogenesis, mitogen-activated protein kinase
(MAPK) signaling pathway, pyruvate metabolism, pathways associated
with cancer, propanoate metabolism, cell adhesion molecules, T-cell
receptor signaling pathway, ascorbate and aldarate metabolism and
the synthesis and degradation of ketone bodies (Table V).
| Table V.Top 10 key pathways according to the
degree. |
Table V.
Top 10 key pathways according to the
degree.
| Pathway name | Out degree | In degree | Total degree |
|---|
| Tricarboxylic acid
cycle | 6 | 13 | 19 |
|
Glycolysis/gluconeogenesis | 4 | 12 | 16 |
| MAPK signaling
pathway | 0 | 16 | 16 |
| Pyruvate
metabolism | 7 | 8 | 15 |
| Pathways in
cancer | 12 | 0 | 12 |
| Propanoate
metabolism | 6 | 5 | 11 |
| Cell adhesion
molecules | 4 | 7 | 11 |
| T cell receptor
signaling pathway | 3 | 8 | 11 |
| Ascorbate and
aldarate metabolism | 4 | 4 | 8 |
| Synthesis and
degradation of ketone bodies | 4 | 4 | 8 |
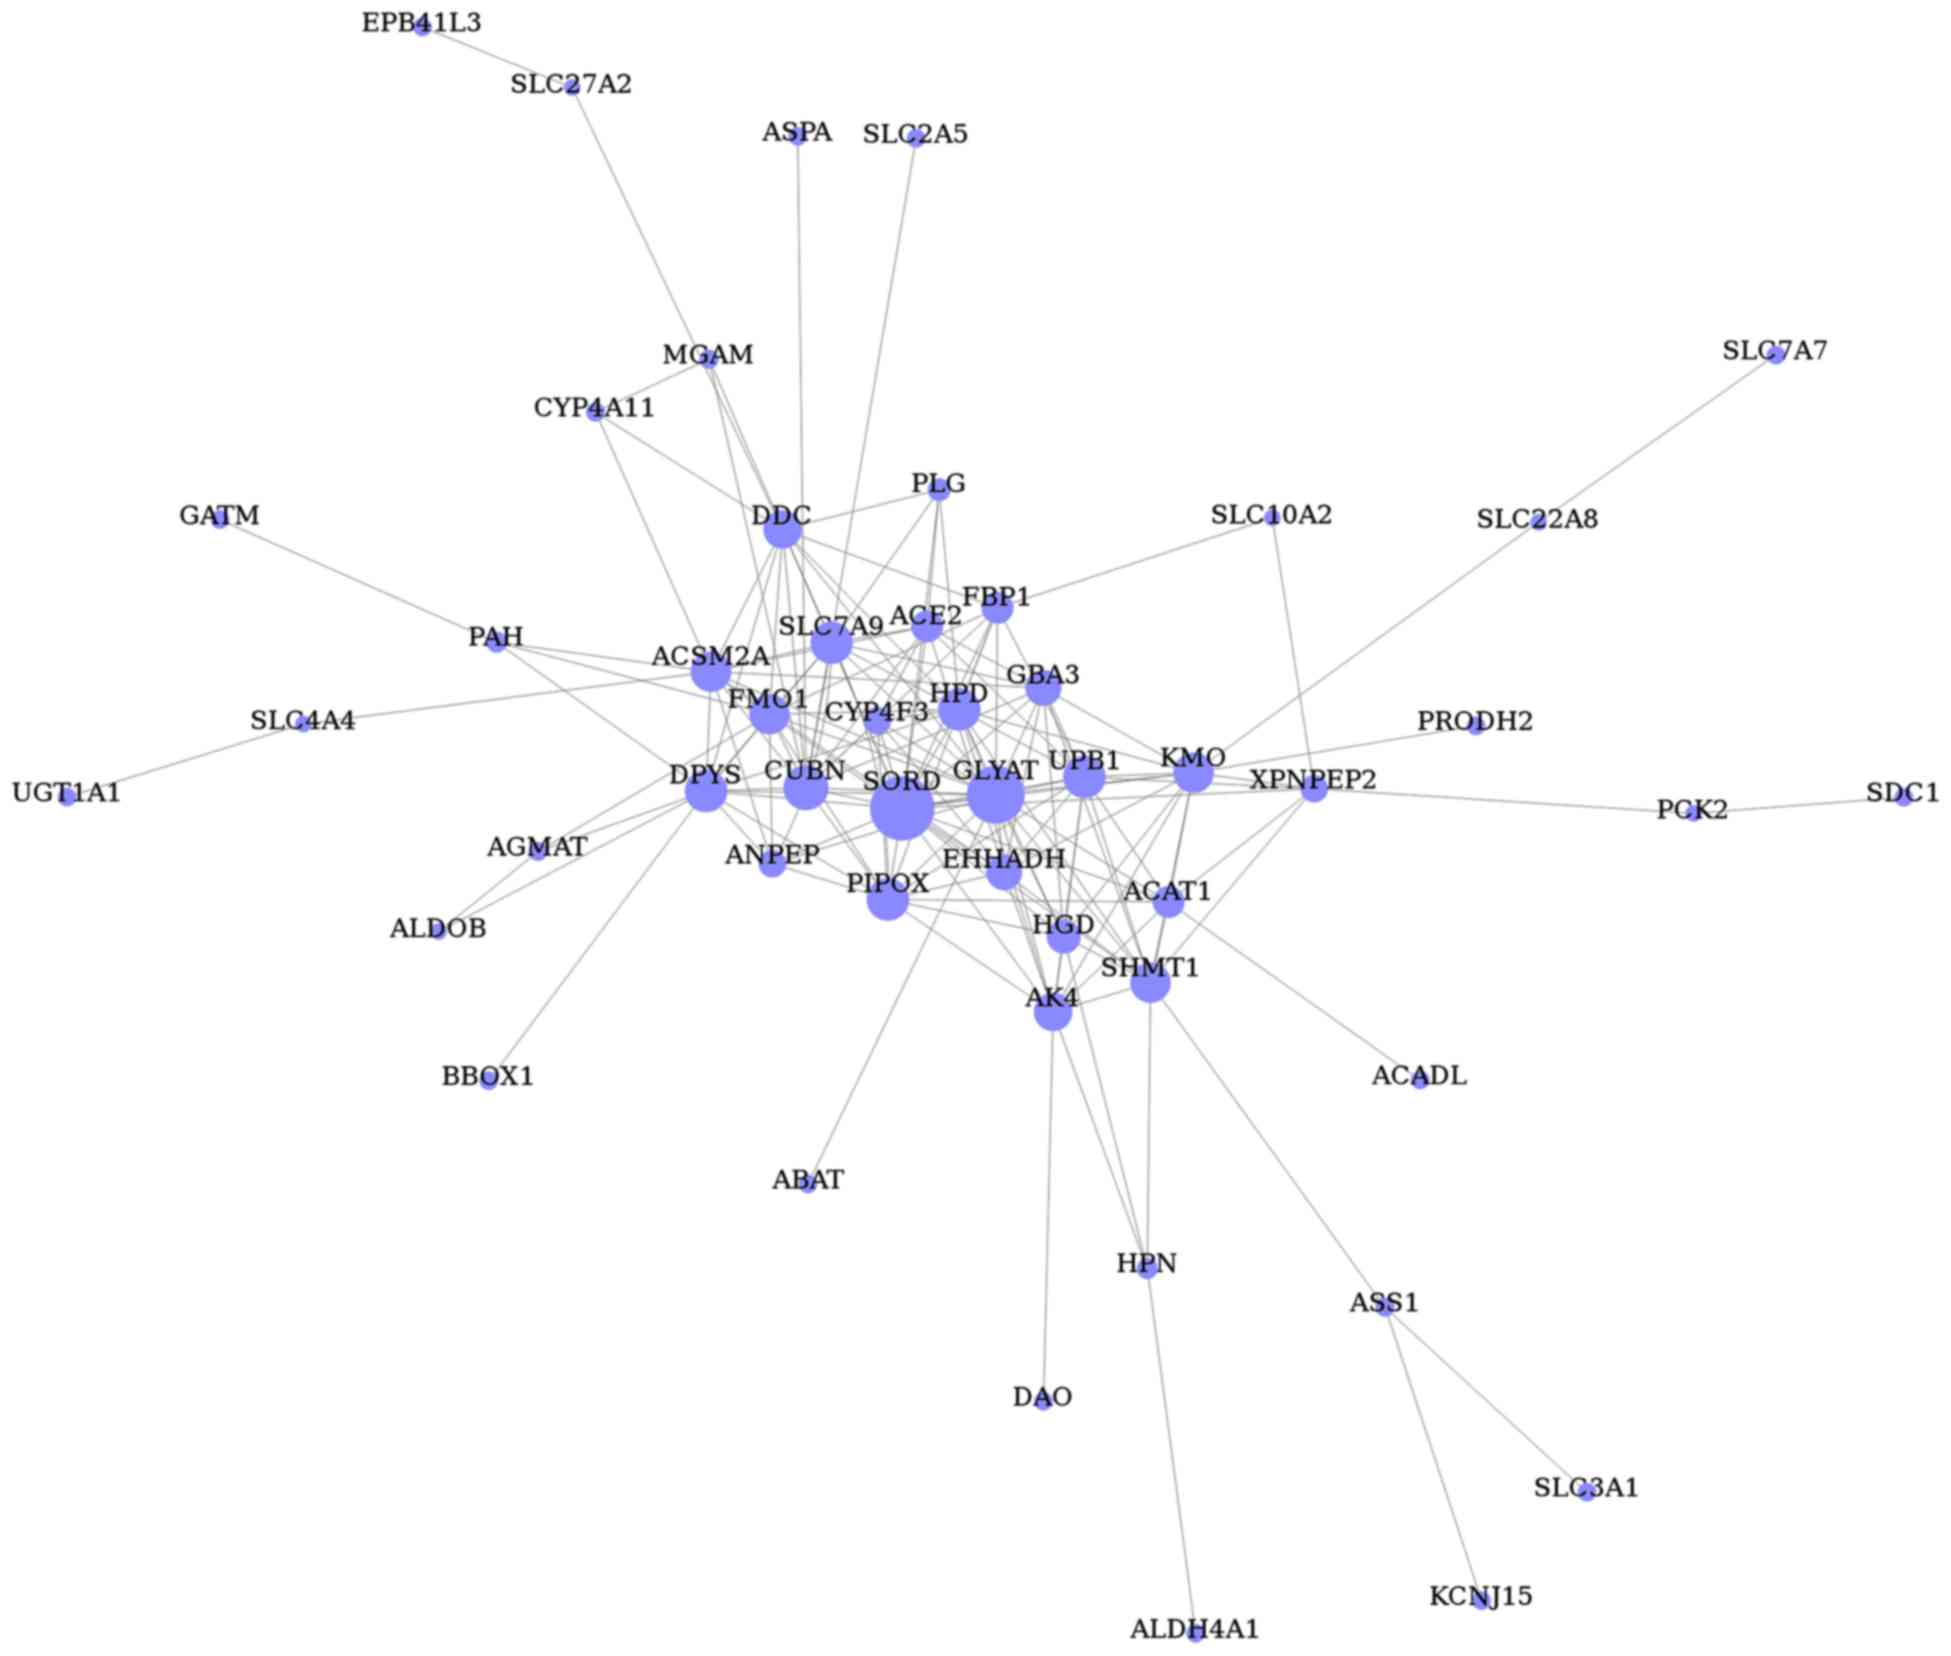
Gene co-expression network
analysis
The gene co-expression network was constructed with
respect to gene function associations (25) and contained 51 nodes (representing
the DEGs) and 168 edges (representing line connections between
nodes; Fig. 4). Based on the
connectivity degree, the hub genes were revealed to be sorbitol
dehydrogenase (SORD), glycine-N-acyltransferase
(GLYAT), cubilin (CUBN), pipecolic acid oxidase
(PIPOX), ureidopropionase β (UPB1), 4-hydroxyphenyl
pyruvate dioxygenase (HPD), dihydropyrimidinase
(DPYS), solute carrier family 7 member 9 (SLC7A9),
kynurenine 3-monoxygenase (KMO) and serine
hydroxymethyltransferase 1 (SHMT1; Table VI).
| Table VI.Top 10 key genes according to the
degree value. |
Table VI.
Top 10 key genes according to the
degree value.
| Gene | Description | Degree |
|---|
| SORD | Sorbitol
dehydrogenase | 22 |
| GLYAT |
Glycine-N-acyltransferase | 21 |
| CUBN | Cubilin (intrinsic
factor-cobalamin receptor) | 15 |
| PIPOX | Pipecolic acid
oxidase | 14 |
| UPB1 | Ureidopropionase,
β | 14 |
| HPD |
4-hydroxyphenylpyruvate dioxygenase | 14 |
| DPYS |
Dihydropyrimidinase | 14 |
| SLC7A9 | Solute carrier
family 7 member 9 | 14 |
| KMO | Kynurenine
3-monooxygenase (kynurenine 3-hydroxylase) | 13 |
| SHMT1 | Serine
hydroxymethyltransferase 1 (soluble) | 13 |
Discussion
HNS is a common disease of the kidney, which
significantly impacts patient quality of life. However, the exact
molecular mechanisms underpinning HNS remain to be determined.
High-throughput technologies can simultaneously reveal the
expression levels of thousands of molecules and thus can be used
for the prediction of potential therapeutic targets for kidney
diseases (27).
In the present study, gene expression data was
extracted from the GSE20602 dataset in order to identify the
underlying molecular mechanisms of HNS via application of numerous
bioinformatics approaches. A total of 483 DEGs, including 302
upregulated and 181 downregulated genes, were selected for in the
present study. ALB demonstrated the highest FC of all
identified DEGs in HNS. ALB encodes albumin, the most
abundant protein in human blood. Notably, urinary albumin has
previously been demonstrated to be a risk factor for HNS (28). Gupta et al (29) revealed that patients with nephrotic
proteinuria and a serum albumin >35 g/l suffered from HNS and
had poor renal survival. Furthermore, a recent study using mice
demonstrated that clinical outcomes of kidney disease were
significantly improved following gene knockdown of ALB,
which therefore suggested that filtered albumin is deleterious to
kidney cells (30).
In the present study, GO analysis was conducted with
the aim of improving current understanding of the main functions of
DEGs with regards to HNS. The results of this analysis yielded 384
significant GO terms, including small molecule metabolic process,
cellular nitrogen compound metabolic process, transmembrane
transport and the xenobiotic metabolic process. Among them, the
small molecule metabolic process was the most significant. It is
one of the GO terms that belongs to the biological process domain.
This gene function category includes thousands of small molecules,
and GO analysis revealed that there were 76 DEGs enriched in the
small molecule metabolic process term. These metabolic processes
are considered to be involved in homeostasis, and individuals with
abnormal metabolic statuses are at a significantly increased risk
of developing chronic kidney disease (31). However, due to the differences of
data preprocessing and filtering criteria, the DEGs associated with
HNS revealed by the present study differ from those obtained by
Neusser et al (13). In
terms of GO analysis, Neusser et al (13) predominantly focused on the role of
hypoxia in nephrosclerosis, thus the results of the GO analysis
were hypoxia-associated biological processes, such as angiogenesis,
inflammation and renal fibrosis. The present study, however, aimed
to reveal the pathogenesis of HNS via global bioinformatics
analysis; therefore, the GO findings of the present study are
inconsistent with those determined by Neusser et al
(13).
Similar to the GO analysis, pathway enrichment
analysis was also performed to further investigate the DEGs in HNS.
It was revealed that the DEGs were predominantly involved in
metabolic pathways and the peroxisome proliferator-activated
receptors (PPAR) signaling pathway. The kidney is an important
metabolic organ; therefore, the metabolic pathway that included 65
DEGs was proven to be the most significant pathway in the present
study. PPARs are nuclear hormone receptors and are critical for
lipid metabolism (32). A previous
study demonstrated that PPARs are highly expressed in the kidney
(33). The PPAR signaling pathway
was previously revealed to be a common pathway associated with
renal dysfunction, such as hypertensive nephropathy (34). However, GO and pathway enrichment
are preliminary analyses of DEGs and whether DEGs are implicated in
the progression of HNS remained to be verified by network
analysis.
Following pathway analyses, 59 significantly
enriched pathways were selected in order to establish a pathway
relation network. The TCA cycle, glycolysis/gluconeogenesis, MAPK
signaling pathway and pyruvate metabolism were identified as the
core pathways. The TCA cycle is a mitochondria-dependent process,
and the cell bodies of podocytes contain a substantial number of
mitochondria (35). Previous
studies have revealed that the TCA cycle functions as a bridge in
order to connect other metabolic pathways to one another (36,37).
Dysfunction of the TCA cycle was previously demonstrated to be
associated with kidney injury (38). In the present study, 3 DEGs
phosphoenol pyruvate carboxykinase 1 (PCK1), PCK2 and
oxoglutarate dehydrogenase like (OGDHL) were revealed to be
involved in the TCA cycle. The PCK1 gene encodes the
cytosolic isozyme of phosphoenolpyruvate carboxykinase (PEPCK),
whereas PCK2 encodes the mitochondrial isozyme of PEPCK
(39). PEPCK is a rate-limiting
enzyme of gluconeogenesis occurring in the liver and renal cortex,
and it is essential for glucose homeostasis (40). Numerous studies have revealed that
PCK1 is a multi-functional gene and is implicated in
physiological processes in the liver, kidney and adipose tissues
(41–43). Therefore, the TCA cycle and its
associated pathways and DEGs may take part in the regulation of HNS
development.
Finally, a gene co-expression network analysis was
conducted in order to reveal hub genes associated with HNS. A
number of prominent genes were identified as a result of their
degree value. The majority of these genes encoded metabolic
enzymes, such as SORD, GLYAT, PIPOX, UPB1, HPD, DPYS, KMO and
SHMT1. For example, SORD is the second enzyme of the polyol pathway
(involved in glycolysis), which catalyzes the conversion of
sorbitol to fructose and is highly expressed in the kidney
(44). Due to the polymorphic
variation of the SORD gene, both the accumulation and
toxicity of sorbitol are associated with the development of
microvascular problems (45),
which may be one of underlying risk factors for HNS. Furthermore,
SORD and aldolase B, another upregulated gene, are both
implicated in the sorbitol pathway, which is closely associated
with hyperglycemia (46).
Furthermore, synthesis and degradation of ketone bodies was
identified as one of the hub pathways, which is also associated
with diabetes. Whether the results of the present study are also
affected by hyperglycemia remains to be investigated by further
studies.
In addition to metabolism-associated genes,
CUBN was also identified as a hub gene (Table VI). CUBN encodes cubilin, a
proximal tubular epithelial cell protein, which was also revealed
to be expressed in glomerular podocytes (47). Mutations in CUBN have been
associated with the susceptibility to ESRD (48). Considering the association between
HNS and ESRD, it may be suggested that CUBN may be involved
in the progression of HNS. Furthermore, the megalin protein,
encoded by LRP2, is implicated in the facilitation of the
internalization of the cubilin-albumin complex (49) and is expressed in the proximal
tubule and the glomerulus (50).
LRP2 was also screened as a DEG, which confirmed the
potential role of CUBN in the pathogenesis of HNS. Further
studies on these hub genes may contribute to the development of
more effective therapeutic approaches for patients with HNS.
However, due to limited experimental conditions, the results of the
current study were predicted using only bioinformatics approaches.
Further molecular biology studies are required in order to verify
these results.
In conclusion, the present study aimed to
investigate the potential underlying molecular mechanisms of HNS
using bioinformatics analysis. A total of 483 DEGs were identified
in HNS samples compared with control samples. Furthermore, the
present study revealed that SORD, CUBN and ALB
genes, as well as the TCA cycle and metabolic pathways, may be
implicated in the pathogenesis of HNS. These results may prove
valuable for further studies aiming to investigate novel targets
for the diagnosis and treatment of HNS.
Acknowledgements
The current study was supported by the National
Natural Science Foundation of China (grant nos. 81373947, 81501003,
81603385 and 81673631) and the China Postdoctoral Science
Foundation (grant no. 2015M580465).
Competing interests
The authors declare that they have no competing
interests.
Glossary
Abbreviations
Abbreviations:
|
ALB
|
albumin
|
|
CUBN
|
cubilin
|
|
DAVID
|
Database for Annotation, Visualization
and Integrated Discovery
|
|
DEGs
|
differentially expressed genes
|
|
ESRD
|
end-stage renal disease
|
|
FC
|
fold-change
|
|
FDR
|
false discovery rate
|
|
GEO
|
Gene Expression Omnibus
|
|
GO
|
Gene Ontology
|
|
HNS
|
hypertensive nephrosclerosis
|
|
KEGG
|
Kyoto Encyclopedia of Genes and
Genomes
|
|
PPARs
|
peroxisome proliferator-activated
receptors
|
|
SORD
|
sorbitol dehydrogenase
|
|
TCA cycle
|
tricarboxylic acid cycle
|
References
|
1
|
Muta K, Obata Y, Oka S, Abe S, Minami K,
Kitamura M, Endo D, Koji T and Nishino T: Curcumin ameliorates
nephrosclerosis via suppression of histone acetylation independent
of hypertension. Nephrol Dial Transplant. 31:1615–1623. 2016.
View Article : Google Scholar : PubMed/NCBI
|
|
2
|
Meyrier A: Nephrosclerosis: Update on a
centenarian. Nephrol Dial Transplant. 30:1833–1841. 2015.
View Article : Google Scholar : PubMed/NCBI
|
|
3
|
Hughson MD, Puelles VG, Hoy WE,
Douglas-Denton RN, Mott SA and Bertram JF: Hypertension, glomerular
hypertrophy and nephrosclerosis: The effect of race. Nephrol Dial
Transplant. 29:1399–1409. 2014. View Article : Google Scholar : PubMed/NCBI
|
|
4
|
Murea M and Freedman BI: Essential
hypertension and risk of nephropathy: A reappraisal. Curr Opin
Nephrol Hypertens. 19:235–241. 2010. View Article : Google Scholar : PubMed/NCBI
|
|
5
|
Liang S, Le W, Liang D, Chen H, Xu F, Chen
H, Liu Z and Zeng C: Clinico-pathological characteristics and
outcomes of patients with biopsy-proven hypertensive
nephrosclerosis: A retrospective cohort study. Bmc Nephrol.
17:422016. View Article : Google Scholar : PubMed/NCBI
|
|
6
|
Lv Y, Que Y, Su Q, Li Q, Chen X and Lu H:
Bioinformatics facilitating the use of microarrays to delineate
potential miRNA biomarkers in aristolochic acid nephropathy.
Oncotarget. 7:52270–52280. 2016. View Article : Google Scholar : PubMed/NCBI
|
|
7
|
Zhao YY: Metabolomics in chronic kidney
disease. Clin Chim Acta. 422:59–69. 2013. View Article : Google Scholar : PubMed/NCBI
|
|
8
|
Papadopoulos T, Krochmal M, Cisek K,
Fernandes M, Husi H, Stevens R, Bascands J, Schanstra JP and Klein
J: Omics databases on kidney disease: Where they can be found and
how to benefit from them. Clin Kidney J. 9:343–352. 2016.
View Article : Google Scholar : PubMed/NCBI
|
|
9
|
Liang B, Li C and Zhao J: Identification
of key pathways and genes in colorectal cancer using bioinformatics
analysis. Med Oncol. 33:1112016. View Article : Google Scholar : PubMed/NCBI
|
|
10
|
Berthier CC, Bethunaickan R,
Gonzalez-Rivera T, Nair V, Ramanujam M, Zhang W, Bottinger EP,
Segerer S, Lindenmeyer M, Cohen CD, et al: Cross-species
transcriptional network analysis defines shared inflammatory
responses in murine and human lupus nephritis. J Immunol.
189:988–1001. 2012. View Article : Google Scholar : PubMed/NCBI
|
|
11
|
Hauser PV, Perco P, Mühlberger I, Pippin
J, Blonski M, Mayer B, Alpers CE, Oberbauer R and Shankland SJ:
Microarray and bioinformatics analysis of gene expression in
experimental membranous nephropathy. Nephron Exp Nephrol.
112:e43–e58. 2009. View Article : Google Scholar : PubMed/NCBI
|
|
12
|
Eissa S, Matboli M and Bekhet MM: Clinical
verification of a novel urinary microRNA panal: 133b, −342 and −30
as biomarkers for diabetic nephropathy identified by bioinformatics
analysis. Biomed Pharmacother. 83:92–99. 2016. View Article : Google Scholar : PubMed/NCBI
|
|
13
|
Neusser MA, Lindenmeyer MT, Moll AG,
Segerer S, Edenhofer I, Sen K, Stiehl DP, Kretzler M, Gröne H,
Schlöndorff D and Cohen CD: Human nephrosclerosis triggers a
hypoxia-related glomerulopathy. Am J Pathol. 176:594–607. 2010.
View Article : Google Scholar : PubMed/NCBI
|
|
14
|
Marcantoni C and Fogo AB: A perspective on
arterionephrosclerosis: From pathology to potential pathogenesis. J
Nephrol. 20:518–524. 2007.PubMed/NCBI
|
|
15
|
Fogo A, Breyer JA, Smith MC, Cleveland WH,
Agodoa L, Kirk KA and Glassock R: Accuracy of the diagnosis of
hypertensive nephrosclerosis in African Americans: A report from
the African American study of kidney disease (AASK) Trial. AASK
pilot study investigators. Kidney Int. 51:244–252. 1997. View Article : Google Scholar : PubMed/NCBI
|
|
16
|
Schlessinger SD, Tankersley MR and Curtis
JJ: Clinical documentation of end-stage renal disease due to
hypertension. Am J Kidney Dis. 23:655–660. 1994. View Article : Google Scholar : PubMed/NCBI
|
|
17
|
Bolstad BM: Low-level analysis of
high-density oligonucleotide array data: Background, normalization
and summarization. unpublished PhD thesisUniversity of California
Berkeley: 2004
|
|
18
|
Benjamini Y and Hochberg Y: Controlling
the false discovery rate: A practical and powerful approach to
multiple testing. J Royal Stat Soc Series B (Methodological).
57:289–300. 1995.
|
|
19
|
Yang Y, Kai G, Pu XD, Qing K, Guo XR and
Zhou XY: Expression profile of microRNAs in fetal lung development
of Sprague-Dawley rats. Int J Mol Med. 29:393–402. 2012.PubMed/NCBI
|
|
20
|
Eisen MB, Spellman PT, Brown PO and
Botstein D: Cluster analysis and display of genome-wide expression
patterns. Proc Natl Acad Sci USA. 95:pp. 14863–14868. 1998;
View Article : Google Scholar : PubMed/NCBI
|
|
21
|
Ashburner M, Ball CA, Blake JA, Botstein
D, Butler H, Cherry JM, Davis AP, Dolinski K, Dwight SS, Eppig JT,
et al: Gene ontology: Tool for the unification of biology. The gene
ontology consortium. Nat Genet. 25:25–29. 2000. View Article : Google Scholar : PubMed/NCBI
|
|
22
|
Kanehisa M and Goto S: KEGG: Kyoto
encyclopedia of genes and genomes. Nucleic Acids Res. 28:27–30.
2000. View Article : Google Scholar : PubMed/NCBI
|
|
23
|
Dennis G Jr, Sherman BT, Hosack DA, Yang
J, Gao W, Lane HC and Lempicki RA: DAVID: Database for annotation,
visualization, and integrated discovery. Genome Biol. 4:P32003.
View Article : Google Scholar : PubMed/NCBI
|
|
24
|
Langfelder P, Mischel PS and Horvath S:
When is hub gene selection better than standard meta-analysis? PLoS
One. 8:e615052013. View Article : Google Scholar : PubMed/NCBI
|
|
25
|
Sun Y, Yu B, Zhang K, Chen X and Chen D:
Paradigm of time-sequence development of the intestine of suckling
piglets with microarray. Asian-Australas J Anim Sci. 25:1481–1492.
2012. View Article : Google Scholar : PubMed/NCBI
|
|
26
|
Wei Z and Li H: A Markov random field
model for network-based analysis of genomic data. Bioinformatics.
23:1537–1544. 2007. View Article : Google Scholar : PubMed/NCBI
|
|
27
|
Zhao YY, Cheng XL, Lin RC and Wei F:
Lipidomics applications for disease biomarker discovery in mammal
models. Biomark Med. 9:153–168. 2015. View Article : Google Scholar : PubMed/NCBI
|
|
28
|
Schreiner GF: Renal toxicity of albumin
and other lipoproteins. Curr Opin Nephrol Hypertens. 4:369–373.
1995. View Article : Google Scholar : PubMed/NCBI
|
|
29
|
Gupta K, Iskandar SS, Daeihagh P, Ratliff
HL and Bleyer AJ: Distribution of pathologic findings in
individuals with nephrotic proteinuria according to serum albumin.
Nephrol Dial Transplant. 23:1595–1599. 2008. View Article : Google Scholar : PubMed/NCBI
|
|
30
|
Jarad G, Knutsen RH, Mecham RP and Miner
JH: Albumin contributes to kidney disease progression in Alport
syndrome. Am J Physiol Renal Physiol. 311:F120–F130. 2016.
View Article : Google Scholar : PubMed/NCBI
|
|
31
|
Zhang J, Jiang H and Chen J: Combined
effect of body mass index and metabolic status on the risk of
prevalent and incident chronic kidney disease: A systematic review
and meta-analysis. Oncotarget. 8:35619–35629. 2017.PubMed/NCBI
|
|
32
|
Issemann I and Green S: Activation of a
member of the steroid hormone receptor superfamily by peroxisome
proliferators. Nature. 347:645–650. 1990. View Article : Google Scholar : PubMed/NCBI
|
|
33
|
Jiang L, Chen XP, Long YB, Lei FY, Zhou
ZQ, Qin YH, Huang WF and Zhou TB: The potential signaling pathway
between peroxisome proliferator-activated receptor gamma and
retinoic acid receptor alpha in renal interstitial fibrosis
disease. J Recept Signal Transduct Res. 35:258–268. 2015.
View Article : Google Scholar : PubMed/NCBI
|
|
34
|
Hou X, Shen YH, Li C, Wang F, Zhang C, Bu
P and Zhang Y: PPARalpha agonist fenofibrate protects the kidney
from hypertensive injury in spontaneously hypertensive rats via
inhibition of oxidative stress and MAPK activity. Biochem Biophys
Res Commun. 394:653–659. 2010. View Article : Google Scholar : PubMed/NCBI
|
|
35
|
Su M, Dhoopun AR, Yuan Y, Huang S, Zhu C,
Ding G, Liu B, Yang T and Zhang A: Mitochondrial dysfunction is an
early event in aldosterone-induced podocyte injury. Am J Physiol
Renal Physiol. 305:F520–F531. 2013. View Article : Google Scholar : PubMed/NCBI
|
|
36
|
Martin-Lorenzo M, Martinez PJ,
Baldan-Martin M, Ruiz-Hurtado G, Prado JC, Segura J, de la Cuesta
F, Barderas MG, Vivanco F, Ruilope LM and Alvarez-Llamas G: Citric
acid metabolism in resistant hypertension: Underlying mechanisms
and metabolic prediction of treatment response. Hypertension.
70:1049–1056. 2017. View Article : Google Scholar : PubMed/NCBI
|
|
37
|
Hallan S, Afkarian M, Zelnick LR,
Kestenbaum B, Sharma S, Saito R, Darshi M, Barding G, Raftery D, Ju
W, et al: Metabolomics and gene expression analysis reveal
down-regulation of the citric acid (TCA) Cycle in non-diabetic CKD
patients. EBioMedicine. Oct 31–2017.(Epub ahead of print).
View Article : Google Scholar : PubMed/NCBI
|
|
38
|
Gao S, Chen W, Peng Z, Li N, Su L, Lv D,
Li L, Lin Q, Dong X, Guo Z and Lou Z: Urinary metabonomics
elucidate the therapeutic mechanism of Orthosiphon stamineus in
mouse crystal-induced kidney injury. J Ethnopharmacol. 166:323–332.
2015. View Article : Google Scholar : PubMed/NCBI
|
|
39
|
Beale EG, Harvey BJ and Forest C: PCK1 and
PCK2 as candidate diabetes and obesity genes. Cell Biochem Biophys.
48:89–95. 2007. View Article : Google Scholar : PubMed/NCBI
|
|
40
|
Zhang ZB, Zhang W, Li RL, Li JB, Zhong JF,
Zhao ZS and Huang JM: Novel splice variants of the bovine PCK1
gene. Genet Mol Res. 12:4028–4035. 2013. View Article : Google Scholar : PubMed/NCBI
|
|
41
|
Chakravarty K, Cassuto H, Reshef L and
Hanson RW: Factors that control the tissue-specific transcription
of the gene for phosphoenolpyruvate carboxykinase-C. Crit Rev
Biochem Mol Biol. 40:129–154. 2005. View Article : Google Scholar : PubMed/NCBI
|
|
42
|
Semakova J, Hyroššová P, Méndez-Lucas A,
Cutz E, Bermudez J, Burgess S, Alcántara S and Perales JC: PEPCK-C
reexpression in the liver counters neonatal hypoglycemia in Pck1
del/del mice, unmasking role in non-gluconeogenic tissues. J
Physiol Biochem. 73:89–98. 2017. View Article : Google Scholar : PubMed/NCBI
|
|
43
|
Brito MN, Brito NA, Brito SR, Moura MA,
Kawashita NH, Kettelhut IC and Migliorini RH: Brown adipose tissue
triacylglycerol synthesis in rats adapted to a high-protein,
carbohydrate-free diet. Am J Physiol. 276:R1003–R1009.
1999.PubMed/NCBI
|
|
44
|
Iwata T, Popescu NC, Zimonjic DB, Karlsson
C, Höög JO, Vaca G, Rodriguez IR and Carper D: Structural
organization of the human sorbitol dehydrogenase gene (SORD).
Genomics. 26:55–62. 1995. View Article : Google Scholar : PubMed/NCBI
|
|
45
|
Carr IM and Markham AF: Molecular genetic
analysis of the human sorbitol dehydrogenase gene. Mamm Genome.
6:645–652. 1995. View Article : Google Scholar : PubMed/NCBI
|
|
46
|
Obrosova IG, Ilnytska O, Lyzogubov VV,
Pavlov IA, Mashtalir N, Nadler JL and Drel VR: High-fat diet
induced neuropathy of pre-diabetes and obesity: Effects of
‘healthy’ diet and aldose reductase inhibition. Diabetes.
56:2598–2608. 2007. View Article : Google Scholar : PubMed/NCBI
|
|
47
|
Prabakaran T, Christensen EI, Nielsen R
and Verroust PJ: Cubilin is expressed in rat and human glomerular
podocytes. Nephrol Dial Transplant. 27:3156–3159. 2012. View Article : Google Scholar : PubMed/NCBI
|
|
48
|
Reznichenko A, Snieder H, Van den Born J,
de Borst MH, Damman J, van Dijk MC, van Goor H, Hepkema BG,
Hillebrands JL, Leuvenink HG, et al: CUBN as a novel locus for
end-stage renal disease: Insights from renal transplantation. PLoS
One. 7:e365122012. View Article : Google Scholar : PubMed/NCBI
|
|
49
|
Ma J, Guan M, Bowden DW, Ng MC, Hicks PJ,
Lea JP, Ma L, Gao C, Palmer ND and Freedman BI: Association
Analysis of the Cubilin (CUBN) and Megalin (LRP2) genes with ESRD
in African Americans. Clin J Am Soc Nephro. 11:1034–1043. 2016.
View Article : Google Scholar
|
|
50
|
Odera K, Goto S and Takahashi R:
Age-related change of endocytic receptors megalin and cubilin in
the kidney in rats. Biogerontology. 8:505–515. 2007. View Article : Google Scholar : PubMed/NCBI
|