Introduction
Osteosarcoma (OS), the most common primary
malignancy of bone, can occur at any age, but predominantly
develops in adolescents, with ~400 newly diagnosed cases each year
in America (1). OS accounts for
~60% of all bone malignancies diagnosed in patients <20 years
old (2,3). Several studies reported that disease
stage, gender, age, pathology subtypes and primary tumor site of OS
result in differences in survival rate, with younger patients
exhibiting significant better prognosis and higher survival rate
than the elderly (2,4). With improved chemotherapy outcomes in
the 1980s, the 5-year event-free survival was significantly
increased, whereas it has remained stable without any significant
improvement in the past 20 years (5–7).
Uncovering the tumorigenesis and progression mechanisms is crucial
for developing effective molecular targeted therapy. In the past
decades, efforts have been made to clarify the molecular basis of
OS. Substantial progress has been made using gene expression
profiles of OS to reveal the molecular pathogenesis of OS. Age is a
prognostic factor of OS insofar as we know; however, few studies
have investigated the underlying molecular mechanisms, which may
contribute to various outcomes.
Original microarray datasets of 36 OS samples from
patients aged <20 and 6 matched samples aged >20 (GSE39058)
(8), and 58 OS samples from
patients aged <20 and 7 matched samples from patients aged
>20 from human non-coding RNA profiling data (GSE39040)
(8), were obtained from the human
expression database Gene Expression Omnibus (GEO; http://www.ncbi.nlm.nih.gov/geo/). Differentially
expressed genes (DEGs) between OS cases aged <20 and matched
cases aged >20 were screened using R software limma package
(9). Gene function analysis,
including Gene Ontology (GO) and KOBAS-Kyoto Encyclopedia of Genes
and Genomes (KEGG) pathways, were performed using the
differentially expressed mRNAs on Metascape (http://metascape.org/gp/). A regulatory network was
constructed by combining the protein-protein interaction (PPI)
network with microRNA (miRNA)-mRNA interactions to reveal the
potential molecular differences between the different age groups.
Kaplan-Meier survival analysis was also performed to clarify our
result. In conclusion, the regulatory networks were constructed and
the potential important key signaling pathways were analyzed by
applying bioinformatics tools to investigate different molecular
mechanism of OS among different age groups.
Materials and methods
Microarray data
Microarray data was retrieved from the GSE39058 and
GSE39040 GEO (https://www.ncbi.nlm.nih.gov/geo). The mRNA expression
of 36 OS samples from patients aged <20 and 6 matched samples
from patients aged >20 obtained from GSE39058, based on the
GPL14951 Illumina HumanHT-12 WG-DASL V4.0 R2 expression BeadChip
(Illumina, Inc., San Diego, CA, USA). Similarly, a total of 58 OS
samples from patients aged <20 and 7 matched samples from
patients aged >20 were available in GSE39040, based on the
GPL15762 Illumina Human v2 MicroRNA Expression BeadChip.
Data processing
Following background correction and quartile data
normalization of the original microarray data by using the robust
multi-array average algorithm, probes without a corresponding gene
symbol were filtered and the average value of gene symbols with
multiple probes was calculated. The selected data from GSE39058 and
GSE39040 were compared using R software limma package (http://www.bioconductor.org/packages/release/bioc/html/limma.html)
to determine the differentially expressed mRNAs and miRNAs
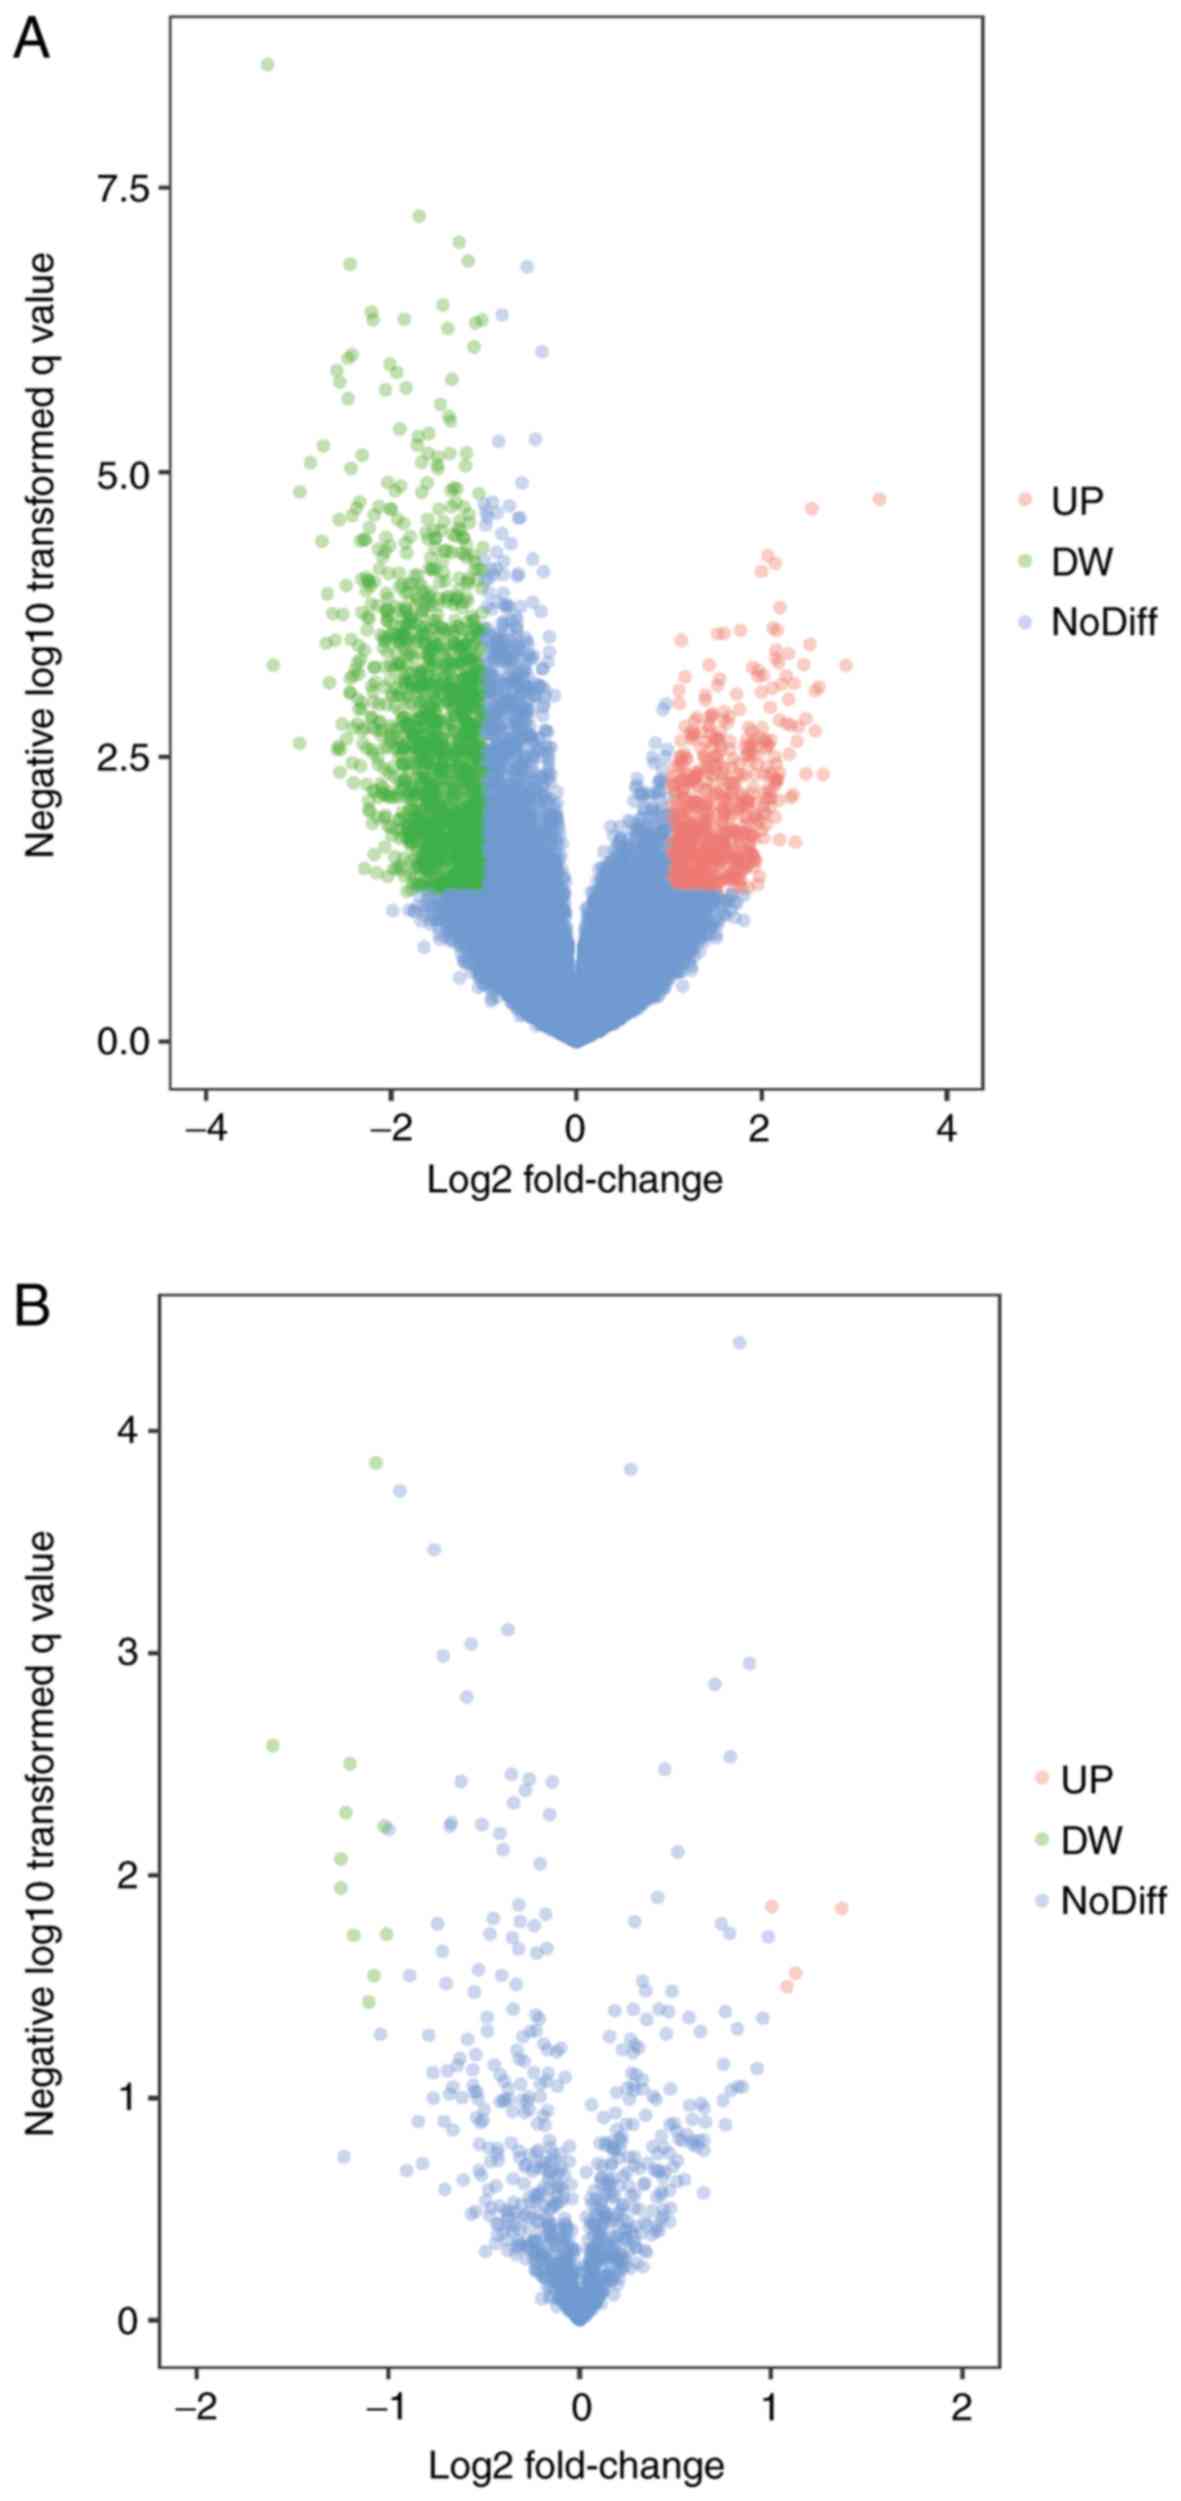
(10). With a threshold of
P<0.05 and |log2(fold change)|>1, volcano plot
filtering was performed by using R software ggplot2 package v2.2
(11) to identify the DEGs with
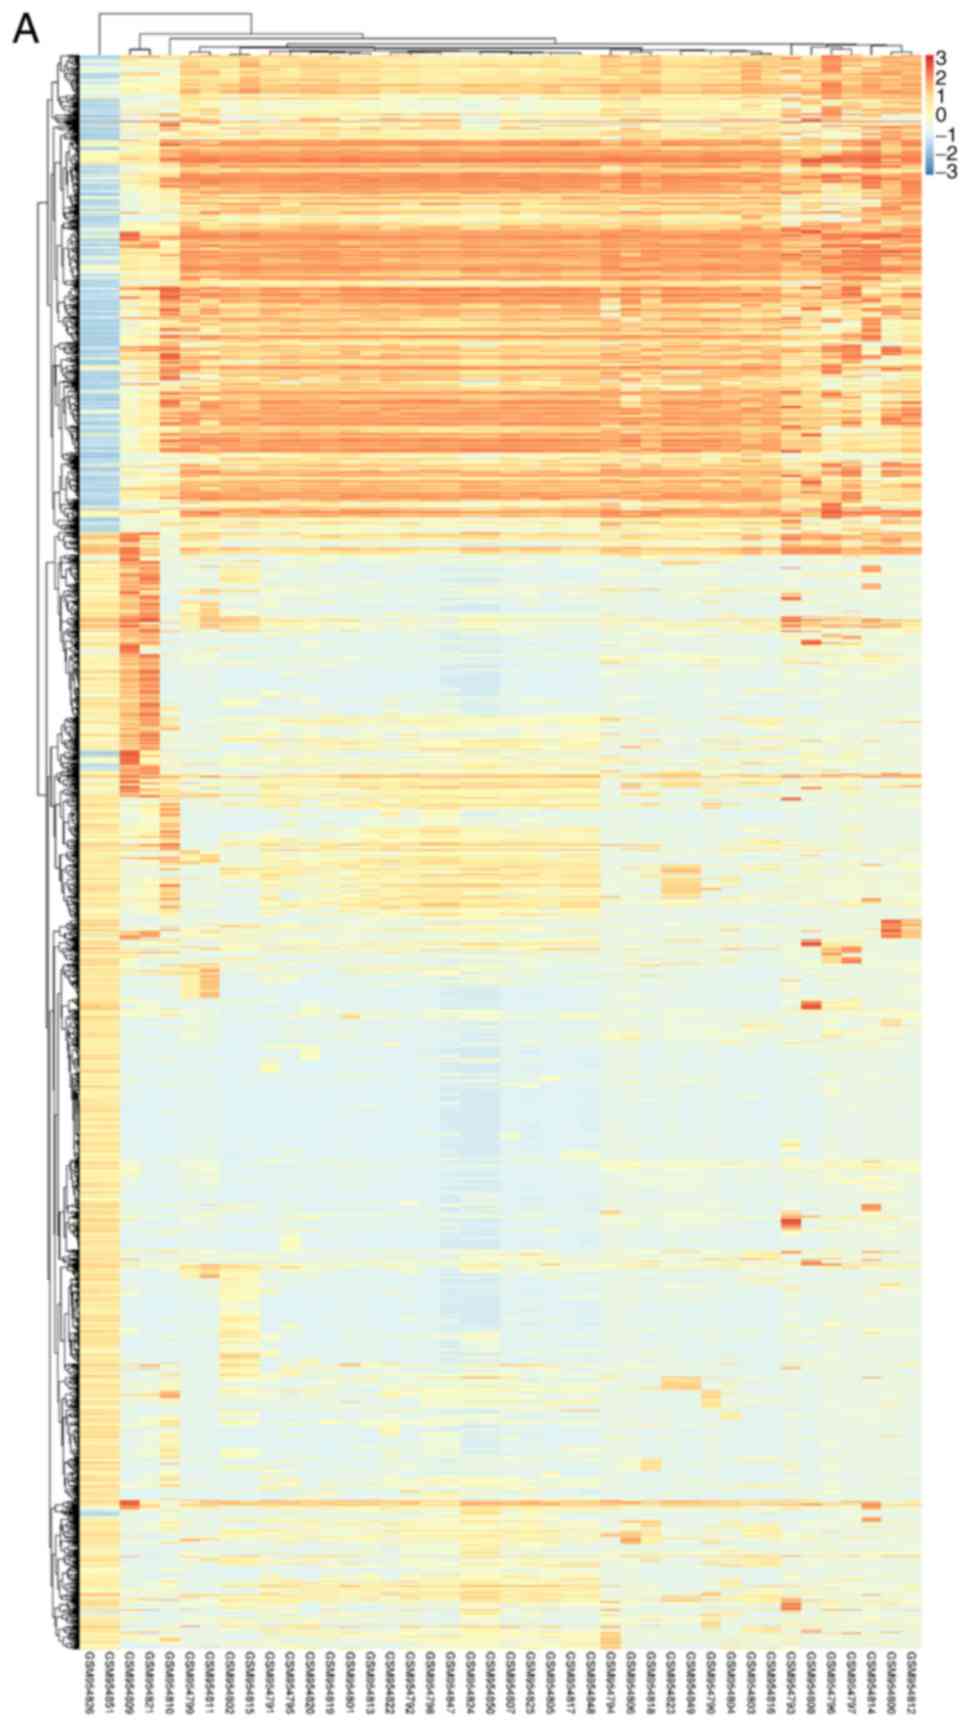
statistical significance between two groups. Hierarchical
clustering and combined analyses were performed for the DEGs. The
differentially expressed mRNAs and miRNAs obtained were described
as age-induced osteosarcoma DEMs and DEMis.
GO and KEGG pathway enrichment
analysis of DEMs
DEMs were converted to their corresponding Homo
sapiens Entrez gene IDs using the latest database (ncbi.nlm.nih.gov/gene; updated on 2018-01-01); pathway
and process enrichment analysis of DEMs was performed using
Metascape (metascape.org). All genes in the genome
were used as the enrichment background. Terms with P<0.05 were
statistically significant. Those with a minimum count of 3 and
enrichment factor >1.5 (enrichment factor is the ratio between
observed count and the count expected by chance) were collected,
and grouped into clusters based on their membership similarities.
More specifically, P-values were calculated based on accumulative
hypergeometric distribution, q-values were calculated using the
Benjamini-Hochberg procedure to account for multiple testing. κ
scores were used as the similarity metric when performing
hierachical clustering on the enriched terms and then sub-trees
with similarity >0.3 were considered a cluster. The most
statistically significant term within a cluster was selected to
represent the cluster.
Regulatory network construction and
analysis
The Search Tool for the Retrieval of Interacting
Genes/Proteins (STRING) database (string-db.org/) was used to explore the interactions
among proteins encoded by the DEMs, including known proteins
interactions and predicted interactions. The results were
downloaded from the STRING database as a TSV file, the PPI pairs
with selected larger scores were imported to the Cytoscape tool
v3.4.0 (cytoscape.org/) to establish PPI
network. The regulatory relationship between genes were analyzed
through topological property of computing network including the
degree distribution of network by using the CentiScaPe2.2 app
within Cytoscape (12). The
interaction between DEMs and DEMis was predicted using miRwalk v3.0
(mirwalk.umm.uni-heidelberg.de/) with a threshold of
energy <-20, and only the interactions of miRNA and mRNA with
opposite expression were included. Furthermore, the regulatory
network was constructed by combining the PPI network with the
predicted interactions between DEMs and DEMis. The subnetwork was
extracted from the whole PPI network using the MCODE app v1.5.1
(13).
Kaplan-Meier survival analysis
In the present study, the prognostic value of the
genes was confirmed by Kaplan-Meier survival analysis based on the
clinical information from the GSE39040 dataset using SPSS 16.0
(SPSS, Inc., Chicago, IL, USA). For statistical analysis, the
patients were divided into halves based on gene expression values.
Specifically, patients with the expression values greater than the
median value were classified as the high expression group and
others classified as the low expression group. Log rank test
(Mantel-Cox test) was used to evaluate the prognostic value of the
genes.
Results
Data processing and DEG screening
DEMs of GSE39058 were obtained using R software
limma package with |log2(fold change)|>1 and
P<0.05 as the cut-off point. In OS samples from patients aged
<20, there were 1,476 up-regulated DEMs, corresponding to 1,525
probes and 637 downregulated DEMs detected by 650 probes in OS
samples from patients aged <20 compared with OS samples from
patients aged >20. The top 10 most significantly upregulated
genes were SNORA17, SNORD3C, CRY1, TSEN34, NDUFA12, CNTFR, CPE,
PTGS2, NKD2 and EGFL6. The top 10 most significantly downregulated
genes were PPP2R2B, DSCR8, ALAS2, GPR114, NPLOC4, PDE7B, NCOA2,
MRFAP1L1, LIG3 and RUNX1. Similarly, there were 15 DEMis in
GSE39040, including 11 downregulated and 4 upregulated DEMis OS
samples from patients aged <20 compared with OS samples from
patients aged >20. The DEMis upregulated in OS samples from
patients aged <20 were hsa-miR-1248, hsa-miR-497, hsa-miR-1201
and hsa-miR-224. The downregulated DEMis were hsa-miR-122,
hsa-miR-203, hsa-miR-205, hsa-miR-194, hsa-miR-200c, hsa-miR-183,
hsa-miR-142-5p, hsa-miR-182, hsa-miR-549, hsa-miR-202* and
hsa-miR-515-5p. The volcano plot of each microarray is presented in
Fig. 1 to visualize DEGs. Fig. 2 presented the cluster heatmaps of
DEMs and DEMis.
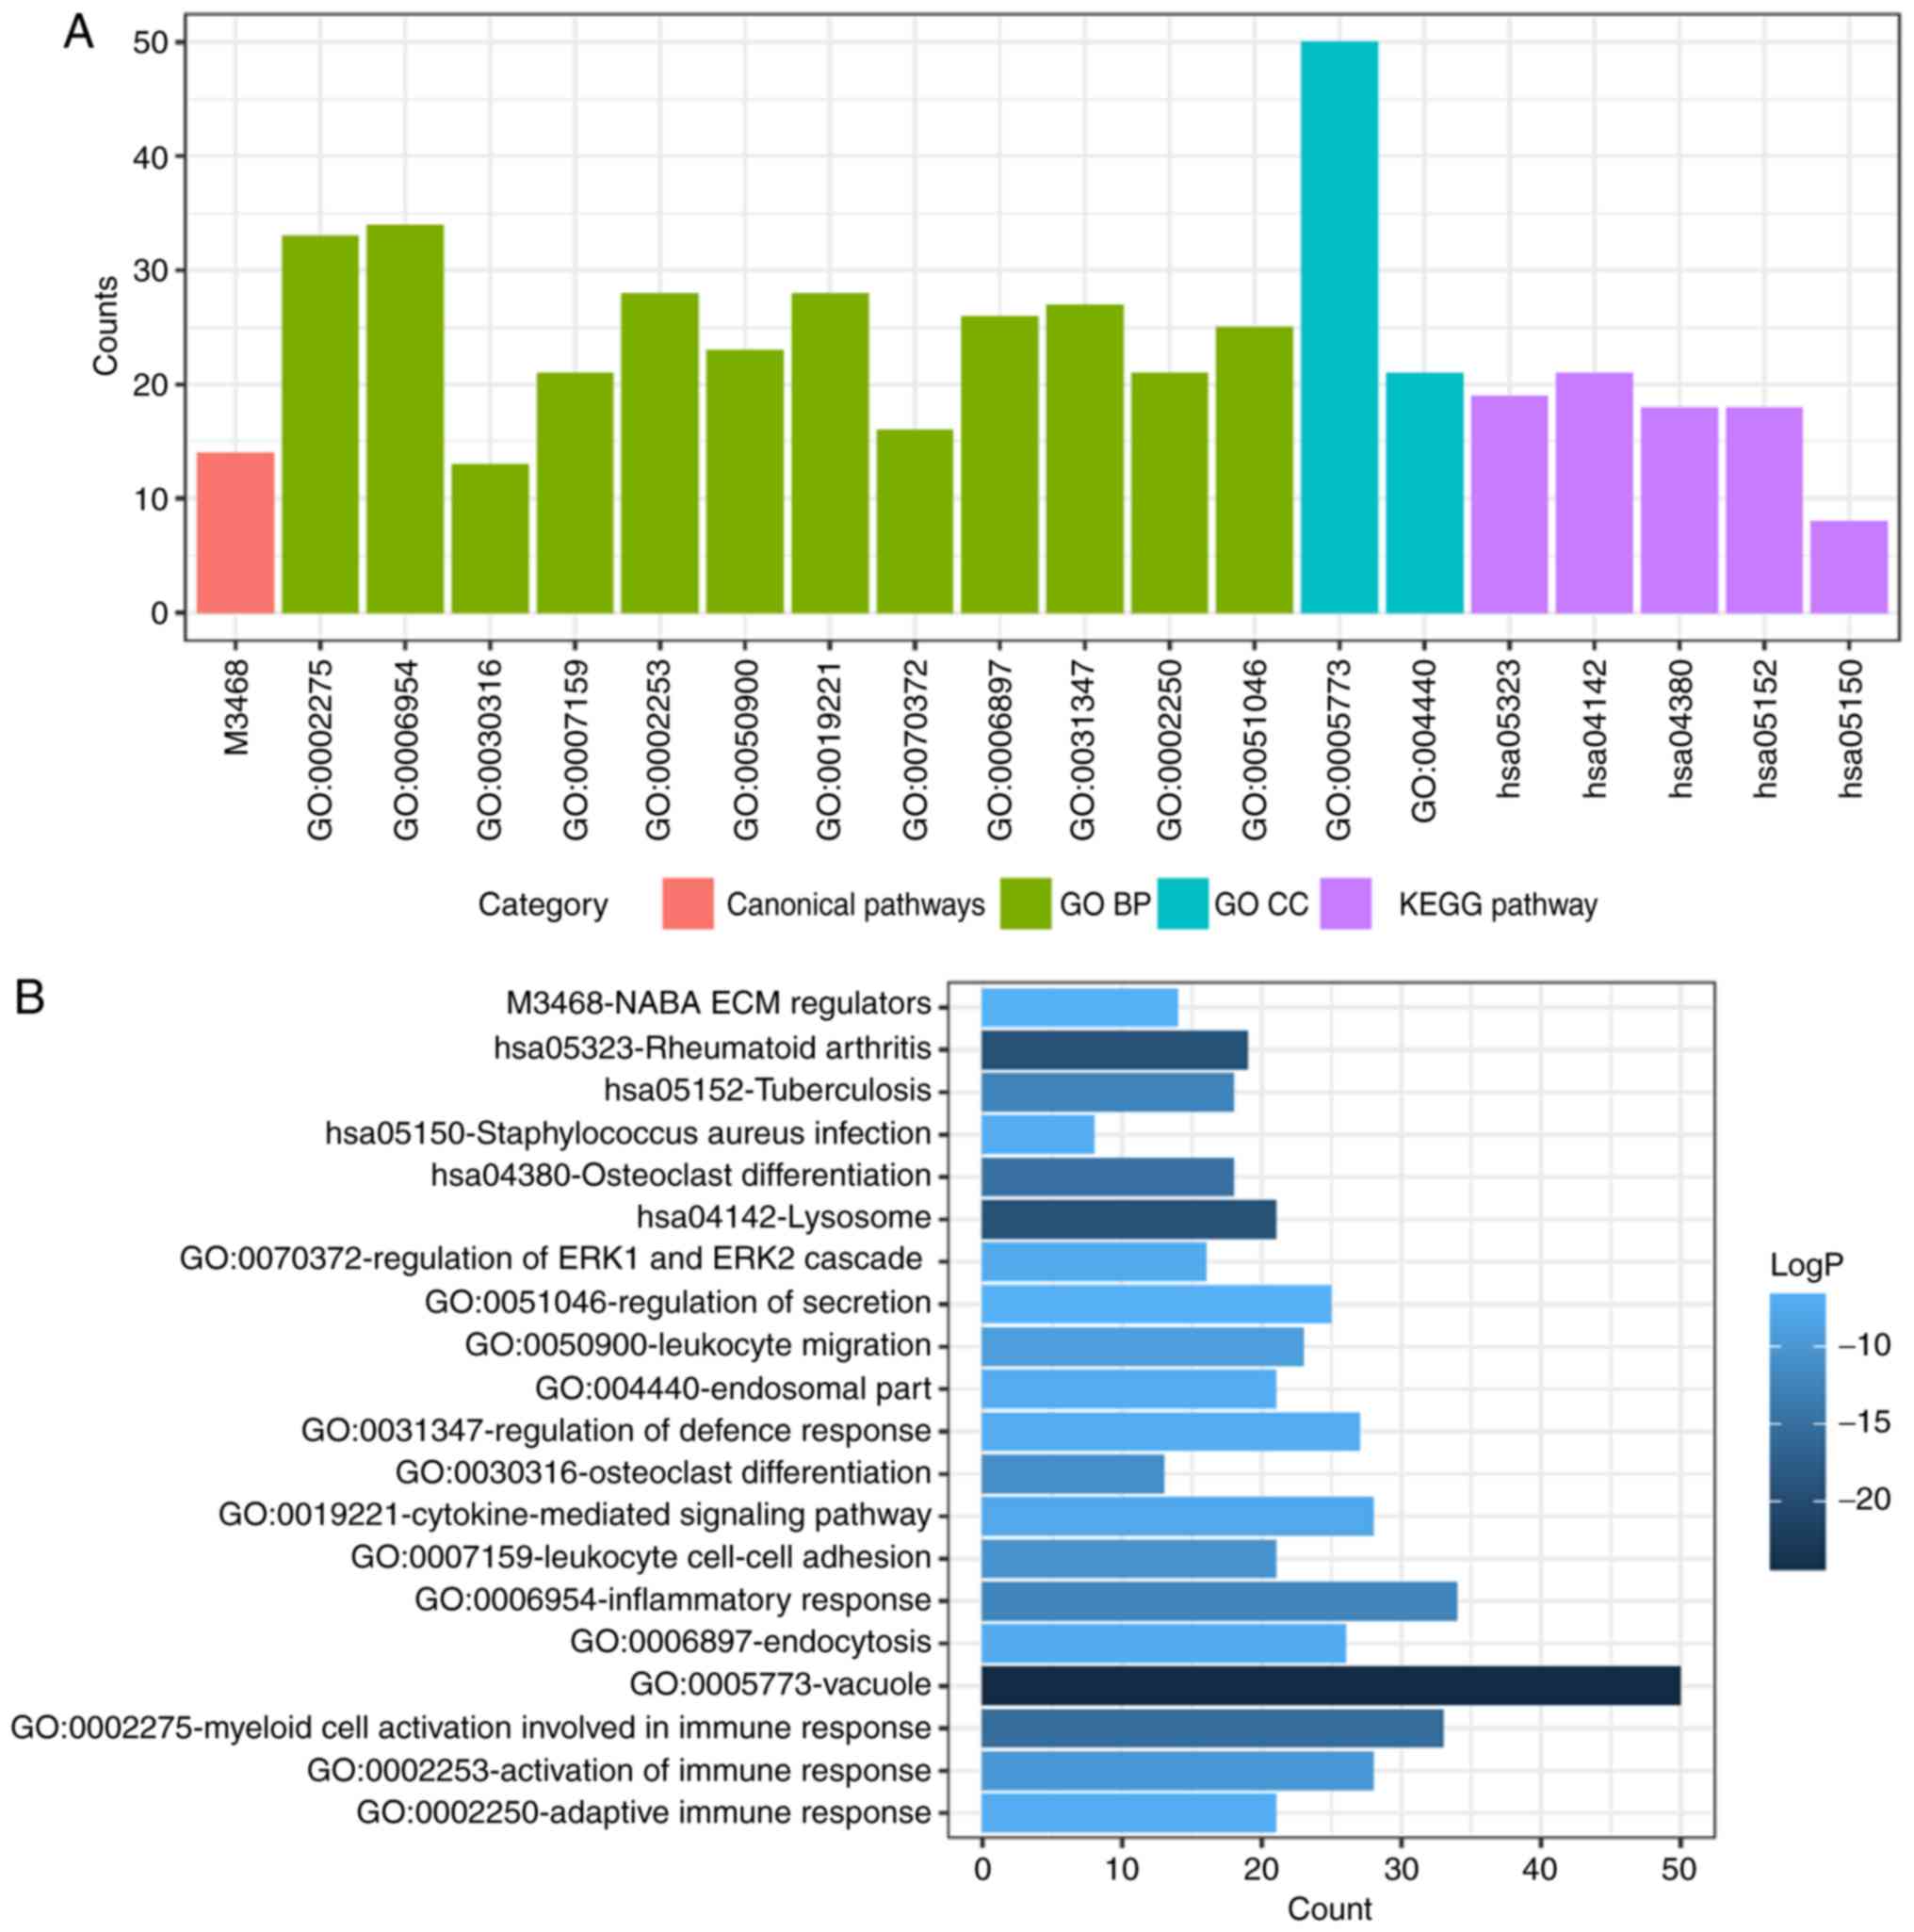
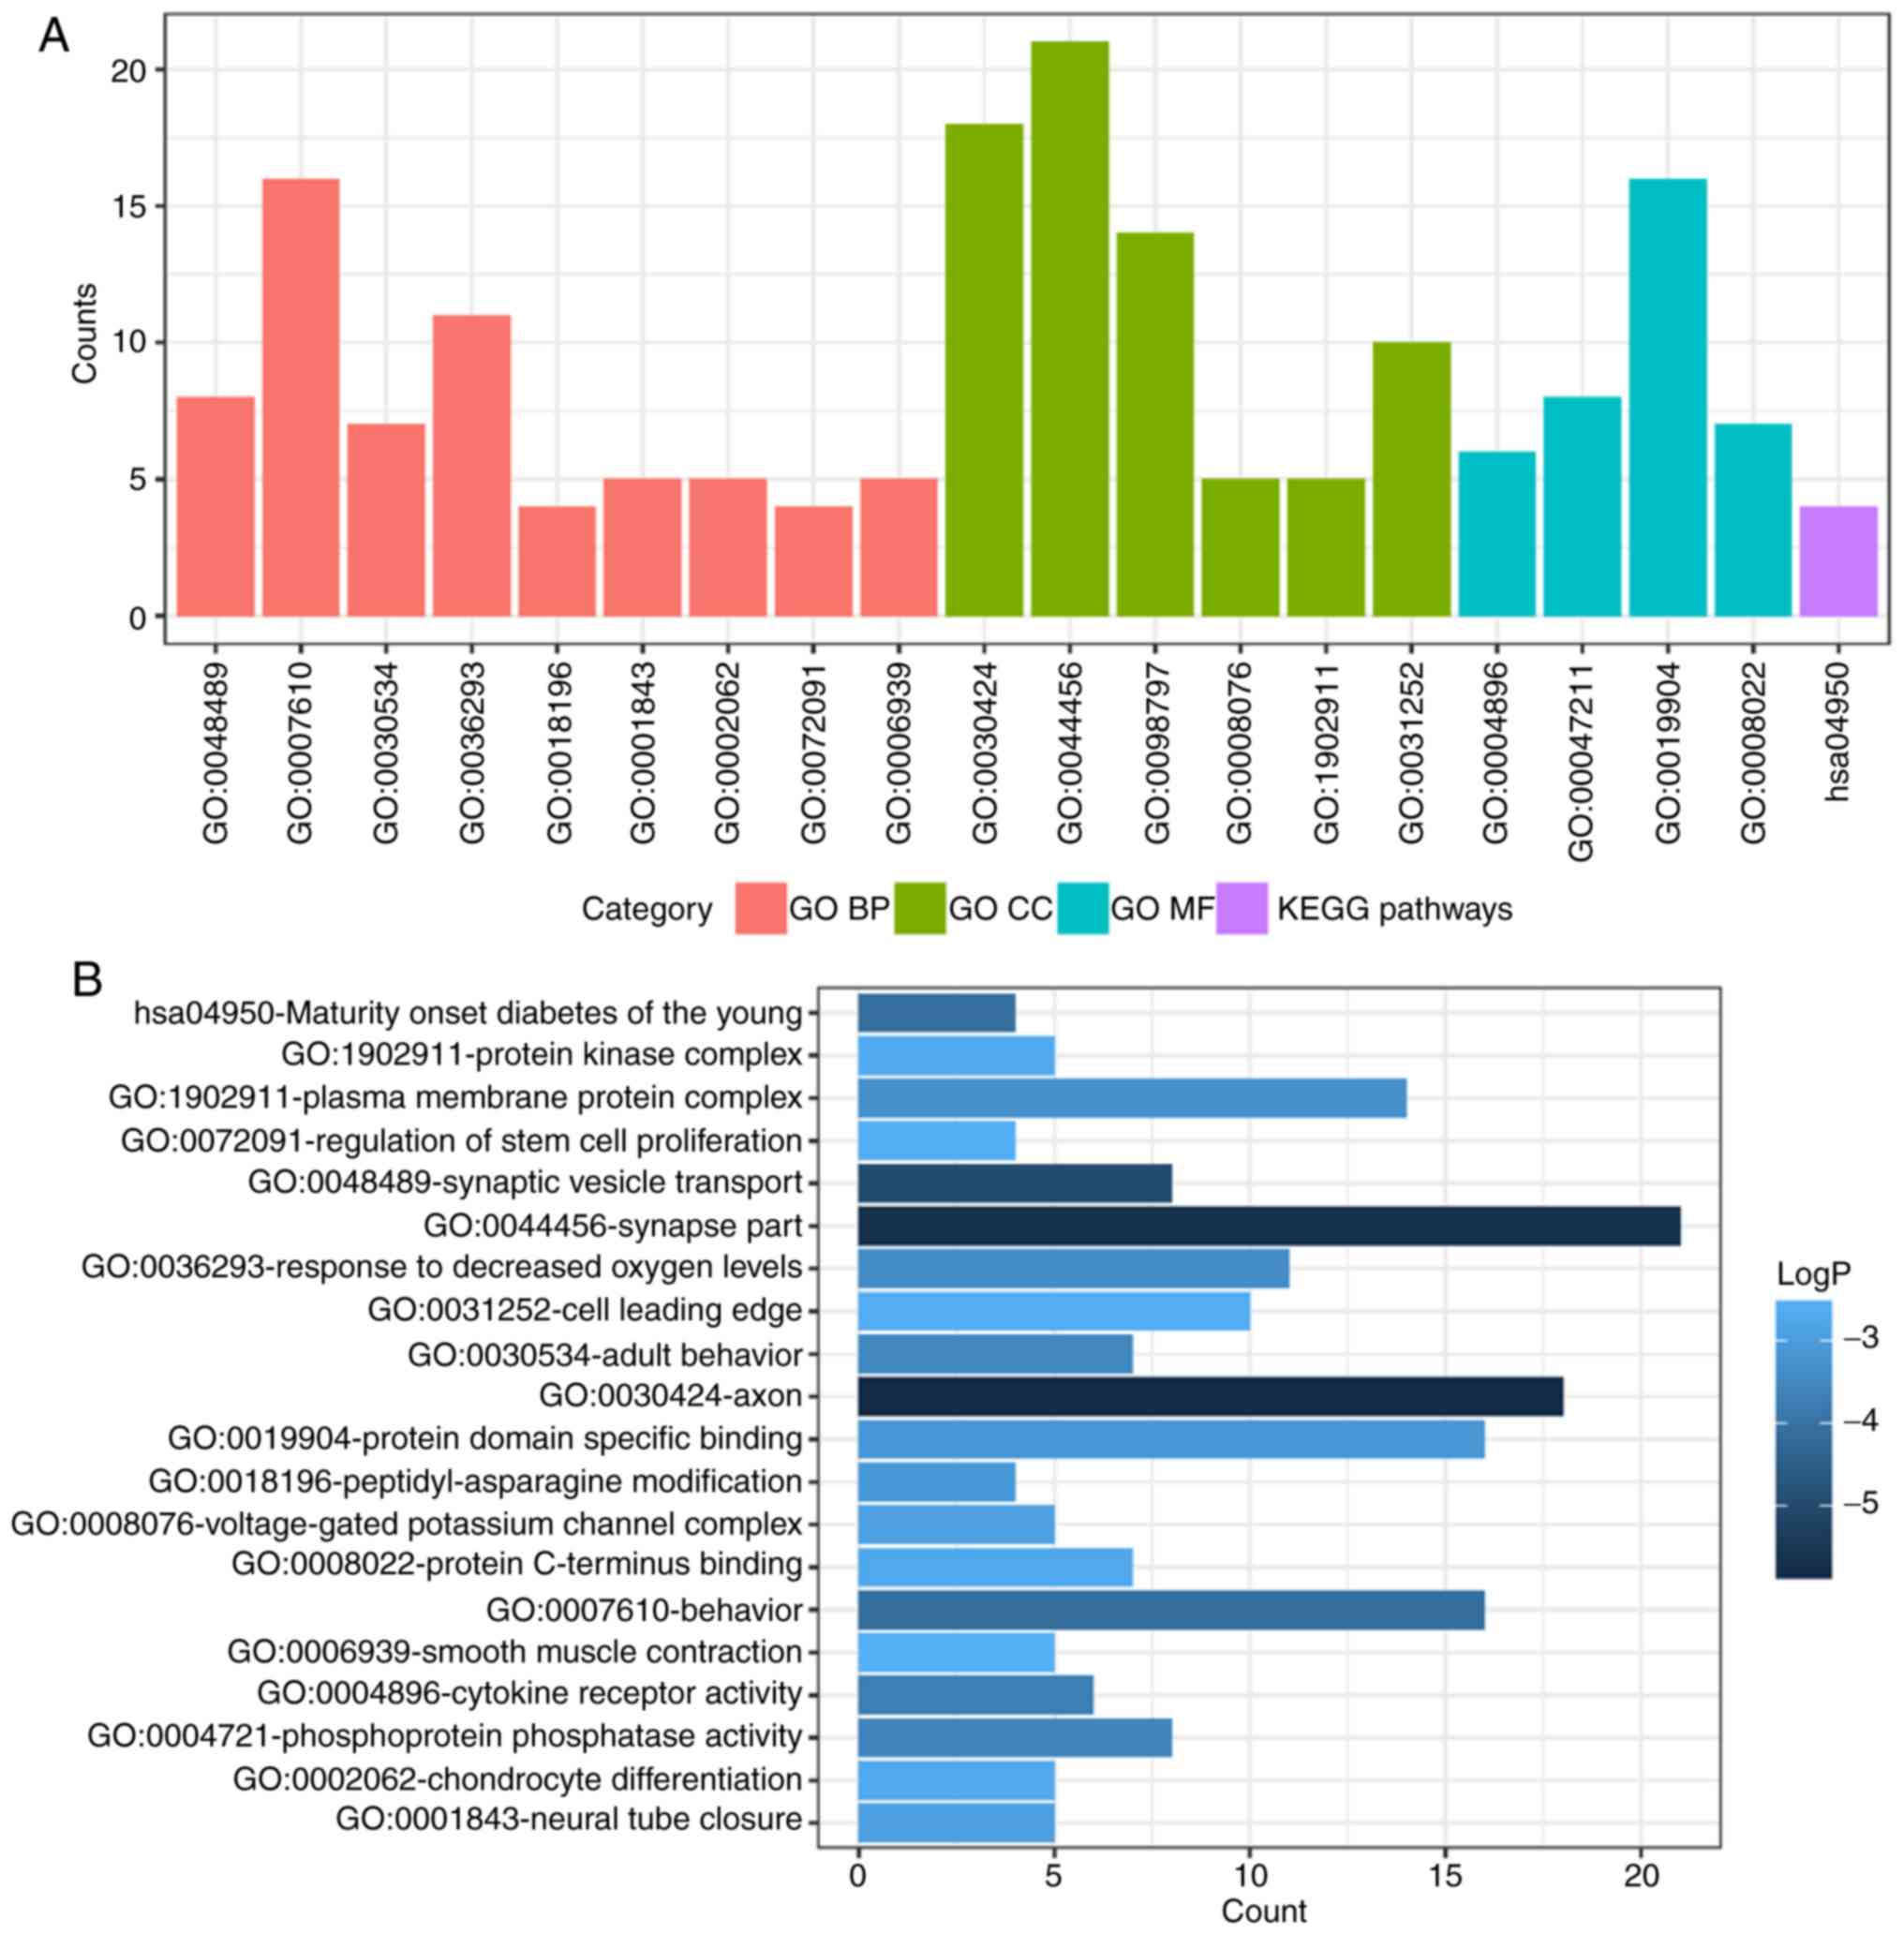
DEMs enrichment analysis
To determine functional enrichment, Metascape was
used for GO and KEGG enrichment analysis of DEMs. GO functional
enrichments and KEGG pathways of which P<0.05 were selected as
significant results (Table I). GO
analysis of DEGs includes three functional groups, namely molecular
function, biological processes and cellular component. The
significant GO enrichment analysis of all DEMs is presented in
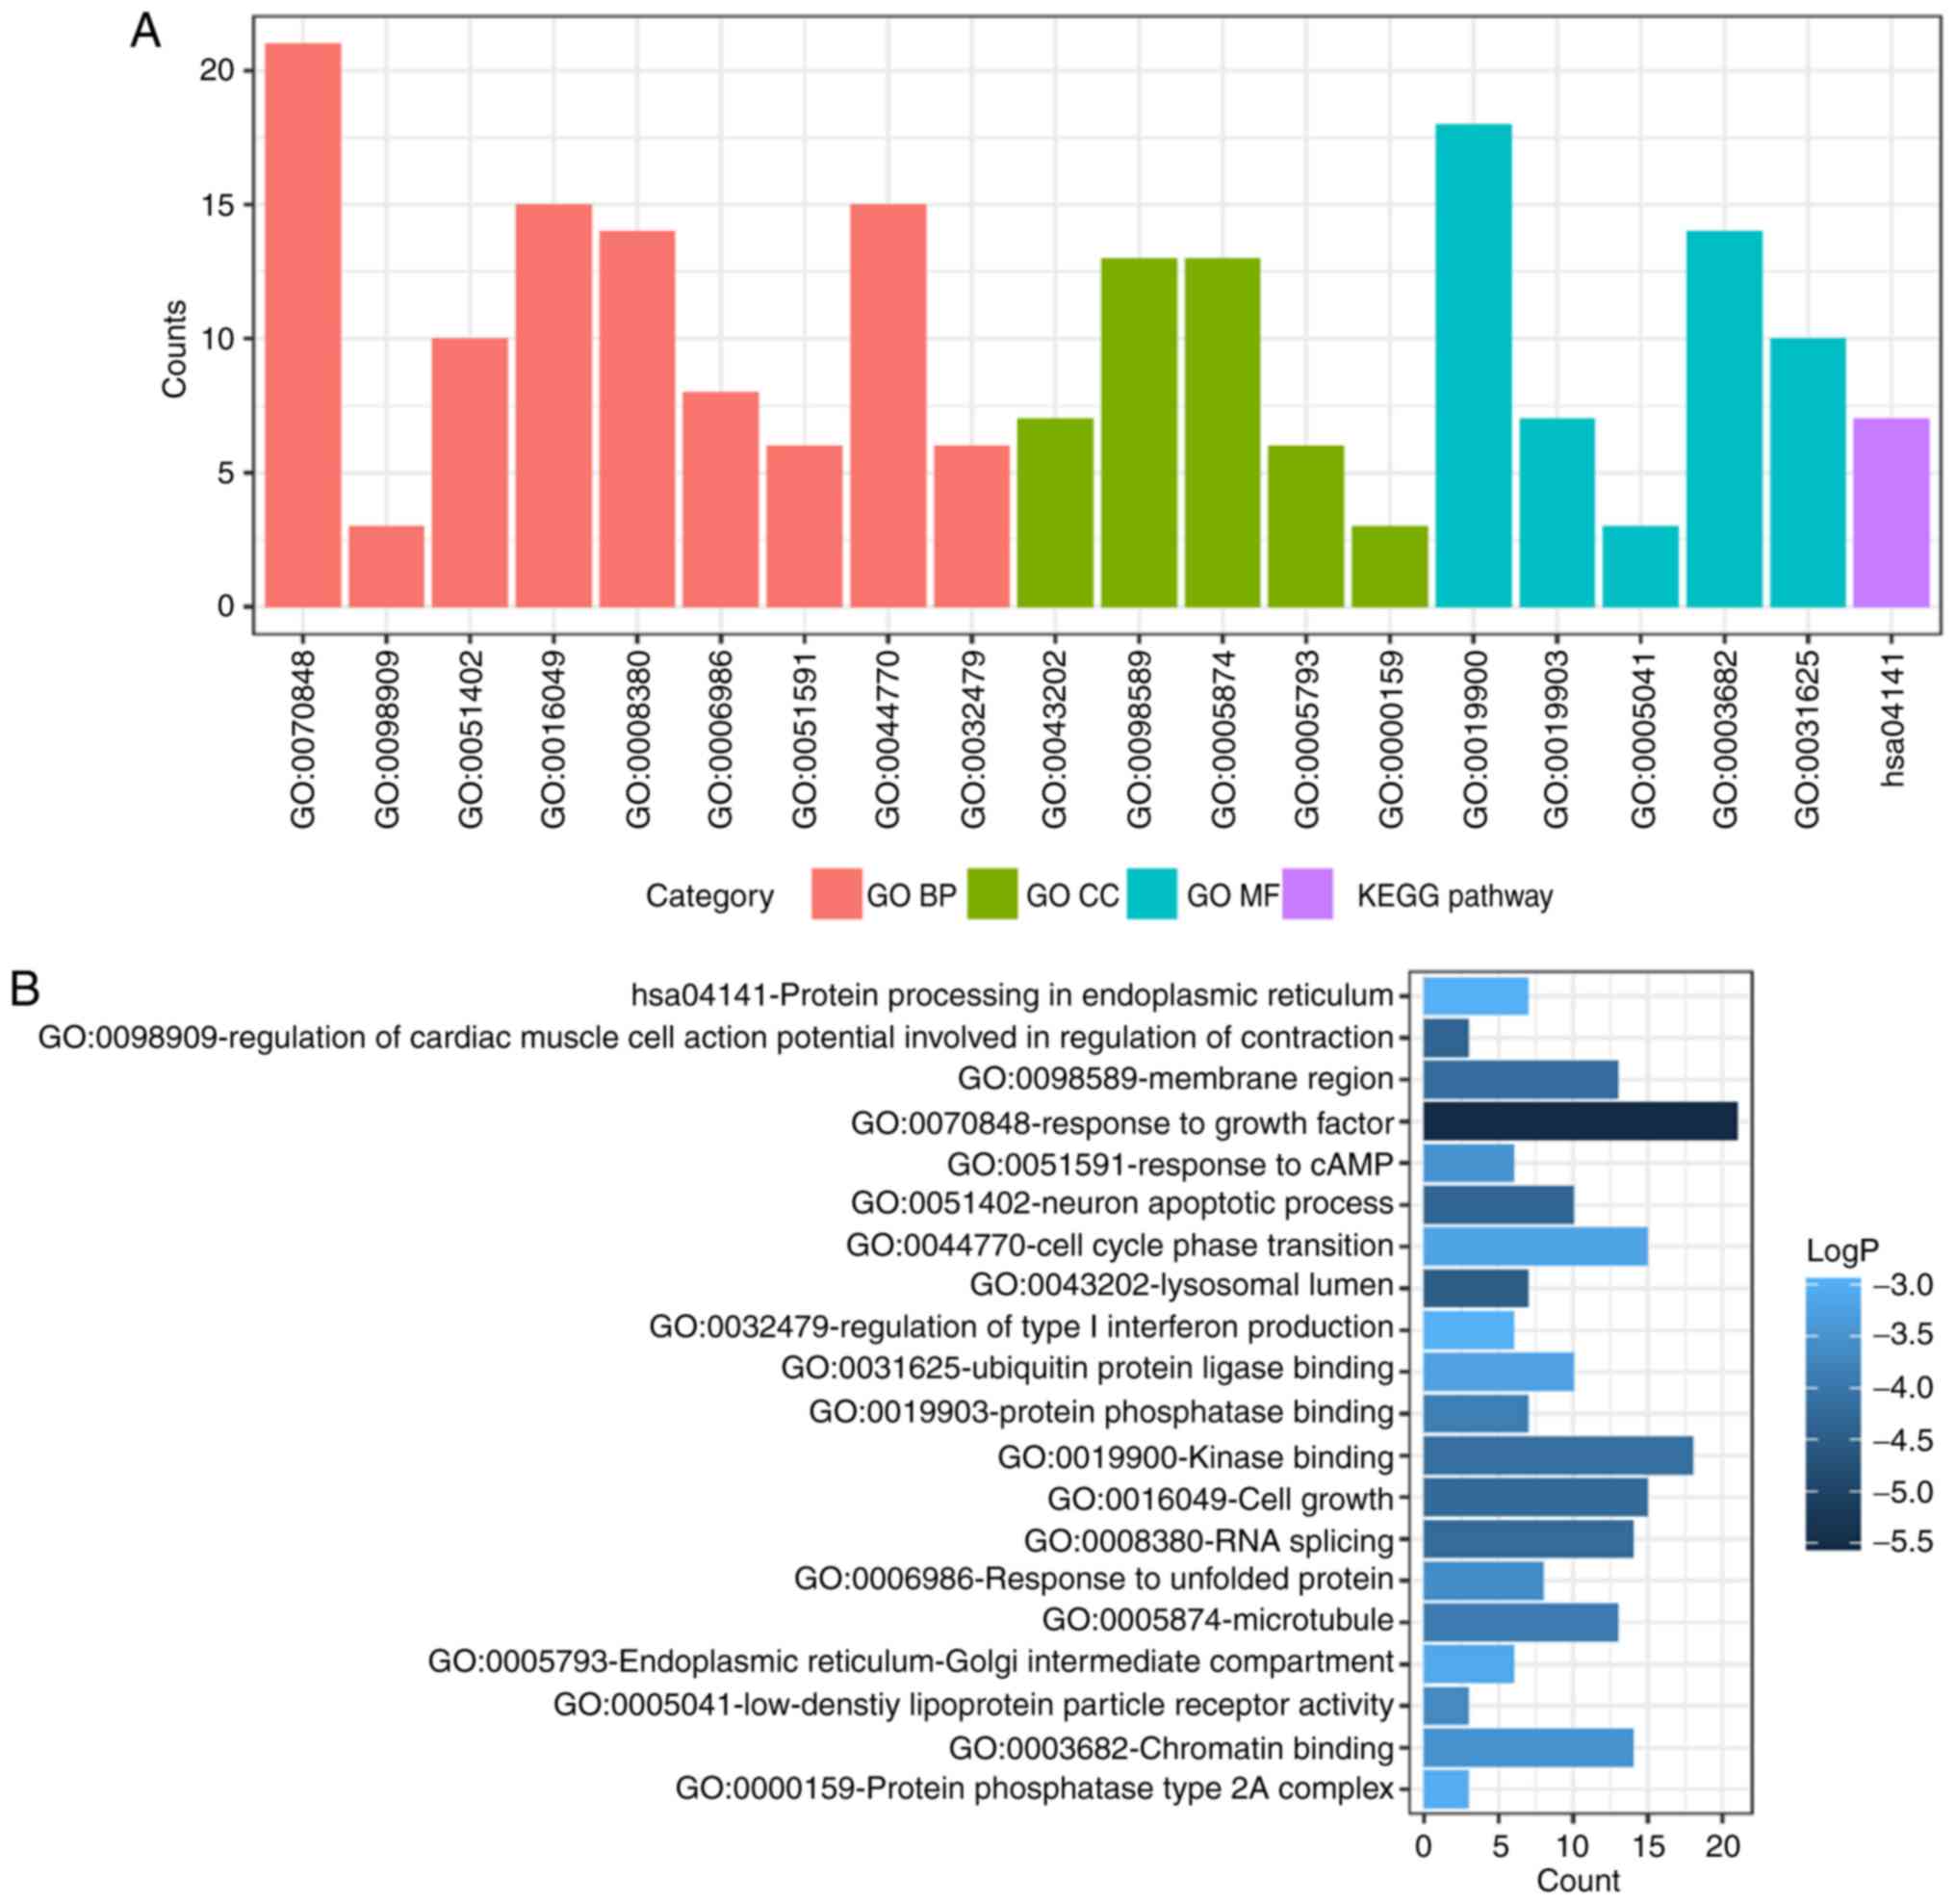
Fig. 3. GO functional enrichments
and KEGG pathway analysis of up- and down-regulated DEMs were also
performed using Metascape. The significant results (P<0.05) are
presented in Figs. 4 and 5, with details information in Tables II and III. Upregulated DEMs were predominantly
involved in the ‘cell growth’, ‘response to growth factor’ and
‘neuron apoptotic process’ and ‘activation of immune response’. The
downregulated DEMs were mainly involved in ‘cytokine receptor
activity’, ‘phosphoprotein phosphatase activity’, ‘response to
decreased oxygen levels’ and ‘regulation of stem cell
proliferation’.
 | Table I.GO and KEGG pathway enrichment
analysis for the differentially expressed mRNAs. |
Table I.
GO and KEGG pathway enrichment
analysis for the differentially expressed mRNAs.
| Category | Term | Description | Count | LogP |
|---|
| Canonical
pathways | M3468 | NABA ECM
REGULATORS | 14 | −6.64807 |
| GO BP | GO:0002275 | Myeloid cell
activation involved in immune response | 33 | −15.539 |
| GO BP | GO:0006954 | Inflammatory
response | 34 | −12.1737 |
| GO BP | GO:0030316 | Osteoclast
differentiation | 13 | −11.0649 |
| GO BP | GO:0007159 | Leukocyte cell-cell
adhesion | 21 | −10.3439 |
| GO BP | GO:0002253 | Activation of
immune response | 28 | −9.66921 |
| GO BP | GO:0050900 | Leukocyte
migration | 23 | −9.04039 |
| GO BP | GO:0019221 | Cytokine-mediated
signaling pathway | 28 | −7.7241 |
| GO BP | GO:0070372 | Regulation of ERK1
and ERK2 cascade | 16 | −7.41007 |
| GO BP | GO:0006897 | Endocytosis | 26 | −7.22687 |
| GO BP | GO:0031347 | Regulation of
defense response | 27 | −7.11793 |
| GO BP | GO:0002250 | Adaptive immune
response | 21 | −7.0625 |
| GO BP | GO:0051046 | Regulation of
secretion | 25 | −6.61093 |
| GO CC | GO:0005773 | Vacuole | 50 | −24.946 |
| GO CC | GO:0044440 | Endosomal part | 21 | −7.19392 |
| KEGG pathway | hsa05323 | Rheumatoid
arthritis | 19 | −19.1021 |
| KEGG pathway | hsa04142 | Lysosome | 21 | −19.026 |
| KEGG pathway | hsa04380 | Osteoclast
differentiation | 18 | −14.6982 |
| KEGG pathway | hsa05152 | Tuberculosis | 18 | −12.2416 |
| KEGG pathway | hsa05150 | Staphylococcus
aureus infection | 8 | −6.94145 |
| Table II.GO and KEGG pathway enrichment
analysis for the upregulated differentially expressed mRNAs. |
Table II.
GO and KEGG pathway enrichment
analysis for the upregulated differentially expressed mRNAs.
| Category | Term | Description | Count | LogP |
|---|
| GO BP | GO:0070848 | Response to growth
factor | 21 | −5.5332 |
| GO BP | GO:0098909 | Regulation of
cardiac muscle cell action potential involved in regulation of
contraction | 3 | −4.34678 |
| GO BP | GO:0051402 | Neuron apoptotic
process | 10 | −4.32756 |
| GO BP | GO:0016049 | Cell growth | 15 | −4.25172 |
| GO BP | GO:0008380 | RNA splicing | 14 | −4.23503 |
| GO BP | GO:0006986 | Response to
unfolded protein | 8 | −3.60467 |
| GO BP | GO:0051591 | Response to
cAMP | 6 | −3.46953 |
| GO BP | GO:0044770 | Cell cycle phase
transition | 15 | −3.20217 |
| GO BP | GO:0032479 | Regulation of type
I interferon production | 6 | −2.96638 |
| GO CC | GO:0043202 | Lysosomal
lumen | 7 | −4.47707 |
| GO CC | GO:0098589 | Membrane
region | 13 | −4.16789 |
| GO CC | GO:0005874 | Microtubule | 13 | −3.91148 |
| GO CC | GO:0005793 | Endoplasmic
reticulum-Golgi intermediate compartment | 6 | −3.11995 |
| GO CC | GO:0000159 | Protein phosphatase
type 2A complex | 3 | −3.01052 |
| GO MF | GO:0019900 | Kinase binding | 18 | −4.1399 |
| GO MF | GO:0019903 | Protein phosphatase
binding | 7 | −3.87788 |
| GO MF | GO:0005041 | Low-density
lipoprotein particle receptor activity | 3 | −3.65378 |
| GO MF | GO:0003682 | Chromatin
binding | 14 | −3.49506 |
| GO MF | GO:0031625 | Ubiquitin protein
ligase binding | 10 | −3.22244 |
| KEGG pathway | hsa04141 | Protein processing
in endoplasmic reticulum | 7 | −2.98232 |
| Table III.GO and KEGG pathway enrichment
analysis for the downregulated differentially expressed mRNAs. |
Table III.
GO and KEGG pathway enrichment
analysis for the downregulated differentially expressed mRNAs.
| Category | Term | Description | Count | LogP |
|---|
| GO BP | GO:0048489 | Synaptic vesicle
transport | 8 | −4.97563 |
| GO BP | GO:0007610 | Behavior | 16 | −4.08991 |
| GO BP | GO:0030534 | Adult behavior | 7 | −3.49616 |
| GO BP | GO:0036293 | Response to
decreased oxygen levels | 11 | −3.35132 |
| GO BP | GO:0018196 | Peptidyl-asparagine
modification | 4 | −3.07891 |
| GO BP | GO:0001843 | Neural tube
closure | 5 | −2.90315 |
| GO BP | GO:0002062 | Chondrocyte
differentiation | 5 | −2.67404 |
| GO BP | GO:0072091 | Regulation of stem
cell proliferation | 4 | −2.59464 |
| GO BP | GO:0006939 | Smooth muscle
contraction | 5 | −2.52575 |
| GO CC | GO:0030424 | Axon | 18 | −5.87109 |
| GO CC | GO:0044456 | Synapse part | 21 | −5.66372 |
| GO CC | GO:0098797 | Plasma membrane
protein complex | 14 | −3.27326 |
| GO CC | GO:0008076 | Voltage-gated
potassium channel complex | 5 | −2.85904 |
| GO CC | GO:1902911 | Protein kinase
complex | 5 | −2.65473 |
| GO CC | GO:0031252 | Cell leading
edge | 10 | −2.62652 |
| GO MF | GO:0004896 | Cytokine receptor
activity | 6 | −3.68521 |
| GO MF | GO:0004721 | Phosphoprotein
phosphatase activity | 8 | −3.57184 |
| GO MF | GO:0019904 | Protein domain
specific binding | 16 | −3.127 |
| GO MF | GO:0008022 | Protein C-terminus
binding | 7 | −2.72974 |
| KEGG pathway | hsa04950 | Maturity onset
diabetes of the young | 4 | −4.05467 |
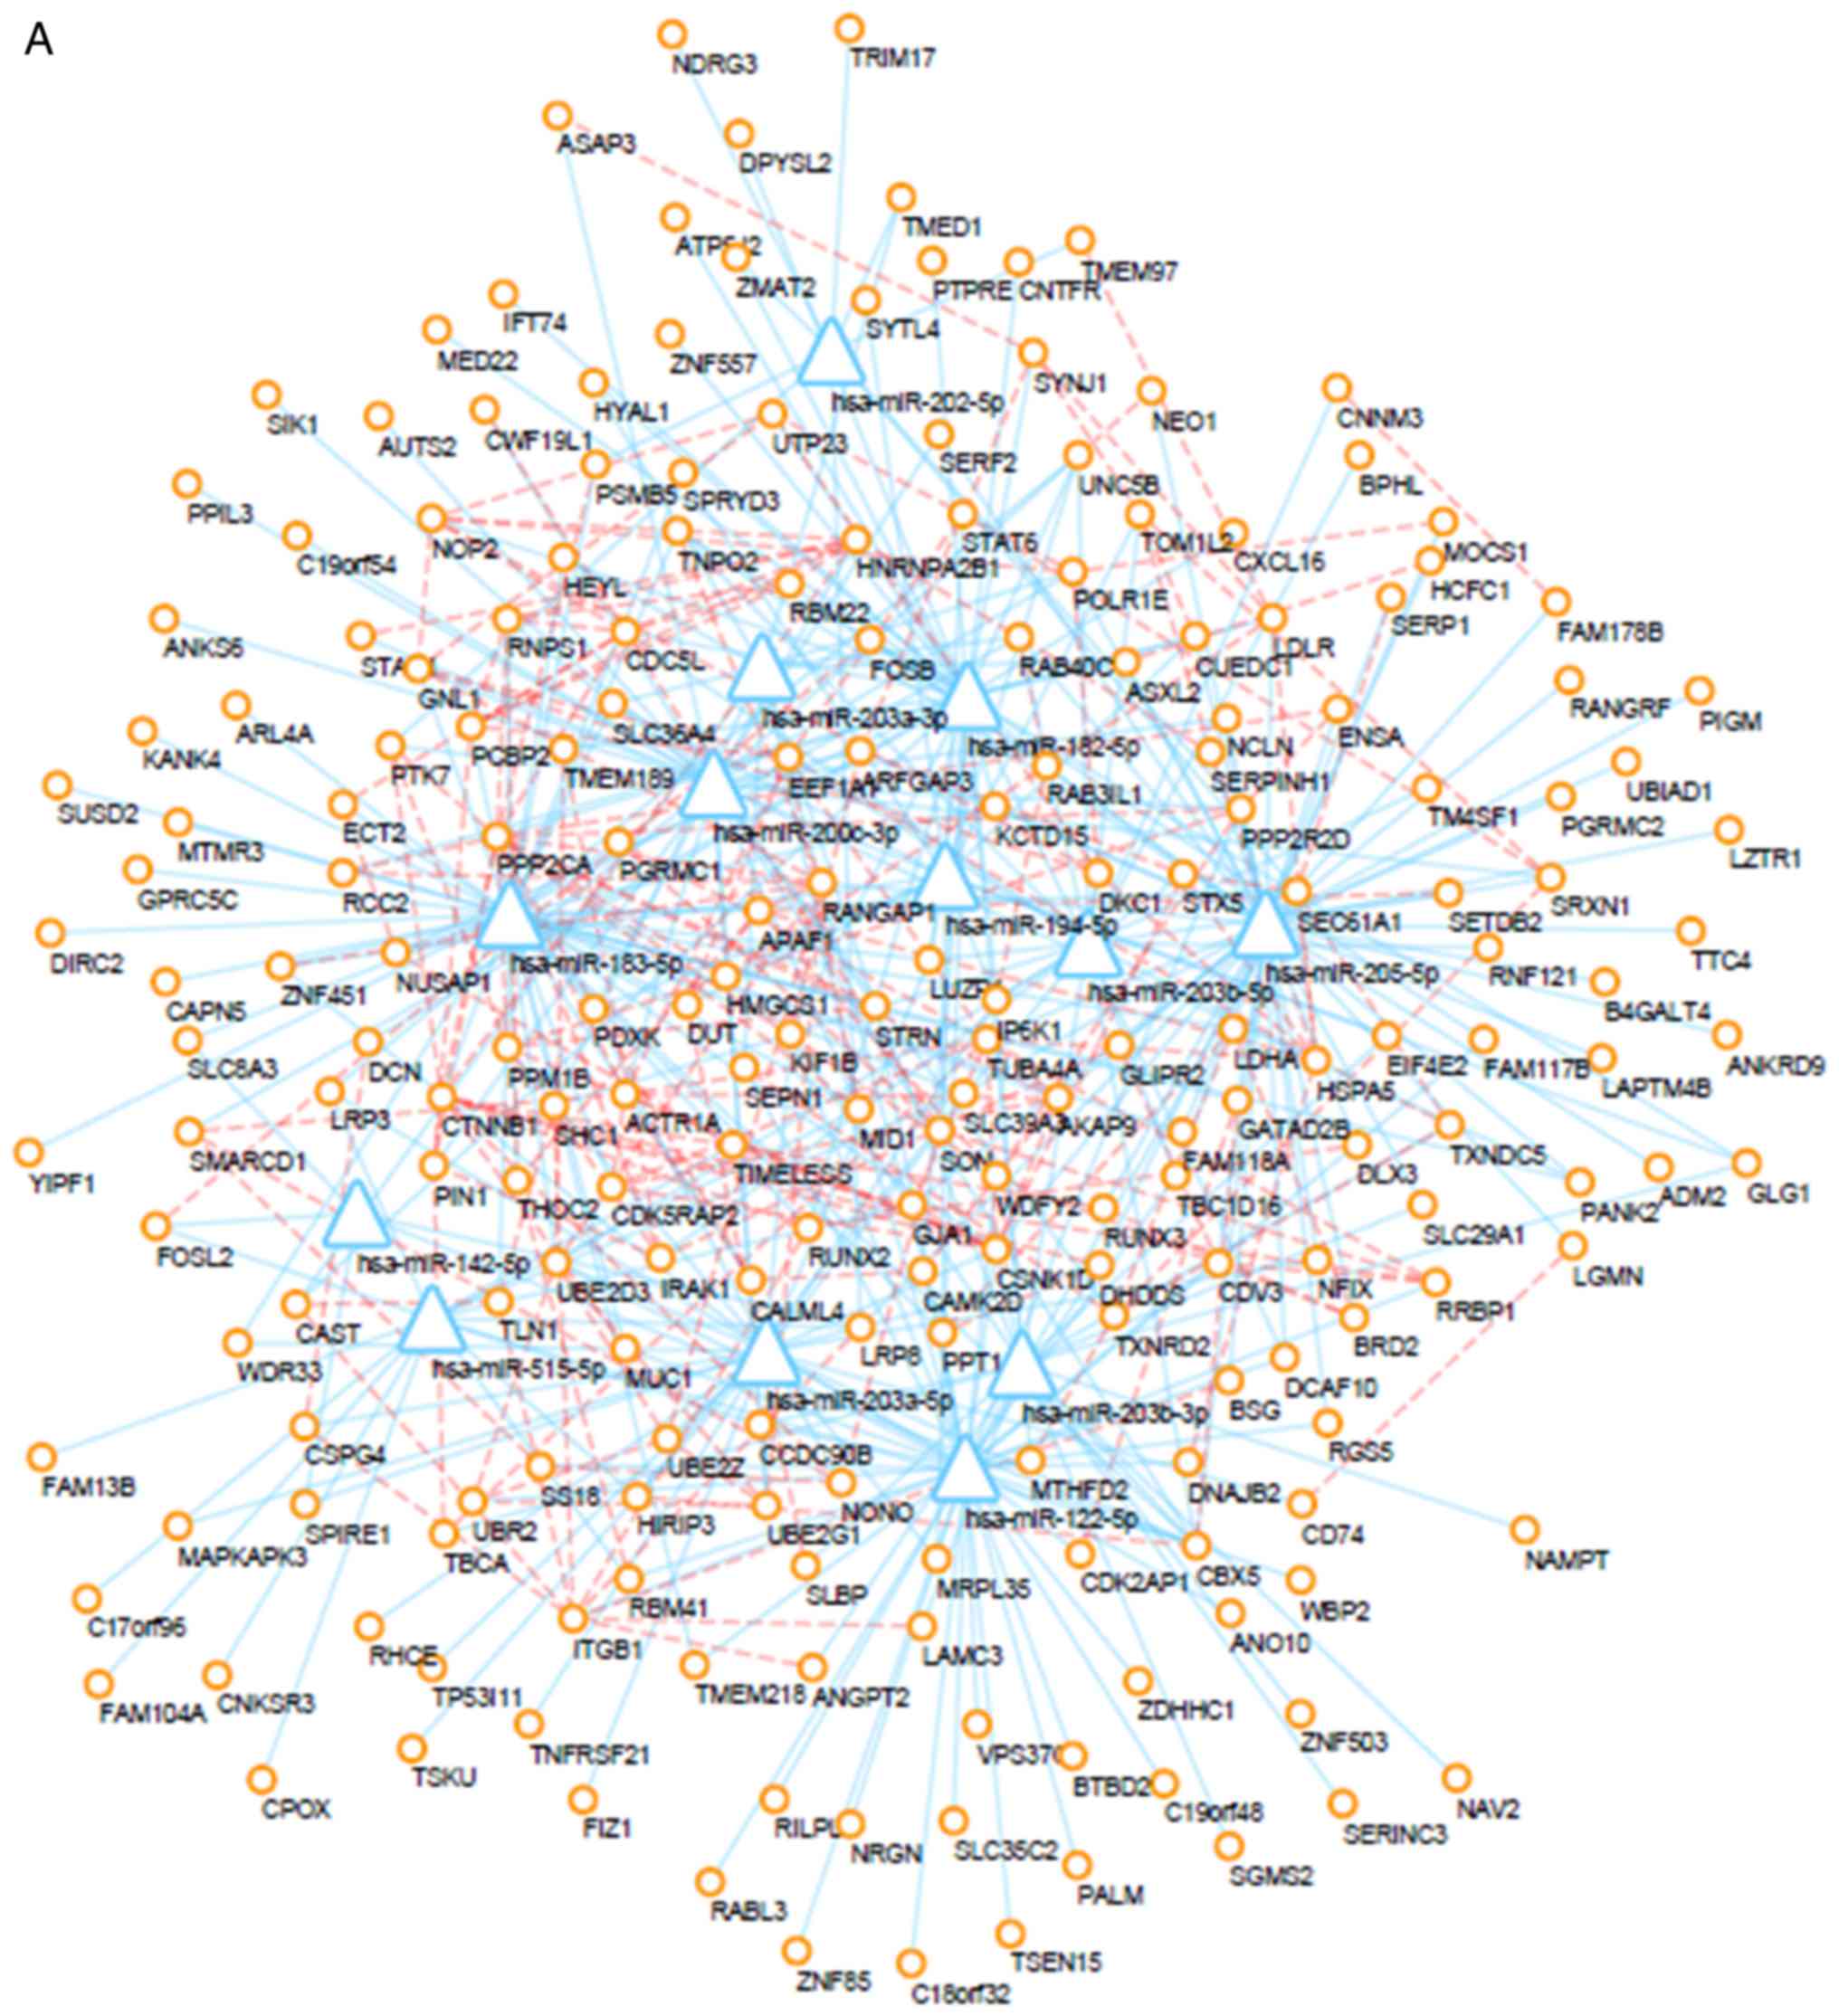
PPI network
The interactions between proteins encoded by DEMs
were downloaded from the STRING database and a PPI network was
created using the Cytoscape tool. Additionally, prediction of
miRNA-mRNA interactions was integrated into the PPI network. After
altering of the color and location of nodes, the PPI network was
successfully established (Fig. 6).
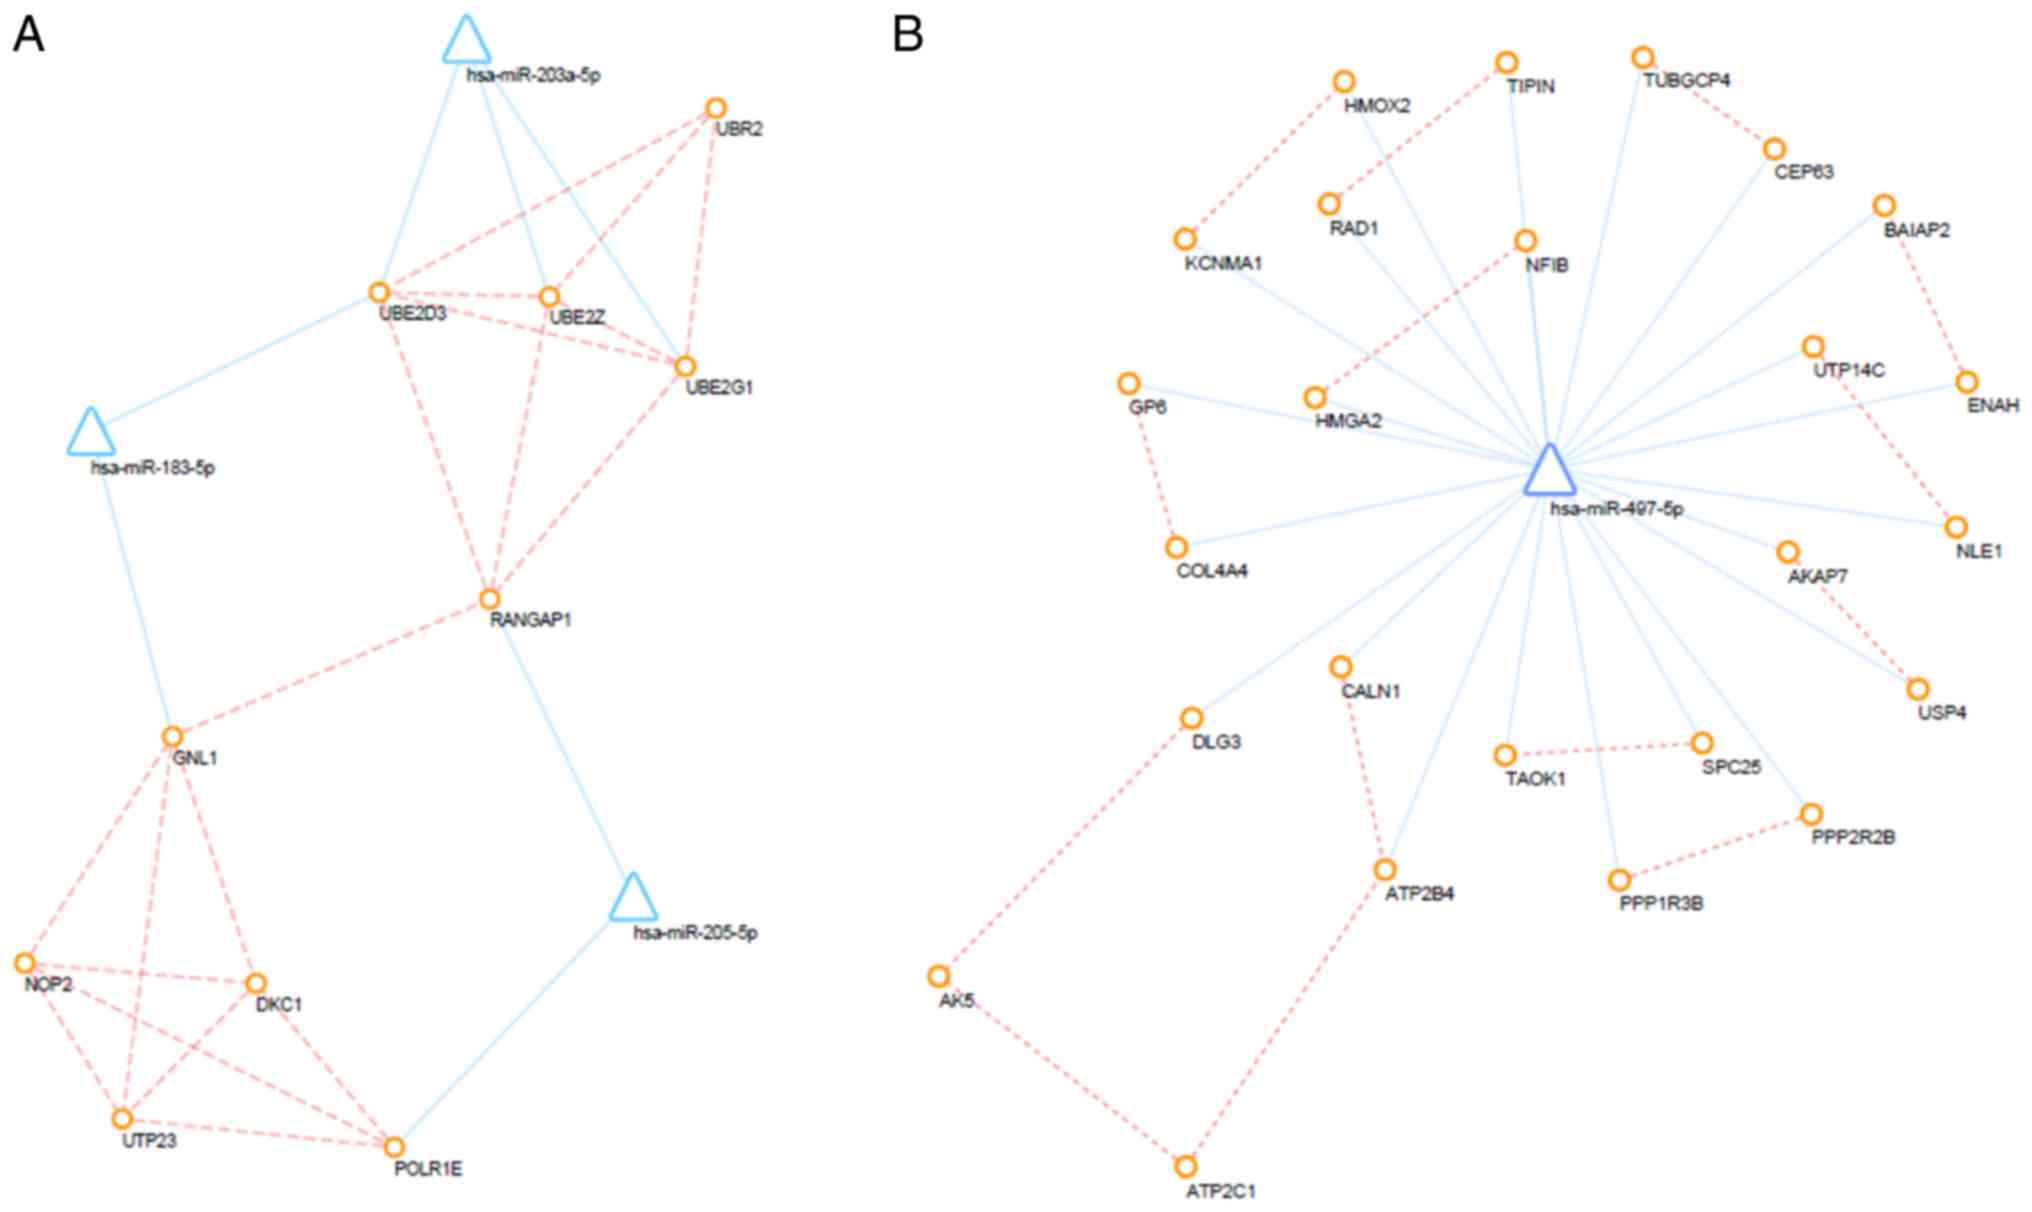
Furthermore, PPI networks of up- and down-regulated DEMs and their
interacting DEMis were also constructed, and the key subnetwork was
subsequently extracted using the MCODE app in Cytoscape (Fig. 7). The key significant genes were
hsa-miR-497-5p, hsa-miR-203a-5p, hsa-miR-183-5p and hsa-miR-205-5p
and the DEMs that they are known to interact with. Of note,
up-regulated DEMs within the subnetwork were mainly involved in the
ubiquitin-proteasome pathway (UPP), response to growth factors and
the regulation of type I interferon production caused by the
reduced expression levels of hsa-miR-203, hsa-miR-205 and
hsa-miR-183. Furthermore, as a consequence of the overexpression of
miR-497, downregulated DEMs within the hub subnetwork were closely
associated with response to hypoxia, transport of potassium,
activity of synapse, regulation of stem cell proliferation.
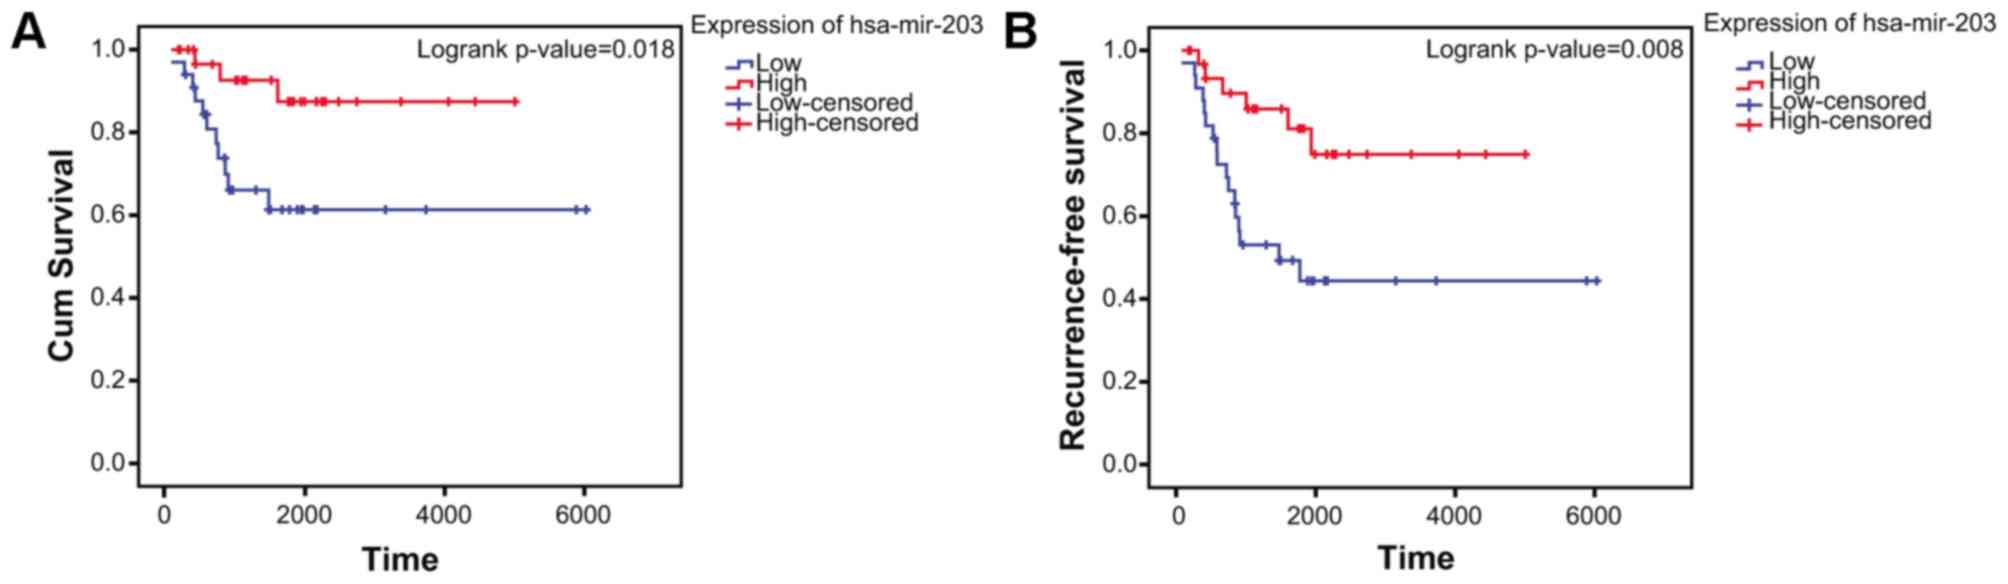
Kaplan-Meier survival analysis
The clinical information was obtained from GSE39058
dataset. A total of 65 patients were included in the present study.
The log-rank test confirmed that low expression of hsa-miR-203
(P=0.008411 and log2(fold change)=−1.247074) in aged cases was
negatively associated with overall survival (Fig. 8A) and positively associated with
recurrence rate (Fig. 8B) in
patients with OS.
Discussion
In the current study, microarray data from the GEO
database was used to analyze DEGs to reveal differences in
molecular mechanism introduced by age. DEMs were divided into two
groups by the log2(fold change), then GO function
enrichment and KEGG pathway analysis were performed. Furthermore,
an integrated regulatory network was generated by integrating the
interactions of proteins encoded by DEMs with predictions of
miRNA-mRNA interactions. The potential GO functional annotations
and the upstream DEMis that may induce the difference in prognosis
and survival rate among ages were identified.
From analyzing the key subnetwork combined with the
function enrichment analysis, it was apparent that the upregulated
DEMs within the key subnetwork were mostly involved in the UPP,
response to growth factors and the regulation of type I interferon
production. DEMs upregulation may be caused by the reduced
expression of hsa-miR-203, hsa-miR-205 and hsa-miR-183.
Downregulation of DEMs is potentially caused by upregulated
expression of miR-497, and this subnetwork was associated with
response to hypoxia, transport of potassium, activity of synapse,
regulation of stem cell proliferation.
The UPP is essential for maintaining the
homeostasis, as it is responsible for intracellular protein
degradation. It has a critical role in many cellular processes,
including cell cycle, cell differentiation, apoptosis,
anti-apoptosis and tumor development (14–17).
The upregulated DEMs enriched in UPP were ubiquitin protein ligase
E3 component n-recognin 2 (UBR2), ubiquitin conjugating enzyme E2
(UBE2) G1, UBE2D3, UBE2Z and Ran GTPase activating protein 1. Of
these DEMs, UBE2G1, UBE2D3 and UBE2Z were targets of hsa-miR-203,
and hsa-miR-203 was previously demonstrated to be downregulated in
OS in patients <20 years old in the current study compared with
patients >20. UBR2, the sole known E3 ubiquitin ligase of the
N-end rule pathway, is reported to be upregulated in colon
adenocarcinoma and Lewis lung carcinoma (15). UBR2 is also demonstrated to have a
pro-apoptotic function by degrading the anti-apoptotic form of
tyrosine kinase Lyn, contradicting previous reports of an
anti-apoptotic role, indicating that UBR2 might inhibit tumor
initiation and progression (14).
UBE2D3, a positive prognostic factor in cancer, inhibits cell
proliferation and contributes to radiosensitivity, thus improving
the survival time (18–20). These findings suggest that UBR2,
UBE2G1, UBE2D3, UBE2Z and RANGAP1, which were enriched in UPP, may
serve a negative role in the development and progression of cancer;
the novel association between UBE2G1 and UBE2Z and cancer requires
further investigation. Liu and Feng (21) reported that miR-203 was
downregulated in OS tissues and cell lines, and was associated with
poor survival of patients with OS. Most studies suggest that
hsa-miR-203 acts as a tumor suppressor by repressing tumor growth
and invasion, and downregulating hsa-miR-21; overexpression of
hsa-miR-21 is described in several reported carcinogenic processes,
such as invasion and metastasis and is closely associated with poor
survival (21–23). However, Ikenaga et al
(24) reported that hsa-miR-203
was overexpressed in pancreatic adenocarcinoma and was an
independent predictor of poor prognosis in patients with pancreatic
adenocarcinoma. These findings indicate that hsa-miR-203 has a
complex role in cancer initiation and progression as miR-203
interacts with may mRNA targets. Thus, the precise mechanism of
hsa-miR-203 in tumorigenesis and progression requires further
research.
Hypoxia, which is associated with tumorigenesis,
tumor development, invasion and metastasis, commonly occurs in
rapidly growing solid tumors, while some studies have suggested
that hypoxia is a common phenomenon in OS (25,26).
Accumulating evidence suggests that hypoxia promotes tumorigenesis,
tumor progression, invasion and migration (26–28).
Heme oxygenase 2 and potassium calcium-activated channel subfamily
M α 1 (KCNMA1), the downregulated DEM that was associated with
response to hypoxia, may be potential target mRNAs of hsa-miR-497
and was both involved in potassium transport. It has been reported
that miR-497, a hypoxia-inducible miRNA, which was suppressed in OS
when compared with adjacent tissues, inhibits the expression of
hypoxia-inducible factor 1-α and certain other genes (29,30).
OS samples from patients aged <20 exhibited higher levels of
miR-497 and reduced expression of downstream DEMs involved in the
response to hypoxia, thus inhibiting tumor progression, which may
be responsible for the improved survival of patients with OS aged
<20.
The downregulated DEMs of potentially targeted by
miR-497 in OS patients aged <20 were mainly involved in
potassium transport included proteins of the potassium channel
complex and transmembrane transporter complex, such as the Big
Potassium (BK) ion channel, also termed KCNMA1, encoded by the DEM
KCNMA1. BK channels in biological membranes facilitate the efflux
of potassium from intracellular stores. Many ion channels promote
cell proliferation, in including the BK channel (31–33).
Several reports have demonstrated that BK channels have active
roles in tumor growth and metastasis, and the development of drug
resistance in glioma, breast cancer and prostate cancer (34–36);
whereas Cambien et al (37)
contradicted this by reporting that the genetic knockdown of BKα
promoted OS progression. Furthermore, BK channel is also reported
to promote breast cancer and glioma invasion and migration
(38,39); however, there is limited evidence
of the role of BK channel in OS invasion and metastasis. The
findings of the current study that BK channels have a complex role
in cell proliferation with numerous other factors involved. In the
present study, BK channel-related genes were significantly
downregulated in OS patients aged <20, who exhibited better
prognosis. Thus, we hypothesized that the active BK channel may
partly contribute to poorer survival.
Age is considered to be a prognostic factor in
patients with OS; however, the differences in the molecular
mechanisms of OS according to age are unclear. In the current study
a regulatory network for OS was created by combining PPI network
and miRNA-mRNA interactions, and finally we extracted the key
subnetwork by topologic analysis. The study provides some
insightful information to interpret why younger patients with OS
have a far more positive outcome. Furthermore, certain genes may
act as potential prognostic factors and effective drug targets for
treatment were identified. However, further research is required to
determine the exact roles of the identified genes in OS; further
investigation into the role other hub miRNAs, including
hsa-miR-497, hsa-miR-183 and hsa-miR-205 in the development of OS
should be conducted in the future.
Acknowledgements
Not applicable.
Funding
This study was supported by the Foundation of
Shenzhen Health and Family Planning Commission (grant no.
SZFZ2017081).
Availability of data and materials
The datasets we utilized are available in the GEO
online database (accession number no. GSE39058 and GSE39040).
https://www.ncbi.nlm.nih.gov/geo/query/acc.cgi?acc=GSE39058;
https://www.ncbi.nlm.nih.gov/geo/query/acc.cgi?acc=GSE39040.
Authors' contributions
JMH and JSW designed the study. JSW analysed and
interpreted the microarray profile downloaded from GEO database.
MYD, SXD, PX and GZZ made substantial contributions to data
analysis. JSW and MYD wrote the manuscript. YSZ and XDL performed
Kaplan-Meier survival analysis. JMH was primarily responsible for
writing the manuscript. All authors read and approved the final
manuscript.
Ethics approval and consent to
participate
Not applicable.
Patient consent for publication
Not applicable.
Competing interests
The authors declare that they have no competing
interests.
Glossary
Abbreviations
Abbreviations:
|
DEGs
|
differentially expressed genes
|
|
DEMs
|
differentially expressed mRNAs
|
|
DEMis
|
differentially expressed microRNAs
|
|
GO
|
Gene Ontology
|
|
BP
|
biological process
|
|
CC
|
cellular component
|
|
MF
|
molecular functions
|
References
|
1
|
Sugalski AJ, Jiwani A, Ketchum NS, Cornell
J, Williams R, Heim-Hall J, Hung JY and Langevin AM:
Characterization of localized osteosarcoma of the extremity in
children, adolescents, and young adults from a single institution
in South Texas. J Pediatr Hematol Oncol. 36:e353–e358. 2014.
View Article : Google Scholar : PubMed/NCBI
|
|
2
|
Mirabello L, Troisi RJ and Savage SA:
Osteosarcoma incidence and survival rates from 1973 to 2004: Data
from the surveillance, epidemiology, and end results program.
Cancer. 115:1531–1543. 2009. View Article : Google Scholar : PubMed/NCBI
|
|
3
|
Bleyer A, O'Leary M, Barr R and Ries LAG:
Cancer Epidemiology in Older Adolescents and Young Adults 15 to 29
Years of Age, Including SEER Incidence and Survival: 1975-2000. NIH
Pub. No 06-5767. National Cancer Institute. (Bethesda, MD).
2006.
|
|
4
|
Hagleitner MM, Hoogerbrugge PM, van der
Graaf WT, Flucke U, Schreuder HW and te Loo DM: Age as prognostic
factor in patients with osteosarcoma. Bone. 49:1173–1177. 2011.
View Article : Google Scholar : PubMed/NCBI
|
|
5
|
Bielack SS, Kempf-Bielack B, Delling G,
Exner GU, Flege S, Helmke K, Kotz R, Salzer-Kuntschik M, Werner M,
Winkelmann W, et al: Prognostic factors in high-grade osteosarcoma
of the extremities or trunk: An analysis of 1,702 patients treated
on neoadjuvant cooperative osteosarcoma study group protocols. J
Clin Oncol. 20:776–790. 2002. View Article : Google Scholar : PubMed/NCBI
|
|
6
|
Bacci G, Longhi A, Versari M, Mercuri M,
Briccoli A and Picci P: Prognostic factors for osteosarcoma of the
extremity treated with neoadjuvant chemotherapy: 15-year experience
in 789 patients treated at a single institution. Cancer.
106:1154–1161. 2006. View Article : Google Scholar : PubMed/NCBI
|
|
7
|
Whelan JS, Jinks RC, McTiernan A, Sydes
MR, Hook JM, Trani L, Uscinska B, Bramwell V, Lewis IJ, Nooij MA,
et al: Survival from high-grade localised extremity osteosarcoma:
Combined results and prognostic factors from three European
Osteosarcoma Intergroup randomised controlled trials. Ann Oncol.
23:1607–1616. 2012. View Article : Google Scholar : PubMed/NCBI
|
|
8
|
Kelly AD, Haibe-Kains B, Janeway KA, Hill
KE, Howe E, Goldsmith J, Kurek K, Perez-Atayde AR, Francoeur N, Fan
JB, et al: MicroRNA paraffin-based studies in osteosarcoma reveal
reproducible independent prognostic profiles at 14q32. Genome Med.
5:22013. View
Article : Google Scholar : PubMed/NCBI
|
|
9
|
Diboun I, Wernisch L, Orengo CA and
Koltzenburg M: Microarray analysis after RNA amplification can
detect pronounced differences in gene expression using limma. BMC
Genomics. 7:2522006. View Article : Google Scholar : PubMed/NCBI
|
|
10
|
Ritchie ME, Phipson B, Wu D, Hu Y, Law CW,
Shi W and Smyth GK: Limma powers differential expression analyses
for RNA-sequencing and microarray studies. Nucleic Acids Res.
43:e472015. View Article : Google Scholar : PubMed/NCBI
|
|
11
|
Wickham H; ggplot2, : Elegant graphics for
data analysis. Springer-Verlag. (New York, NY). 2016.
|
|
12
|
Scardoni G, Petterlini M and Laudanna C:
Analyzing biological network parameters with CentiScaPe.
Bioinformatics. 25:2857–2859. 2009. View Article : Google Scholar : PubMed/NCBI
|
|
13
|
Bader GD and Hogue CW: An automated method
for finding molecular complexes in large protein interaction
networks. BMC Bioinformatics. 4:22003. View Article : Google Scholar : PubMed/NCBI
|
|
14
|
Eldeeb MA and Fahlman RP: The
anti-apoptotic form of tyrosine kinase Lyn that is generated by
proteolysis is degraded by the N-end rule pathway. Oncotarget.
5:2714–2722. 2014. View Article : Google Scholar : PubMed/NCBI
|
|
15
|
Zhang G, Lin RK, Kwon YT and Li YP:
Signaling mechanism of tumor cell-induced up-regulation of E3
ubiquitin ligase UBR2. FASEB J. 27:2893–2901. 2013. View Article : Google Scholar : PubMed/NCBI
|
|
16
|
Lin TY, Lee CC, Chen KC, Lin CJ and Shih
CM: Inhibition of RNA transportation induces glioma cell apoptosis
via downregulation of RanGAP1 expression. Chem Biol Interact.
232:49–57. 2015. View Article : Google Scholar : PubMed/NCBI
|
|
17
|
Mao J, Liang Z, Zhang B, Yang H, Li X, Fu
H, Zhang X, Yan Y, Xu W and Qian H: UBR2 enriched in p53 deficient
mouse bone marrow mesenchymal stem cell-exosome promoted gastric
cancer progression via Wnt/beta-catenin pathway. Stem Cells.
35:2267–2279. 2017. View Article : Google Scholar : PubMed/NCBI
|
|
18
|
Guan GG, Wang WB, Lei BX, Wang QL, Wu L,
Fu ZM, Zhou FX and Zhou YF: UBE2D3 is a positive prognostic factor
and is negatively correlated with hTERT expression in esophageal
cancer. Oncol Lett. 9:1567–1574. 2015. View Article : Google Scholar : PubMed/NCBI
|
|
19
|
Wang W, Yang L, Hu L, Li F, Ren L, Yu H,
Liu Y, Xia L, Lei H, Liao Z, et al: Inhibition of UBE2D3 expression
attenuates radiosensitivity of MCF-7 human breast cancer cells by
increasing hTERT expression and activity. PLoS One. 8:e646602013.
View Article : Google Scholar : PubMed/NCBI
|
|
20
|
Gao X, Wang W, Yang H, Wu L, He Z, Zhou S,
Zhao H, Fu Z, Zhou F and Zhou Y: UBE2D3 gene overexpression
increases radiosensitivity of EC109 esophageal cancer cells in
vitro and in vivo 7. 32543–32553. 2016.PubMed/NCBI
|
|
21
|
Liu S and Feng P: MiR-203 determines poor
outcome and suppresses tumor growth by targeting TBK1 in
osteosarcoma. Cell Physiol Biochem. 37:1956–1966. 2015. View Article : Google Scholar : PubMed/NCBI
|
|
22
|
Zhang F, Yang Z, Cao M, Xu Y, Li J, Chen
X, Gao Z, Xin J, Zhou S, Zhou Z, et al: MiR-203 suppresses tumor
growth and invasion and down-regulates MiR-21 expression through
repressing Ran in esophageal cancer. Cancer Lett. 342:121–129.
2014. View Article : Google Scholar : PubMed/NCBI
|
|
23
|
Krichevsky AM and Gabriely G: miR-21: A
small multi-faceted RNA. J Cell Mol Med. 13:39–53. 2009. View Article : Google Scholar : PubMed/NCBI
|
|
24
|
Ikenaga N, Ohuchida K, Mizumoto K, Yu J,
Kayashima T, Sakai H, Fujita H, Nakata K and Tanaka M: MicroRNA-203
expression as a new prognostic marker of pancreatic adenocarcinoma.
Ann Surg Oncol. 17:3120–3128. 2010. View Article : Google Scholar : PubMed/NCBI
|
|
25
|
Kunz M and Ibrahim SM: Molecular responses
to hypoxia in tumor cells. Mol Cancer. 2:232003. View Article : Google Scholar : PubMed/NCBI
|
|
26
|
Guo M, Cai C, Zhao G, Qiu X, Zhao H, Ma Q,
Tian L, Li X, Hu Y and Liao B: Hypoxia promotes migration and
induces CXCR4 expression via HIF-1alpha activation in human
osteosarcoma. PLoS One. 9:e905182014. View Article : Google Scholar : PubMed/NCBI
|
|
27
|
Guan G, Zhang Y, Lu Y, Liu L, Shi D, Wen
Y, Yang L, Ma Q, Liu T, Zhu X, et al: The HIF-1alpha/CXCR4 pathway
supports hypoxia-induced metastasis of human osteosarcoma cells.
Cancer Lett. 357:254–264. 2015. View Article : Google Scholar : PubMed/NCBI
|
|
28
|
Cao J, Wang Y, Dong R, Lin G, Zhang N,
Wang J, Lin N, Gu Y, Ding L, Ying M, et al: Hypoxia-Induced WSB1
promotes the metastatic potential of osteosarcoma cells. Cancer
Res. 75:4839–4851. 2015. View Article : Google Scholar : PubMed/NCBI
|
|
29
|
Shan K, Pang R, Zhao C, Liu X, Gao W,
Zhang J, Zhao D, Wang Y and Qiu W: IL-17-triggered downregulation
of miR-497 results in high HIF-1alpha expression and consequent
IL-1beta and IL-6 production by astrocytes in EAE mice. Cell Mol
Immunol. 2017. View Article : Google Scholar :
|
|
30
|
Wu Z, Cai X, Huang C, Xu J and Liu A:
miR-497 suppresses angiogenesis in breast carcinoma by targeting
HIF-1alpha. Oncol Rep. 35:1696–16702. 2016. View Article : Google Scholar : PubMed/NCBI
|
|
31
|
Hoffmann EK and Lambert IH: Ion channels
and transporters in the development of drug resistance in cancer
cells. Philos Trans R Soc Lond B Biol Sci. 369:201301092014.
View Article : Google Scholar : PubMed/NCBI
|
|
32
|
Weaver AK, Liu X and Sontheimer H: Role
for calcium-activated potassium channels (BK) in growth control of
human malignant glioma cells. J Neurosci Res. 78:224–234. 2004.
View Article : Google Scholar : PubMed/NCBI
|
|
33
|
Urrego D, Tomczak AP, Zahed F, Stühmer W
and Pardo LA: Potassium channels in cell cycle and cell
proliferation. Philos Trans R Soc Lond B Biol Sci.
369:201300942014. View Article : Google Scholar : PubMed/NCBI
|
|
34
|
Bloch M, Ousingsawat J, Simon R, Schraml
P, Gasser TC, Mihatsch MJ, Kunzelmann K and Bubendorf L: KCNMA1
gene amplification promotes tumor cell proliferation in human
prostate cancer. Oncogene. 26:2525–2534. 2007. View Article : Google Scholar : PubMed/NCBI
|
|
35
|
Oeggerli M, Tian Y, Ruiz C, Wijker B,
Sauter G, Obermann E, Güth U, Zlobec I, Sausbier M, Kunzelmann K
and Bubendorf L: Role of KCNMA1 in breast cancer. PLoS One.
7:e416642012. View Article : Google Scholar : PubMed/NCBI
|
|
36
|
Bury M, Girault A, Mégalizzi V,
Spiegl-Kreinecker S, Mathieu V, Berger W, Evidente A, Kornienko A,
Gailly P, Vandier C and Kiss R: Ophiobolin A induces
paraptosis-like cell death in human glioblastoma cells by
decreasing BKCa channel activity. Cell Death Dis. 4:e5612013.
View Article : Google Scholar : PubMed/NCBI
|
|
37
|
Cambien B, Rezzonico R, Vitale S,
Rouzaire-Dubois B, Dubois JM, Barthel R, Soilihi BK, Mograbi B,
Schmid-Alliana A and Schmid-Antomarchi H: Silencing of hSlo
potassium channels in human osteosarcoma cells promotes
tumorigenesis. Int J Cancer. 123:365–371. 2008. View Article : Google Scholar : PubMed/NCBI
|
|
38
|
Khaitan D, Sankpal UT, Weksler B, Meister
EA, Romero IA, Couraud PO and Ningaraj NS: Role of KCNMA1 gene in
breast cancer invasion and metastasis to brain. BMC Cancer.
9:2582009. View Article : Google Scholar : PubMed/NCBI
|
|
39
|
Sontheimer H: An unexpected role for ion
channels in brain tumor metastasis. Exp Biol Med (Maywood).
233:779–791. 2008. View Article : Google Scholar : PubMed/NCBI
|