Introduction
HCC is the most common type of hepatic malignancy,
has a poor prognosis and accounts for ~85% of primary liver cancer
cases, with a 5-year survival rate of <10%. The early stages of
HCC lack visible symptoms; however, there is rapid growth of the
tumor (1–3). Late diagnosis and limited treatment
options explain the low survival rate of patients with HCC, while
early diagnosis using effective biomarkers could improve the
survival rate and therapeutic options. A total of three major types
of molecular marker are used for HCC diagnosis, including
serological markers, cancer stem cell markers and tumor tissue
markers (4). The discovery of
biomarkers present in the serum and plasma may be beneficial for a
number of diseases (5), as
serological markers are the most commonly used in the clinic. In
addition, it may be useful to combine serum and tissue proteomics
for the detection of disease.
In serum, the presence of high-abundance proteins
(HAPs), including albumin, IgG, transferrin and anti-trypsin, can
make it difficult to separate low-abundance proteins (LAPs) using
2-D gel electrophoresis (2-DE) for proteomic analysis (6). The detection of LAPs and peptides is
typically hindered by the presence of HAPs, including albumin and
IgG (7). Proteomic analysis of
human serum, particularly for LAPs, has great potential for disease
diagnosis (8). However, the
majority of potential biomarkers are LAPs and must be separated
from major serum proteins in order to be resolved and
identified.
The present study prepared a lysis buffer to improve
the resolution of protein separation using 2-DE from the serum of
patients with HCC, which removes the requirement for the depletion
of HAPs. HCC tissue samples and corresponding adjacent tissue
samples obtained during surgery were used to detect the expression
of proteins with 2-DE and matrix-assisted laser
desorption/ionization (MALDI)-time of flight (TOF)/TOF mass
spectrometry (MS). Reverse transcription-quantitative PCR (RT-qPCR)
was employed to evaluate the changes in the corresponding mRNA
expression levels in tissues. Immunohistochemistry (IHC) was
performed to detect the expression of proteins of interest in HCC
and adjacent tissue samples. Statistical analysis and database
matching were used to identify the differentially expressed
proteins detected in the serum and tissue samples.
Materials and methods
Ethical procedures
The current study was approved by the Ethics
Committee of Zhongshan Hospital. Human blood samples for the
control (CS) group were collected from healthy volunteers (n=50)
who had no obvious signs of disease, as determined by clinical
hematology. In the CS group there were 38 males and 12 females,
between 45 and 75 years of age. Blood samples for the HCS group
were collected from patients with HCC (n=50) who were diagnosed by
pathology. In the HCS group there were also 38 males and 12
females, the age range was the same as in the CS group (Table SI). Samples of HCC (HCT group) and
adjacent tissue (AT group) (n=10), and histological sections, were
supplied by the Hepatocellular Carcinoma Clinical Sample Library
(Zhongshan Hospital, Xiamen University). The samples were collected
between June 2015 and June 2016. Individuals provided informed
consent to participate in the study, according to the requirements
of the Ethics Committee of Zhongshan Hospital. Clinical data for
the HCC patients involved in the present study are shown in
Tables SI and SII.
Chemicals
The current study used carrier ampholyte (pH 5-8; GE
Healthcare), dithiothretol (DTT), 3-[(3-cholamidopropyl)
dimethylammonio]-1-propanesulfonate (CHAPS) and α-cyano-4-hydroxy
cinnamic acid (HCCA) were purchased from Sigma-Aldrich; Merck KGaA.
Trypsin was obtained from Promega Corporation. The new lysis buffer
(lysis buffer N) was composed of 7 M urea, 4% (w/v) CHAPS, 2 M
thiourea, 60 mM DTT, 10 mM Tris, 1 mM EDTA, 0.5% (v/v) carrier
ampholyte (pH 5–8) and 1% protease inhibitor. The lack of SDS was
the principal difference from traditional lysis buffer.
Sample preparation
A total of 0.2 ml serum from the CS and HCS groups
was collected from volunteers and mixed to identify differential
proteins among individuals for proteome separation. An ice-cold
mixture serum sample (20 µl serum from each volunteer mixed to 1 ml
for detection) was mixed with 9 ml lysis buffer N, stored overnight
at −70°C, then thawed and centrifuged at 6,000 × g for 30 min at
4°C. The protein concentration of the supernatants was determined
using the Bradford method and the samples were then stored at −70°C
prior to 2-DE.
Tissue samples for the HCT and AT groups, containing
a mixture of 50 mg from each sample for the different groups, were
homogenized in lysis buffer N and placed on ice for 2 h prior to
centrifugation at 10,000 × g for 30 min at 4°C. The supernatants
were collected and stored at −70°C following determination of the
protein concentration.
2-DE and imaging analysis
A high-resolution 2-DE method for separating serum
and tissue proteins was performed using the Investigator 2-D Gel
system (PerkinElmer, Inc.). The protein sample (150 µg) for each
group was loaded on a 14-cm isoelectric focusing strip for the
first-dimension electrophoresis, which was performed at a total of
11,000 V via the following stepwise increases: 200 V for 0.25 h;
300 V for 0.5 h; 400 V for 1 h; and 600 V for 16 h. Prior to PAGE,
the gel strips were equilibrated for 15 min in equilibration buffer
(6 M urea, 30% glycerol, 50 mM Tris-HCl, 2% SDS and 1% DTT) and
then for 15 min in the same buffer containing 2.5% iodoacetamide
instead of DTT. SDS-PAGE (T=12%) for the second-dimension
electrophoresis was performed at 15 mA per gel for ~5 h. For each
group, three experimental replicates were subjected to 2-DE.
The silver-stained gels were scanned using the Image
Scanner II apparatus (GE Healthcare). ImageMaster 2D Platinum
software (version 7.0; GE Healthcare) was employed for digital
analysis of the protein spots. Protein spots were detected and
compared between the CS and HCS groups, and the HCT and AT groups,
and individual spot volume values were obtained, according to the
manufacturer's protocol.
In-gel digestion and MALDI-TOF/TOF MS
analysis
The differentially expressed proteins were manually
excised from the 2-DE gels. Each protein was washed at room
temperature with 50 µl Milli-Q water, twice for 20 min each time.
The protein was then immersed in destaining solution [30 mM
K3Fe(CN)6 and 100 mM
Na2S2O3 at a 1:1 ratio] for 2 min
and washed at room temperature with 100 µl
NH4HCO3 (25 mM) containing 50% acetonitrile
(ACN), twice for 20 min each time. Subsequently, the gel spots were
dehydrated using 100% ACN for 10 min, dried in a vacuum centrifuge
for 10 min, and rehydrated with 10–20 µl trypsin solution in an
ice-bath for 30 min, followed by incubation at 37°C for 16 h. The
supernatant was collected in new tubes, and the extracts were
pooled and dried in a vacuum centrifuge (Eppendorf). Finally, 2.5
µl 0.5% trifluoroacetic acid (TFA) dissolved in 60% ACN was added
to each protein sample to dissolve the protein powder for
MALDI-TOF/TOF MS analysis.
Each protein solution was mixed with matrix solution
(HCCA saturated in 60% ACN and 0.1% TFA) at a 1:1 ratio. The
mixture (1 µl) was then spotted onto the MALDI target and analyzed
using a REFLEX III MALDI-TOF/TOF MS system (Bruker Corporation).
The peptide spectra were recorded in the reflector mode and
calibrated with acidic peptides [residues 26; M
(H+)=2,961.5] and angiotensin I (1,296.5 Da). The
accuracy of the molecular ion mass was >±0.1 Da up to a mass of
6,000 Da. All other settings were as previously published (9). Peptide mass fingerprinting (PMF) of
selected proteins was performed using the MASCOT database
(http://www.matrixscience.com/search_form_select.html).
The maximum tolerance for masses was adjusted to 40 ppm by internal
calibration. Mr and pI values of the analyzed spots were obtained
from the 2-DE gel. The SWISS-PROT (https://www.expasy.org/) databases were used for the
identification of significant proteins.
Gene expression analysis
TRIzol® reagent (Thermo Fisher
Scientific, Inc.) was used to extract RNA from the HCC tissue
samples and adjacent tissue samples. Complementary DNA was obtained
using the Takara PrimeScript™ RT-qPCR kit (Takara Bio, Inc.) as
follows: 65°C for 5 min, rapid cooling on ice, 30°C for 10 min,
42°C for 45 min, 95°C for 5 min and cooling on ice. RT-qPCR was
performed with the SYBR® Premix Ex Taq™ II (Perfect Real
Time) kit (Takara Bio, Inc.), according to the manufacturer's
protocol. The housekeeping gene β-actin was used as the internal
control. The primers used in the current study are listed in
Table I. RT-qPCR was performed
using an Applied Biosystems FAST 7500 real-time PCR system (Thermo
Fisher Scientific, Inc.) with the following steps: Amplification
was initiated with pre-denaturing at 95°C for 30 sec, denaturing
was performed at 95°C for 5 sec, annealing and extension were
performed at 62°C for 35 sec over 40 cycles during the second
stage, and there was a final stage of 60–95°C to determine the
dissociation curves of the amplified products. The
2−ΔΔCq method (10) was
employed to perform the analysis of differential gene expression. A
Student's t-test was used for statistical analysis.
 | Table I.Sequences of the primers used in
reverse transcription-quantitative PCR. |
Table I.
Sequences of the primers used in
reverse transcription-quantitative PCR.
| Groups | Spot no. | Name | Direction | Primers
(5′→3′) |
|---|
| CS and HCS
groups | 4 | HS3ST3A1 | Forward |
AAAGCGCCTCCTGCAACT |
|
|
|
| Backward |
AGGCCAGGGGACTCTTCTT |
|
| 7 | Tubulin βD | Forward |
CTGGACCGCATCTCTGTGTA |
|
|
|
| Backward |
AAAGGACCTGAGCGAACAGA |
|
| 8 | Apolipoprotein
A-D | Forward |
GGAACAGCTCAGGCAGAAAC |
|
|
|
| Backward |
GGAGTTGACCTTGTCCCTCA |
|
| 9 | RAS oncogene
family | Forward |
GAGAGAGCAAAAGGCAATGG |
|
|
|
| Backward |
CTGGGCTTGAGGTTCATCAT |
|
| 12 | 60S acidic
ribosomal protein P0 | Forward |
GGAGACGACTTGCCAGAGAG |
|
|
|
| Backward |
AGTCCCGAGTCCCTTTCAGT |
|
| 15 | OSBPL11 | Forward |
CCATGTGATCACTGTACTGCC |
|
|
|
| Backward |
AATGAAAGTCTCGGAGAGCG |
|
| 16 | Cyclin H | Forward |
ATTCAGATGCAAAGCCGTGG |
|
|
|
| Backward |
GCTGGCTTAAACACCGAACA |
| HCT and AT
groups | 1 | Eukaryotic
Translation Initiation Factor Eif5a (EIF5A) | Forward |
TTCGAGACAGGAGATGCAGG |
|
|
|
| Backward |
TGAGCACCACAAAGCCATTC |
|
| 2 | Cytochrome b5 | Forward |
GAAGCACAACCACAGCAAGA |
|
|
|
| Backward |
GCCCGACATCCTCAAAGTTC |
|
| 3 | Ferritin heavy
polypeptide 1 (FTH1) | Forward |
ACTTTGACCGCGATGATGTG |
|
|
|
| Backward |
CAGCATGTTCCCTCTCCTCA |
|
| 4 | Calpain small
subunit 1 | Forward |
TGATGGATAGCGACACCACA |
|
|
|
| Backward |
CTGCAAATGGTCCCTGATCG |
|
| 5 | 14-3-3ε | Forward |
TTTGCCACAGGAAACGACAG |
|
|
|
| Backward |
TAGGATGCGTTGGTGGAAGT |
|
| 6 |
Pyrophosphatase | Forward |
GTCTGAGAGCCCCTTCAAGT |
|
|
|
| Backward |
CGTCTGTTGGTACTGTGCAC |
|
| 7 | Unnamed
protein | Forward |
CCTGAGCAAGGAGGACTTTG |
|
|
|
| Backward |
AGACAGGGCATGGAAGAATG |
|
| 8 | Keratin1 | Forward |
GAGGTGGTGGGAGATTTTCA |
|
|
|
| Backward |
CACTACCACGTCCACCTCCT |
|
| 9 | Centlein | Forward |
AAATTGCTCTGTGGGTCGTC |
|
|
|
| Backward |
TGCTGCTTTCACTCACATCC |
|
| 10 | Apolipoprotein
E | Forward |
GGTCGCTTTTGGGATTACCT |
|
|
|
| Backward |
TCCAGTTCCGATTTGTAGGC |
|
| 11 | Growth-inhibiting
protein 1 | Forward |
CAACATCTCCACCTGGGTCT |
|
|
|
| Backward |
GGGAGTCCTCATCATCTCCA |
|
| 12 | Tapasin-ERP57 | Forward |
AAGCTCAGCAAAGACCCAAA |
|
|
|
| Backward |
GCTTCTTGTTGGCTGGAGAG |
| Internal
reference | – | β-actin | Forward |
AAATCTGGCACCACACCTTC |
|
|
|
| Backward |
AGAGGCGTACAGGGATAGCA |
IHC
IHC staining was performed on 4 µm-thick HCC tissue
sections and adjacent tissue sections. The slides were rehydrated
in dimethylbenzene and a descending alcohol series. After washing
three times with double distilled H2O, citrate buffer
(0.01 mol/liter, pH 6.0) was used for antigen retrieval by boiling
(≥95°C) the slides in a microwave oven for 10 min, after natural
cooling to room temperature, slides were washed twice using double
distilled H2O and twice using PBS buffer at room
temperature. Then 10% BSA (Sigma-Aldrich; Merck KGaA) blocking
solution was used and incubated for 30 min at 37°C. Apolipoprotein
E (APOE) rabbit monoclonal antibody (cat. no. CY5573; Abways
Technology, Inc.) was applied at 1:100 in PBS for 2 h at room
temperature. A universal secondary antibody (EnVision™+/HRP
rabbit/mouse; DAKO; Agilent Technologies, Inc.) was then applied
for 30 min at 37°C. Diaminobenzidine was used for chromogen
detection. Slides were incubated with diaminobenzidine for 5 min at
room temperature and after washing for 2 min with water, slides
were counterstained with hematoxylin for 40 sec and hydrochloric
acid alcohol solution [70% alcohol:HCl at a ratio of 100:1 (v:v)]
for 2 sec at room temperature. Dehydration was achieved using an
increasing alcohol series and dimethylbenzene. Slides were sealed
using neutral balsam and a coverslip. A light microscope (Diaphot
300, Nikon Corporation) was used to observe the sections after
staining.
Survival analysis, pathway analysis
and statistical analysis
Survival analysis of differentially expressed
proteins in liver cancer was performed using the Kaplan-Meier
Plotter mRNA/RNA-seq database of liver cancer (http://kmplot.com/analysis/index.php?p=background).
The survival analysis was carried out using the Kaplan-Meier method
on 364 patients, and hazard ratios with 95% confidence intervals
and log-rank P-values were calculated. Pathway analysis of
identified proteins was performed using the Search Tool for
Interactions of Chemicals (STITCH; http://stitch.embl.de). The functional properties and
subcellular localization of the proteins were determined using the
UniProt (www.uniprot.org/) and PSORT (https://db.psort.org) databases, respectively.
The data are expressed as the mean ± SD of
triplicate experiments. Significant differences among groups were
determined using one-way ANOVA with SPSS version 19 (IBM Corp.)
followed by the LSD post-hoc test. P<0.05 was considered to
indicate a statistically significant difference.
Results
Differential protein profiles in serum
and tissue groups
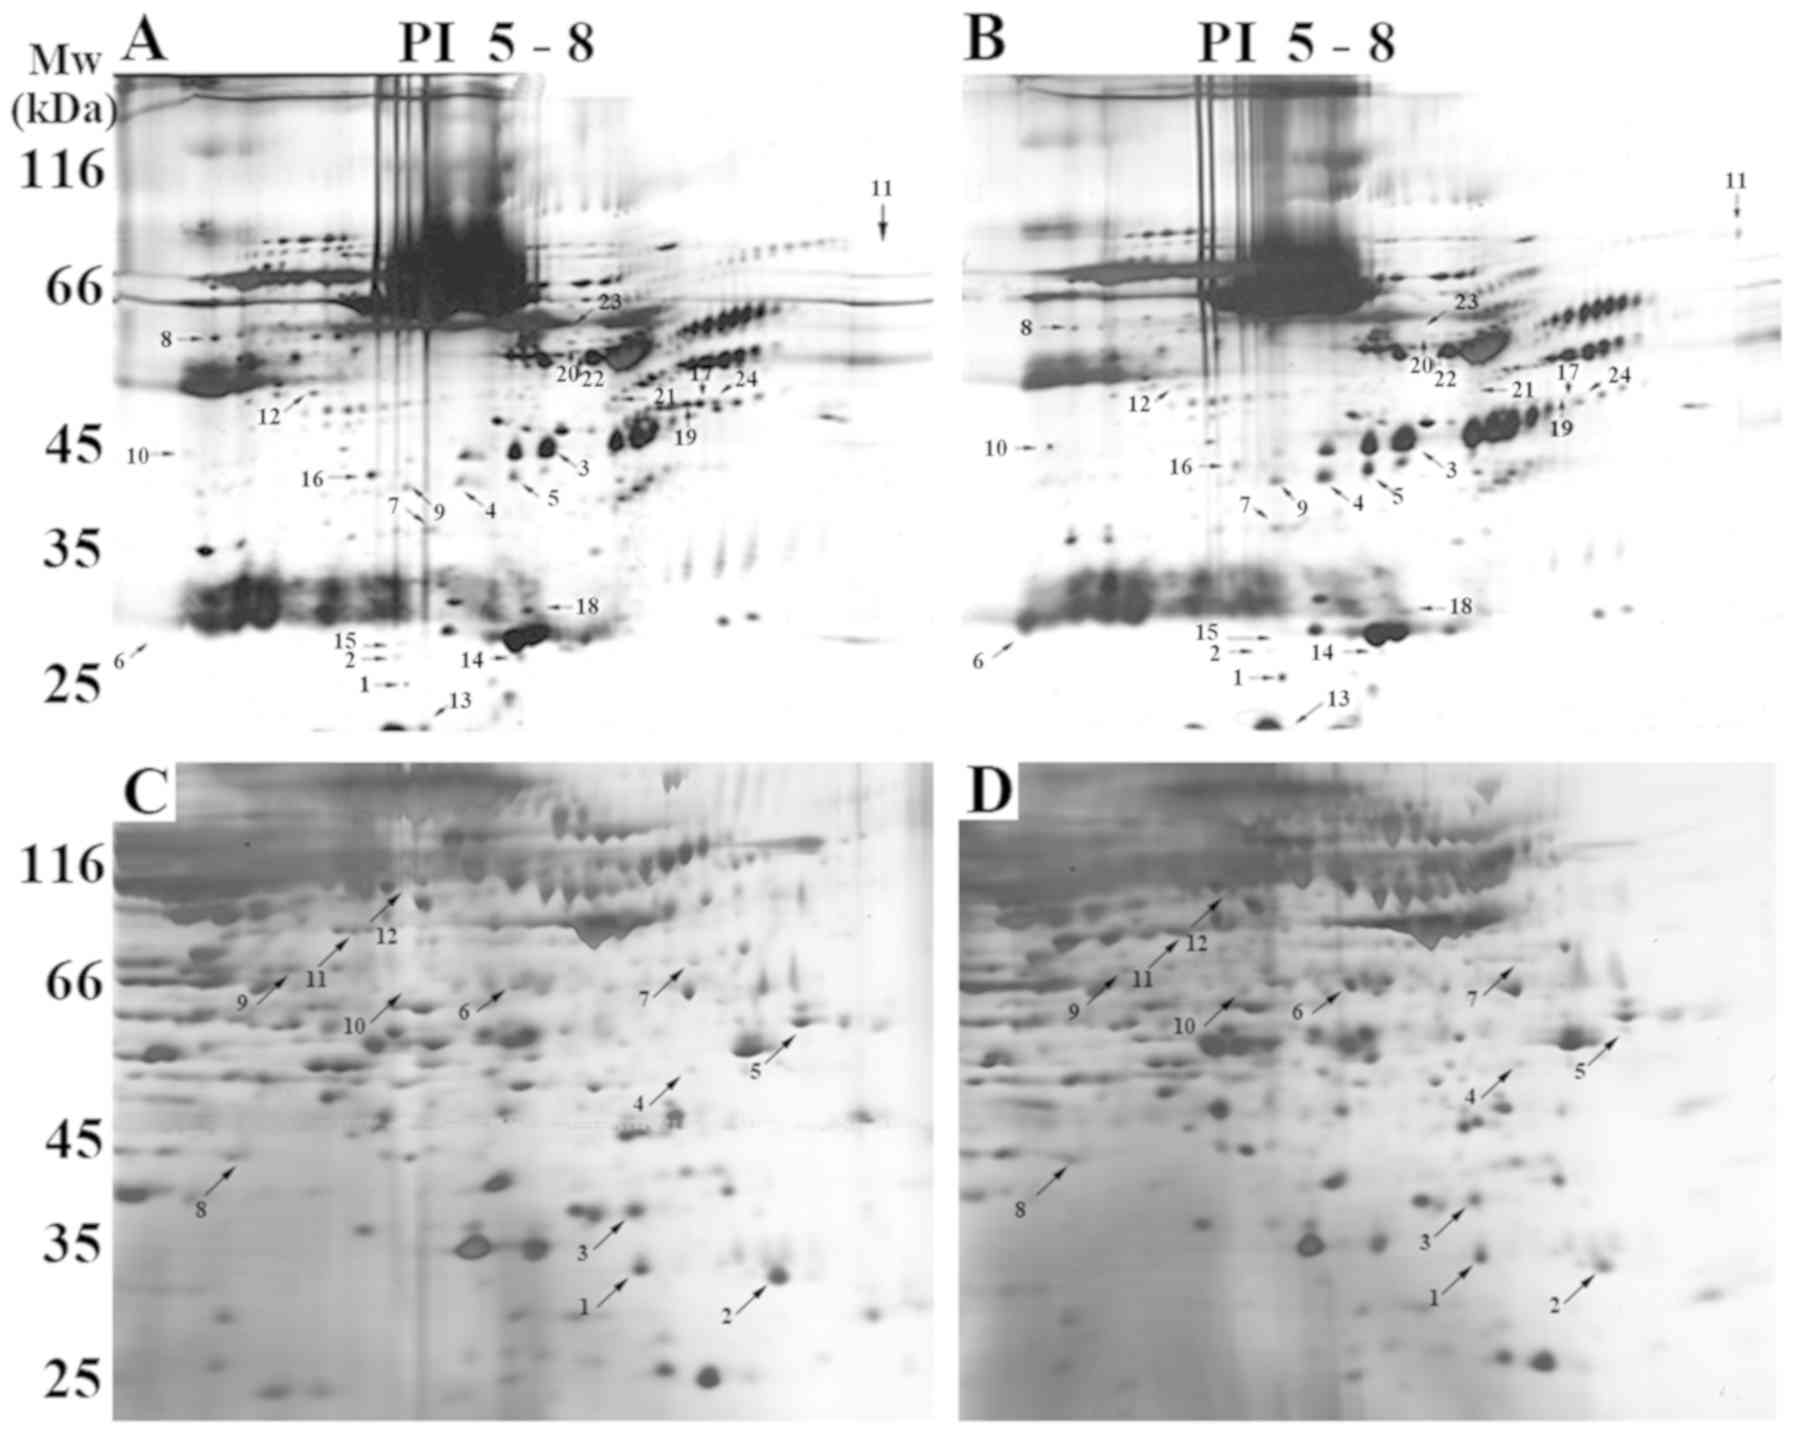
The serum sample in the lysis buffer was separated
using 2-DE gel at a pH of 5–8. A total of 150±5 µg serum protein
was considered optimal for separation using 2-DE. The new lysis
buffer was conducive to obtaining more protein spots (Fig. S1). As demonstrated in Fig. 1A and B, ~800 proteins were
visualized. Fig. 1C and D
demonstrates the 2-DE results for the HCT and AT groups, in which
almost 1,200 proteins were revealed by sliver staining in each
tissue gel.
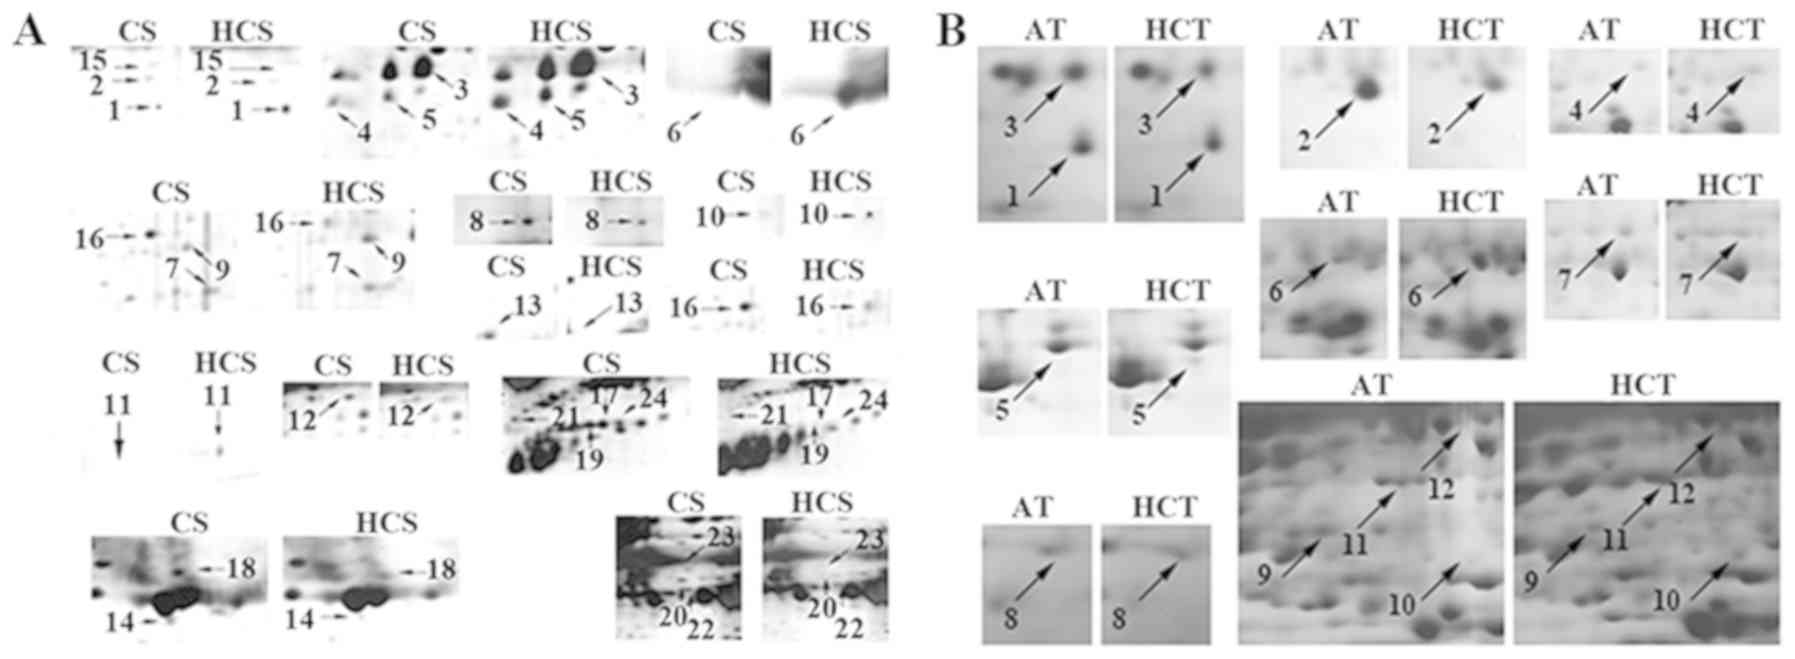
Quantitative image analysis based on the percentage
of the spots revealed that certain proteins were either
significantly upregulated or downregulated between the two groups
(Fig. 2). Compared with the CS
group, the expression levels of 24 proteins were significantly
different in the HC group (Fig.
2A). Furthermore, 12 proteins were revealed to be
differentially expressed in the AT and HCT groups (Fig. 2B).
Identification of differentially
expressed proteins
MALDI-TOF/TOF MS, PMF and a database search were
used to evaluate the proteins identified in Fig. 2. MALDI-TOF/TOF MS can identify
small amounts of protein in 2-DE gels. The differentially expressed
proteins were digested by trypsin in the gel to further assist with
the identification of the proteins (Table II). Of the 24 differentially
expressed proteins between the CS and HCS groups, seven were
identified. Additionally, all 12 differentially expressed proteins
in the AT and HCT groups were identified. Biochemical parameters
based on the results of the database search are presented in
Table II, including accession
number, protein name, score, Mw and PI.
| Table II.A detailed list of protein spots
identified using matrix-assisted laser desorption/ionization-time
of flight/time of flight mass spectrometry from Figs. 1 and 2. |
Table II.
A detailed list of protein spots
identified using matrix-assisted laser desorption/ionization-time
of flight/time of flight mass spectrometry from Figs. 1 and 2.
|
|
|
|
|
|
| Relative intensity
ratioa |
|---|
|
|
|
|
|
|
|
|
|---|
| Groups | Spot no. | Accession no. | Protein name | Score | Mw (Da)/PI | CS or AT | HCS or HCT |
|---|
| CS and HCS
groups | 4 | gi|37182794 | HS3ST3A1 | 73 | 45161/9.54 | 1.000±0.020 |
3.852±0.024b |
|
| 7 | gi|41202625 | Tubulin beta D | 68 | 12210/8.66 | 1.000±0.024 |
2.056±0.120b |
|
| 8 | gi|563320 | Apolipoprotein
A-D | 64 | 28141/5.39 | 1.000±0.010 |
0.327±0.055b |
|
| 9 | gi|62203472 | RAS oncogene
family | 62 | 24738/8.11 | 1.000±0.022 |
2.836±0.114b |
|
| 12 | gi|5815233 | 60S acidic
ribosomal protein P0 | 64 | 27602/7.68 | 1.000±0.031 |
0.258±0.006b |
|
| 15 | gi|18027780 | OSBPL11 | 67 | 11783/9.28 | 1.000±0.015 |
0.004±0.000b |
|
| 16 | gi|18490206 | Cyclin H | 75 | 38047/6.73 | 1.000±0.011 |
0.183±0.003b |
| AT and HCT
groups | 1 | gi|183448388 | EIF5A | 118 | 15367.8/5.8 | 1.000±0.022 |
0.615±0.051b |
|
| 2 | gi|353818 | Cytochrome b5 | 116 | 11130.5/5.02 | 1.000±0.023 |
0.305±0.001b |
|
| 3 | gi|120516 | FTH1 | 134 | 21383.4/5.3 | 1.000±0.047 |
0.427±0.004b |
|
| 4 | gi|4502565 | Calpain small
subunit 1 | 61 | 28468.8/5.05 | 1.000±0.020 |
1.651±0.035b |
|
| 5 | gi|62131678 | 14-3-3ε | 107 | 26658.3/4.76 | 1.000±0.053 |
8.790±0.225b |
|
| 6 | gi|8247940 |
Pyrophosphatase | 134 | 33095.3/5.54 | 1.000±0.046 |
5.362±0.156b |
|
| 7 | gi|194381194 | Unnamed
protein | 61 | 39184.8/4.78 | 1.000±0.026 | 0.725±0.013 |
|
| 8 | gi|186772 | Keratin1 | 78 | 66149/8.16 | 1.000±0.104 |
4.246±0.255b |
|
| 9 | gi|317373585 | Centlein | 73 | 162131.1/8.28 | 1.000±0.035 |
0.562±0.003b |
|
| 10 | gi|178853 | Apolipoprotein
E | 221 | 36241.9/5.81 | 1.000±0.022 |
3.738±0.213b |
|
| 11 | gi|34452679 | Growth-inhibiting
protein 1 | 322 | 34670.1/5.69 | 1.000±0.033 |
3.792±0.220b |
|
| 12 | gi|220702506 | Tapasin-ERP57 | 769 | 54541.4/5.16 | 1.000±0.025 |
9.407±0.217b |
The ratio of protein spots compared with the whole
gel and the spot grey value may demonstrate the expression level of
the corresponding protein. Taking the CS or AT groups as the
control, the relative intensity ratio of the HCS and HCT groups
revealed significant changes in the expression levels of certain
proteins, which are presented in Table II. A total of three upregulated
proteins were identified (spot nos. 4, 7 and 9) and four
downregulated proteins were revealed (spot nos. 4, 12, 15 and 16)
in the HCS group compared with the CS group. For the tissue groups,
seven upregulated proteins were identified (spot nos. 4, 5, 6, 8,
10, 11 and 12) and five downregulated proteins were revealed (spot
nos. 1, 2, 3, 7 and 9) in the HCT group compared with the AT
group.
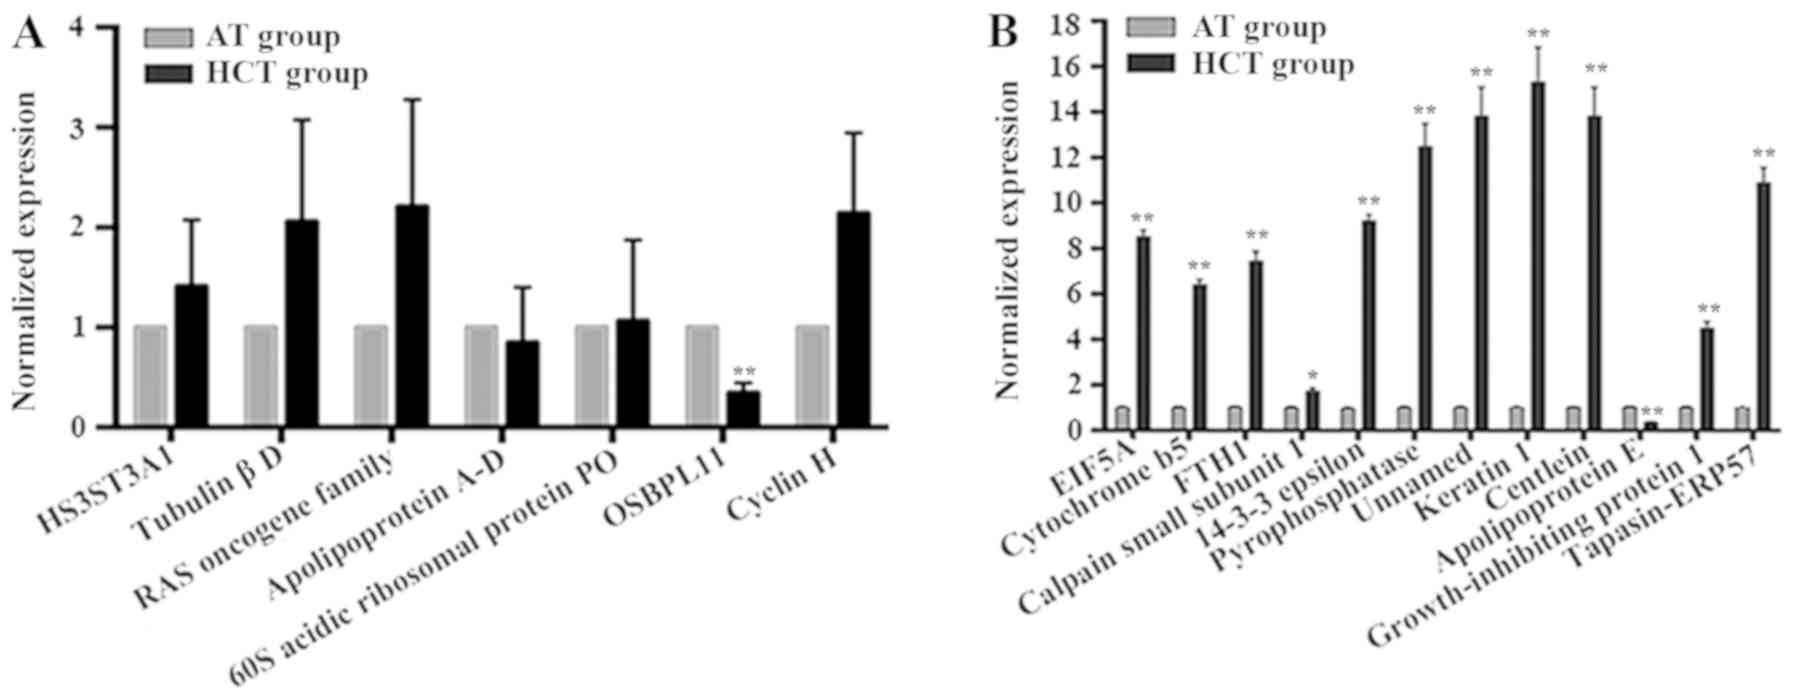
Gene expression analysis
RT-qPCR analysis was performed to assess the extent
of the changes in protein expression levels in the 2-DE results. A
total of seven differentially expressed genes from the CS and HCS
groups, and twelve genes from the AT and HCT groups (Table II) were selected for this
analysis. The gene expression levels of the proteins identified in
the CS/HCS groups were analyzed in HCC tissues and corresponding
adjacent tissues by RT-qPCR, and the results are demonstrated in
Fig. 3A and Table SIII. The mRNA expression levels
determined by RT-qPCR for ten samples of each group were relatively
consistent with the protein expression levels revealed by 2-DE
(Figs. 1A, B and 2A; Table
II). The expression level of one gene, oxysterol binding
protein-like 11 (OSBPL11), was revealed to be lower in HCC tissues
compared with adjacent tissues in all 10 samples; this difference
was identified to be significant in nine of the samples, and the
difference between the HCT and AT groups reached a highly
significant level (P<0.001; Table
SIII). This result was consistent with the results of 2-DE. In
addition, the expression levels of six other genes, including
heparan sulfate (glucosamine) 3-O-sulfotransferase 3A1 (HS3ST3A1),
tubulin βD, the RAS oncogene family, apolipoprotein A-D, 60S acidic
ribosomal protein P0 and cyclin H, were partly consistent with the
results of 2-DE. These results further confirmed the validity of
the proteomic approach for the identification of serum biomarkers
in HCC.
The expression levels of 12 differentially expressed
genes identified in the AT and HCT groups (Figs. 1A, B and 2; Table
II), were also evaluated using RT-qPCR in a total of ten tissue
samples (Fig. 3B; Table SIV). Among the 12 genes
investigated, the expression levels of 11 genes were revealed to be
significantly higher in the HCT group compared with the AT group.
By contrast, the expression level of the APOE gene was identified
to be lower in the HCT group compared with the AT group. The gene
expression levels in the HCT group identified by RT-qPCR were not
completely consistent with the protein changes identified by 2-DE.
A total of six spots (nos. 4, 5, 6, 8, 11 and 12) demonstrated
similar expression levels in 2-DE compared with RT-qPCR for the AT
and HCT groups.
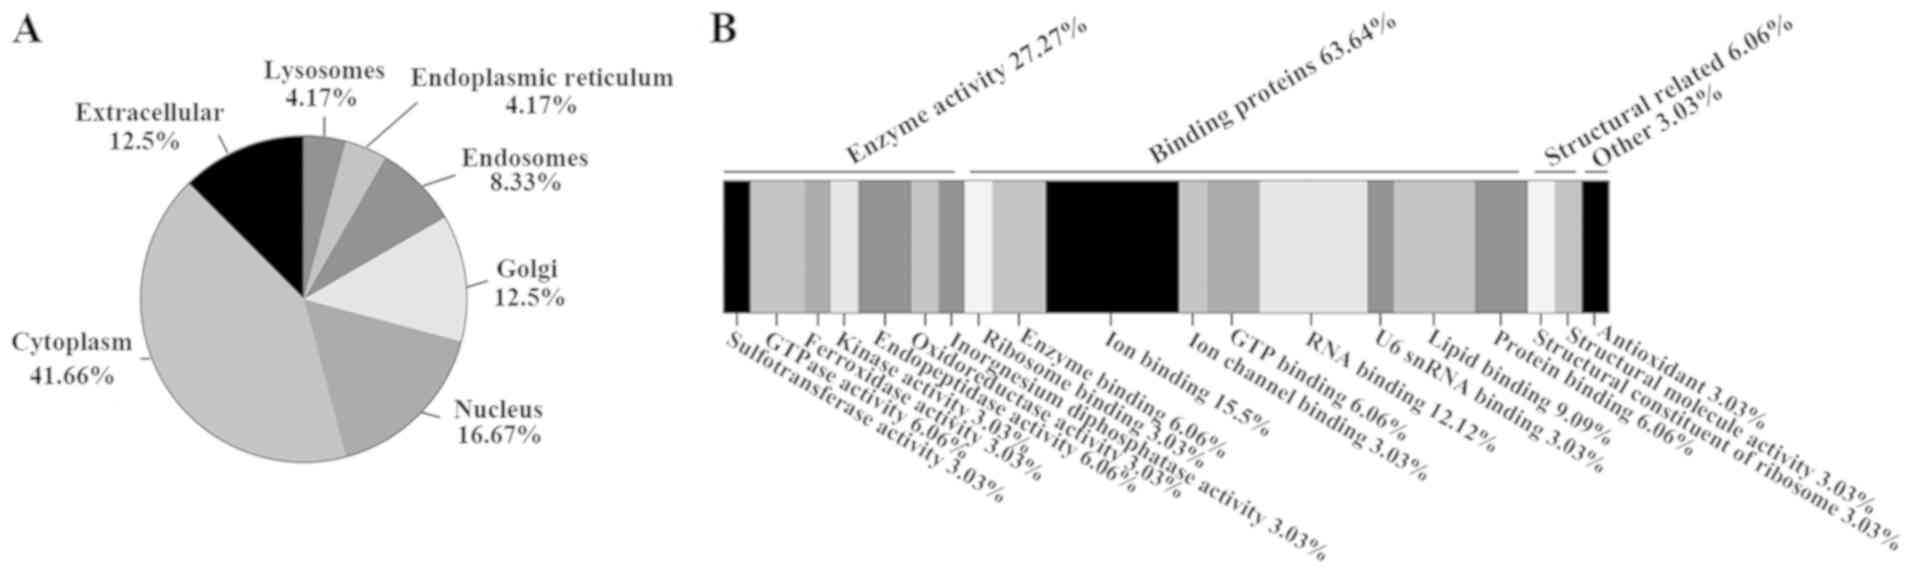
Subcellular localization and
functional properties
As presented in Fig.
4A and Table III, the
identified proteins were predominantly localized in the cytoplasm,
nucleus, Golgi, endosomes, endoplasmic reticulum, lysosomes and
extracellular space. The statistical analysis was not performed
separately for the proteins identified in the CS/HCS groups and the
AT/HCT groups. In total, 41.67% of the proteins were located the in
cytoplasm, 16.67% were located in the nucleus, 12.5% in the Golgi,
8.33% in endosomes, 4.17% in lysosomes or endoplasmic reticulum,
and 12.5% were identified to be located in the extracellular space
as secretory proteins.
| Table III.Functional classification of the
proteins identified using matrix-assisted laser
desorption/ionization-time of flight/time of flight mass
spectrometry from the CS and HCS, AT and HCT groups. |
Table III.
Functional classification of the
proteins identified using matrix-assisted laser
desorption/ionization-time of flight/time of flight mass
spectrometry from the CS and HCS, AT and HCT groups.
| Groups | Spot no. | Protein name | Subcellular
location | Molecular
function | Biological
process |
|---|
| CS and HCS
groups | 4 | HS3ST3A1 | Golgi | Sulfotransferase
activity | Glycosaminoglycan
biosynthetic process |
|
| 7 | Tubulin βD | Cytoplasm | GTPase activity;
GTP binding | Cell division;
cellular process |
|
| 8 | Apolipoprotein
A-D | Extracellular | Lipid binding | Lipid
transport |
|
| 9 | RAS oncogene
family |
Cytoplasm/Golgi/Endosomes/Nucleus | GTPase activity;
GTP binding | Intracellular
signal transduction |
|
| 12 | 60S acidic
ribosomal protein P0 |
Cytoplasm/Nucleus | RNA binding;
Structural constituent of ribosome | rRNA
processing |
|
| 15 | OSBPL11 | Endosome/Golgi | Lipid binding | Fat cell
differentiation; lipid transport |
|
| 16 | Cyclin H | Nucleus | Kinase
activity | Cell cycle,
transcription regulation |
| HCT and AT
groups | 1 | EIF5A |
Cytoplasm/Nucleus |
Protein/ribosome/RNA binding; U6 snRNA
binding; | Apoptotic process;
cell proliferation; translation regulation; |
|
| 2 | Cytochrome b5 | Cytoplasm | Enzyme binding;
metal ion binding | L-ascorbic acid
metabolic process; response to cadmium ion |
|
| 3 | FTH1 |
Extracellular/exosome | Iron binding;
ferroxidase | Iron response;
immune response; cell proliferation; |
|
| 4 | Calpain small
subunit 1 | Cytoplasm | Calcium ion
binding; endopeptidase activity | Cornification;
extracellular matrix disassembly; regulation of proliferation and
macroautophagy. |
|
| 5 | 14-3-3ε |
Nucleolus/Cytoplasm | Enzyme binding; ion
channel binding; RNA binding | Cell cycle;
intracellular signal transduction |
|
| 6 |
Pyrophosphatase | Cytoplasm | Inorganic
diphosphatase activity; magnesium ion binding | Diphosphate
metabolic process; protein translation |
|
| 7 | Unnamed
protein | – | – | – |
|
| 8 | Keratin 1 | Cytoplasm | Structural molecule
activity | Keratin
filament |
|
| 9 | Centlein | Cytoplasm | Protein
binding | Centriole-centriole
cohesion; protein localization to organelle |
|
| 10 | Apolipoprotein
E | Extracellular | Antioxidant;
cholesterol and lipid binding | Lipid transport and
storage; lipoprotein biosynthetic, catabolic, metabolic
process |
|
| 11 | Growth inhibiting
protein 1 | Lysosomes | Metal ion
binding | – |
|
| 12 | Tapasin-ERP57 | Endoplasmic
reticulum | Endopeptidase;
oxidoreductase; RNA binding | Apoptotic signaling
pathway; protein folding and import into nucleus; protein retention
in ER |
In total, the proteins were revealed to be enriched
in 19 molecular function terms (Fig.
4B), including ‘sulfotransferase activity’, ‘GTPase activity’,
‘ferroxidase activity’, ‘kinase activity’, ‘oxidoreductase
activity’, ‘inorgnesium diphosphatase activity’, ‘ribosome
binding’, ‘ion binding’, ‘GTP binding’, ‘RNA binding’, ‘U6 snRNA
binding’, ‘lipid binding’, ‘protein binding’, ‘structural
constituent of ribosome’, ‘structural molecule activity’ and
‘antioxidant’. Comprehensive analysis revealed that 63.64% of the
functions were associated with protein binding, 27.27% were
associated with enzyme activity and 6.06% were associated with
structure. The enriched biological processes varied markedly and
included the following: Biosynthetic process, cell cycle, signal
transduction, transport, metabolic and immune response (Table III).
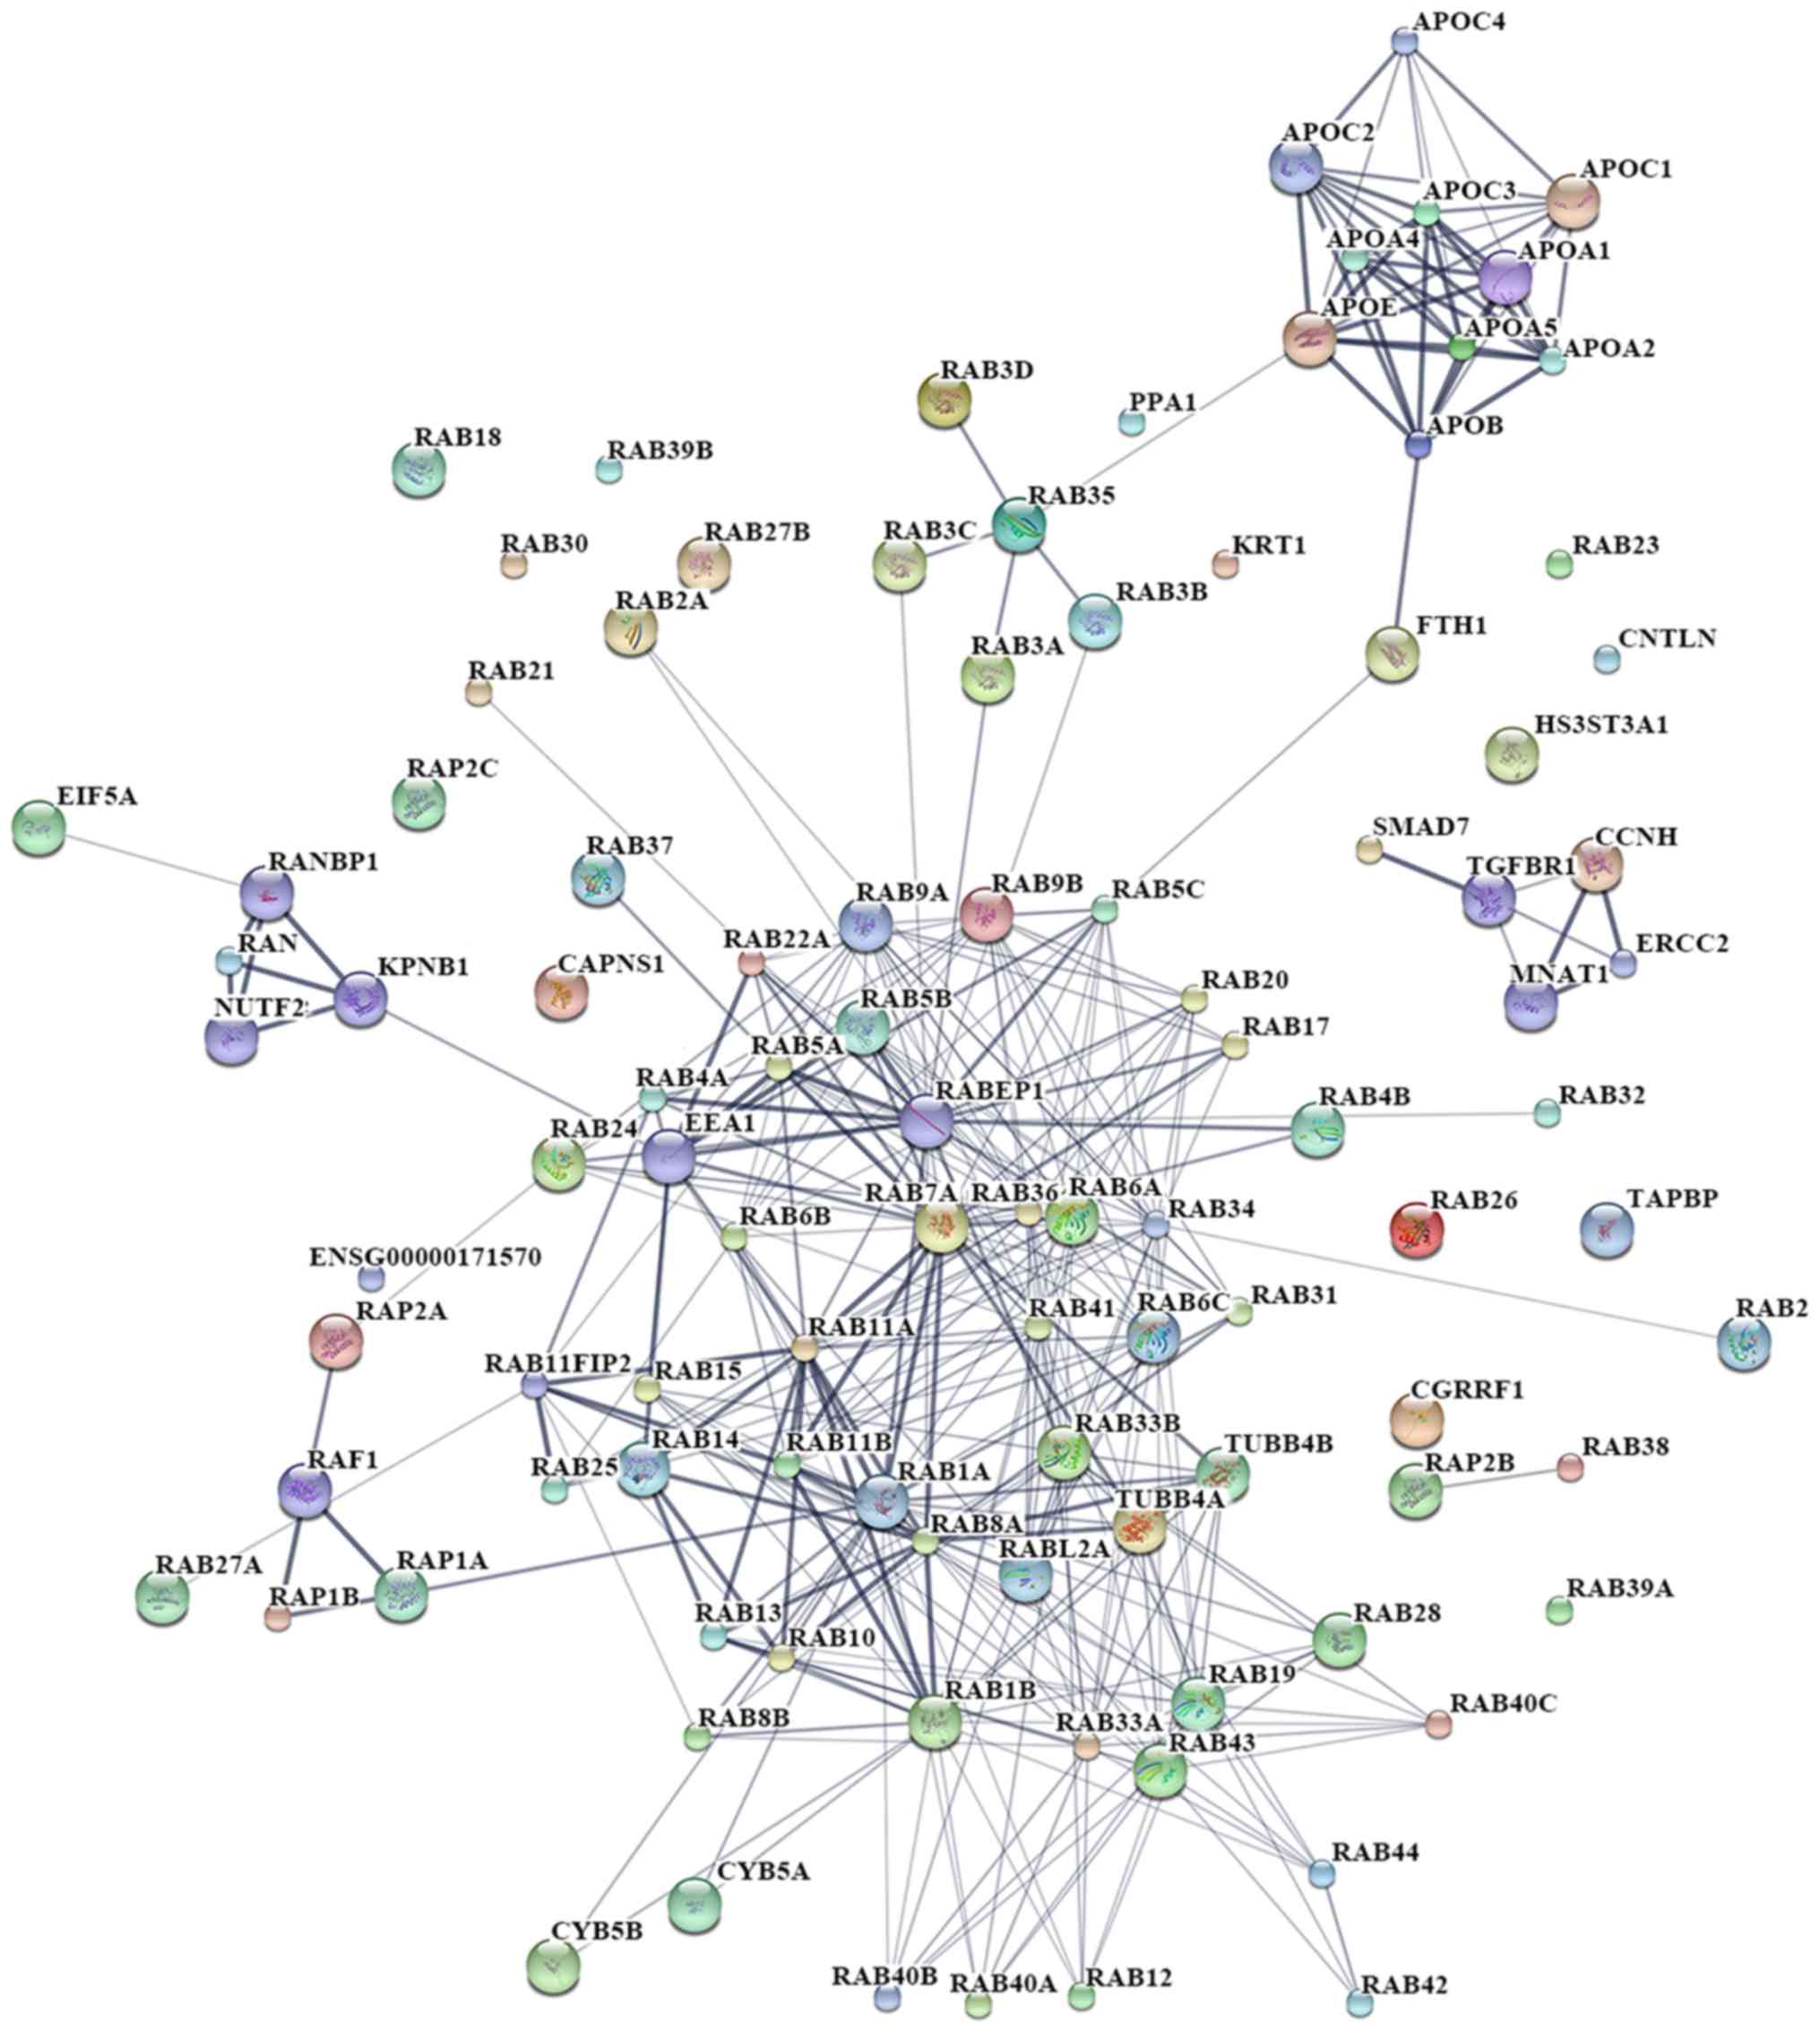
Pathway analysis reveals the
interaction of regulated proteins
Pathway analysis of the differentially expressed
proteins in the CS/HCS and AT/HCT groups was performed using the
STITCH database, and the protein-protein network is presented in
Figs. 5 and S2; the network was not generated
separately for the proteins identified in the CS/HCS groups and the
AT/HCT groups. The network indicates a strong interaction among
members of the RAS oncogene family and the APO family, the
expression of which had been detected in HCC tissue (Fig. S2). Additionally, an association
was revealed between these two families via the proteins ferritin
heavy polypeptide 1 (FTH1) and RAB35.
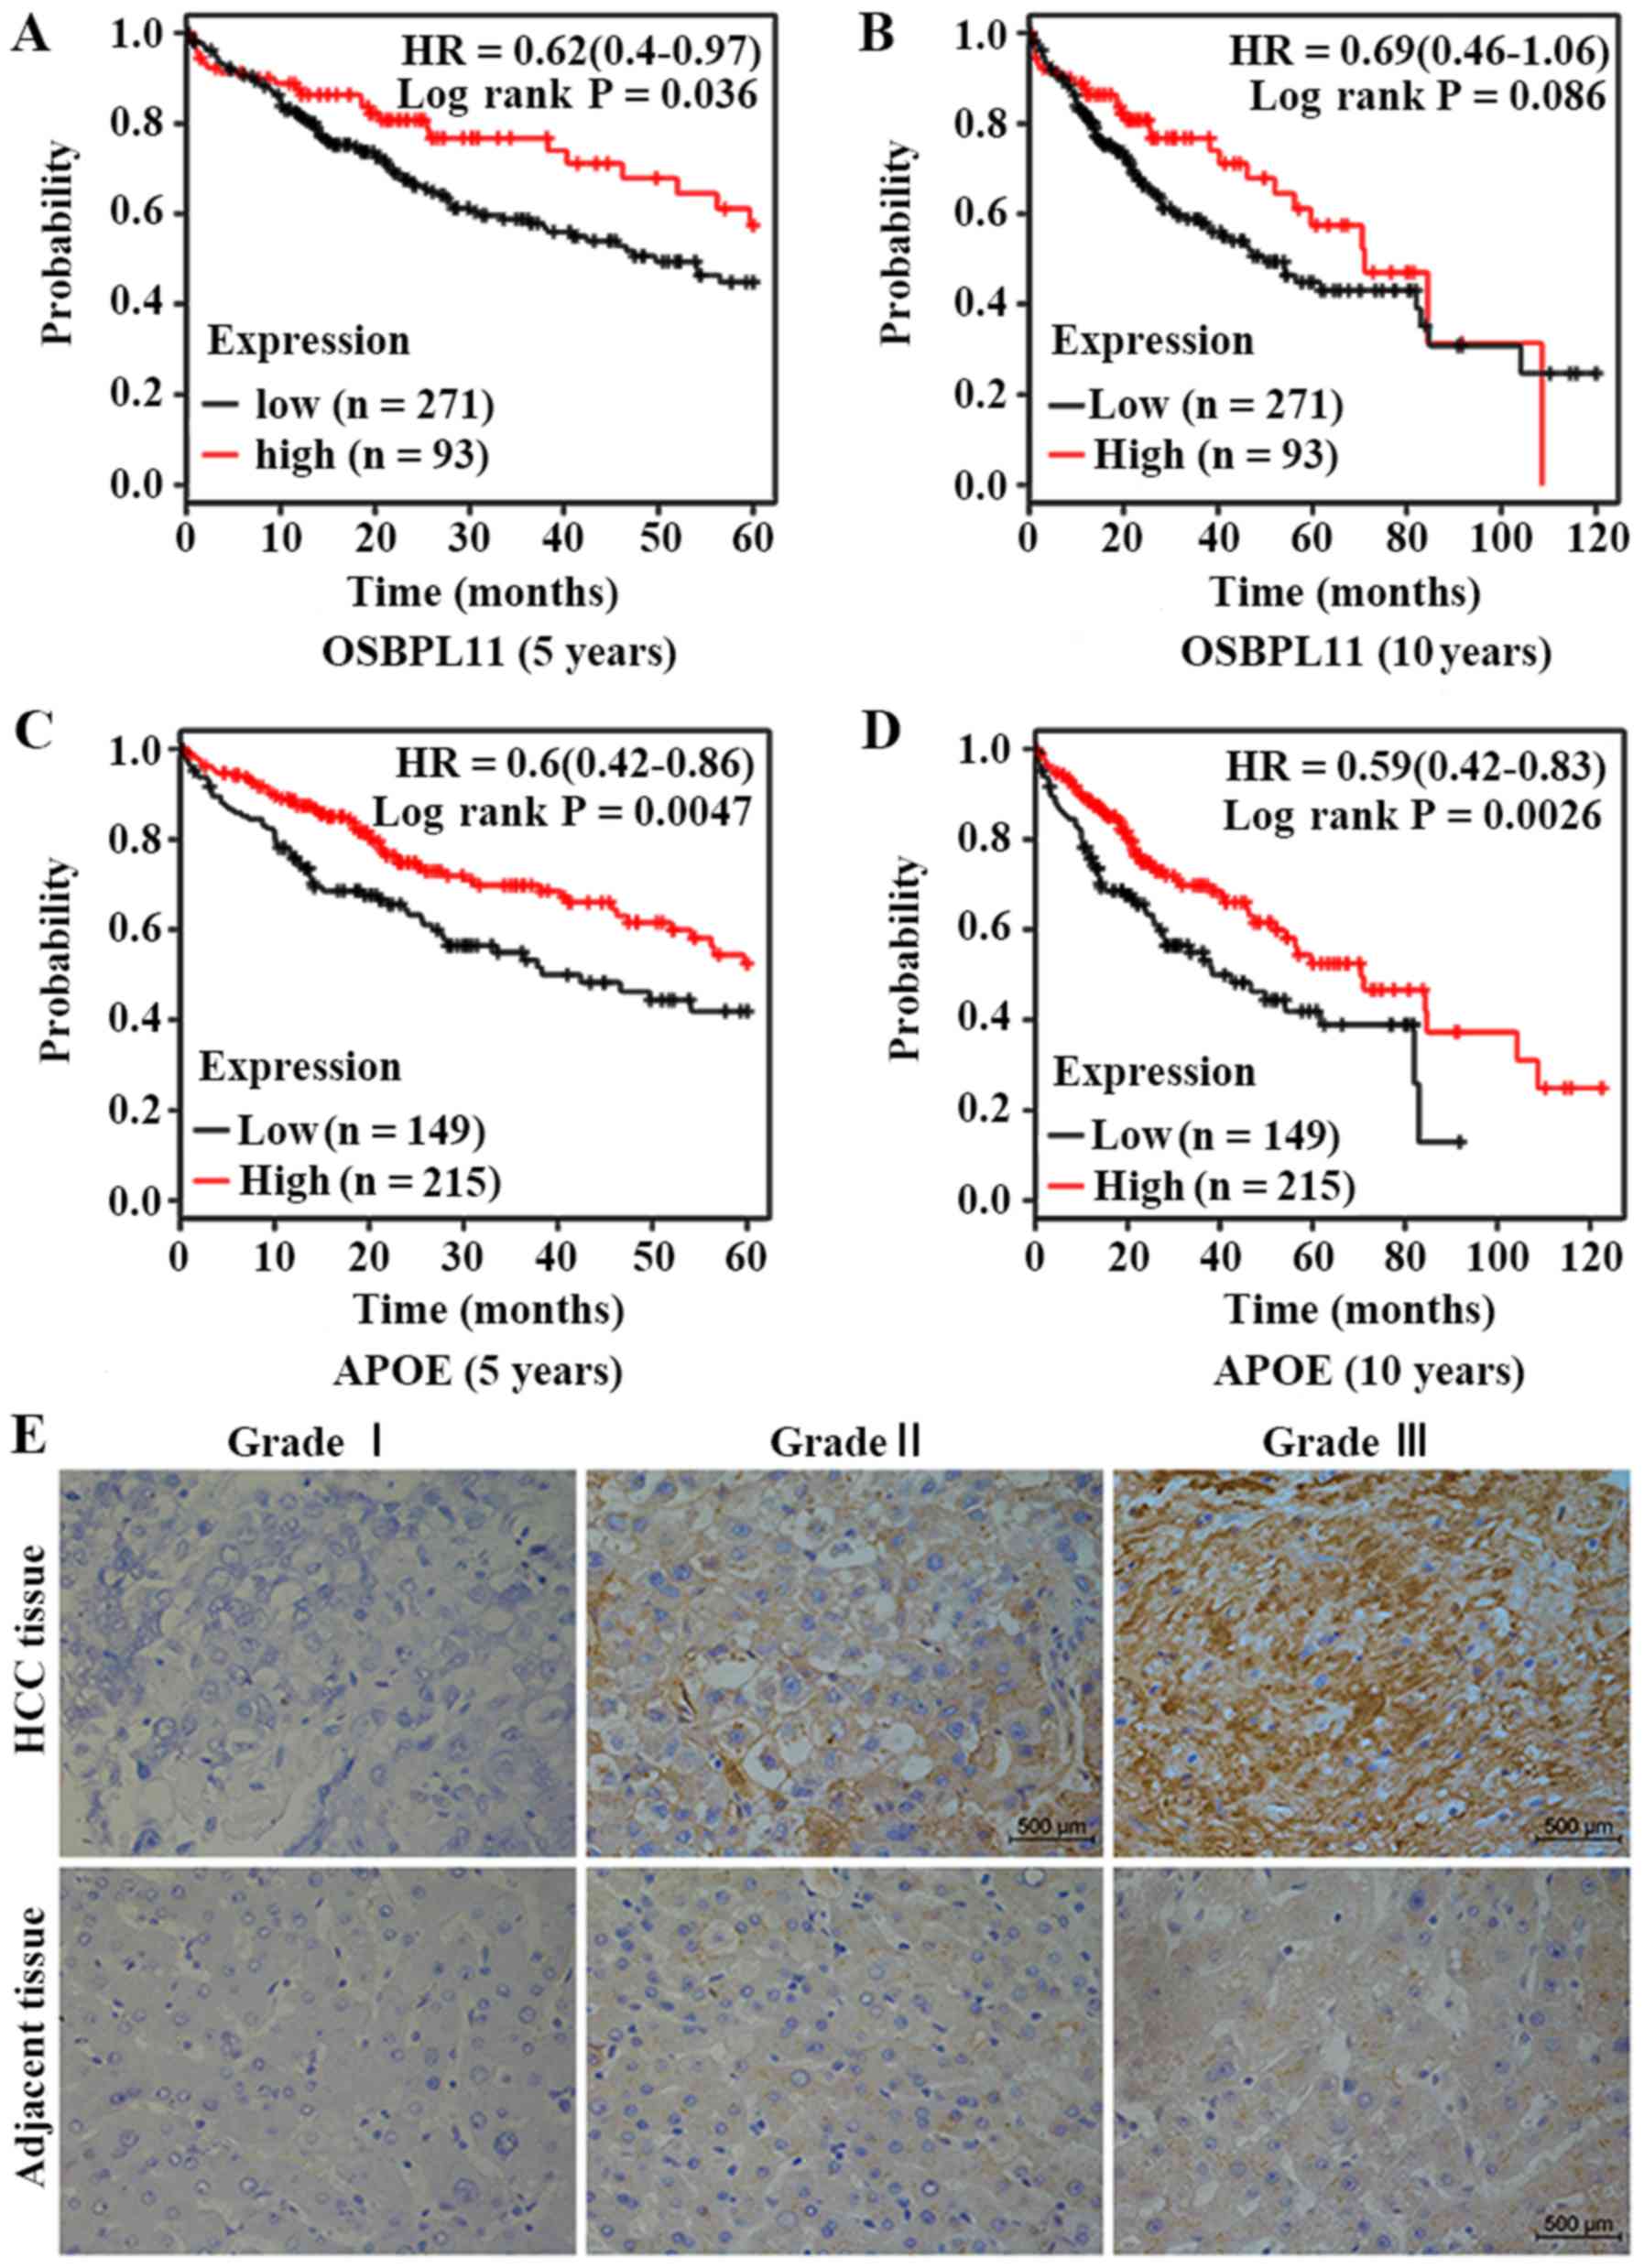
Survival analysis and IHC
The differentially expressed proteins OSBPL11 and
APOE, detected by 2-DE, were selected to evaluate their association
with survival in liver cancer (Fig.
6). Compared with a low expression level, it was revealed that
high expression of OSBPL11 was associated with a higher survival
probability in liver cancer. A significant difference (P=0.036) was
identified in the 5-year survival rate for liver cancer cases with
high OSBPL11 expression compared with low expression (Fig. 6A). However, no significant
difference was identified for the 10-year survival rate (Fig. 6B). Furthermore, the survival rate
for patients with liver cancer with a high APOE expression level
was higher compared with patients with a low APOE expression level.
A significant difference was identified in the 5-year survival rate
(P=0.0047; Fig. 6C) and the
10-year survival rate (P=0.0026; Fig.
6D) for patients with liver cancer with a high APOE expression
level compared with patients with a low APOE expression level.
The results of IHC staining to detect APOE
expression in HCC and adjacent tissues of different liver cancer
grades are presented in Fig. 6E.
The expression of APOE was higher in HCC tissues compared with
corresponding adjacent tissues in samples obatined from patients
with grade I–III liver cancer. Additonally, the expression level of
APOE increased with increasing tumor grade, both in HCC tissues and
adjacent tissue samples.
Discussion
Among all biological samples, the human serum
proteome is the largest representative of the total human proteome.
HAPs, including human serum albumin, account for >75% of all
proteins present in the serum and limit the resolution of MS
analysis. The most common technique used for the removal of HAPs
from serum samples is chromatography (11). However, potential biomarkers bound
to HAPs may be removed during methods involving chromatography,
including ion-exchange and affinity approaches (6,12).
If depletion of HAPs from crude serum samples is not performed, a
number of indicators may remain in the sample, which could assist
with the detection of useful protein markers. It has been reported
that fragmentation of low molecular weight proteins in white blood
cells can be performed by incubation with lysis buffer followed by
constant-filled gel electrophoresis (13), which indicates that lysis buffer
may serve an important role in improving the resolution of proteins
separated from human serum samples with 2-DE. The lysis buffer used
in the present study was able to disperse the interaction between
LAPs and HAPs to improve the protein resolution in the gel. In
addition, the lysis buffer allowed a number of LAPs to remain in
the sample, which assisted with the identification of their
physiological functions.
According to the present results, the differentially
expressed proteins were identified as HS3ST3A1, tubulin βD,
apolipoprotein A-D, the RAS oncogene family, 60S acidic ribosomal
protein P0, OSBPL11 and cyclin H. HS3ST3A1 serves an important role
in vascular homeostasis, and low mRNA expression levels of HS3ST3A1
have been identified in pre-eclamptic placental tissue (14). The current results demonstrated
that the protein expression level of HS3ST3A1 was upregulated in
serum samples obtained from patients with HCC, which indicates that
this protein may serve a role in liver tumor vascular-associated
processes.
Tubulin, a structural protein, is the target of
certain antimitotic drugs, including peloruside, laulimalide and
noscapine (15). In the present
study, tubulin βD protein was upregulated in the serum of patients
with HCC. It could be suggested this increased expression of
tubulin βD protein may provide support for cancer cell
division.
A high expression level of apolipoprotein-D has been
detected in high-grade prostatic intraepithelial neoplasia and
prostate cancer, but not in non-malignant epithelial cells. This
suggests that apolipoprotein-D may be a marker of malignant
transformation in the prostate (16). In addition, apolipoprotein family
members have been demonstrated to serve important roles in lipid
transport and metabolism process. Abnormal hepatic fat metabolism
can be a precursor of HCC. This may explain why the expression
level of apolipoprotein was significantly different in serum
samples obtained from patients with HCC in the current study.
The RAS family has been demonstrated to serve key
roles in malignant transformation in numerous types of cancer
(17). The current study revealed
an increased expression level of RAS in serum, which is easily
detected.
The ribosomal acidic P0 protein is an essential
component of the eukaryotic ribosomal stalk, and P0 protein
overexpression may cause tumorigenesis in breast and liver tissues
(18). However, in the serum of
patients with HCC, the protein expression of 60S acidic ribosomal
P0 was downregulated, and the gene expression in HCC tissue samples
was downregulated in nine out of 10 cases. However, the roles of
60S acidic ribosomal P0 protein and other ribosomal acidic P0
proteins may differ among multiple tumors.
The OSBP-associated protein family has been reported
to serve a role in lipid metabolism, cell signaling and vesicle
transport in cells (19). OSBPL11
likely serves a role during the late stages of adipogenic
differentiation and possibly in the maintenance of the mature
adipocyte phenotype (20). In the
present study, the expression level of OSBPL11 was lower in the
serum of patients with HCC compared with that in healthy controls.
In addition, the mRNA expression level was lower in tumor tissue
samples compared with adjacent tissue samples. Survival analysis
demonstrated that the expression level of OSBPL11 in liver cancer
was associated with the 5-year survival rate, but not the 10-year
survival rate. This may be associated with the function of the
OSBP-associated protein family, members of which are high-capacity
platforms for the inter-organelle exchange of small molecules and
information (21); alternatively,
the OSBP-related proteins could execute multifaceted functions in
sterol and sphingolipid homeostasis, post-Golgi vesicle transport,
and phosphatidylinositol-4-phosphate and target of rapamycin
complex 1 signaling (22). More
experimental verification is required. Blood count parameters (e.g.
α-fetoprotein and protein induced by vitamin K absence or
antagonist-II) were not obtained in the present study. The
OSBP-related protein family could be involved in lipid metabolism,
cell signaling and vesicle transport in cells, and OSBPL11 likely
plays a role during the late stages of differentiation and possibly
in the maintenance of the mature adipocyte phenotype (19,20).
Therefore, it was hypothesized that OSBPL11 may have an important
relationship with HCC, and the high expression of OSBPL11 in liver
cancer may serve an important role in the early stages of patient
survival, although this needs further research to confirm.
Using IHC and RT-qPCR, cyclin H has been
demonstrated to be overexpressed in 219 tumor samples, and was
revealed to interact with p53, cyclin-dependent kinase 7 and MNAT1
component of CDK activating kinase (23). However, in the present study, the
expression level of cyclin H was downregulated in HCC serum
samples. The reason for this difference between serum and tissue
samples remains unclear.
A number of differentially expressed proteins were
identified in HCC tissues compared with adjacent tissues.
Eukaryotic translation initiation factor Eif5a (EIF5A), a
translation factor, has functions in both initiation and
elongation, and serves a role in the regulation of cell
proliferation and apoptosis. An increased expression level of EIF5A
has been demonstrated to be a cancer biomarker and is associated
with a poor prognosis in a number of cancer types (24,25).
However, the current results demonstrated that EIF5A was
downregulated in HCC tissues compared with adjacent tissues. The
proliferation and apoptosis of HCC cells in the present study were
not evaluated; therefore, the association between the EIFA
expression level and the cellular conditions could not be
evaluated.
The cytochrome b5 (Cyb5) expression level is an
important determinant of in vivo drug responses, including
currently prescribed anticancer agents (26). Differences in Cyb5 expression could
be a significant determinant of the rates of drug disposition in
humans (27). The differential
expression level of Cyb5 protein in tumor tissues might be
associated with anticancer drug treatment, which was not taken into
account during sample collection.
Tumor cells of different molecular subtypes can be
characterized by changes in the balance of intracellular ions and
certain associations; ferritin can serve an important role in this
process (28). It has been
demonstrated that increased iron in breast cancer cells caused by
upregulation of ferritin expression could protect the cells from
natural killer cell-mediated cytolysis (29). In the present study, FTH1 was
detected at a lower level in HCC tissues compared with adjacent
tissues, indicating that the process of iron metabolism changes in
cancer cells.
Calpain small subunit 1 had been identified to
contribute to HCC growth and metastasis. The expression level of
calpain small subunit 1 has been revealed to be higher in highly
metastatic HCC cell lines and in HCC tumor tissues compared with
healthy tissues (30); the present
results were consistent with this previous study. In the current
study, calpain small subunit 1 was upregulated in HCC tissues
compared with the corresponding adjacent tissue, suggesting that
the HCC cells were rapidly growing and metabolizing.
A significantly lower protein expression level of
14-3-3ε has been revealed in gastric cancer tissue samples compared
with matched non-neoplastic tissue. The reduced levels of 14-3-3ε
may have a role in gastric carcinogenesis (31). In the present study, the protein
and gene expression levels of 14-3-3ε were significantly higher in
HCC tissue samples compared with adjacent tissue samples, which
indicates that the regulation of metabolism is different in HCC
compared with other cancer types.
Inorganic pyrophosphatase is an enzyme that had been
identified to be upregulated in various types of tumors, and
overexpression of pyrophosphatase has been observed in cancers of
the esophagus, stomach and pancreaticobiliary system (32). The current results demonstrated
that the protein and gene expression levels of pyrophosphatase were
significantly upregulated in HCC tissues compared with adjacent
tissues.
The upregulation of keratin 1 has been revealed to
increase drug resistance in nasopharyngeal carcinoma cell lines. In
addition, the protein expression level and activity level of
keratin 1 are higher in cisplatin-resistant nasopharyngeal
carcinoma cell lines compared with their parental cell lines
(33). The current study revealed
that keratin 1 was upregulated in HCC tissues, which may be
associated with drug resistance.
Centlein is a microtubule-associated protein that
can directly bind to purified microtubules via its longest
coiled-coil domain (34). The
differential protein and gene expression levels of centlein in
cancer tissues compared with adjacent tissues may be caused by the
microtubule proteins.
Apolipoproteins are protein constituents of
lipoproteins that transport cholesterol and fat, and are central to
cardiovascular health and disease. APOE overexpression can promote
cancer cell proliferation and migration. Additionally, APOE
overexpression may also contribute to an aggressive clinical course
in patients with lung adenocarcinoma and malignant pleural
effusions (35). In the present
study, a number of apolipoprotein family members were identified to
be differentially expressed in HCC serum samples compared with
healthy controls. This suggests that the apolipoprotein family is
closely associated with HCC. The survival analysis and IHC results
indicate that the expression of APOE serves an important role in
liver cancer development.
Tapasin is an essential adapter protein that
recruits major histocompatibility complex I (MHCI) molecules for
antigen processing and catalyzes peptides during loading of MHCI
(36); however, to the best of our
knowledge, no studies have investigated tapaisn-ERP57 in any cancer
type. In the current study, tapasin-ERP57 protein expression was
different in HCC tissues compared with corresponding adjacent
tissue. Therefore, tapasin-ERP57 may serve a role in the
tumor-associated immune process in HCC.
With the development of bioinformatics, numerous
bioinformatics databases and software programs have been used to
predict protein-protein and protein-chemical interactions. STITCH
is a resource that can predict interactions of proteins and
chemicals using evidence obtained from studies, databases and the
literature. STITCH contains the interactions of >2.5 million
proteins in 630 organisms, and has been used in a number of studies
(9). The present study generated a
protein-protein network of the differentially expressed proteins in
HCC serum and tissue samples, which revealed an association between
the apolipoprotein family and the RAS protein family in HCC, which,
to the best of our knowledge, has not previously been reported.
A number of studies have used chromatography of
crude serum samples following the removal of HAPs to identify
biomarkers that may be useful for the diagnosis of cancer. However,
numerous potential biomarkers bound to HAPs may be filtered out of
the sample by this approach. In the current study, serum 2-DE was
performed without HAP removal and the serum proteins were then
effectively separated. To identify protein biomarkers, serum
samples were obtained from patients with HCC and healthy controls,
and HCC tissues samples and corresponding adjacent tissue samples
were collected. Differential expression levels of apolipoprotein
family members were detected in both the serum samples and tissue
samples, indicating that apolipoprotein proteins, particularly
APOE, are important in HCC. Furthermore, the expression levels of
OSBPL11 appeared to have an important role in HCC. The roles of the
RAS protein family and apolipoprotein family should also be
considered in the development of HCC.
Supplementary Material
Supporting Data
Acknowledgements
Not applicable.
Funding
The present study was funded by grants from the
National Natural Scientific Foundation of China (grant nos.
81370048 and 30870515), the Natural Science Foundation of Fujian
Province (grant nos. 2016J01631 and 2016-ZQN-88) and the Key
Projects for Technology Plan of Xiamen Province in China (grant no.
3502Z20174076).
Availability of data and materials
The datasets used and/or analyzed during the current
study are available from the corresponding author on reasonable
request.
Authors' contributions
HZ and HH conceived and designed the research. HP,
ZY, XZ and SZ developed the methodology. HP, XZ and HJ analyzed and
scored the data. ZY and SZ provided administrative, technical and
material support. HP and HJ wrote and reviewed the manuscript. HZ
and HH supervised this study. All authors read and approved the
manuscript and agree to be accountable for all aspects of the
research in ensuring that the accuracy or integrity of any part of
the work are appropriately investigated and resolved.
Ethics approval and consent to
participate
The current study was approved by the Ethics
Committee of Zhongshan Hospital. Individuals provided informed
consent to participate in the study, according the requirements of
the Ethics Committee of Zhongshan Hospital.
Patient consent for publication
Not applicable.
Competing interests
The authors declare that they have no competing
interests.
References
|
1
|
Li S, Yang F and Ren X: Immunotherapy for
hepatocellular carcinoma. Drug Discov Ther. 9:363–371. 2015.
View Article : Google Scholar : PubMed/NCBI
|
|
2
|
McGlynn KA, Petrick JL and London WT:
Global epidemiology of hepatocellular carcinoma: An emphasis on
demographic and regional variability. Clin Liver Dis. 19:223–238.
2015. View Article : Google Scholar : PubMed/NCBI
|
|
3
|
Torre LA, Bray F, Siegel R, Ferlay J,
Lortet-Tieulent J and Jemal A: Global cancer statistics, 2012. CA
Cancer J Clin. 65:87–108. 2015. View Article : Google Scholar : PubMed/NCBI
|
|
4
|
Han L, Lv Y, Guo H, Ruan Z and Nan K:
Implications of biomarkers in human hepatocellular carcinoma
pathogenesis and therapy. World J Gastroenterol. 20:10249–10261.
2014. View Article : Google Scholar : PubMed/NCBI
|
|
5
|
Ray S, Patel SK, Kumar V, Damahe J and
Srivastava S: Differential expression of serum/plasma proteins in
various infectious diseases: Specific or nonspecific signatures.
Proteomics Clin Appl. 8:53–72. 2014. View Article : Google Scholar : PubMed/NCBI
|
|
6
|
Chromy BA, Gonzales AD, Perkins J, Choi
MW, Corzett MH, Chang BC, Corzett CH and McCutchen-Maloney SL:
Proteomic analysis of human serum by two-dimensional differential
gel electrophoresis after depletion of high-abundant proteins. J
Proteome Res. 3:1120–1127. 2014. View Article : Google Scholar
|
|
7
|
Sano S, Tagami S, Hashimoto Y,
Yoshizawa-Kumagaye K, Tsunemi M, Okochi M and Tomonaga T: Absolute
quantitation of low abundance plasma APL1β peptides at sub-fmol/mL
Level by SRM/MRM without immunoaffinity enrichment. J Proteome Res.
13:1012–1020. 2014. View Article : Google Scholar : PubMed/NCBI
|
|
8
|
Xu S, Liu P, Lu X, Zhang J, Huang L, Hua
W, He D and Ouyang J: A highly sensitive ‘turn-on’ fluorescent
sensor for the detection of human serum proteins based on the size
exclusion of the polyacrylamide gel. Electrophoresis. 35:546–553.
2014. View Article : Google Scholar : PubMed/NCBI
|
|
9
|
Luo LZ, Jin HW and Huang HQ:
Transferrin-cisplatin specifically deliver cisplatin to HepG2 cells
in vitro and enhance cisplatin cytotoxicity. J Proteomics.
77:237–250. 2012. View Article : Google Scholar : PubMed/NCBI
|
|
10
|
Livak KJ and Schmittgen TD: Analysis of
relative gene expression data using real-time quantitative PCR and
the 2(-Delta Delta C(T)) method. Methods. 25:402–408. 2001.
View Article : Google Scholar : PubMed/NCBI
|
|
11
|
Liu W, Liu B, Cai Q, Li J, Chen X and Zhu
Z: Proteomic identification of serum biomarkers for gastric cancer
using multi-dimensional liquid chromatography and 2D differential
gel electrophoresis. Clin Chim Acta. 413:1098–1106. 2012.
View Article : Google Scholar : PubMed/NCBI
|
|
12
|
Qin S, Ferdinand AS, Richie JP, O'Leary
MP, Mok SC and Liu BC: Chromatofocusing fractionation and
two-dimensional difference gel electrophoresis for low abundance
serum proteins. Proteomics. 5:3183–3192. 2005. View Article : Google Scholar : PubMed/NCBI
|
|
13
|
Chen YY, Lin SY, Yeh YY, Hsiao HH, Wu CY,
Chen ST and Wang AH: A modified protein precipitation procedure for
efficient removal of albumin from serum. Electrophoresis.
26:2117–2127. 2005. View Article : Google Scholar : PubMed/NCBI
|
|
14
|
Amraoui F, Hassani Lahsinoui H, Boussata
S, Keijser R, Veenboer GJ, Middeldorp S, van der Post JA,
Ris-Stalpers C, Afink GB and van den Born BJ: Placental expression
of heparan sulfate 3-O-sulfotransferase-3A1 in normotensive and
pre-eclamptic pregnancies. Placenta. 36:1218–1224. 2015. View Article : Google Scholar : PubMed/NCBI
|
|
15
|
Gajewski MM, Alisaraie L and Tuszynski JA:
Peloruside, laulimalide, and noscapine interactions with
beta-tubulin. Pharm Res. 29:2985–2993. 2012. View Article : Google Scholar : PubMed/NCBI
|
|
16
|
Hall RE, Horsfall DJ, Stahl J,
Vivekanandan S, Ricciardelli C, Stapleton AM, Scardino PT, Neufing
P and Tilley WD: Apolipoprotein-D: A novel cellular marker for
HGPIN and prostate cancer. Prostate. 58:103–108. 2004. View Article : Google Scholar : PubMed/NCBI
|
|
17
|
Lau KS and Haigis KM: Non-redundancy
within the RAS oncogene family: Insights into mutational
disparities in cancer. Mol Cells. 28:315–320. 2009. View Article : Google Scholar : PubMed/NCBI
|
|
18
|
Chang TW, Chen CC, Chen KY, Su JH, Chang
JH and Chang MC: Ribosomal phosphoprotein P0 interacts with GCIP
and overexpression of P0 is associated with cellular proliferation
in breast and liver carcinoma cells. Oncogene. 27:332–338. 2008.
View Article : Google Scholar : PubMed/NCBI
|
|
19
|
Weber-Boyvat M, Zhong W, Yan D and
Olkkonen VM: Oxysterol-binding proteins: Functions in cell
regulation beyond lipid metabolism. Biochem Pharmacol. 86:89–95.
2013. View Article : Google Scholar : PubMed/NCBI
|
|
20
|
Olkkonen VM and Levine TP: Oxysterol
binding proteins: In more than one place at one time? Biochem Cell
Biol. 82:87–98. 2004. View
Article : Google Scholar : PubMed/NCBI
|
|
21
|
Olkkonen VM: OSBP-related protein family
in lipid transport over membrane contact sites. Lipid Insights. 8
(Suppl 1):S1–S9. 2015.
|
|
22
|
Olkkonen VM and Li S: Oxysterol-binding
proteins: Sterol and phosphoinositide sensors coordinating
transport, signaling and metabolism. Prog Lipid Res. 52:529–538.
2013. View Article : Google Scholar : PubMed/NCBI
|
|
23
|
Bondi J, Husdal A, Bukholm G, Nesland JM,
Bakka A and Bukholm IR: Expression and gene amplification of
primary (A, B1, D1, D3, and E) and secondary (C and H) cyclins in
colon adenocarcinomas and correlation with patient outcome. J Clin
Pathol. 58:509–514. 2005. View Article : Google Scholar : PubMed/NCBI
|
|
24
|
Caraglia M, Park MH, Wolff EC, Marra M and
Abbruzzese A: eIF5A isoforms and cancer: Two brothers for two
functions? Amino Acids. 44:103–109. 2013. View Article : Google Scholar : PubMed/NCBI
|
|
25
|
Mathews MB and Hershey JW: The translation
factor eIF5A and human cancer. Biochim Biophys Acta. 1849:836–844.
2015. View Article : Google Scholar : PubMed/NCBI
|
|
26
|
Stiborová M, Indra R, Frei E, Kopečková K,
Schmeiser HH, Eckschlager T, Adam V, Heger Z, Arlt VM and Martínek
V: Cytochrome b5 plays a dual role in the reaction cycle of
cytochrome P450 3A4 during oxidation of the anticancer drug
ellipticine. Monatshefte Fur Chemie. 148:1983–1991. 2017.
View Article : Google Scholar : PubMed/NCBI
|
|
27
|
Henderson CJ, McLaughlin LA, Finn RD,
Ronseaux S, Kapelyukh Y and Wolf CR: A role for cytochrome b5 in
the in vivo disposition of anticancer and cytochrome P450 probe
drugs in mice. Drug Metab Dispos. 42:70–77. 2014. View Article : Google Scholar : PubMed/NCBI
|
|
28
|
Chekhun SV, Lukyanova NY, Shvets YV,
Burlaka AP and Buchinska LG: Significance of ferritin expression in
formation of malignant phenotype of human breast cancer cells. Exp
Oncol. 36:179–183. 2014.PubMed/NCBI
|
|
29
|
Jiang XP and Elliott RL: Decreased iron in
cancer cells and their microenvironment improves cytolysis of
breast cancer cells by natural killer cells. Anticancer Res.
37:2297–2305. 2007. View Article : Google Scholar
|
|
30
|
Dai Z, Zhou SL, Zhou ZJ, Bai DS, Xu XY, Fu
XT, Chen Q, Zhao YM, Zhu K, Yu L, et al: Capn4 contributes to
tumour growth and metastasis of hepatocellular carcinoma by
activation of the FAK-Src signalling pathways. J Pathol.
234:316–328. 2014. View Article : Google Scholar : PubMed/NCBI
|
|
31
|
Leal MF, Calcagno DQ, Demachki S,
Assumpcao PP, Chammas R, Burbano RR and Smith Mde A: Clinical
implication of 14-3-3 epsilon expression in gastric cancer. World J
Gastroenterol. 18:1531–1537. 2012. View Article : Google Scholar : PubMed/NCBI
|
|
32
|
Yang Y, Cai J, Yin J, Wang D, Bai Z, Zhang
J, Wang K, Yu G and Zhang Z: Inorganic pyrophosphatase (PPA1) is a
negative prognostic marker for human gastric cancer. Int J Clin Exp
Pathol. 8:12482–12490. 2015.PubMed/NCBI
|
|
33
|
Tang S, Huang W, Zhong M, Yin L, Jiang H,
Hou S, Gan P and Yuan Y: Identification Keratin 1 as a
cDDP-resistant protein in nasopharyngeal carcinoma cell lines. J
Proteomics. 75:2352–2360. 2012. View Article : Google Scholar : PubMed/NCBI
|
|
34
|
Jing Z, Yin H, Wang P, Gao J and Yuan L:
Centlein, a novel microtubule-associated protein stabilizing
microtubules and involved in neurite formation. Biochem Biophys Res
Commun. 472:360–365. 2016. View Article : Google Scholar : PubMed/NCBI
|
|
35
|
Su WP, Chen YT, Lai WW, Lin CC, Yan JJ and
Su WC: Apolipoprotein E expression promotes lung adenocarcinoma
proliferation and migration and as a potential survival marker in
lung cancer. Lung Cancer. 71:28–33. 2011. View Article : Google Scholar : PubMed/NCBI
|
|
36
|
Hulpke S, Baldauf C and Tampe R: Molecular
architecture of the MHC I peptide-loading complex: One tapasin
molecule is essential and sufficient for antigen processing. FASEB
J. 26:5071–5080. 2012. View Article : Google Scholar : PubMed/NCBI
|