Introduction
Esophageal cancer is ranked the sixth leading cause
of cancer mortalities worldwide (1).
China has a high incidence of esophageal cancer, with 50% of new
primary esophageal cancer patients being reported annually
(2). In addition, 70% of patients
were diagnosed at advanced stage. The patients primarily underwent
radio- and chemotherapy where surgery was not a feasible option. FD
regimen treatment is the combined use of cisplatin (DDP) and
5-fluorouracil (5-FU) and constitutes the standard regimen for
patients with advanced esophageal cell cancer (3). However, the partial remission rate is
<40% (4,5). Identification of new drugs to increase
the curative effect of chemotherapy is therefore crucial.
Epidermal growth factor receptor (EGFR) is a member
of the tyrosine kinase growth factor receptor family (6). Epidermal growth factor is overexpressed
in many tumors. The overexpression of epidermal growth factor is
associated with the genesis, metastasis, and poor prognosis of the
tumor. EGFR inhibitor nimotuzumab (h-R3) has been shown to be
effective in patients with non-small-cell lung cancer, colon cancer
or head and neck cancer (7,8). The results of related investigations on
esophageal cancer demonstrate that h-R3 can increase the
sensitivity of radiotherapy for esophageal carcinoma patients and
increase the chemotherapy sensitivity of paclitaxel (9).
Another common scheme of FD for esophageal carcinoma
was used in the present study to determine whether there are
universal sensitization effects of h-R3 on chemotherapy drugs.
Investigation on two cell types with different expression levels of
EGFR was also performed to examine the correlation between the h-R3
effect and the expression level of EGFR.
Materials and methods
Cell culture
Human EC1 and EC9706 esophageal squamous cell
carcinoma cells were provided by the Cancer Retroviral Molecular
Biology Laboratory, Xinxiang Medical University (Xinxiang, China).
The experimental h-R3 drug was a gift from Baitai Biological
Pharmaceutical Co., Ltd. (Beijing, China). The cells were cultured
in RPMI-1640 medium containing 10% (v/v) FBS, 100 U/ml penicillin
and 100 g/ml of streptomycin in an incubator at 37°C with 5%
CO2. The medium was changed every 24 h and the cells
were passaged every 48 h. The primary reagents were: DDP (Yunnan
Biological Valley Breviscapin Pharmaceutical Co., Ltd., Yunnan,
China), h-R3 (Baitai Biological Pharmaceutical Co., Ltd.), MTT
assay (Beijing Xinjingke Biotechnology Co., Ltd., Beijing, China),
apoptosis kit (Haimen City Pik Natural Technology Research
Institute, Haimen, China) and TUNEL assay (Roche Diagnostics GmbH,
Mannheim, Germany).
Detection of the expression of EGFR by
immunohistochemical analysis
EC1 and EC9706 cells in the logarithmic growth phase
were digested with trypsin after the cells were counted. The cells
were suspended on a slide and then seeded at a concentration of
0.01 mol/l. PBS (0.01 mol/l) was applied in and around the slide to
prevent liquid evaporation. Approximately 3%
H2O2 was used to eliminate the peroxidase
after 24 h. Antigen retrieval was achieved using a microwave oven.
Goat serum was used for blocking. The primary antibody (rabbit,
1:50, ab2430, Abcam, Cambridge, UK) dilution was incubated
overnight at 4°C. The secondary antibody (goat, 1:500, ab97051,
Abcam) was added and stained with DAB. Cell membrane expressions of
EGFR in the two groups were observed under a microscope (IE 2000U
Nikon Corporation, Tokyo, Japan). Nuclear staining was considered
as positive for EGFR. The intensity of the staining was scored as:
(+), (++), (+++) scores with 1–25%, 25–50% and >50% cells
showing positive staining, respectively.
Detection of the inhibitory effect of
MTT assay on esophageal carcinoma cells
The cells were divided into the control, h-R3, DDP,
5-FU groups, as well as h-R3 combined with DDP group, and h-R3
combined with 5-FU group. EC1 cells in the logarithmic growth phase
were digested and centrifuged for cell counting. The cells were
seeded in a 96-well plate at a density of 5×10³ cells
and 100 µl of medium (DMEM) was placed in each well and cultured at
37°C with 5% CO2 for 24 h. Different doses of the drug
were added in each group. The concentration of a single use of h-R3
was 12.5, 25, 50, 100, 200 and 400 µg/ml, respectively; while that
of DDP was 0.25, 0.5, 1, 1.5, 2 and 2.5 µg/ml, respectively; and
5-FU was 0.5, 1, 2, 4, 6 and 8 µg/ml, respectively. The blank group
was added without any drug.
The cells were cultured for 48 h. Subsequently, 20
µl MTT (5 mg/ml) assay was applied and the cells were inoculated at
37°C for 4 h. The medium was removed, washed with PBS, and DMSO was
added prior to 10-min agitation. The optical density (OD) value for
each well was detected using an enzyme-linked immune monitor at the
wavelength of 492 nm, and the results were recorded. The
experiments were conducted with six parallel wells, repeated three
times, and an average was applied.
The cell growth inhibition rate (%) was calculated
as: 1 (the OD value of experimental group/control group) × 100%.
The 30% inhibitive concentration (IC30) of the drug combination of
the DDP and 5-FU was calculated according to the concentration
curve. It was used for the drug concentration of the combined drug
therapy. The h-R3 concentration in the combined drug therapy was
100 µg/ml. Given that the drug concentration was the abscissa axis
and the cell inhibition rate the vertical axis, the drug
concentration cell inhibition rate curve with the experimental
results was drawn.
The cytotoxicity induced by the two drugs combined
with application of Jin's formula was calculated. The interaction
index was shown as q, and the formula used was: q=E(AB)/[EA+(1-EA)
× EB], where E(AB) was the growth inhibition rate of the combined
use of the two drugs. EA and EB were the growth inhibition rate of
the single use of the drug. If the q-value was in the range of
0.85–1.15, it indicated that the effects of the two drug were
additive. A q-value of >1.15 indicated that the two drugs
exerted a cooperative effect. A q-value of <0.85 representing
the combination of the two drugs exerted an antagonistic
effect.
Detection of cell apoptosis using flow
cytometry
The cells in the logarithmic growth phase were
seeded in a 6-well plate at a density of 1×10⁵/ml and
were treated with 100 µg/ml h-R3, 0.5 µg/ml DDP, 1 µg/ml 5-FU, 100
µg/ml h-R3 combined with 0.5 µg/ml DDP, and 100 µg/ml h-R3 combined
with 1 µg/ml 5-FU, respectively, after 24 h. A corresponding volume
of culture medium was added to the control group, and the cells
were incubated at 37°C with 5% CO2 for 48 h. The cells
were collected and the supernatant was discarded. Subsequently, the
cells were washed with PBS, centrifuged at 800 × g for 5 min. The
supernatant was discarded and Annexin V-fluorescein isothiocyanate
(FITC) was added for cell suspension and incubated in the dark for
10 min at room temperature (25°C), followed by centrifugation at
800 × g for 5 min. The solution (fix liquid) was removed, Annexin
V-FITC was added for cell suspenstion, followed by the addition of
propidium iodide staining solution and mixing thereof. The cells
were placed in an ice bath for 5 min for staining in the dark and
the cell cycle was detected using flow cytometry.
Detection of cell apoptosis using the
TUNEL assay
Single cell suspension was prepared and cells were
seeded in the dish containing the slide at a density of
1×10⁵ cells/ml. Cell treatment was the same as for the
flow cytometry following adherence to the wall of the dish. After
48 h of culture, the slide was washed with PBS three times, and
fixed in 4% paraformaldehyde for 40 min, washed with PBS for 3×3
min, blocked at room temperature (25°C) for 10 min, and washed
again with PBS for 3×3 min. The slide was then placed at 4°C for 3
min and washed with PBS for 3×5 min, prior to 50 µl conversion
solution being added and reaction at 37°C in wet and dark
conditions for 30 min. The slide was again washed with PBS for 3×5
min, stained with DAB and observed under the microscope (IE 2000U
Nikon Corporation). After counterstaining with hematoxylin, the
cells were dehydrated in alcohol, cleared in H2O and
mounted with paraformaldehyde, and observed under the microscope
(IE 2000U Nikon Corporation). The proportion of apoptotic cells was
calculated. The nuclei of the apoptotic cells under the microscope
(magnification at ×400, IE 2000U Nikon Corporation) had a
precipitation of brown yellow granules, which was accumulated at
the nuclear periphery, while the nuclei of the non-apoptotic cells
were blue.
Statistical analysis
Statistical analysis was performed using the
Shapiro-Wilk advanced tests of normality, as well as homogeneity of
variance test, paired t-test, analysis of variance (normal
distribution and homogeneity of variance) or rank sum test. The
experimental data were presented as mean ± standard deviation. The
statistical software used to analyze the data was SPSS 17 (SPSS,
Inc., Chicago, IL, USA). The significance level was α=0.05.
Results
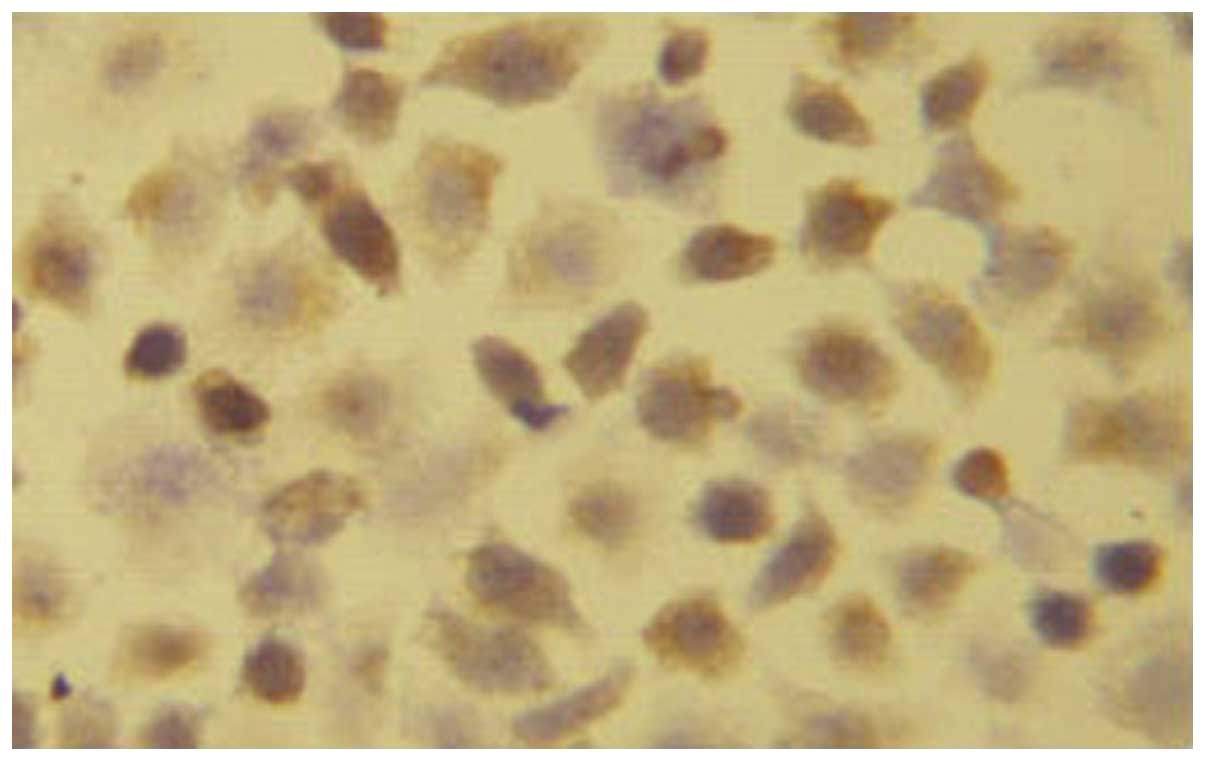
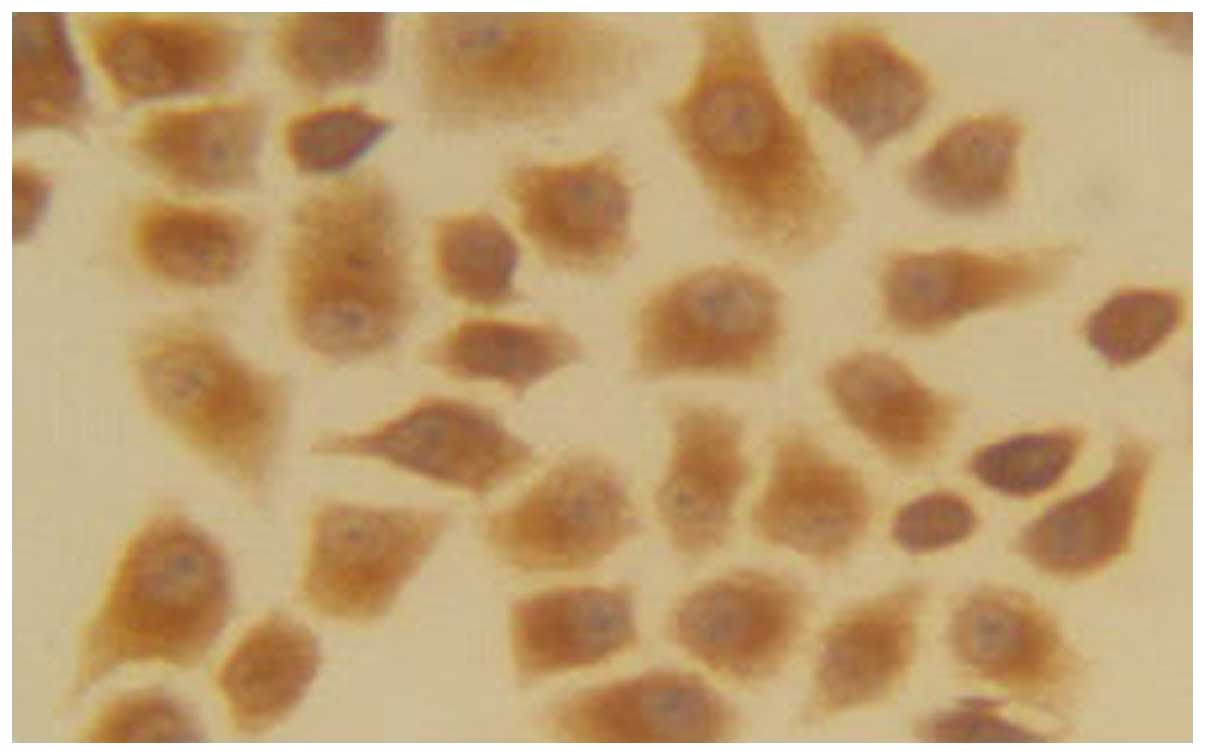
Immunohistochemistry
The EC1-positive cells were 22.45±2.54% (+),
suggesting that a low expression of EC1 cells in EGFR. The number
of EC9706-positive cells was 91.22±4.65% (+++), indicating that
EC9706 cells were highly expressed in EGFR (Figs.. 1 and 2).
Detection of the human esophageal
cancer cell growth inhibition of the combined drug treatment using
the MTT assay
Detection of the effect of different concentrations
of h-R3 on EC1 and EC9706 cells via the MTT assay showed no obvious
inhibitory action on the tumor cells after 48 h. The highest growth
inhibitory rate on EC1 cells in vitro was only 10% when the
single use of h-R3 concentration was ≤400 µg/ml. By contrast, the
highest growth inhibitory rate on EC9706 cells in vitro was
30%. A comparison of EC1 with EC9706 showed that the difference in
the growth inhibition rate between the two cell lines after h-R3
treatment was significant, while the latter effect was stronger
than the former (P<0.01) (Table
I).
 | Table I.Cell growth inhibition rate of
esophageal squamous carcinoma with different concentrations of h-R3
treatment alone (%, mean ± standard deviation, n=6). |
Table I.
Cell growth inhibition rate of
esophageal squamous carcinoma with different concentrations of h-R3
treatment alone (%, mean ± standard deviation, n=6).
|
| Reaction period, 48
h |
|---|
|
|
|
|---|
| Drug concentration,
µg/ml | EC1 | EC9706 |
|---|
| 12.5 | 1.15±0.04 | 3.01±0.11 |
| 25 | 5.12±0.48 | 10.24±1.23 |
| 50 | 8.83±0.75 | 17.20±0.98 |
| 100 | 9.09±0.48 | 26.57±3.34 |
| 200 | 9.34±0.72 | 27.84±2.42 |
| 400 | 10.10±0.58 | 27.35±1.95 |
DDP and 5-FU treatment of EC1 and EC9706 cells after
different concentrations identified a dose-dependent increase in
the inhibition rate. Cell growth inhibition rates following
treatment with different concentrations of DDP showed a
statistically significant difference (P<0.05). Cell growth
inhibition rates following treatment with different concentrations
of 5-FU showed a statistically significant difference at the same
time (P<0.05) (Tables II and
III). According to the gradient
changing curve of the relationship between the inhibitory rate of
cell growth and drug concentration, 30% IC30 of DDP on esophageal
EC1 and EC9706 carcinoma cells after 48 h treatment was 0.5 µg/ml.
Table II shows the corresponding
drug concentration when the cell inhibitory rate was 30%, was 0.5
µg/ml, which is in accordance with results calculated using the
equation. The IC30 of 5-FU treatment of esophageal EC1 and EC9706
carcinoma cells after 48 h was 1 µg/ml.
| Table II.Cell growth inhibition rate of
esophageal squamous carcinoma at different concentrations of DDP
treatment alone (%, mean ± standard deviation, n=6). |
Table II.
Cell growth inhibition rate of
esophageal squamous carcinoma at different concentrations of DDP
treatment alone (%, mean ± standard deviation, n=6).
|
| The 48-h drug
inhibition rate, % |
|---|
|
|
|
|---|
| The drug
concentration, µg/ml | EC1 | EC9706 |
|---|
| 0.25 | 18.44±1.77 | 20.26±2.79 |
| 0.5 | 36.04±2.68 | 36.49±4.60 |
| 1 | 49.52±3.49 | 52.62±5.24 |
| 1.5 | 71.31±4.43 | 74.83±5.34 |
| 2 | 83.29±6.38 | 84.79±2.09 |
| 2.5 | 90.37±7.72 | 92.21±6.86 |
| Table III.Cell growth inhibition rate of
esophageal squamous carcinoma at different concentrations of 5-FU
treatment alone (%, mean ± standard deviation, n=6). |
Table III.
Cell growth inhibition rate of
esophageal squamous carcinoma at different concentrations of 5-FU
treatment alone (%, mean ± standard deviation, n=6).
|
| The 48-h drug
inhibition rate, % |
|---|
|
|
|
|---|
| Drug concentration,
µg/ml | EC1 | EC9706 |
|---|
| 0.5 | 12.00±1.59 | 14.01±1.10 |
| 1 | 27.66±3.02 | 30.17±0.94 |
| 2 | 45.80±3.38 | 48.23±4.56 |
| 4 | 64.95±2.18 | 67.14±5.13 |
| 6 | 74.10±7.27 | 79.05±3.56 |
| 8 | 89.27±6.47 | 90.51±6.11 |
Cell growth inhibitory effect of the
combined treatment on human esophageal cancer
The h-R3, DDP and 5-FU drugs were used at
concentrations of 100 µg/ml, 0.5 µg/ml and 1 µg/ml, respectively,
with a reaction time of 48 h. The difference of the cell growth
inhibition rate between the use of h-R3 combined with the
chemotherapy drug and chemotherapy drug alone groups in the EC1
cells was not statistically significant following the treatment
with the given concentrations (P>0.05). By contrast, the
differences of the cell growth inhibition rate between the combined
use of the chemotherapy drug and chemotherapy drug alone groups
were statistically significant (P<0.01) (Table IV).
| Table IV.Cell growth inhibition rate of
esophageal squamous carcinoma with single or combined use of DDP
and/or 5-FU (%, mean ± standard deviation, n=6). |
Table IV.
Cell growth inhibition rate of
esophageal squamous carcinoma with single or combined use of DDP
and/or 5-FU (%, mean ± standard deviation, n=6).
|
| The 48-h drug
inhibition rate, % |
|---|
|
|
|
|---|
|
| h-R3 | DDP/5-FU combined
use | P- and q-value |
|---|
|
|
|
|
|
|---|
| Processing
method | a | b | c | b vs. c |
|---|
| h-R3/DDP |
|
|
|
|
| EC1 |
8.50±1.13 | 36.07±3.25 | 35.88±3.89 | 0.930 vs. 0.86 |
|
EC9706 | 25.85±2.04 | 35.93±2.01 | 47.83±3.07 | 0.000 vs. 0.91 |
| 5-FU/h-R3 |
|
|
|
|
| EC1 |
8.50±1.23 | 31.19±3.60 | 30.99±2.28 | 0.909 vs. 0.85 |
|
EC9706 | 25.85±2.04 | 30.97±1.06 | 46.23±3.16 | 0.000 vs. 0.95 |
Cytotoxicity induced by combined application of the
two drugs was calculated using Jin's formula. The interaction index
was represented with as a q-value and the formula used was
q=E(AB)/[EA+(1-EA)xEB]. The q-value of the combined effect of the
two drugs was <1.15, which is in the range of 0.85–1.15,
indicating that it has a combined effect of the two drugs (Table IV).
Apoptotic cell analysis using flow
cytometry
The apoptotic rate difference of the EC1 esophageal
cancer cells between the control group and h-R3 group was
statistically significant (P>0.05). The rate of apoptosis
between single use of DDP, 5-FU or the combination with h-R3 group
with the control group was statistically significant (P<0.05).
The combined chemotherapy and drug alone groups did not yield any
significant difference with regard to the apoptotic rate
(P>0.05). However, the EC9706 esophageal carcinoma cell
apoptotic rate between the drug treatment and control groups was
statistically different (P<0.05). The difference between the
combined drug use and chemotherapy alone groups with regard to the
drug apoptotic rate was statistically significant (P<0.05)
(Table V).
| Table V.Detection results of apoptotic cells
of the different treatment groups (%, mean ± standard deviation,
n=3). |
Table V.
Detection results of apoptotic cells
of the different treatment groups (%, mean ± standard deviation,
n=3).
|
| Apoptosis rate,
% |
|---|
|
|
|
|---|
| Treatment factors
(Group) | EC1 | EC9706pa | P-value |
|---|
| Control | 3.54±0.37 | 3.86±0.22 |
|
| h-R3 | 4.31±0.69 |
5.45±0.63b |
|
| DDP |
9.88±0.25b |
0.92±2.20b |
|
| DDP+h-R3 |
10.25±1.18b |
17.49±1.04b | 0.489c |
| 5-FU |
8.09±0.17b |
12.48±2.66b |
|
| 5-FU+h-R3 |
8.15±0.32b |
17.51±0.66b | 0.833c |
Apoptotic cell analysis using
TUNEL
The TUNEL assay was used to detect cell apoptosis.
The nuclei of the apoptotic cells under the microscope
(magnification at ×400, (IE 2000U Nikon Corporation) had a
precipitation of brown yellow granules, which was accumulated at
the nuclear periphery, while the nuclei of the non-apoptotic cells
were blue.
The results were similar to the measured results of
the flow cytometry. The apoptotic rate difference of the EC1
esophageal cancer cells between the control and h-R3 groups was not
statistically significant (P>0.05). The apoptotic rate of DDP
and 5-FU single use therapy or combination with the h-R3 compared
to the control group showed a statistically significant difference
(P<0.05). The apoptotic rate between the combined use drug and
chemotherapy drug alone groups was not significantly different
(P>0.05). The difference in the apoptotic rate of EC9706
esophageal cancer cells between the control and h-R3 groups was
statistically significant (P<0.05). The apoptotic rate of the
single and combinatorial use therapy groups was statistically
significant (P<0.05). The difference of the combined apoptotic
rate of the combination and single drug groups was not
statistically significant (P>0.05) (Table VI).
| Table VI.Detection results of apoptotic cell
of different treatment groups (%, mean ±standard deviation,
n=3). |
Table VI.
Detection results of apoptotic cell
of different treatment groups (%, mean ±standard deviation,
n=3).
|
| Apoptosis rate,
% |
|---|
|
|
|
|---|
| Treatment factors
(Group) | EC1 |
EC9706pa | P-value |
|---|
| Control | 1.96±0.14 | 2.11±0.32 |
|
| h-R3 | 2.02±0.14 |
3.92±0.87b |
|
| DDP |
6.91±0.83b |
8.00±0.46b |
|
| DDP+h-R3 |
7.01±0.55b |
12.18±0.50b | 0.672c |
| 5-FU |
5.98±0.24b |
7.32±0.71b |
|
| 5-FU+h-R3 |
5.82±0.26b |
11.19±0.33b | 0.077c |
Discussion
Molecular-targeted therapy has recently become a
hotspot, particularly investigations regarding EGFR. h-R3 is the
first humanized monoclonal antibody used for the treatment of
malignant tumors. It was recommended by the National Comprehensive
Cancer Network (Chinese version) Head and Neck Tumor of Treatment
Guidelines in 2009. Clinical and basic studies in recent years have
confirmed its effect and safety in the treatment of head and neck
cancer, glioma, gastric cancer, nasopharyngeal carcinoma and other
solid tumors (7,8). Findings of previous studies on
esophageal cancer have identified that h-R3 is capable of
increasing the sensitivity of radiotherapy in esophageal carcinoma
as well as paclitaxel chemotherapy sensitivity (9).
Through comparison of two types of human squamous
cell carcinoma of esophagus, our in vitro experiment results
show that the sensitization effect in EC9706 cells with a high
expression of EGFR is better than that in EC1 cells with a low
expression of EGFR. Thus, the antitumor effect of the EGFR-specific
monoclonal antibody occurs by blocking the binding of ligand and
EGFR, thereby influencing EGFR activity and downstream signaling
pathway transmission, inhibiting tumor cell proliferation,
arresting cell cycle progress, inducing tumor cell apoptosis and
inhibiting tumor angiogenesis. The h-R3 is a humanized EGFR
monoclonal antibody, which can be combined stably in the bivalent
form with EGFR receptors on the cell surface (10). The h-R3 shows moderate affinity for
EGFR, but has a high affinity for tumor cells with highly expressed
EGFR. Thus, it is capable of stabilizing its surface receptor,
while for tumor cells with a low expression EGFR or normal tissue
cells it shows low affinity. This may be the reason for the
sensitizing effect of h-R3 on chemotherapy drugs resulting in a
high expression of EGFR in EC9706 cells as compared to EC1 cells
with a lower expression of EGFR.
However, the cytocidal effect of h-R3 combined with
DDP and 5-FU showed no obvious synergistic effect compared to the
single drug alone treatment, although an additive effect was
evident. Investigation of the EGFR monoclonal antibody demonstrated
that C225 ligand can induce EGFR to migrate into the nucleus
(11). Previous findings (12,13) have
confirmed that C225 is directly associated with chemotherapy
resistance, which means nuclear EGFR is possibly associated with
EGFR-targeted therapy effect. Therefore, EGFR nuclear translocation
was also associated with the drug resistance of h-R3. There are
also studies (14–16) suggesting that it may be associated
with the decrease of AKT activity mediated by anti-EGFR antibody
and EGFR internalization and degradation disorder. Thus, the
possible mechanisms of current anti-EGFR monoclonal antibody
combined with chemotherapy drug synergy effect remain to be
determined.
In summary, the results of the present study show
that h-R3 can increase the sensitivity of FD scheme chemotherapy
for esophageal carcinoma, and shows no synergistic effect but only
an additive effect. The effect of h-R3 on chemotherapy
sensitization is positively associated with a high expression of
EGFR.
References
|
1
|
Long E and Beales IL: The role of obesity
in oesophageal cancer development. Therap Adv Gastroenterol.
7:247–268. 2014. View Article : Google Scholar : PubMed/NCBI
|
|
2
|
Fischer OM, Hart S, Gschwind A and Ullrich
A: EGFR signal transactivation in cancer cells. Biochem Soc Trans.
31:1203–1208. 2003. View Article : Google Scholar : PubMed/NCBI
|
|
3
|
Yu CL, Meyer DJ, Campbell GS, Larner AC,
Carter-Su C, Schwartz J and Jove R: Enhanced DNA-binding activity
of a Stat3-related protein in cells transformed by the Src
oncoprotein. Science. 269:81–83. 1995. View Article : Google Scholar : PubMed/NCBI
|
|
4
|
Adams GP and Weiner LM: Monoclonal
antibody therapy of cancer. Nat Biotechnol. 23:1147–1157. 2005.
View Article : Google Scholar : PubMed/NCBI
|
|
5
|
Wang YN, Yamaguchi H, Hsu JM and Hung MC:
Nuclear trafficking of the epidermal growth factor receptor family
membrane proteins. Oncogene. 29:3997–4006. 2010. View Article : Google Scholar : PubMed/NCBI
|
|
6
|
Miqueli Diaz A, Blanco R, Garcia B, Badia
T, Batista AE, Alonso R and Montero E: Biological activity in vitro
of anti-epidermal growth factor receptor monoclonal antibodies with
different affinities. Hybridoma (Larchmt). 26:423–431. 2007.
View Article : Google Scholar : PubMed/NCBI
|
|
7
|
Rojo F, Gracias E, Villena N, Cruz T,
Corominas JM, Corradino I, Cedeño M, Campas C, Osorio M, Iznaga N,
et al: Pharmacodynamic trial of nimotuzumab in unresectable
squamous cell carcinoma of the head and neck: a SENDO Foundation
study. Clin Cancer Res. 16:2474–2482. 2010. View Article : Google Scholar : PubMed/NCBI
|
|
8
|
Bebb G, Smith C, Rorke S, Boland W,
Nicacio L, Sukhoo R and Brade A: Phase I clinical trial of the
anti-EGFR monoclonal antibody nimotuzumab with concurrent external
thoracic radiotherapy in Canadian patients diagnosed with stage
IIb, III or IV non-small cell lung cancer unsuitable for radical
therapy. Cancer Chemother Pharmacol. 67:837–845. 2011. View Article : Google Scholar : PubMed/NCBI
|
|
9
|
Pandey A, Noronha V, Joshi A, Tongaonkar
H, Bakshi G and Prabhash K: Resistant metastatic penile carcinoma
and response to biochemotherapy with paclitaxel and epidermal
growth factor receptor monoclonal antibody, nimotuzumab. Indian J
Med Paediatr Oncol. 34:24–27. 2013. View Article : Google Scholar : PubMed/NCBI
|
|
10
|
Garrido G, Tikhomirov IA, Rabasa A, Yang
E, Gracia E, Iznaga N, Fernández LE, Crombet T, Kerbel RS and Pérez
R: Bivalent binding by intermediate affinity of nimotuzumab a
contribution to explain antibody clinical profile. Cancer Biol
Ther. 11:373–382. 2011. View Article : Google Scholar : PubMed/NCBI
|
|
11
|
Lu Y, Li X, Liang K, Luwor R, Siddik ZH,
Mills GB, Mendelsohn J and Fan Z: Epidermal growth factor receptor
(EGFR) ubiquitination as a mechanism of acquired resistance
escaping treatment by the anti-EGFR monoclonal antibody cetuximab.
Cancer Res. 67:8240–8247. 2007. View Article : Google Scholar : PubMed/NCBI
|
|
12
|
Liccardi G, Hartley JA and Hochhauser D:
EGFR nuclear translocation modulates DNA repair following cisplatin
and ionizing radiation treatment. Cancer Res. 71:1103–1114. 2011.
View Article : Google Scholar : PubMed/NCBI
|
|
13
|
Dittmann K, Mayer C, Fehrenbacher B,
Schaller M, Kehlbach R and Rodemann HP: Nuclear EGFR shuttling
induced by ionizing radiation is regulated by phosphorylation at
residue Thr654. FEBS Lett. 584:3878–3884. 2010. View Article : Google Scholar : PubMed/NCBI
|
|
14
|
Wheeler DL, Huang S, Kruser TJ,
Nechrebecki MM, Armstrong EA, Benavente S, Gondi V, Hsu KT and
Harari PM: Mechanisms of acquired resistance to cetuximab, role of
HER (ErbB) family members. Oncogene. 27:3944–3956. 2008. View Article : Google Scholar : PubMed/NCBI
|
|
15
|
Loupakis F, Pollina L, Stasi I, Ruzzo A,
Scartozzi M, Santini D, Masi G, Graziano F, Cremolini C, Rulli E,
et al: PTEN expression and KRAS mutations on primary tumors and
metastases in the prediction of benefit from cetuximab plus
irinotecan for patients with metastatic colorectal cancer. J Clin
Oncol. 27:2622–2629. 2009. View Article : Google Scholar : PubMed/NCBI
|
|
16
|
Kim SM, Kim JS, Kim JH, Yun CO, Kim EM,
Kim HK, Solca F, Choi SY and Cho BC: Acquired resistance to
cetuximab is mediated by increased PTEN instability and leads
cross-resistance to gefitinib in HCC827 NSCLC cells. Cancer Lett.
296:150–159. 2010. View Article : Google Scholar : PubMed/NCBI
|