Introduction
Gliomas are the most common form of malignant
primary brain tumor and one of the most lethal solid tumors,
exhibiting a high rate of recurrence, poor survival rate and poor
prognosis (1). An increasing number
of reports in the literature have demonstrated that gliomas develop
from multipotent cancer stem cells (CSCs), which are a group of
cells with eternal life or infinite self-renewal ability that
display high migrating, infiltrative and metastatic abilities
(2). Although glioma stem cells
(GSCs) only account for a small proportion (1~10%) of the cells
present in gliomas (3), they are
considered to be responsible for the resistance of gliomas to
traditional therapy, tumor recurrence and invasiveness (4). Therefore, effective sorting GSCs and
elucidating the biological characteristics of GSCs are of great
importance, and may be exploited in the development of novel
therapeutic drugs for this deadly disease (5).
The first description of cluster of differentiation
(CD)133 as a characteristic cell surface marker of GSCs was
reported by Singh et al in 2004 (6). That study highlighted that only
CD133-positive cells, which were sorted from human glioma samples,
were capable of tumor initiation in vivo. Subsequently,
increasing evidence has reported that CD133 has been widely used as
a marker to characterize the CSC population in gliomas (7). CD133, also known as prominin-1, is a
pentaspan transmembrane cell surface protein that is primarily
localized to the plasma membrane (8).
The transcription of the CD133 gene is controlled by five
alternative promoters (P1, P2, P3, P4 and P5), with P1 exhibiting
the highest activity in gliomas (9).
The high expression of CD133 has been used to identify and isolate
CSCs (10). There are two main
methods for isolating CSCs from non-CSCs: Fluorescence-activated
cell sorting (FACS) and magnetic-activated cell sorting (MACS)
(11). However, these two sorting
approaches present certain disadvantages, such as a low yield in
the number of viable cells sorted (12).
In the present study, gene recombination technology
was utilized to construct two types of gene expression vectors, and
CD133 (+) U251 cells as well as CD133 (−) U251 cells were obtained.
In addition, the present results illustrated that CD133 (+) cells
had significantly higher CD133 expression, cell proliferation and
cell invasive abilities than CD133 (−) cells.
Materials and methods
Cell line and cell culture
The U251 cell line was provided by the Department of
Central Laboratory of the China-Japan Union Hospital of Jilin
University (Changchun, China). The cells were cultured in
Dulbecco's modified Eagle's medium (Gibco; Thermo Fisher
Scientific, Inc., Waltham, MA, USA) supplemented with 10% fetal
bovine serum (FBS) (Gibco; Thermo Fisher Scientific, Inc.), 100
U/ml penicillin G and 100 µg/ml streptomycin, and incubated in a
humidified incubator at 37°C containing 5% CO2.
Gene cloning and construction of gene
vectors
The vectors pcDNA3.1, pMD18-T, pMD18-HSV-TK and
pWPXLd were kindly provided by Dr Du Zhen-Wu (Jilin University,
Changchun, China). The P1 promoter of the CD133 (1,810 bp),
neomycin-resistance (795 bp) and herpes simplex virus thymidine
kinase (HSV-TK) (1,210 bp) genes were amplified by polymerase chain
reaction (PCR) using specifically designed primer pairs. The
sequences of the primer pairs were as follows: P1 promoter of the
CD133 gene, forward 5′-GTAGTCGACCTTCAGTGCCTCTTTCAGT-3′ and reverse
5′-GCCTTAATTAAGTGGGGATCTGCCTCAGTC-3′; P1 promoter of the
neomycin-resistance gene, forward 5′-ACGCGTCGCATGATTGAACAAGAT-3′
and reverse 5′-ACTAGTCTCAGAAGAACTCGTCGTCAAG-3′; and P1 promoter of
the HSV-TK gene, forward 5′-AAGGGATCCGCCATCATGGCCTCGTAC-3′ and
reverse 5′-TTCACTAGTCTCAGTTAGCCTCCCCCATC-3′. The PCR conditions
used were as follows: 94°C for 5 min, followed by 94°C for 45 sec,
58°C for 45 sec and 72°C for 45 sec for 35 cycles, and a final
extension of 72°C for 10 min. The PCR products were analyzed by
electrophoresis on a 1% agarose gel, and visualized with ethidium
bromide. Upon cloning these PCR products into the pMD18-T vector,
the vectors were identified by digestion with different restriction
enzymes and sequencing. Finally, two types of lentiviral vectors
with the P1 promoter of the CD133 gene regulating the
neomycin-resistance gene (named pWPXLd-pCD133-Neo) and the HSV-TK
gene (named pWPXLd-pCD133-HSV-TK) were constructed by gene
recombination technology.
Packaging and titration of the
lentiviral vectors
The lentiviral vectors and packaging components
(psPAX2 and pMD2.G; Invitrogen; Thermo Fisher Scientific, Inc.)
were transfected into 293 T cells with Lipofectamine 2000
(Invitrogen; Thermo Fisher Scientific, Inc). At 48 h
post-transfection, the culture media containing the lentiviruses
were harvested and filtered through a 0.45-mm filter. Virus
aliquots were suspended in medium without FBS, and stored at −80°C
until used.
CD133 (+) and CD133 (−) cells
selection
When the U251 cells were >90% confluent,
different lentiviral vector particles were added into the cell
culture medium. Selection of CD133 (+) cells containing the
pWPXLd-pCD133-Neo vector was conducted by adding G418 (Gibco;
Thermo Fisher Scientific, Inc.), while selection of CD133 (−) cells
containing the pWPXLd-pCD133-HSV-TK vector was performed by adding
hygromycin B (Roche Applied Science, Pleasanton, CA, USA). Colonies
were detected after 14 days in the selective medium, and
independent colonies were trypsinized and transferred to 96-well
plates. Finally, the cells were cultured routinely with G418 (300
µg/ml) or hygromycin B (50 µg/ml).
CD133 messenger (m)RNA expression by
reverse transcription-quantitative (RT-q)PCR
RT-qPCR was used to detect CD133 mRNA expression.
Briefly, total RNA was extracted according to the manufacturer's
protocol of the RNA extraction kit (Tiangen Biotech Co., Ltd.,
Beijing, China). First-strand complementary (c)DNA was synthesized
using FastLane Cell cDNA kit (Tiangen Biotech Co., Ltd.), according
to the manufacturer's protocol. The sequences of the primers used
for RT-qPCR were as follows: CD133, forward
5′-TGGATGCAGAACTTGACAACGT-3′ and reverse
5′-AGGCCACCCAGCCACCAGTA-3′; and glyceraldehyde 3-phosphate
dehydrogenase, forward 5′-TGCACCACCAACTGCTTAGC-3′ and reverse
5′-GGCATGGACTGTGGTCATGAG-3′. PCR was initiated with a denaturation
of 5 min at 95°C, followed by 35 cycles of 95°C for 30 sec and 58°C
for 30 sec, and a final elongation of 72°C for 10 min, using
GeneAmp® PCR System 9700 (Applied Biosystems; Thermo
Fisher Scientific, Inc.). The mRNA expression of CD133 was
determined from each group of U251 cells, and the experiments were
performed in triplicate. Relative quantification using the
comparative Cq method was conducted for each group (13).
CD133 protein expression analysis by
flow cytometry
U251 cells from each group were seeded in 6-well
plates at a density of 5×10⁴ cells/well. After the cells
were cultured for 72 h, different groups of cells were trypsinized
to prepare a single cell suspension. Flow cytometry analysis was
performed as described elsewhere (14). Briefly, cells were washed with chilled
phosphate-buffered saline (PBS) and resuspended with mouse
anti-CD133-phycoerythrin antibody (cat. no. 130-098-826; 1:1,000;
Miltenyi Biotec GmbH, Bergisch Gladbach, Germany) or with
fluorophore-tagged isotype controls (cat. no. 130-098-845; 1:1,000;
Miltenyi Biotec GmbH) for 30 min at 4°C. Cells were then washed
twice with PBS and resuspended in PBS for analysis. Flow cytometry
analysis was conducted with a flow cytometer (FC500; Beckman
Coulter, Inc., Brea, CA, USA). Cell debris and aggregates were
excluded based on scatter signals, and 10,000 events/sample were
captured. Data were analyzed using CXP software (Beckman Coulter,
Inc.).
Cell cycle analysis by flow
cytometry
Cell cycle analysis was performed as previously
described (15). Briefly, different
groups of cells were harvested as single cell suspensions and fixed
with 70% ice-cold ethanol at −20°C overnight. Then, the cells were
washed and resuspended in PBS, followed by incubation with
propidium iodide (10 mg/ml; Sigma-Aldrich, St. Louis, MO, USA) and
RNase A (Sigma-Aldrich) for 30 min at 4°C. Finally, the cell cycle
distribution was measured by flow cytometry (FC500; Beckman
Coulter, Inc.), and the results were analyzed by MultiCycle
software (Beckman Coulter, Inc.). The proliferative index was
defined as the percentage of cells in the S+G2/M phases divided by
the total number of cells in the (G0/G1+S+G2/M) phases and
multiplied by 100 (16). Values were
represented as the mean ± standard error of the mean (SEM) of three
independent experiments performed in triplicate.
Cell proliferation analysis by
3-(4,5-dimethylthiazol-2-yl)-2,5-diphenyltetrazolium bromide (MTT)
assay
The cell proliferation assay was performed in all
cell groups as previously described (17). Briefly, 20 µl MTT (5 mg/ml;
Sigma-Aldrich) was added into each well daily from days 1 to 7, and
plates were incubated for 4 h at 37°C. The supernatant was then
removed, and 150 µl dimethyl sulfoxide (Sigma-Aldrich) was added
following 10 min of agitation. The optical density values were
determined with an enzyme-linked immunosorbent assay reader
(Synergy HT™; Biotek Instruments, Inc., Winooski, VT, USA) at 490
nm. The assays were performed in triplicate. In each group, the
cells were analyzed, and the data were presented as the mean ±
standard deviation. A growth curve was generated according to the
absorption values at 490 nm exhibited by the different groups of
cells.
Soft agar colony formation assay
Plates were coated with a layer of 1% agar in 20%
FBS medium. Cells were prepared in 0.66% agar in 10% FBS medium and
seeded onto the above plates, which were incubated until colonies
were formed. Colonies were then fixed with 4% polyoxymethylene and
stained with 0.1% crystal violet, prior to be counted and
photographed with a microscope (Olympus Corporation, Tokyo, Japan).
Assays were conducted in triplicate, and three independent
experiments were performed.
Statistical analysis
The results are expressed as the mean ± SEM.
Statistical analysis was performed using SPSS version 13.0 software
(SPSS, Inc., Chicago, IL, USA). Differences between CD133 (+) and
CD133 (−) cells were compared using the two-tailed Student's
t-test. P<0.05 was considered to indicate a statistical
significant difference.
Results
Gene cloning and construction of
lentiviral vectors
Upon conducting PCR with the specifically designed
primer pairs, PCR products containing the P1 promoter of the CD133,
neomycin-resistance or HSV-TK genes were subjected to agarose gel
electrophoresis. As shown in Fig. 1A,
DNA bands of ~1,800, 800 and 1,200 bp in size were observed. These
DNAs were then inserted into the pMD18 vector, and the clones were
identified by digestion of the vectors with different pairs of
restriction enzymes and sequencing (data not shown). The results
demonstrated that the P1 promoter of the CD133, neomycin-resistance
and HSV-TK genes were successfully cloned in the pMD18 vector.
Using gene recombination technology, the P1 promoter of the CD133,
neomycin-resistance and HSV-TK genes were also combined with the
pWPXLd vector, and the identification conducted by digestion with
different pairs of restriction enzymes demonstrated that two types
of vector (pWPXLd-pCD133-Neo and pWPXLd-pCD133-HSV-TK) were
successfully constructed (Fig. 1B and
C).
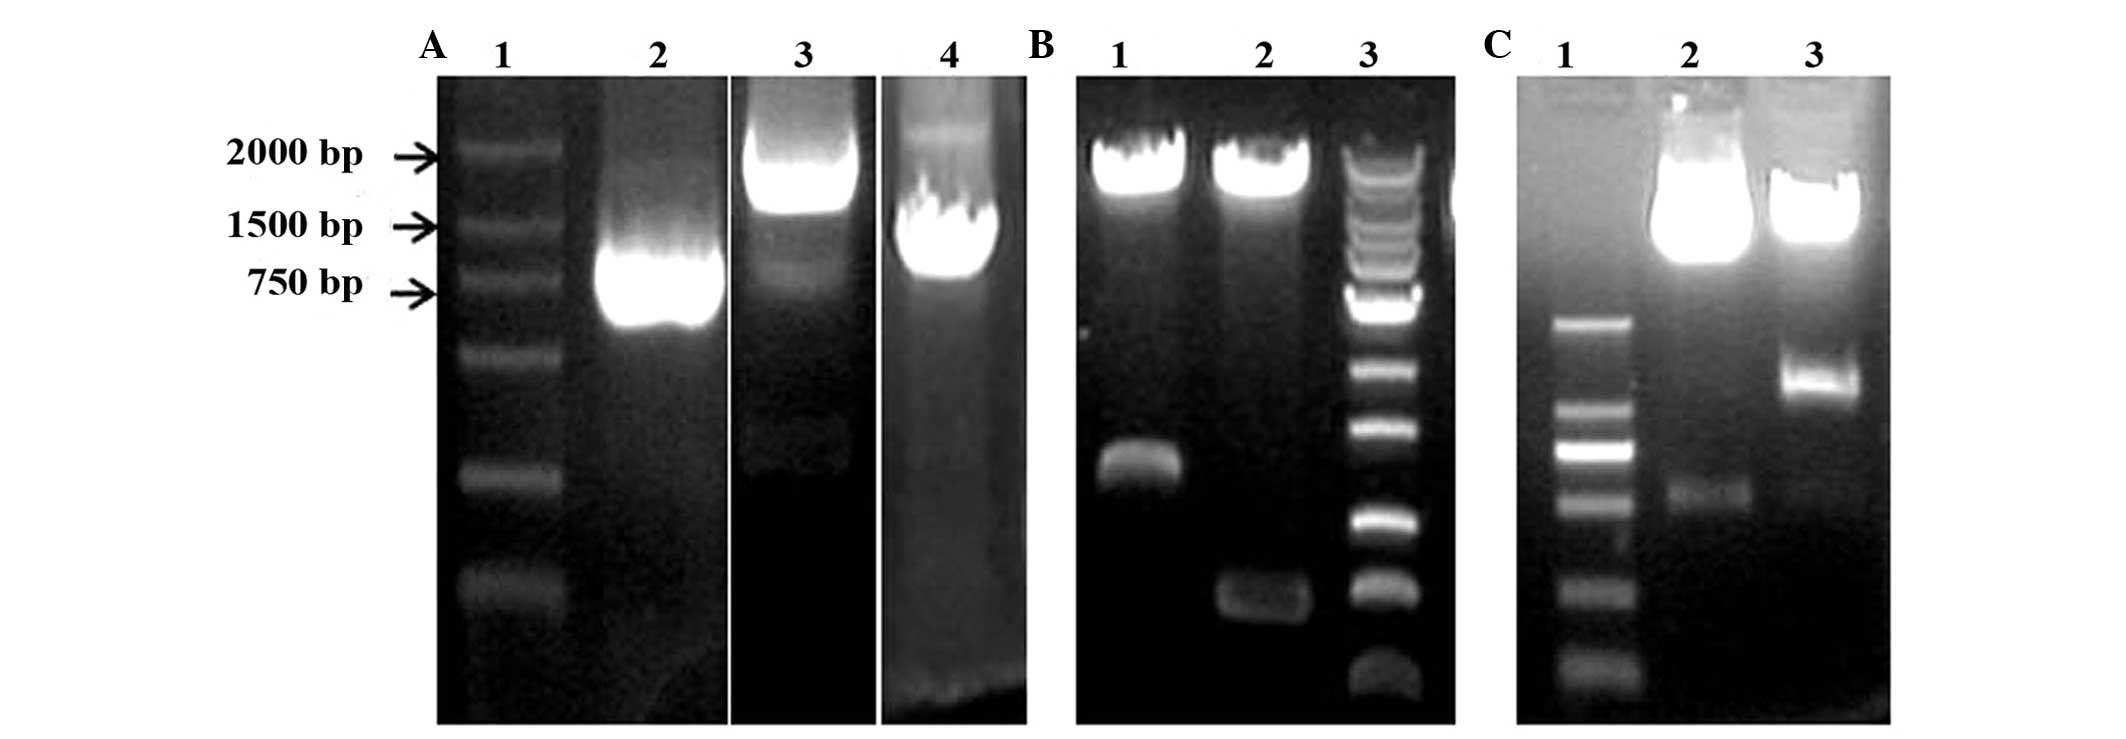 | Figure 1.Gene cloning and identification of
pWPXLd-pCD133-Neo and pWPXLd-pCD133-HSV-TK. (A) Agarose gel
electrophoresis of polymerase chain reaction products. Lanes 1, 2,
3 and 4 represent DNA marker DL2000, and the P1 promoter of the
neomycin-resistance, CD133 and HSV-TK genes, respectively. (B)
Identification of pWPXLd-pCD133-Neo by gel electrophoresis upon
digestion with different pairs of restriction enzymes. Lane 1
represents the result of digestion with PacI and SalI-HF enzymes; lane 2
represents the result of digestion with SpeI and MluI
enzymes; and lane 3 represents 1 kb Plus DNA Ladder. (C)
Identification of pWPXLd-pCD133-HSV-TK by gel electrophoresis upon
double digestion with restriction enzymes. Lanes 1, 2 and 3
correspond to the DL2000 DNA Marker, and the results of digestion
with PacI and SalI restriction enzymes, respectively.
HSV-TK, herpes simplex virus thymidine kinase; CD, cluster of
differentiation. |
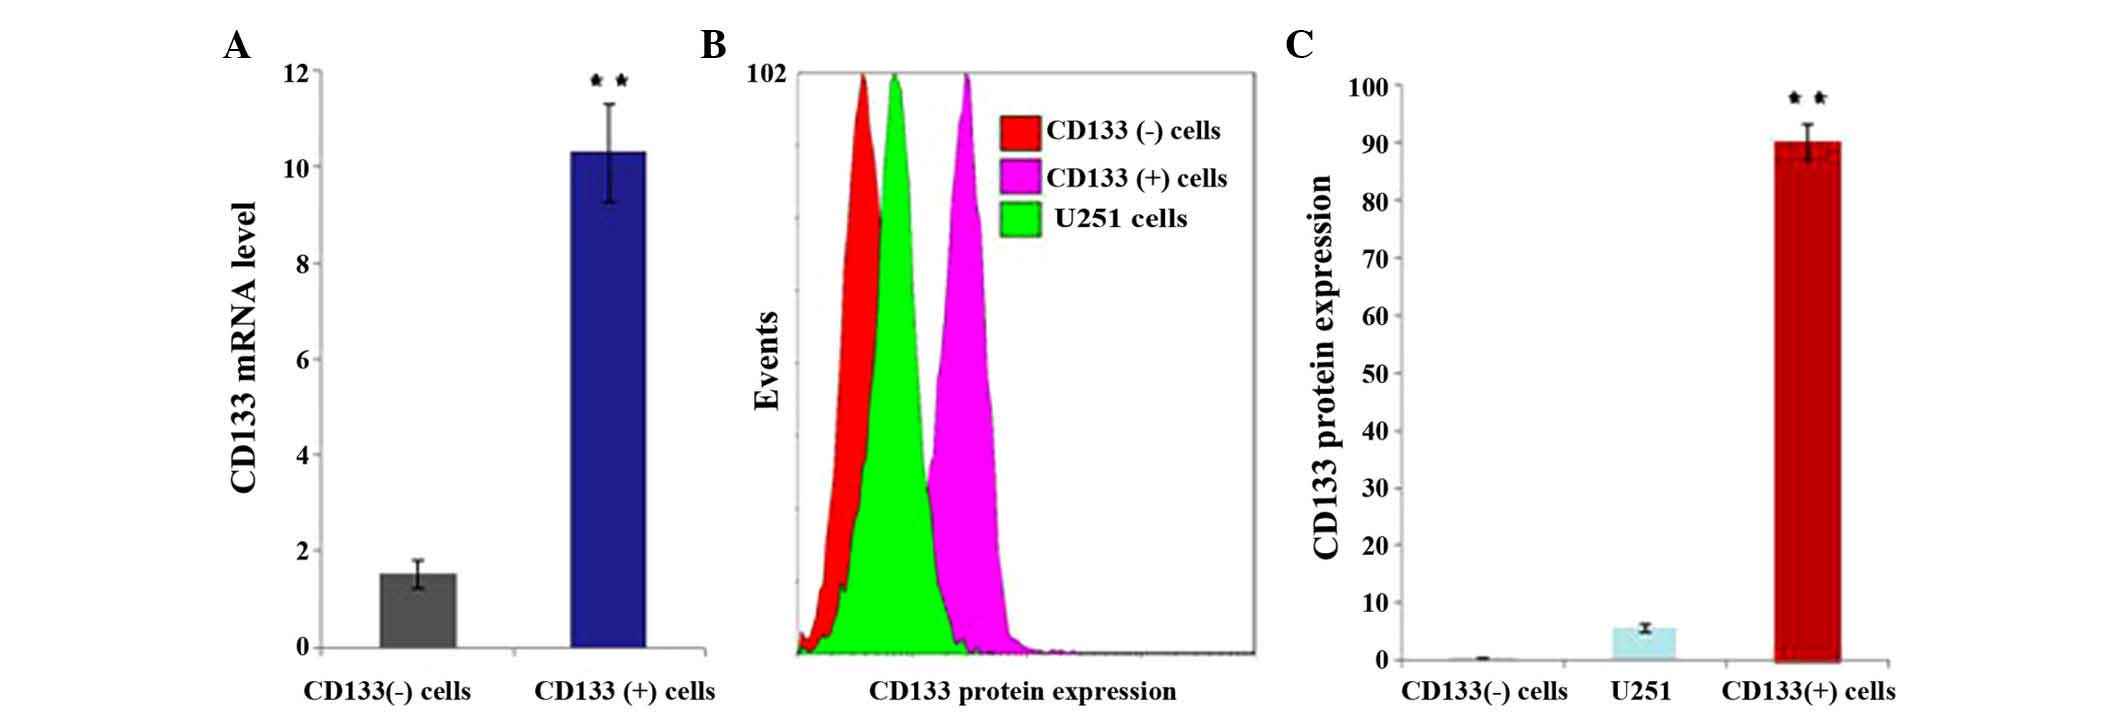
CD133 expression in CD133 (+) and
CD133 (−) U251 cells
U251 cells were infected with the lentiviral vector
packaging particles of pWPXLd-pCD133-Neo or pWPXLd-pCD133-HSV-TK.
CD133 (+) and CD133 (−) cells were obtained by adding G418 or
hygromycin B for ~14 days. RT-qPCR and flow cytometry were used to
detect CD133 mRNA and protein expression. The results revealed that
the mRNA (P=0.029; Fig. 2A) and
protein (P<0.001; Fig. 2B and C)
expression levels of CD133 were significantly higher in CD133 (+)
cells compared with those in CD133 (−) cells.
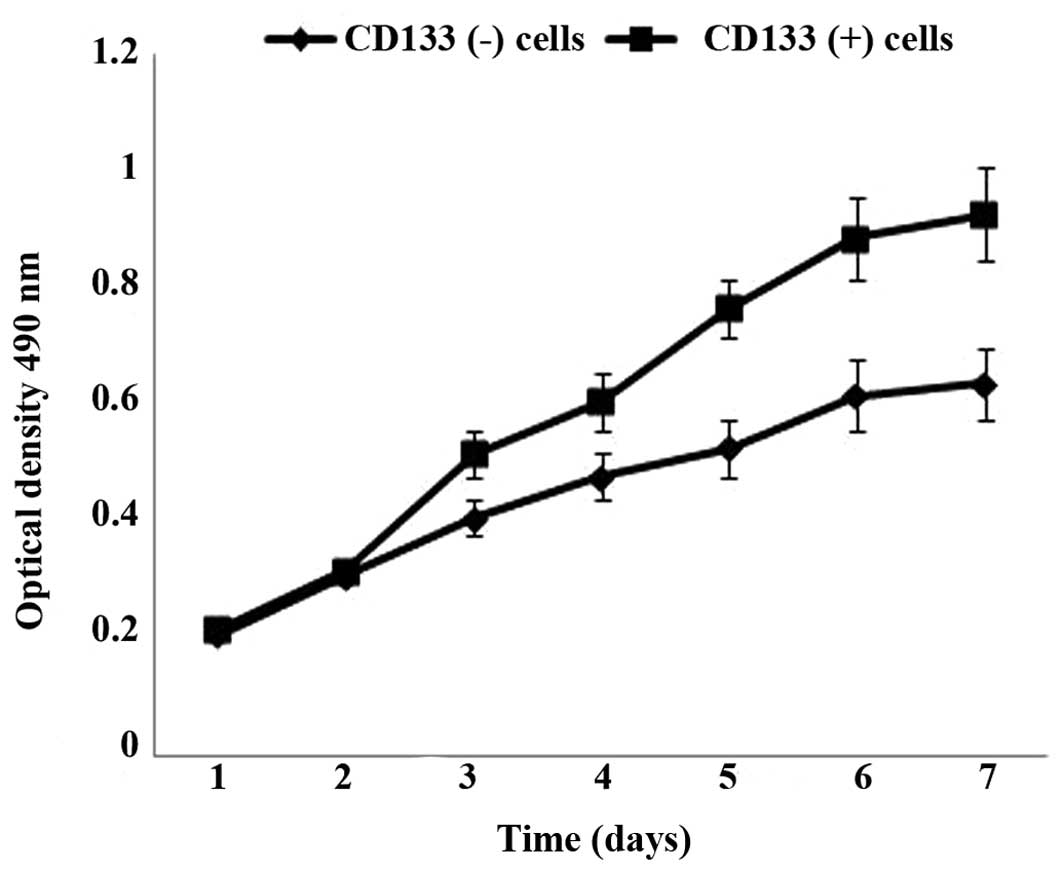
Cell proliferation analysis of CD133
(+) and CD133 (−) cells
To investigate the cell proliferation ability of
CD133 (+) and CD133 (−) cells, an MTT assay was performed. As
presented in Fig. 3, the cell
proliferation ability of CD133 (+) cells was significantly higher
than that of CD133 (−) cells after 3 days of culture (P=0.007).
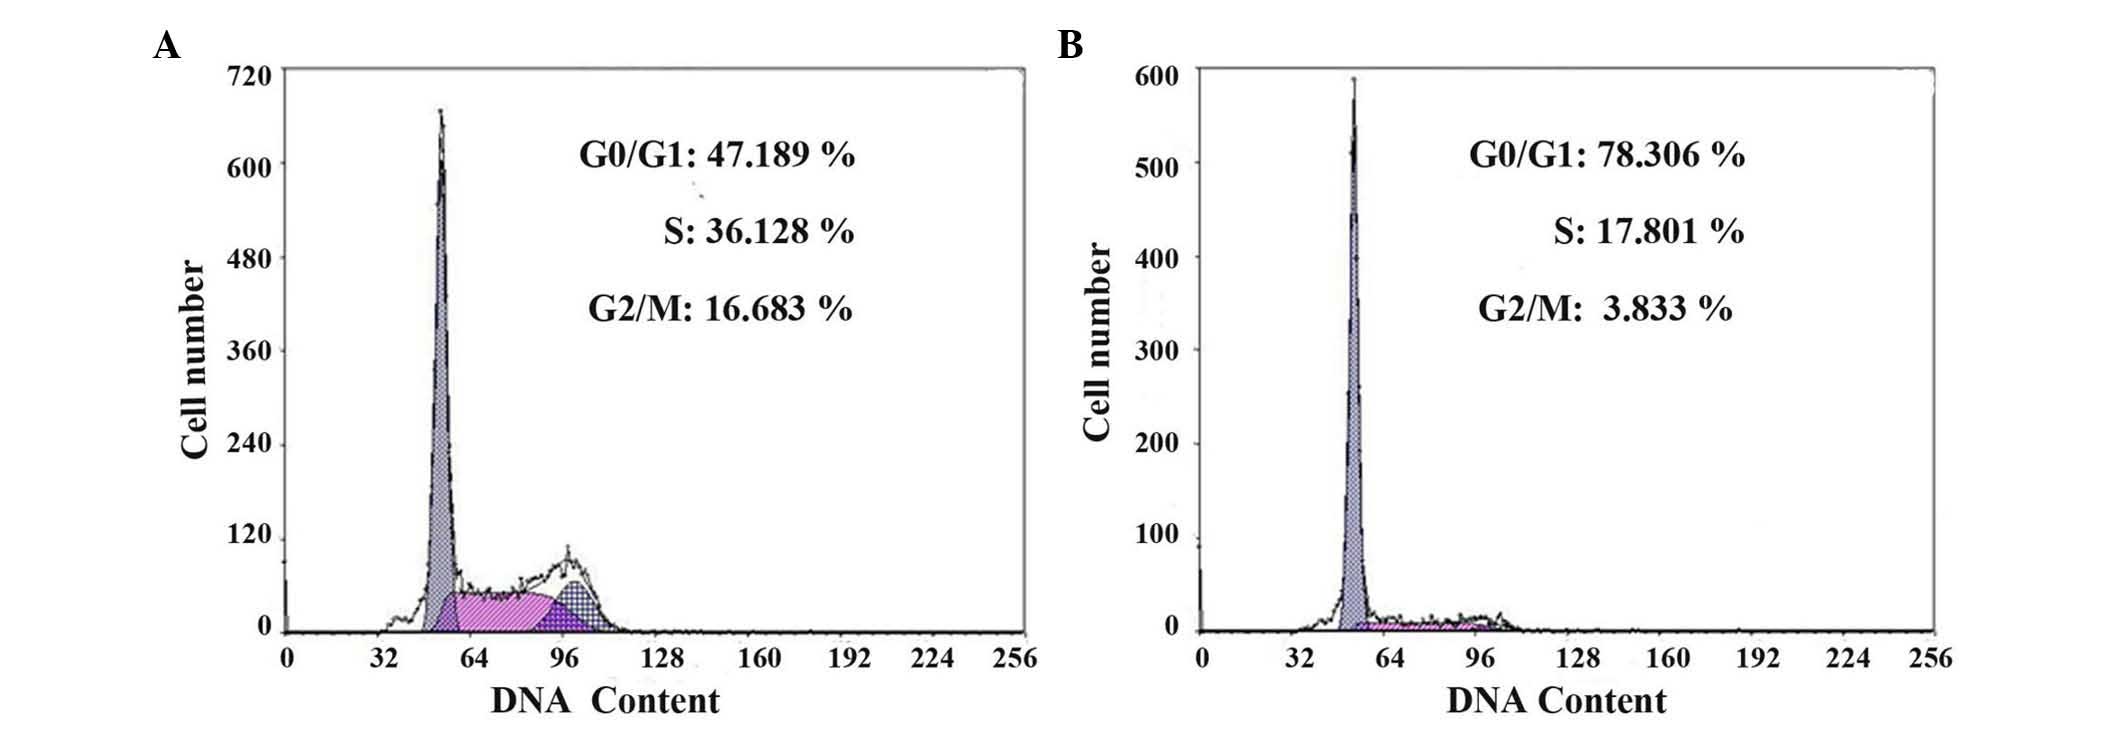
Cell cycle analysis of CD133 (+) and
CD133 (−) cells
The cell cycle of CD133 (+) and CD133 (−) cells was
assessed by flow cytometry. As shown in Fig. 4 and Table
I, the ratio of cells in the G0/G1 phases was significantly
decreased in CD133 (+) cells compared with that in CD133 (−) cells
(P=0.013). The proliferation index was remarkably higher in CD133
(+) cells (53.823±1.105%) than in CD133 (−) cells (22.695±1.023%)
(P<0.001).
 | Table I.Cell cycle distribution of CD133 (+)
and CD133 (−) cells (n=3). |
Table I.
Cell cycle distribution of CD133 (+)
and CD133 (−) cells (n=3).
|
| Cell cycle
distribution (%) |
|---|
|
|
|
|---|
| Group | G0/G1 | S | G2/M |
|---|
| CD133 (+) cells |
47.175±1.312a |
36.375±1.541a |
16.517±1.101a |
| CD133 (−) cells | 78.312±1.878 | 17.754±1.621 | 3.732±0.531 |
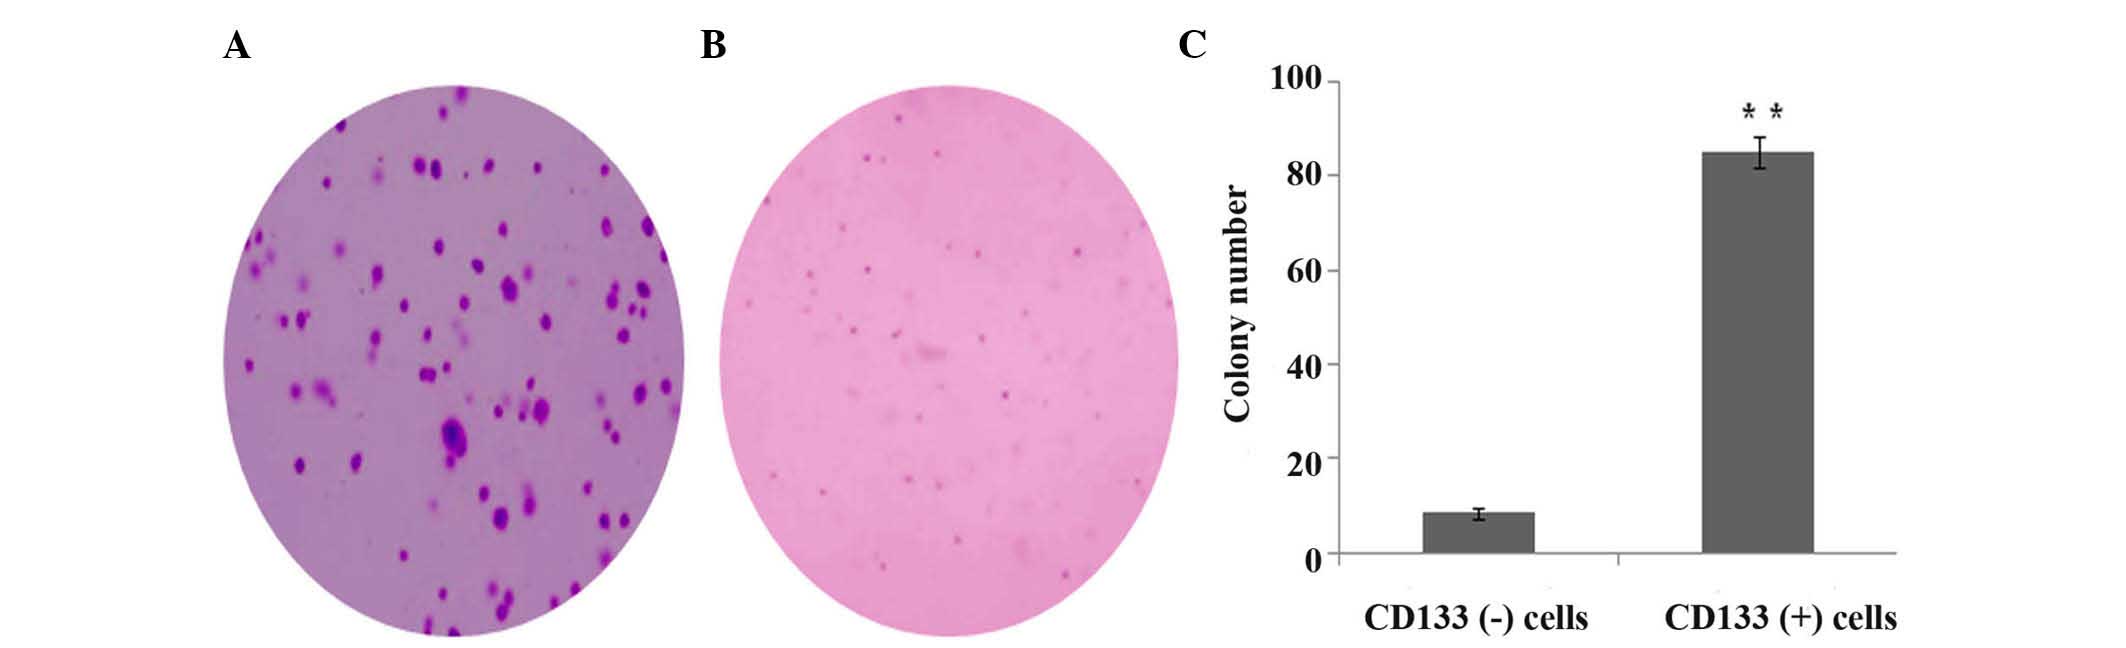
Soft agar colony formation
The in vitro invasive ability of CD133 (+)
and CD133 (−) cells was estimated by soft agar colony formation
assay. Compared with CD133 (−) cells, the colony number of CD133
(+) cells was significantly increased (P<0.001) (Fig. 5).
Discussion
The CD133 antigen is a five-transmembrane domain
glycoprotein, which has been used to identify and isolate CSCs in
various tumors, including colon cancer, prostate cancer and
hepatocellular carcinoma (18). In
gliomas, the role of CD133 as a marker of stem-like glioma cells
has been widely investigated, since it identifies cells that are
able to initiate neurosphere growth and form heterogeneous tumors
when transplanted in immunocompromised mice (19). FACS and MACS are the most common
methods for isolating CSCs, but these approaches require costly
antibodies and dedicated equipment, and isolate only low numbers of
viable cells (12). The present study
established a novel method for obtaining CD133 (+) and CD133 (−)
U251 cells.
In the current study, gene recombination technology
was successfully used to construct two types of gene expression
vectors, which were stably transfected in the U251 cell line. CD133
(+) and CD133 (−) U251 cells were obtained by adding G418 or
hygromycin B to the culture medium for 14 days. The results
indicated that the protein expression level of CD133 in U251 cells
was ~5%, which demonstrated that there were few GSCs in the U251
glioma cells. Specifically, the present data demonstrated that
CD133 protein expression was significantly higher in CD133 (+)
cells compared with that in CD133 (−) cells.
The biological identification of CD133 (+) and CD133
(−) cells is mainly based on the properties of CSCs, since these
cells i) exhibit tumorigenic potential in vivo and in
vitro; ii) possess the properties of self-renewal and
differentiation; iii) express various typical CSCs markers; iv)
generate clonally derived cells that form neurospheres; and v)
possess high proliferation potential and multidrug resistance
(20,21). The study of CSCs is of importance and
value for controlling and preventing tumor growth, recurrence and
prognosis. Increased knowledge regarding CSCs may aid to better
treat and prevent tumors. The present study observed that CD133 (+)
cells highly expressed the CD133 surface marker, whereas there was
very limited expression of CD133 in CD133 (−) cells. Importantly,
the current results demonstrated that CD133 (+) cells have higher
cell proliferation ability, proliferation index and invasive
ability than CD133 (−) cells, which suggested that CD133 (+) cells
exhibit certain biological characteristics and functions of
CSCs.
However, there are a number of limitations that
affect the present study. First, although CD133 is the most common
marker used for CSC sorting in gliomas, various studies have
questioned the utility of CD133 in the isolation of GSCs (19,22).
Second, not only CD133 (+) cells but also CD133 (−) cells are able
to self-renew, regenerate tumors in vivo and in
vitro, and possess stem cell characteristics and tumorigenic
potential (23). In addition, certain
studies have proposed that there is not a hierarchical association
between CD133 (+) and CD133 (−) cells forming neurospheres
(24). Third, CD133, as a marker of
GSCs, is not widely accepted by a number of studies, and has not
been detected in several fresh glioma specimens or established
glioma cell lines (22,25,26).
In conclusion, the present study successfully
established a novel approach to obtain GSCs from U251 glioma cells
based on the P1 promoter of CD133, which may be useful for future
studies on CSCs.
Acknowledgements
The present study was supported by the Department of
Public Health of Jilin Province (Changchun, China; grant no.
2014Q025), the Supporting Program of Bethune Medical Research of
Jilin University (Changchun, China; grant no. 2013207058) and the
Jilin Science and Technology Development Plan of China (Changchun,
China; grant nos. 201201060 and 201215078).
References
|
1
|
Wen PY and Reardon DA: Neuro-oncology in
2015: Progress in glioma diagnosis, classification and treatment.
Nat Rev Neurol. 12:69–70. 2016. View Article : Google Scholar : PubMed/NCBI
|
|
2
|
Wei X, Wang J, He J, Ma B and Chen J:
Biological characteristics of CD133(+) cancer stem cells derived
from human laryngeal carcinoma cell line. Int J Clin Exp Med.
7:2453–2462. 2014.PubMed/NCBI
|
|
3
|
Parajuli P, Anand R, Mandalaparty C,
Suryadevara R, Sriranga PU, Michelhaugh SK, Cazacu S, Finniss S,
Thakur A, Lum LG, et al: Preferential expression of functional
IL-17R in glioma stem cells: Potential role in self-renewal.
Oncotarget. 7:6121–6135. 2016.PubMed/NCBI
|
|
4
|
Najbauer J, Kraljik N and Németh P: Glioma
stem cells: Markers, hallmarks and therapeutic targeting by
metformin. Pathol Oncol Res. 20:789–797. 2014. View Article : Google Scholar : PubMed/NCBI
|
|
5
|
Yasumoto Y, Miyazaki H, Vaidyan LK, Kagawa
Y, Ebrahimi M, Yamamoto Y, Ogata M, Katsuyama Y, Sadahiro H, Suzuki
M and Owada Y: Inhibition of fatty acid synthase decreases
expression of stemness markers in glioma stem cells. PLoS One.
11:e01477172016. View Article : Google Scholar : PubMed/NCBI
|
|
6
|
Singh SK, Hawkins C, Clarke ID, Squire JA,
Bayani J, Hide T, Henkelman RM, Cusimano MD and Dirks PB:
Identification of human brain tumour initiating cells. Nature.
432:396–401. 2004. View Article : Google Scholar : PubMed/NCBI
|
|
7
|
Nie S, Gurrea M, Zhu J, Thakolwiboon S,
Heth JA, Muraszko KM, Fan X and Lubman DM: Tenascin-C: A novel
candidate marker for cancer stem cells in glioblastoma identified
by tissue microarrays. J Proteome Res. 14:814–822. 2015. View Article : Google Scholar : PubMed/NCBI
|
|
8
|
Park EK, Lee JC, Park JW, Bang SY, Yi SA,
Kim BK, Park JH, Kwon SH, You JS, Nam SW, et al: Transcriptional
repression of cancer stem cell marker CD133 by tumor suppressor
p53. Cell Death Dis. 6:e19642015. View Article : Google Scholar : PubMed/NCBI
|
|
9
|
Tabu K, Sasai K, Kimura T, Wang L,
Aoyanagi E, Kohsaka S, Tanino M, Nishihara H and Tanaka S: Promoter
hypomethylation regulates CD133 expression in human gliomas. Cell
Res. 18:1037–1046. 2008. View Article : Google Scholar : PubMed/NCBI
|
|
10
|
Ren F, Sheng WQ and Du X: CD133: A cancer
stem cells marker, is used in colorectal cancers. World J
Gastroenterol. 19:2603–2611. 2013. View Article : Google Scholar : PubMed/NCBI
|
|
11
|
Joo KM and Nam DH: Prospective
identification of cancer stem cells with the surface antigen CD133.
Methods Mol Biol. 568:57–71. 2009. View Article : Google Scholar : PubMed/NCBI
|
|
12
|
Kievit FM, Florczyk SJ, Leung MC, Wang K,
Wu JD, Silber JR, Ellenbogen RG, Lee JS and Zhang M: Proliferation
and enrichment of CD133(+) glioblastoma cancer stem cells on 3D
chitosan-alginate scaffolds. Biomaterials. 35:9137–9143. 2014.
View Article : Google Scholar : PubMed/NCBI
|
|
13
|
Livak KJ and Schmittgen TD: Analysis of
relative gene expression data using real-time quantitative PCR and
the 2(−Delta Delta C(T)) Method. Methods. 25:402–408. 2001.
View Article : Google Scholar : PubMed/NCBI
|
|
14
|
Cutler MJ, Lowthers EL, Richard CL,
Hajducek DM, Spagnuolo PA and Blay J: Chemotherapeutic agents
attenuate CXCL12-mediated migration of colon cancer cells by
selecting for CXCR4-negative cells and increasing peptidase CD26.
BMC Cancer. 15:8822015. View Article : Google Scholar : PubMed/NCBI
|
|
15
|
Zhang Y, Wang Y, Du Z, Wang Q, Wu M, Wang
X, Wang L, Cao L, Hamid AS and Zhang G: Recombinant human decorin
suppresses liver HepG2 carcinoma cells by p21 upregulation. Onco
Targets Ther. 5:143–152. 2012. View Article : Google Scholar : PubMed/NCBI
|
|
16
|
Guthrie HD, Welch GR, Cooper BS, Zakaria
AD and Johnson LA: Flow cytometric determination of degraded
deoxyribonucleic acid in granulosa cells to identify atretic
follicles during preovulatory maturation in the pig. Biol Reprod.
50:1303–1311. 1994. View Article : Google Scholar : PubMed/NCBI
|
|
17
|
Hamid AS, Li J, Wang Y, Wu X, Ali HA, Du
Z, Bo L, Zhang Y and Zhang G: Recombinant human decorin upregulates
p57KIP2 expression in HepG2 hepatoma cell lines. Mol Med
Rep. 8:511–516. 2013.PubMed/NCBI
|
|
18
|
Ffrench B, Gasch C, O'Leary JJ and
Gallagher MF: Developing ovarian cancer stem cell models: Laying
the pipeline from discovery to clinical intervention. Mol Cancer.
13:2622014. View Article : Google Scholar : PubMed/NCBI
|
|
19
|
Brescia P, Ortensi B, Fornasari L, Levi D,
Broggi G and Pelicci G: CD133 is essential for glioblastoma stem
cell maintenance. Stem Cells. 31:857–869. 2013. View Article : Google Scholar : PubMed/NCBI
|
|
20
|
Vescovi AL, Galli R and Reynolds BA: Brain
tumour stem cells. Nat Rev Cancer. 6:425–436. 2006. View Article : Google Scholar : PubMed/NCBI
|
|
21
|
Cho DY, Lin SZ, Yang WK, Hsu DM, Lin HL,
Lee HC, Lee WY and Chiu SC: The role of cancer stem cells
(CD133(+)) in malignant gliomas. Cell Transplant. 20:121–125. 2011.
View Article : Google Scholar : PubMed/NCBI
|
|
22
|
Wang J, Sakariassen PØ, Tsinkalovsky O,
Immervoll H, Bøe SO, Svendsen A, Prestegarden L, Røsland G, Thorsen
F, Stuhr L, et al: CD133 negative glioma cells form tumors in nude
rats and give rise to CD133 positive cells. Int J Cancer.
122:761–768. 2008. View Article : Google Scholar : PubMed/NCBI
|
|
23
|
Brescia P, Richichi C and Pelicci G:
Current strategies for identification of glioma stem cells:
Adequate or unsatisfactory? J Oncol. 2012.3768942012.PubMed/NCBI
|
|
24
|
Sun T, Chen G, Li Y, Xie X, Zhou Y and Du
Z: Aggressive invasion is observed in CD133/A2B5+ glioma-initiating
cells. Oncol Lett. 10:3399–3406. 2015.PubMed/NCBI
|
|
25
|
Joo KM, Kim SY, Jin X, Song SY, Kong DS,
Lee JI, Jeon JW, Kim MH, Kang BG, Jung Y, et al: Clinical and
biological implications of CD133-positive and CD133-negative cells
in glioblastomas. Lab Invest. 88:808–815. 2008. View Article : Google Scholar : PubMed/NCBI
|
|
26
|
Son MJ, Woolard K, Nam DH, Lee J and Fine
HA: SSEA-1 is an enrichment marker for tumor-initiating cells in
human glioblastoma. Cell Stem Cell. 4:440–452. 2009. View Article : Google Scholar : PubMed/NCBI
|