Introduction
The treatment of the advanced stages of head and
neck squamous cell carcinoma remains challenging (1,2). In
particular, a lack of locoregional control and failure of neck
dissection (occurrence or recurrence of lymph node metastases
following neck dissection) often leads to fatal outcomes and a poor
prognosis for the affected patients (3). Thus, the initial recognition of patients
with a higher risk of having these factors could improve the
long-term outcomes by allowing a more aggressive treatment approach
and a closer follow-up for that patient. Melanoma-associated
antigen A (MAGE-A) was identified in the early 1990s by van der
Bruggen et al (4). There is
growing evidence that MAGE-A proteins are associated with or
contribute to several solid malignancies, including head and neck
cancer (5–7). This can be explained, at least in part,
by the MAGE-A-mediated decrease in the cellular p53 levels, leading
to chemoresistance (8). In this
context, our previous studies investigated the contributions of
MAGE-A expression to the reduced cytotoxicity of conventional
therapies in head and neck cancer. Based on those studies, evidence
was provided showing that several MAGE-A subgroups, particularly
MAGE-A11, are associated with the decreased efficacy of cisplatin,
5-fluorouracil, docetaxel, paclitaxel, cetuximab, panitumumab,
erlotinib and gefitinib (9,10). However, these findings are limited to
artificial cell culture systems, and clinical evidence is required
to strengthen our hypotheses. Notably, it has also demonstrated
that MAGE-A11 expression is correlated with a poorer prognosis for
breast cancer (11). Similar results
were reported by Minges et al for castration-recurrent
prostate cancers (12).
In addition to the association between several
subgroups and a poor prognosis, MAGE-A expression is also an
important predictor of malignant transformation. A study by Ries
et al clearly showed that MAGE-A expression is restricted to
oral leukoplakia tissues that transform into invasive cancer, and
is not present in leukoplakia without progression to malignancy
(13). Complementing these findings,
we previously showed that MAGE-A expression is found in leukoplakia
with dysplasia and carcinoma in situ, but not in benign
lesions, such as ulcers or epulis (14).
The present study was designed to quantify the
expression of all known MAGE-A antigens at the tumor center and the
tumor front with respect to the UICC stages of the patients
investigated. The differences between the different sites (invasive
front vs. tumor center), and between limited and advanced disease
[Union for International Cancer Control (UICC) stage I vs. IV] were
analyzed. In addition, the probable role of a cumulative MAGE-A
expression score was assessed.
Patients and methods
Patients and tissues
The data investigated in this study were collected
from patients with oral squamous cell carcinoma (OSCC) who were
treated between August 2001 and August 2003 at the Department of
Oral and Maxillofacial Plastic Surgery of the University Hospital
Würzburg (Würzburg, Germany). The tissue samples were provided by
the Institute of Pathology of the University of Würzburg (Würzburg,
Germany). The tumor locations consisted of the lip, tongue, cheek,
tonsil, palate and oropharynx. None of the tumors originated from
the respiratory epithelium. After an initial screening, the
patients were subdivided into two groups by clinically- or
pathologically-confirmed tumor stage, which was determined
according to the UICC criteria (15).
The group with stage I cancers consisted of 23 patients (16 males
and 7 females), with a mean age of 66.52 years [standard deviation
(SD), ±13.95]. The group with stage IV cancers consisted of 15
patients (11 males and 4 females), with a mean age of 53.36 years
(SD, ±9.95). The patients were classified as stage IV based on the
presence of T4 (11 patients) or N2 (4 patients) disease. None of
the patients had confirmed distant metastasis. The identification
of the tumor center and invasive front was supported by an expert
pathologist. The study was approved by the ethics committee of the
University of Würzburg (reference, 20160508 01).
Tissue microarrays (TMAs) and
immunohistochemical staining
For TMA preparation, paraffin-embedded samples of
the OSCCs were used. From each specimen, a sample of the tumor
front and tumor center were constructed, represented by three
0.6-mm cores with a thickness of 1 µm. The TMA were mounted on
saline-coated slides. Phosphate-buffered saline was used as a
diluent for the washing and rinsing steps throughout the protocol
for TMA preparation. Following deparaffinization [with xylene and
decreasing concentrations of ethanol (100–70%)] and consecutive
rehydration, antigen retrieval was performed by autoclaving the
samples for 15 min in distinct saline buffers (Table I). Next, the sections were incubated
with the MAGE-A primary antibodies (Table
I) at room temperature for 60 min. Subsequent to washing, the
secondary antibody [ADVANCE™ Horseradish peroxidase (HRP) Link] was
added for another 20 min. ADVANCE HRP enzyme was then added for 20
min. Afterwards, detection was performed with a Dako ADVANCE system
and 3,3′-diaminobenzidine was used as the chromogen (all Pathology
Products Dako Deutschland GmbH, Hamburg, Germany). Finally, the
slides were counterstained with hematoxylin. Anonymized adult
testis tissue from the Institute of Pathology of the University of
Würzburg served as positive controls for immunohistochemical
staining. Lung and testis tissues without secondary antibody
staining served as negative controls.
 | Table I.Origin, dilution and source of the
MAGE-A antibodies used in the study. |
Table I.
Origin, dilution and source of the
MAGE-A antibodies used in the study.
| Antigen | Origin | Heat buffer | Dilution | Source |
|---|
| MAGE-A1 | Rabbit | CA |
1:100 | Antibodies online
GmbH (Aachen, Germany) |
| MAGE-A2 | Rabbit | TR | 1:20 | Santa Cruz
Biotechnology, Inc. (Dallas, TX, USA) |
| MAGE-A3 | Rabbit | CA |
1:100 | Novus Biologicals
(Littleton, CO, USA) |
| MAGE-A4 | Rabbit | TR | 1:40 | Abnova (Taipei,
Taiwan) |
| MAGE-A5 | Rabbit | CA |
1:100 | Antibodies online
GmbH (Aachen, Germany) |
| MAGE-A6 | Rabbit | CA |
1:100 | Antibodies online
GmbH (Aachen, Germany) |
| MAGE-A8 | Rabbit | TR | 1:30 | Santa Cruz
Biotechnology, Inc. (Dallas, TX, USA) |
| MAGE-A9 | Rabbit | TR | 1:10 | Santa Cruz
Biotechnology, Inc. (Dallas, TX, USA) |
| MAGE-A10 | Rabbit | TR | 1:10 | Abnova (Taipei,
Taiwan) |
| MAGE-A11 | Rabbit | TR | 1:40 | Santa Cruz
Biotechnology, Inc. (Dallas, TX, USA) |
| MAGE-A12 | Rabbit | TR | 1:10 | Abnova (Taipei,
Taiwan) |
Semiquantitative staining score
To express the amount of staining, a
semiquantitative method (immunoreactive score) was used, as
described previously (16). For each
section (tumor front or center) a multiplicative score was
determined. The immunoreactivity score (IRS) with arbitrary units
was calculated by multiplying the amount of staining by the
percentage of positive cells (Table
II). Based on the scoring system provided in Table II, the score of each specimen ranged
between 0 and 12 arbitrary units. In addition to rating the tumor
center and the invasive front separately, the total expression for
every subgroup and patient was also summed up (IRS total = IRS
invasive front + IRS tumor center).
| Table II.Characteristics of the
semiquantitative immunohistochemical staining score. |
Table II.
Characteristics of the
semiquantitative immunohistochemical staining score.
| Score | Characteristic |
|---|
| Amount of
staining |
|
| 0 | No reaction |
| 1 | Weak reaction |
| 2 | Modest reaction |
| 3 | Strong reaction |
| Percentage of
positive cells |
|
| 0 | Negative |
| 1 | <10% positive
cells |
| 2 | 10–50% positive
cells |
| 3 | 51–80% positive
cells |
| 4 | >80% positive
cells |
Statistical analysis
For the statistical analysis and visualization of
the data, the GraphPad Prism 6.04 software program (GraphPad
Software Inc., La Jolla, CA, USA) was utilized. Due to the number
of biopsies, differences between the stage I and IV group specimens
were analyzed by the two-tailed Mann-Whitney test. P≤0.05 was used
to indicate a statistically significant difference.
Results
MAGE-A expression is found in the
invasive front and the tumor center
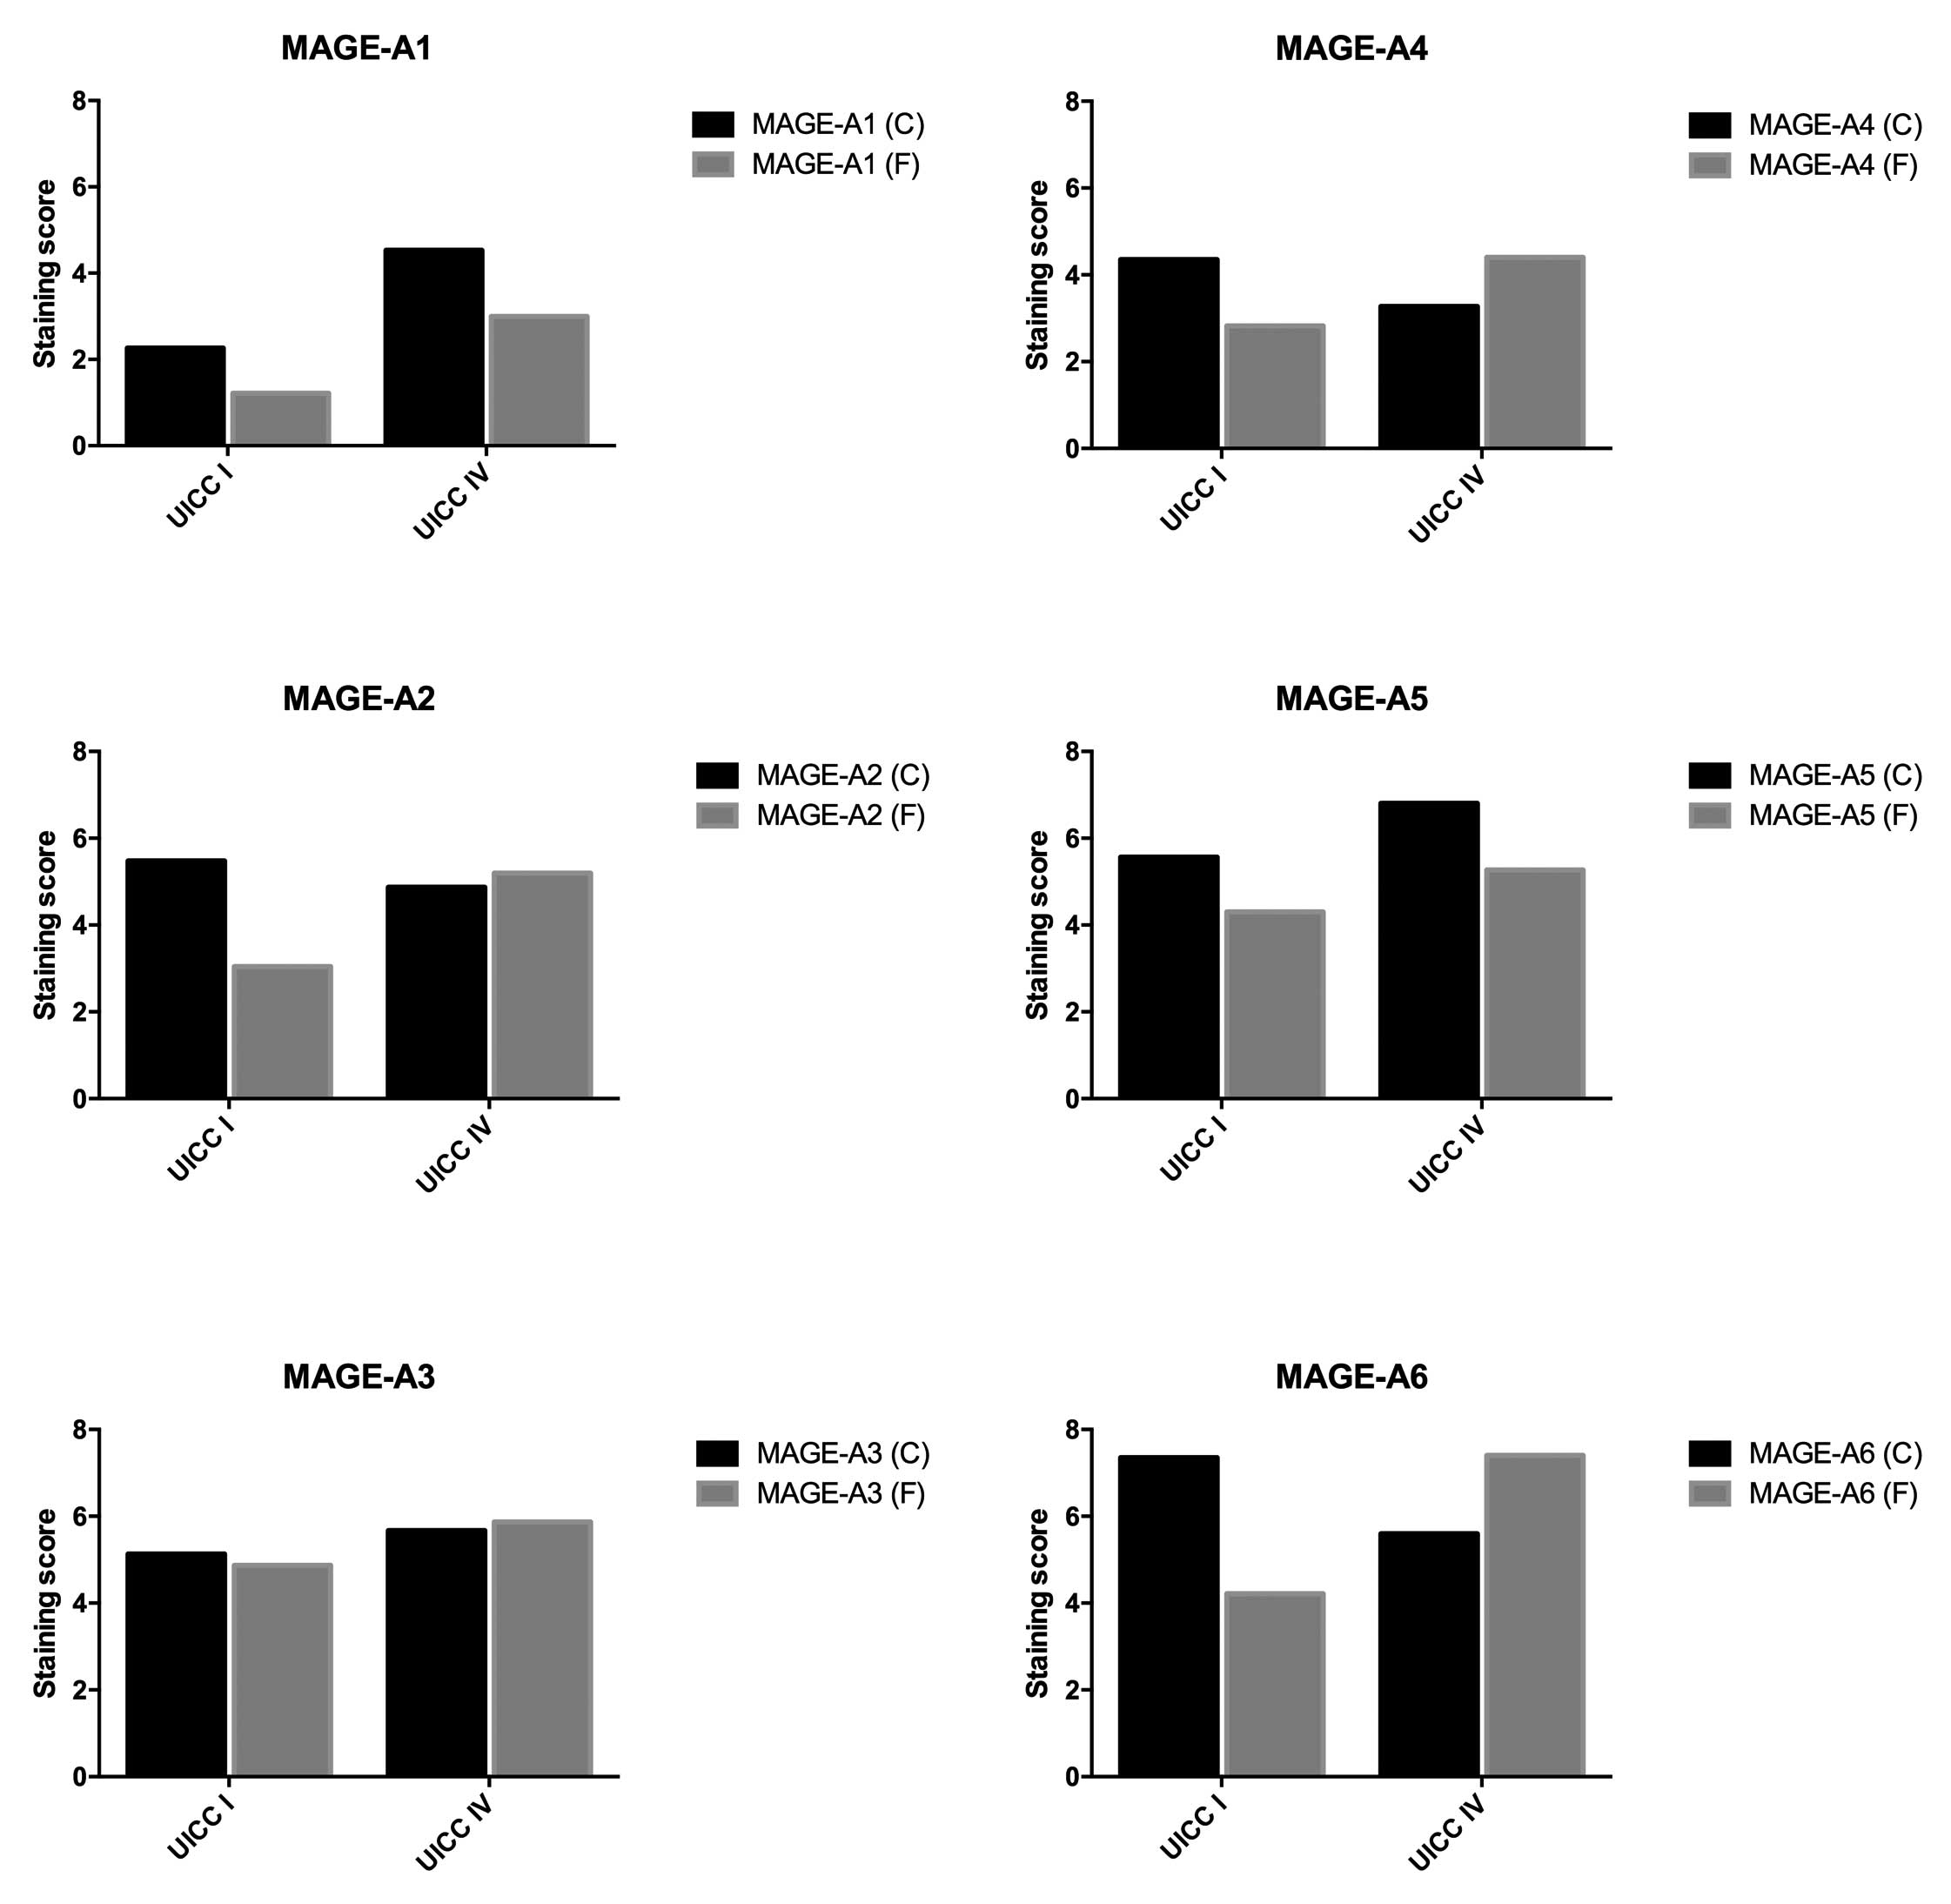
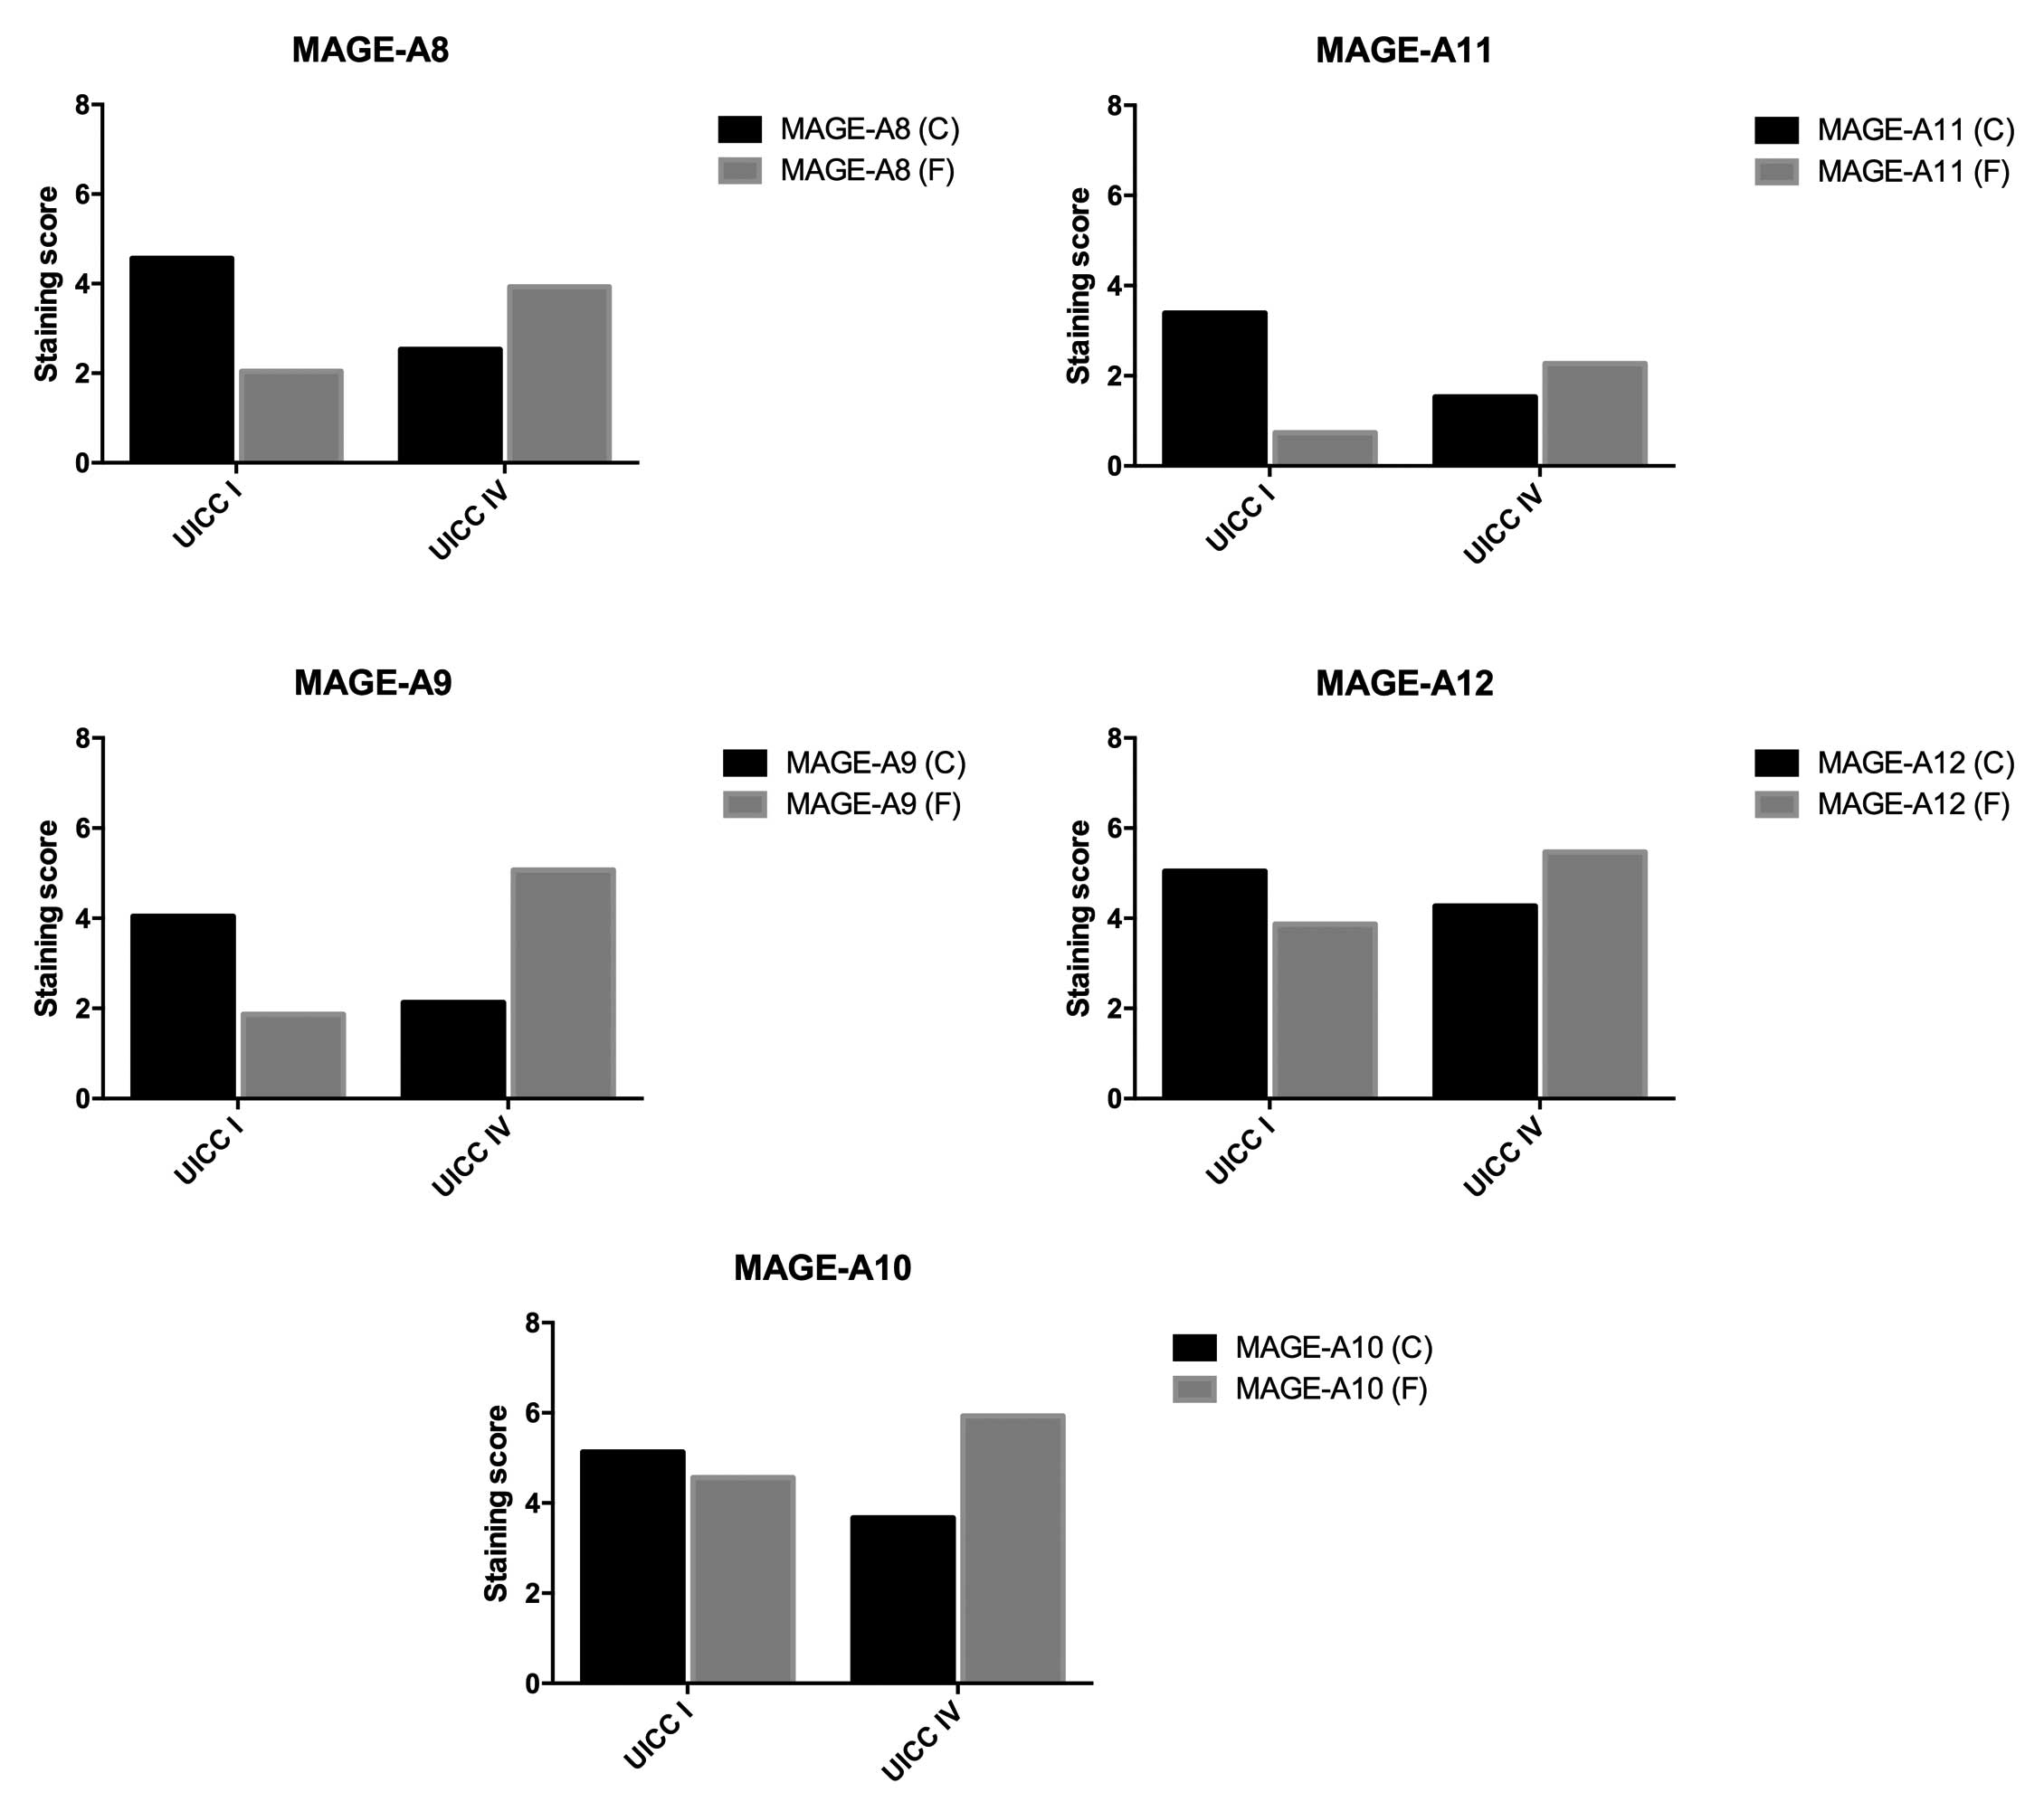
In general, different expression levels of all
MAGE-A subgroups were detected in the stage I and IV cancers
(Figs. 1 and 2). In the stage I group, the lowest
expression in the tumor center was found for MAGE-A1 (2.26) and the
highest expression was found for MAGE-A6 (7.35). At the invasive
front, the lowest expression was again found for MAGE-A1 (1.22),
while the highest expression was observed for MAGE-A3 (4.87). In
contrast to these findings, in the stage IV group, MAGE-A5 showed
the highest expression at the tumor center (6.8) and MAGE-A11
showed the lowest expression (1.53). Regarding the invasive front,
MAGE-A11 showed the lowest expression (2.27) and MAGE-A6 showed the
highest expression (7.4) (Tables
III and IV). Every MAGE-A
subgroup was found to be expressed in all four investigated groups
(invasive front and center in stages I and IV). In the stage I
group, the mean cumulative MAGE-A expression ranged from 3.48 for
MAGE-A1 to 11.57 for MAGE-A6. By contrast, the lowest mean
cumulative MAGE-A expression in the stage IV group was observed for
MAGE-A11 (3.8). MAGE-A6 yielded the highest mean cumulative
expression (13.0).
| Table III.Comparison of the MAGE-A expression at
the tumor center using the Mann-Whitney test. |
Table III.
Comparison of the MAGE-A expression at
the tumor center using the Mann-Whitney test.
| MAGE-A subgroup | UICC stage I | UICC stage IV | P-value |
|---|
| A1 | 2.26 | 4.53 | 0.0537 |
| A2 | 5.48 | 4.87 | 0.6158 |
| A3 | 5.13 | 5.67 | 0.6272 |
| A4 | 4.35 | 3.27 | 0.8173 |
| A5 | 5.57 | 6.80 | 0.4563 |
| A6 | 7.35 | 5.60 | 0.1457 |
| A8 | 4.57 | 2.53 | 0.4922 |
| A9 | 4.04 | 2.13 | 0.4953 |
| A10 | 5.13 | 3.67 | 0.4953 |
| A11 | 3.39 | 1.53 | 0.1256 |
| A12 | 5.04 | 4.27 | 0.6494 |
| Table IV.Comparison of the MAGE-A expression
at the invasive front using the Mann-Whitney test. |
Table IV.
Comparison of the MAGE-A expression
at the invasive front using the Mann-Whitney test.
| MAGE-A
subgroup | UICC stage I | UICC stage IV | P-value |
|---|
| A1 | 1.22 | 3.00 | 0.0400a |
| A2 | 3.04 | 5.20 | 0.1263 |
| A3 | 4.87 | 5.87 | 0.4067 |
| A4 | 2.83 | 4.40 | 0.1032 |
| A5 | 4.30 | 5.27 | 0.3014 |
| A6 | 4.22 | 7.40 | 0.0331a |
| A8 | 2.04 | 3.93 | 0.0434a |
| A9 | 1.87 | 5.07 | 0.0060a |
| A10 | 4.57 | 5.93 | 0.2370 |
| A11 | 0.74 | 2.27 | 0.0249a |
| A12 | 3.87 | 5.47 | 0.2213 |
Cumulative MAGE-A expression score is
not associated with different UICC stages
The cumulative MAGE-A expression score in the UICC
stage I cancers was 85.87 (SD, ±51.76) and that in stage IV cancers
was 98.67 (SD, ±40.26). The Mann-Whitney test used to compare the
groups showed no significant differences in the expression scores
between stage I and stage IV cancers (P=0.5014).
MAGE-A expression at the tumor center
shows a tendency to differ between UICC stages I and IV
To compare the expression of the different subgroups
in the tumor center between stage I and stage IV cancers, the
Mann-Whitney test was used. The MAGE-A1, -A3 and -A5 subgroups were
more strongly expressed in UICC stage IV cancers compared with UICC
stage I tumors. However, no subgroup showed significantly different
expression at the tumor center in a comparison of stage I and stage
IV cancers. For MAGE-A1, a trend could be observed, but this was
not statistically significant (P=0.0537) (Table III).
MAGE-A expression is significantly
higher at the invasive front in UICC stage IV cancers
As shown in Table IV,
the expression of all MAGE-A subgroups at the invasive front was
higher in stage IV cancers than in stage I cancers. This finding
was significant for MAGE-A1 (P=0.0400), -A6 (P=0.0331), -A8
(P=0.0434), -A9 (P=0.0060) and-A11 (P=0.0249).
Ratios of expression in the tumor
center and invasive front are different in UICC stage I and stage
IV cancers
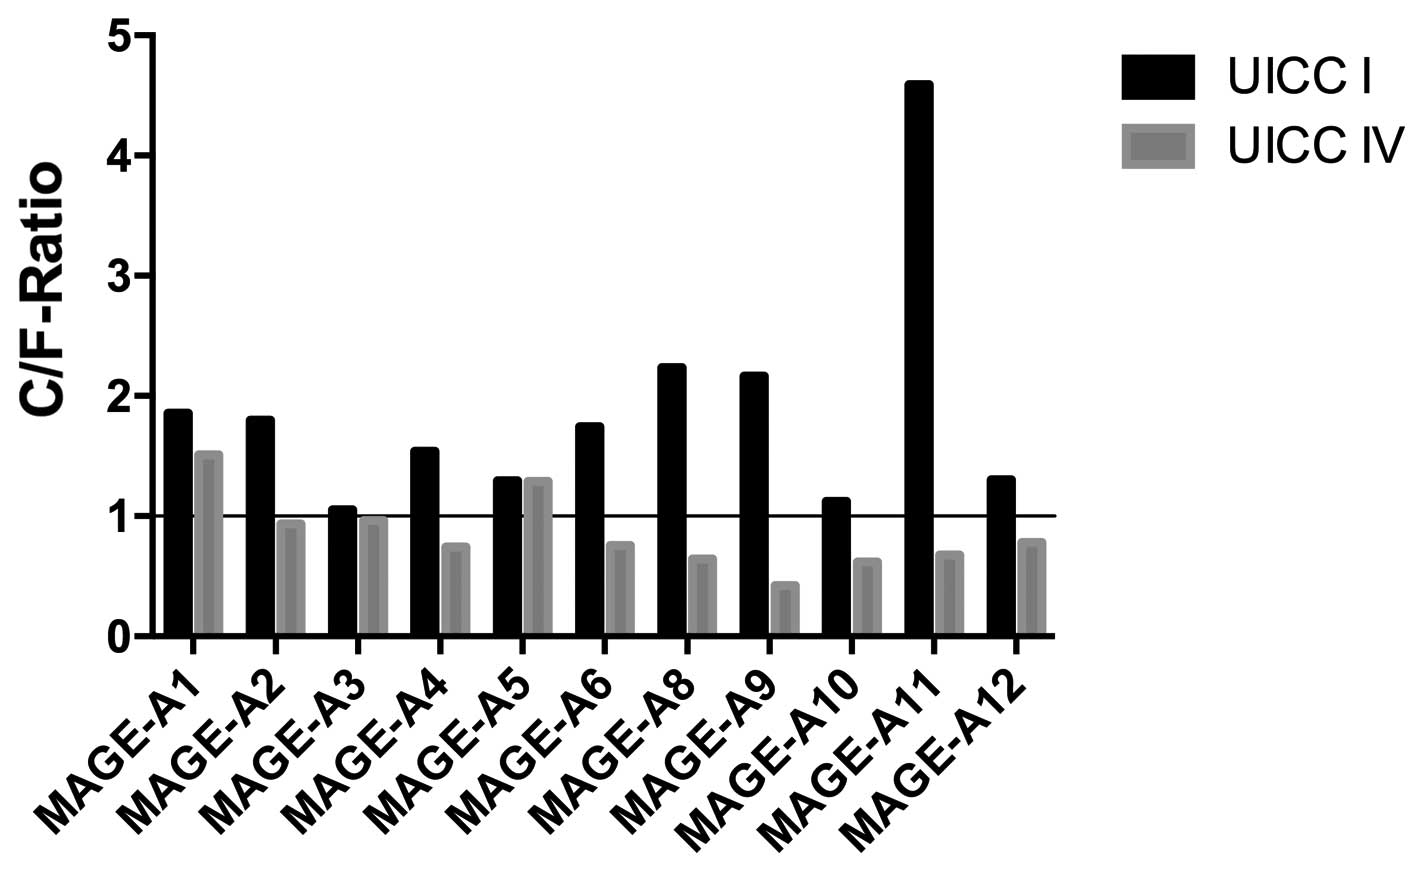
To clarify possible changes in the MAGE-A expression
pattern from limited to advanced disease, the ratio of MAGE-A
expression at the tumor center compared with that at the invasive
front (C/F ratio) was examined. As shown in Fig. 3, in stage I cancers, this ratio was
always >1.0. The highest C/F ratio in the stage I cancers was
observed for MAGE-A11 (4.59). The lowest C/F ratio was observed for
MAGE-A3 (1.05). By contrast, in 9 out of the 11 (81.8%) MAGE-A
subgroups, the ratio was <1.0 in the advanced cancers (UICC
stage IV). The highest C/F ratio was observed for MAGE-A1 (1.51),
while the lowest was observed for MAGE-A9 (0.42). Thus, the largest
change in the C/F ratio from stage I to stage IV was observed in
MAGE-A11 (4.59 vs. 0.68). The smallest change was observed in
MAGE-A5 (1.2929 vs. 1.2911).
Discussion
To the best of our knowledge, this is the first
study to investigate the changes in MAGE-A expression in the tumor
front and the tumor center in the early and later stages of cancer.
Considering the large number of studies that have investigated
markers of malignancy in head and neck cancer (17–20), the
38 samples examined in the present study are adequate for a first
overview, although large-scale studies will be required to confirm
the findings. All investigated MAGE-A subgroups were detected in
the stage I and IV cancers, although not every patient showed
expression of all subgroups. At the tumor center of stage I
cancers, MAGE-A6 expression yielded the highest staining. In an
in vitro analysis, Müller-Richter et al also showed
high levels of MAGE-A6 in comparison to other subgroups in a panel
of established head and neck cancer cell lines (21). By contrast, the UICC stage IV cancers
in the present study showed the highest expression of MAGE-A5 at
the tumor center. This is important as we recently showed a
correlation between a lower response to epidermal growth factor
receptor (EGFR) antibodies (panitumumab) and the high expression of
MAGE-A5 in several head and neck cancer cell lines (10). This is particularly significant as
patients with advanced head and neck tumors are increasingly being
treated with targeted therapies, including EGFR antibodies,
indicating the clinical relevance of the finding. Investigating the
MAGE-A5 status prior to the administration of anti-EGFR therapy
could aid in supporting clinical decisions.
At the invasive front of limited head and neck
cancers (UICC stage I), the highest staining rate was found for
MAGE-A3 in the present study. Notably, MAGE-A3 has been widely
described by previous studies and serves as a target for
vaccination in the treatment of head and neck tumors (22,23). These
studies have shown encouraging results and shed light on novel
treatment options for patients suffering from advanced tumors of
the head and neck. In contrast to these previous studies, the
present study detected MAGE-A6 as the most highly expressed at the
invasive front of UICC stage IV cancers.
As the different functions and crosslinks among the
11 MAGE-A subgroups are not yet completely understood, the use of
the cumulative MAGE-A expression as an element for distinguishing
between limited and advanced stages of disease was considered in
the present study. The cumulative expression was indeed higher in
the UICC stage IV group (98.67 vs. 85.87), but this finding was not
significant. By comparing the subgroup expression in the tumor
center, higher staining was detected for MAGE-A1, -A3 and -A5 in
the UICC stage IV cancers. For the other subgroups, the staining
rates were higher in UICC stage I cancers. However, the difference
was not significant for any of the subgroups tested. In clear
contrast to that finding, higher staining was observed for all
MAGE-A proteins in the invasive front for the UICC stage IV group.
These findings were significant for MAGE-A1 (P=0.0400), -A6
(P=0.0331), -A8 (P=0.0434), -A9 (P=0.0060) and -A11 (P=0.0249).
A marked change was clearly present in the
expression patterns in the tumor front and center during the
progression of the studied malignancies. MAGE-A9 and-A11 are worthy
of note in this context. Recently, Han et al provided
evidence of a poor prognosis in patients with laryngeal squamous
cell carcinomas expressing high levels of MAGE-A9 (24). In addition, we have previously
provided strong evidence that MAGE-A11 is correlated with the
reduced effects of numerous agents commonly used for the treatment
of head and neck cancer, such as cisplatin, 5-fluorouracil,
docetaxel, paclitaxel, cetuximab and panitumumab (9,10).
Furthermore, this finding has also been confirmed for erlotinib and
gefitinib (25). Notably, comparable
to our previous results in cell culture, the MAGE-A11 expression in
the TMAs was only modest (25).
However, its expression can likely be used to separate patients
with a higher risk from those with a lower risk. As outlined for
breast and prostate cancer (11,26),
MAGE-A11 may play a role in the growth and progression of head and
neck cancer.
By investigating the tumor center and invasive front
separately in limited and advanced stages of the disease, the
present study was able to obtain the first insights into the
changes of MAGE-A expression that occur during cancer progression.
To the best of our knowledge, the present study is the first to
describe a significant change in the MAGE-A pattern in head and
neck cancer from UICC stage I to IV. By calculating the C/F ratio
for each MAGE-A subgroup, intense changes were identified from UICC
stage I to IV. While the C/F ratios in limited disease were always
>1.0, indicating a stronger MAGE-A expression in the tumor
center, this ratio changed in 9 out of 11 MAGE-A subgroups in
samples of advanced disease. With the exception of MAGE-A1 and -A5,
all other subgroups were more highly expressed at the invasive
front of advanced-stage tumors. As an advanced stage based on the
UICC criteria always represents distinct local invasion or
regional/distant metastatic spread, the relocation of MAGE-A
proteins from the tumor center to the invasive front could be
considered to contribute to malignancy. Notably, this effect was
the strongest for MAGE-A11, the subgroup previously identified as a
predictor of decreased treatment efficacy in head and neck cancer
cell lines. In summary, the present findings warrant further
investigation into the MAGE-A proteins, particularly the role of
MAGE-A11, in head and neck cancer.
Acknowledgements
Language editing support was provided by American
Journal Experts.
References
|
1
|
Kamangar F, Dores GM and Anderson WF:
Patterns of cancer incidence, mortality, and prevalence across five
continents: Defining priorities to reduce cancer disparities in
different geographic regions of the world. J Clin Oncol.
24:2137–2150. 2006. View Article : Google Scholar : PubMed/NCBI
|
|
2
|
Torre LA, Bray F, Siegel RL, Ferlay J,
LortetTieulent J and Jemal A: Global cancer statistics, 2012. CA
Cancer J Clin. 65:87–108. 2015. View Article : Google Scholar : PubMed/NCBI
|
|
3
|
Hamoir M, Schmitz S and Gregoire V: The
role of neck dissection in squamous cell carcinoma of the head and
neck. Curr Treat Options Oncol. 15:611–624. 2014. View Article : Google Scholar : PubMed/NCBI
|
|
4
|
van der Bruggen P, Traversari C, Chomez P,
Lurquin C, De Plaen E, Van den Eynde B, Knuth A and Boon T: A gene
encoding an antigen recognized by cytolytic T lymphocytes on a
human melanoma. Science. 254:1643–1647. 1991. View Article : Google Scholar : PubMed/NCBI
|
|
5
|
AbdElsalam EA and Ismaeil NA:
Melanoma-associated antigen genes: A new trend to predict the
prognosis of breast cancer patients. Med Oncol. 31:2852014.
View Article : Google Scholar : PubMed/NCBI
|
|
6
|
Laban S, Atanackovic D, Luetkens T, Knecht
R, Busch CJ, Freytag M, Spagnoli G, Ritter G, Hoffmann TK, Knuth A,
et al: Simultaneous cytoplasmic and nuclear protein expression of
melanoma antigen-A family and NY-ESO-1 cancer-testis antigens
represents an independent marker for poor survival in head and neck
cancer. Int J Cancer. 135:1142–1152. 2014. View Article : Google Scholar : PubMed/NCBI
|
|
7
|
Li G, Song P and Zhang B: Expression and
significance of MAGE genes in human lung cancer. Zhongguo Fei Ai Za
Zhi. 16:308–313. 2013.PubMed/NCBI
|
|
8
|
Monte M, Simonatto M, Peche LY, Bublik DR,
Gobessi S, Pierotti MA, Rodolfo M and Schneider C: MAGE-A tumor
antigens target p53 transactivation function through histone
deacetylase recruitment and confer resistance to chemotherapeutic
agents. Proc Natl Acad Sci USA. 103:11160–11165. 2006. View Article : Google Scholar : PubMed/NCBI
|
|
9
|
Hartmann S, Kriegebaum U, Küchler N,
Brands RC, Linz C, Kübler AC and Müller-Richter UD: Correlation of
MAGE-A tumor antigens and the efficacy of various chemotherapeutic
agents in head and neck carcinoma cells. Clin Oral Investig.
18:189–197. 2014. View Article : Google Scholar : PubMed/NCBI
|
|
10
|
Hartmann S, Kriegebaum U, Küchler N,
Lessner G, Brands RC, Linz C, Schneider T, Kübler AC and
Müller-Richter UD: Efficacy of cetuximab and panitumumab in oral
squamous cell carcinoma cell lines: Prognostic value of MAGE-A
subgroups for treatment success. J Craniomaxillofac Surg.
41:623–629. 2013. View Article : Google Scholar : PubMed/NCBI
|
|
11
|
Xia LP, Xu M, Chen Y and Shao WW:
Expression of MAGE-A11 in breast cancer tissues and its effects on
the proliferation of breast cancer cells. Mol Med Rep. 7:254–258.
2013.PubMed/NCBI
|
|
12
|
Minges JT, Su S, Grossman G, Blackwelder
AJ, Pop EA, Mohler JL and Wilson EM: Melanoma antigen-A11
(MAGE-A11) enhances transcriptional activity by linking androgen
receptor dimers. J Biol Chem. 288:1939–1952. 2013. View Article : Google Scholar : PubMed/NCBI
|
|
13
|
Ries J, Agaimy A, Vairaktaris E, Gorecki
P, Neukam FW, Strassburg LH and Nkenke E: Detection of MAGE-A
expression predicts malignant transformation of oral leukoplakia.
Cancer Invest. 30:495–502. 2012. View Article : Google Scholar : PubMed/NCBI
|
|
14
|
Krauss E, Rauthe S, Gattenlöhner S,
Reuther T, Kochel M, Kriegebaum U, Kübler AC and Müller-Richter UD:
MAGE-A antigens in lesions of the oral mucosa. Clin Oral Investig.
15:315–320. 2011. View Article : Google Scholar : PubMed/NCBI
|
|
15
|
Greene FL, Page DL, Fleming ID, Fritz A,
Balch CM, Haller DG and Morrow M: AJCC cancer staging manual. 6th
edition. Springer; New York: 2002, View Article : Google Scholar
|
|
16
|
Remmele W and Stegner HE: Recommendation
for uniform definition of an immunoreactive score (IRS) for
immunohistochemical estrogen receptor detection (ER-ICA) in breast
cancer tissue. Pathologe. 8:138–140. 1987.(In German). PubMed/NCBI
|
|
17
|
Hildebrand LC, Carvalho AL, Lauxen IS, Nör
JE, Cerski CT and Sant'Ana Filho M: Spatial distribution of cancer
stem cells in head and neck squamous cell carcinomas. J Oral Pathol
Med. 43:499–506. 2014. View Article : Google Scholar : PubMed/NCBI
|
|
18
|
Lindberg P, Larsson A and Nielsen BS:
Expression of plasminogen activator inhibitor-1, urokinase receptor
and laminin gamma-2 chain is an early coordinated event in
incipient oral squamous cell carcinoma. Int J Cancer.
118:2948–2956. 2006. View Article : Google Scholar : PubMed/NCBI
|
|
19
|
Ries J, SchultzeMosgau S, Neukam F, Diebel
E and Wiltfang J: Investigation of the expression of melanoma
antigen-encoding genes (MAGE-A1 to-A6) in oral squamous cell
carcinomas to determine potential targets for gene-based cancer
immunotherapy. Int J Oncol. 26:817–824. 2005.PubMed/NCBI
|
|
20
|
van den Brand M, Takes RP,
Blokpoel-deRuyter M, Slootweg PJ and van Kempen LC: Activated
leukocyte cell adhesion molecule expression predicts lymph node
metastasis in oral squamous cell carcinoma. Oral Oncol. 46:393–398.
2010. View Article : Google Scholar : PubMed/NCBI
|
|
21
|
MullerRichter UD, Dowejko A, Reuther T,
Kleinheinz J, Reichert TE and Driemel O: Analysis of expression
profiles of MAGE-A antigens in oral squamous cell carcinoma cell
lines. Head Face Med. 5:102009. View Article : Google Scholar : PubMed/NCBI
|
|
22
|
Voskens CJ, Sewell D, Hertzano R, DeSanto
J, Rollins S, Lee M, Taylor R, Wolf J, Suntharalingam M, Gastman B,
et al: Induction of MAGE-A3 and HPV-16 immunity by Trojan vaccines
in patients with head and neck carcinoma. Head Neck. 34:1734–1746.
2012. View Article : Google Scholar : PubMed/NCBI
|
|
23
|
Zandberg DP, Rollins S, Goloubeva O,
Morales RE, Tan M, Taylor R, Wolf JS, Schumaker LM, Cullen KJ,
Zimrin A, et al: A phase I dose escalation trial of MAGE-A3-and
HPV16-specific peptide immunomodulatory vaccines in patients with
recurrent/metastatic (RM) squamous cell carcinoma of the head and
neck (SCCHN). Cancer Immunol Immunother. 64:367–379. 2015.
View Article : Google Scholar : PubMed/NCBI
|
|
24
|
Han L, Jiang B, Wu H, Zhang S and Lu X:
Expression and prognostic value of MAGE-A9 in laryngeal squamous
cell carcinoma. Int J Clin Exp Pathol. 7:6734–6742. 2014.PubMed/NCBI
|
|
25
|
Hartmann S, Brands RC, Küchler N, Fuchs A,
Linz C, Kübler AC and Müller-Richter UD: Melanoma-associated
antigen expression and the efficacy of tyrosine kinase inhibitors
in head and neck cancer. Oncol Lett. 10:1211–1217. 2015.PubMed/NCBI
|
|
26
|
Wilson EM: Androgen receptor molecular
biology and potential targets in prostate cancer. Ther Adv Urol.
2:105–117. 2010. View Article : Google Scholar : PubMed/NCBI
|