Introduction
In recent years, the development of comprehensive
therapy (surgical resection combined with chemo-, immuno- or
radiotherapy) (1) has reduced the
mortality rate of patients with breast cancer (2,3). However,
the mortality of patients with triple-negative breast cancer (TNBC)
remains high (4–6). TNBC is a specific subtype of breast
cancer that is distinguished by a lack of estrogen receptor (ER),
progesterone receptor (PR), and human epidermal growth factor
receptor 2 (HER-2) expression (7,8). TNBC is
characterized by aggressive clinical behavior, including early
distant metastasis, recurrence, a lack of specific therapeutic
targets and poorer prognosis than other subtypes of breast cancer
(9–11). Chemotherapy is the primary systemic
therapeutic approach for TNBC treatment, although only ~20% of
patients with TNBC are sensitive to chemotherapy (12). To improve the prognosis of TNBC, the
molecular and biological mechanisms that underlie its aggressive
behavior require clarification. The emergence of novel markers for
an effective targeted therapy could change the current TNBC
treatment strategies.
The cadherins are a family of cell-surface
glycoproteins responsible for mediating calcium-dependent
homophilic intercellular adhesion. The adhesive properties of
classical cadherin adhesion molecules serve an essential role in
the maintenance of tissue (13–16).
T-cadherin is an atypical cadherin lacking in the transmembrane and
cytoplasmic domains and is linked to the plasma membrane by the
glycosylphosphatidylinositol (GPI) anchor (17–19).
T-cadherin expression has been considered to be a
useful tool to stratify tumors and identify the degree of
T-cadherin involvement in specific steps of cancer progression
(20,21). Downregulation of T-cadherin is
frequently observed in multiple types of cancer, including ovarian
carcinoma (22), gastric cancer
(23), colorectal cancer (24), hepatocellular carcinoma (25), bladder transitional cell carcinoma
(26), breast cancer (27) and gallbladder cancer (19), and is generally associated with poor
patient outcome.
Previous studies have revealed that the process of
tumor cell development and invasion, induced by the epidermal
growth factor, may be inhibited by the high expression of
T-cadherin (28–30). Downregulation of T-cadherin expression
may be associated with the increased risk of malignant progression
and may therefore represent a potential biomarker for certain types
of cancer.
T-cadherin downregulation has been observed in
malignant breast tumors (31) and is
often methylated in primary and metastatic tumor tissues of
patients with breast cancer (32).
Toyooka et al (33) revealed
that T-cadherin may function as a tumor suppressor gene in breast
cancer. Taken together, these findings indicate that T-cadherin may
serve as a prognostic marker for breast cancer development
(31–33). Breast cancer is usually classified
into biologically distinct, behaviorally different subtypes by the
presence of immunohistochemically detected markers (34); however, the immunohistological
determination of T-cadherin expression in breast cancer is rarely
reported.
Previous studies revealed that a lack of T-cadherin
expression was significantly associated with poorer prognosis of
patients with axillary lymph node-positive breast cancer; a
multivariate analysis demonstrated that T-cadherin expression was
an independent prognostic factor for disease-free survival (DFS)
(P=0.002), but not for overall survival (OS) (P=0.067) (35), indicating that there may be an
association between the expression of T-cadherin and the prognosis
of patients with axillary lymph node-positive breast cancer. To
date, the role served by T-cadherin in the prognosis and metastasis
of TNBC remains unclear.
In the present study, immunohistochemistry was used
to determine the T-cadherin expression in 106 formalin-fixed TNBC
specimens. The current study aimed to assess the
clinicopathological significance of T-cadherin expression, and
examine whether T-cadherin expression was an independent predictor
of survival of the patients with TNBC.
Materials and methods
Subjects
A total of 106 females with TNBC who were enrolled
in the Jining No. 1 People's Hospital (Jining, China) between
January 2003 and December 2009 were randomly chosen for the present
study (age range, 22–75 years; mean age, 49.6 years). Patients with
invasive breast carcinoma were enrolled; patients with invasive
lobular carcinoma were excluded. All patients underwent
chemotherapy or chemotherapy in combination with radiotherapy, as
detailed in Table I. All patients
provided written informed consent.
 | Table I.Association between T-cadherin
expression and clinicopathological parameters in 106 patients with
triple-negative breast cancer. |
Table I.
Association between T-cadherin
expression and clinicopathological parameters in 106 patients with
triple-negative breast cancer.
| Parameters | T-cadherin-negative,
n (%) | T-cadherin-positive,
n (%) | χ2 | P-value |
|---|
| Age at surgery,
years |
|
|
|
|
| ≤55 | 53 (75.7) | 21 (58.3) |
|
|
|
>55 | 17 (24.3) | 15 (41.7) | 3.408 | 0.065 |
| Menopausal
status |
|
|
|
|
| Yes | 23 (32.9) | 16 (44.4) |
|
|
| No | 47 (67.1) | 20 (55.6) | 1.373 | 0.241 |
| Tumor size, cm |
|
|
|
|
| ≤2 | 14 (20.0) | 15 (41.7) |
|
|
|
>2 | 56 (80.0) | 21 (58.3) | 5.616 | 0.018 |
| BRE grade (39) |
|
|
|
|
| I | 17 (24.3) | 17 (47.2) |
|
|
| II and
III | 53 (75.7) | 19 (52.8) | 5.740 | 0.017 |
| Lymph-vascular
invasion |
|
|
|
|
|
Negative | 39 (55.7) | 17 (47.2) |
|
|
|
Positive | 31 (44.3) | 19 (52.8) | 0.688 | 0.407 |
| Lymph node
status |
|
|
|
|
|
Negative | 23 (32.9) | 19 (52.8) |
|
|
|
Positive | 47 (67.1) | 17 (47.2) | 3.944 | 0.047 |
| Histological
type |
|
|
|
|
|
IDC | 63 (90.0) | 33 (91.7) |
|
|
| Special
type | 7
(10.0) | 3 (8.3) | 0.077 | 0.781 |
| Family history |
|
|
|
|
| No | 57 (81.4) | 29 (80.6) |
|
|
|
Yes | 13 (18.6) | 7
(19.4) | 0.012 | 0.093 |
| TNM stage (40) |
|
|
|
|
|
I/II | 51 (72.9) | 28 (77.8) |
|
|
|
III | 19 (27.1) | 8 (22.2) | 0.303 | 0.582 |
| Therapy |
|
|
|
|
|
Chemotherapy +
radiotherapy | 49 (70.0) | 14 (38.9) |
|
|
|
Chemotherapy | 21 (30.0) | 22 (61.1) | 9.544 | 0.002 |
| Follow up |
|
|
|
|
|
Death | 17 (24.3) | 2 (5.6) |
|
|
|
Regional recurrence | 3 (4.3) | 1 (2.8) |
|
|
| Distant
metastasis | 23 (32.9) | 4 (11.1) |
|
|
| Lost
follow-up | 2 (2.9) | 1 (2.8) | 1.396 | 0.706 |
All tissues were immediately fixed in 10% formalin
for 24 h and embedded in paraffin. The clinicopathological features
were collected retrospectively and analyzed. According to the
results of pathological immunohistochemistry, the 106 patients were
divided into two groups, T-cadherin-negative and
T-cadherin-positive. The present study was approved by the Ethics
Committee of Jining No. 1 People's Hospital (Jining, China). No
significant differences were identified in the clinicopathological
information between the two groups. Demographic data of the
patients are listed in Table I.
Immunohistochemical (IHC)
staining
Staining was performed as described previously
(35). The following reagents were
used for the IHC assay and all purchased from Fuzhou Maixin
Biotechnology Development Co. Ltd. (Fuzhou, China):
3,3′-diaminobenzidine (DAB) color liquid, mouse anti-human
T-cadherin monoclonal antibody (catalog no. H00001012-M01A;
dilution, 1:100), Tris-buffered saline, an UltraSensitive™ SP
(mouse) IHC kit (KIT-9702) and PBS. The immunoreactive products
were visualized using a light microscope by the catalysis of DAB
using horseradish peroxidase in the presence of
H2O2 following extensive washing
(magnification, ×200). A total of 22 fields of view were assessed
and images were captured using a DP25 camera (Olympus Corporation,
Tokyo, Japan).
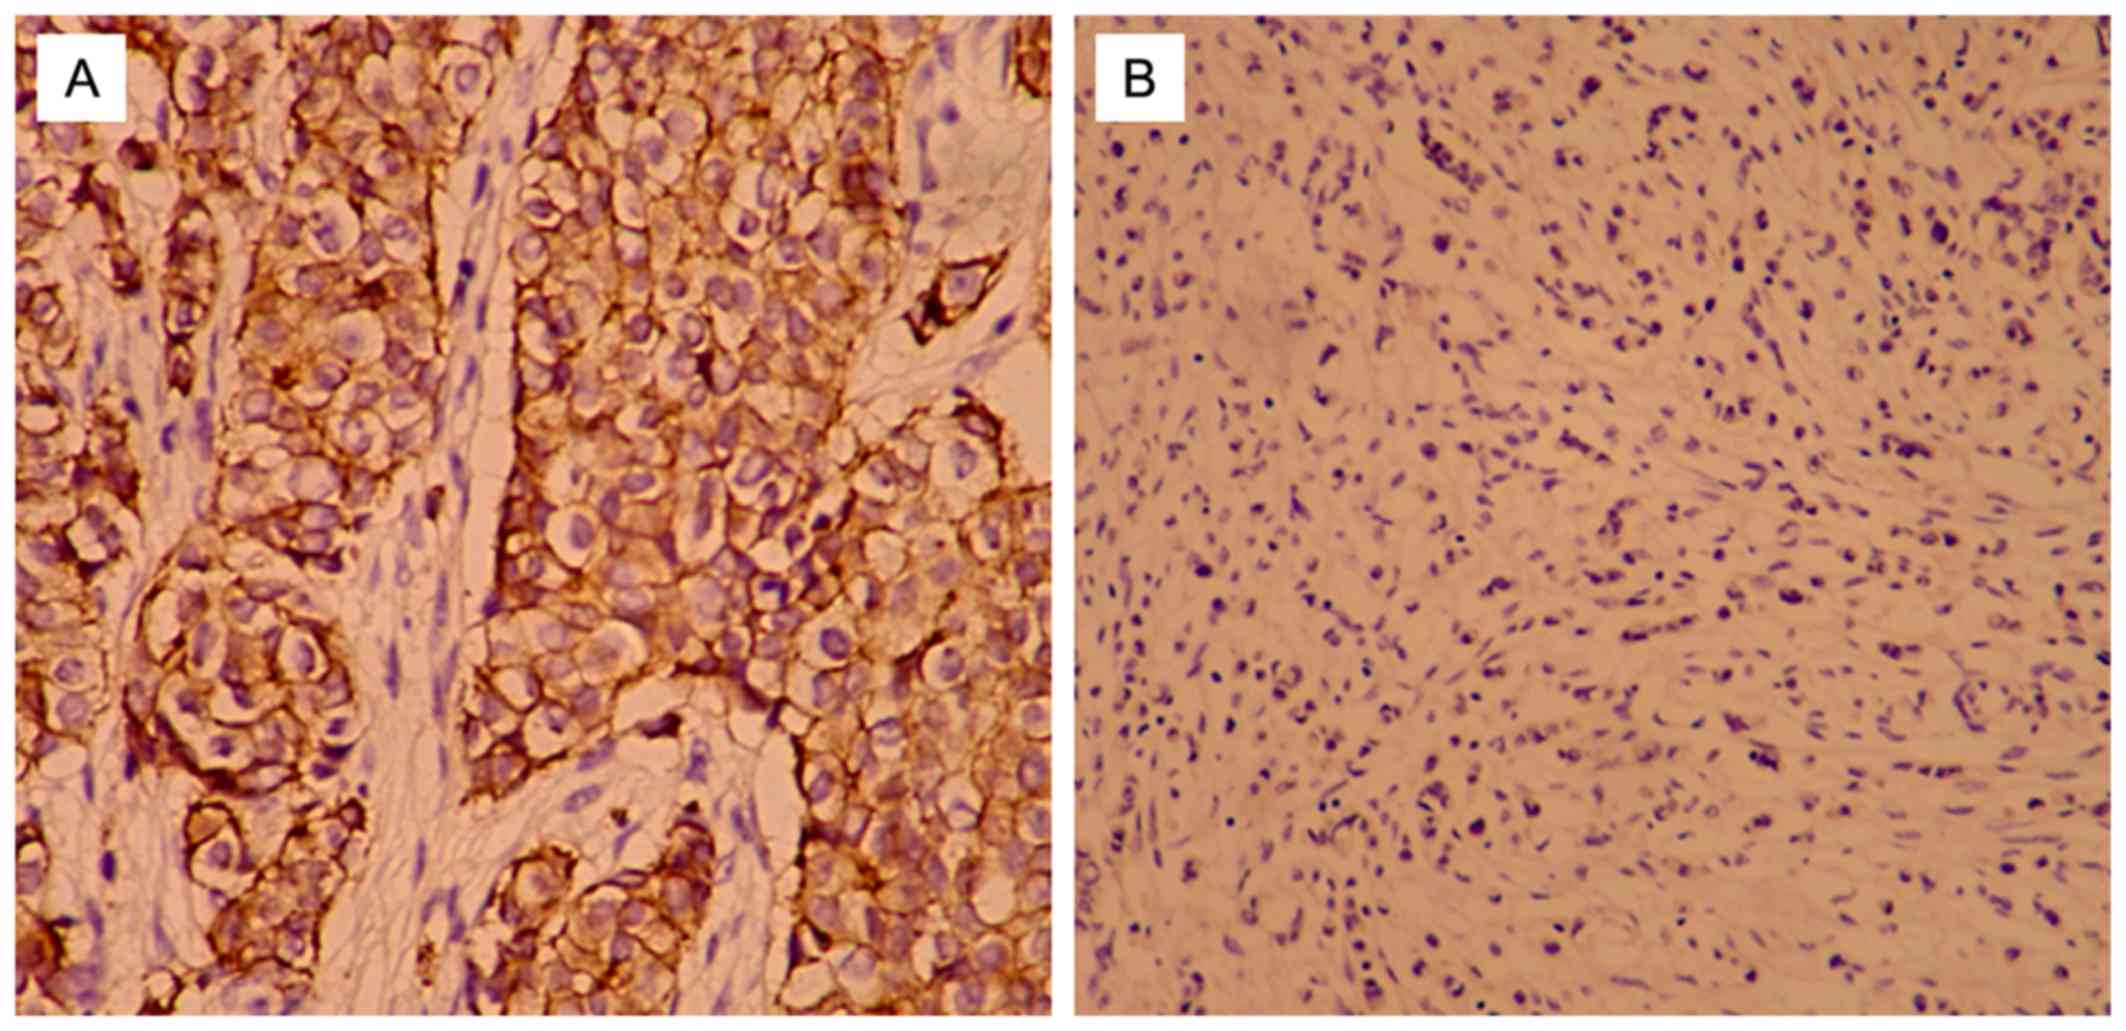
Positive staining of T-cadherin was primarily
observed at the cell membrane. For semi-quantitative analysis, the
positive cell staining intensity and percentage of cells stained
per slide were scored. The results of staining were (−), (+), (++),
and (+++) according to T-cadherin expression level. (−) and (+)
indicated that T-cadherin expression was negative, while (++) and
(+++) indicated that T-cadherin expression was positive (36). Staining intensity was determined as
follows: 0, no color; 1, light yellow; 2, brown; 3, tan. The
percentage of positively stained cells was defined as: 0, ≤20%; 1,
21–50%; 2, 51–75%; 3, >75%. The final scores were calculated by
considering the percentage of positively stained cells and staining
intensity results, as previously described (37): negative (−), 0; weak positive (+),
1–3; medium positive (++), 4–6; strong positive (+++), 7–9. The
immunohistochemical assessment was performed independently by two
experienced pathological physicians.
Determination of ER/PR/HER-2
The presence of HER-2 was determined using a
HercepTest kit (DakoCytomation, Carpinteria, CA, USA) according to
manufacturer's protocol. The presence of PR and ER was determined
immunohistochemically, using a monoclonal antibody targeted at PR
(clone 16; cat no. ORG-8721; pre-diluted) and a monoclonal antibody
targeted at ER (clone 611; cat no. ORG-8871; pre-diluted) (both
from Leica Microsystems, Inc., Buffalo Grove, IL, USA), according
to previously published procedures (38).
Follow up
Patients were followed up for 5 years. The 5-year
DFS was used to determine the primary endpoint and 5-year OS was
used to determine the secondary endpoint. DFS referred to the
interval from the time of surgery to the time of such events as
local relapse, distant metastasis, death from any cause, or the
last follow-up. The interval from the time of surgery to the time
of death or the last follow-up was used to define OS.
Statistical analysis
All data were analyzed using SPSS statistical
software (version 17.0; SPSS, Inc., Chicago, IL, USA). Besides
T-cadherin expression, the following clinicopathological parameters
were analyzed: Family history, age, menopausal status, lymph node
status, lymph-vascular invasion, tumor size, histological grade
[Elston-Ellis modification of Bloom-Richardson grading system;
Bloom-Richardson-Elston (BRE) score] (39), pathological status and histological
disease type (36). A χ2
test was employed to analyze the association between T-cadherin
expression and the clinicopathological parameters. Survival curves
based on T-cadherin expression were estimated using the
Kaplan-Meier product-limit method, and the log-rank test was used
to determine the influence of the T-cadherin expression on 5-year
DFS and OS. Kaplan-Meier function and Cox regression analyses were
used to analyze DFS and OS. P<0.05 was considered to indicate a
statistically significant difference.
Results
T-cadherin expression is associated
with clinicopathological parameters
Of the 106 patients with TNBC, T-cadherin-negative
patients accounted for 66.04% (70/106), and T-cadherin-positive
patients accounted for 33.96% (36/106). T-cadherin protein was
expressed at the cell membrane (Fig.
1) according to the results of immunohistochemical analysis. No
significant differences were identified between the two groups in
terms of family history, age, lymph-vascular invasion, pathological
stage [tumor-node-metastasis (TNM) staging was assessed according
to the staging system established by the American Joint Committee
on Cancer] (40), histological types
or menopausal status (P>0.05; Table
I). However, tumor size >2 cm, BRE grade II and III, and
positive lymph node status were more common in the negative group
compared with the positive group (80.0 vs. 58.3, 75.7 vs. 52.8, and
67.1 vs. 47.2%, respectively; P=0.018, P=0.017, and P=0.047)
(Table I).
T-cadherin was associated with
survival analyses
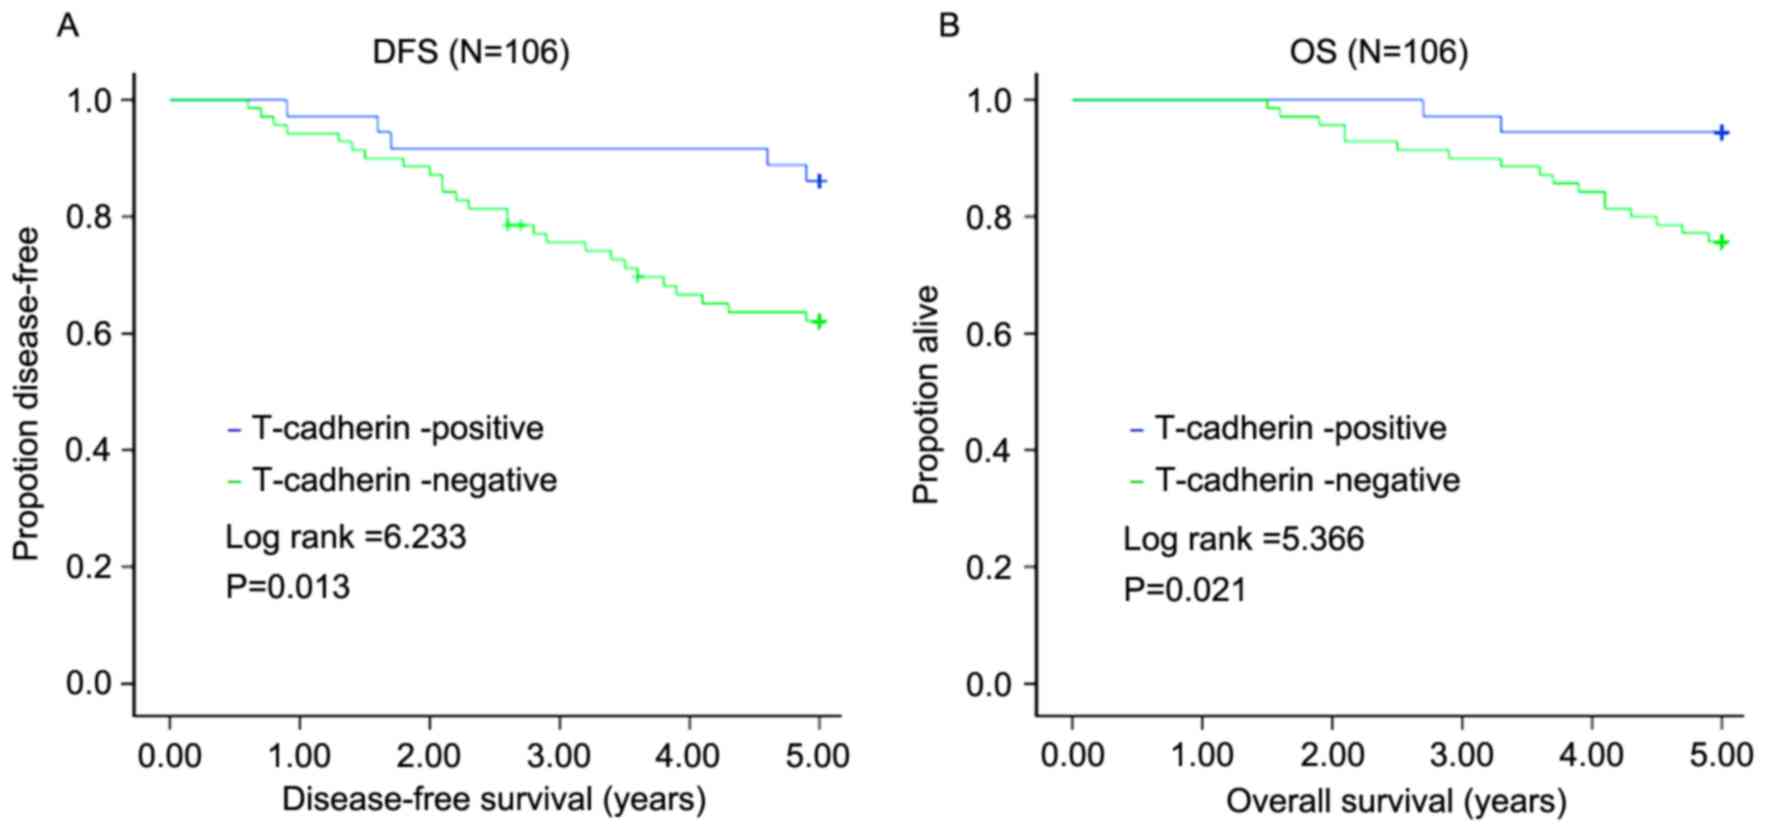
All 106 patients with TNBC were followed up for 5
years after surgery. In total, 31 (29.25%) suffered recurrence, 19
(17.92%) succumbed to the disease and 3 (2.1%) were lost to
follow-up during the 5 years. Of the 70 patients in the
T-cadherin-negative group, 26 (37.14%) suffered recurrence and 17
(24.29%) succumbed to the disease. The mean DFS of this group was
3.99 years, with a mean OS of 4.58 years. The 5-year DFS rate was
70.75%, with the 5-year OS rate of 82.08%. Of the 36 patients in
the T-cadherin-positive expression group, 5 (13.89%) suffered
recurrence and 2 (5.56%) succumbed to the disease. The mean DFS was
4.69 years, and mean OS was 4.89 years. The 5-year DFS was 86.11%,
with a 5-year OS of 94.44%. The influence of the T-cadherin
expression on 5-year DFS and 5-year OS was determined using the
log-rank test. The 5-year DFS and 5-year OS of the
T-cadherin-negative group were lower compared with those of the
T-cadherin-positive group (Z=6.233, P=0.013; Z=5.366, P=0.021)
(Fig. 2).
In terms of univariate survival analysis (Table II), there were shorter DFS (P=0.014)
and OS (P=0.022) for T-cadherin-negative patients compared with
T-cadherin-positive patients. Lymph-vascular invasion was
associated with a significantly shorter DFS (P=0.001) and OS
(P=0.014), and positive lymph node status was associated with a
significantly shorter DFS (P=0.008) and OS (P=0.024). TNM staging
III was associated with a significantly shorter DFS only (P=0.029)
(Table II).
| Table II.Prediction of axillary lymph
node-positive breast cancer by univariate survival analysis on
various clinicopathological parameters. |
Table II.
Prediction of axillary lymph
node-positive breast cancer by univariate survival analysis on
various clinicopathological parameters.
| Parameters | n | 5-year DFS, % | χ2 | P-value | 5-year OS, % | χ2 | P-value |
|---|
| Age at operation,
years |
|
|
|
|
|
|
|
|
≤55 | 74 | 68.92 |
|
| 79.73 |
|
|
|
>55 | 32 | 75.00 | 0.865 | 0.352 | 87.50 | 1.210 | 0.271 |
| Menopausal
status |
|
|
|
|
|
|
|
|
Yes | 39 | 79.49 |
|
| 89.74 |
|
|
| No | 67 | 65.67 | 3.032 | 0.082 | 77.61 | 2.872 | 0.090 |
| Tumor size, cm |
|
|
|
|
|
|
|
| ≤2 | 29 | 79.31 |
|
| 86.20 |
|
|
|
>2 | 77 | 67.53 | 1.079 | 0.299 | 80.52 | 0.427 | 0.514 |
| BRE grade (39) |
|
|
|
|
|
|
|
| I | 34 | 82.35 |
|
| 88.24 |
|
|
| II and
III | 72 | 65.28 | 2.203 | 0.138 | 79.17 | 1.018 | 0.313 |
| Lymph-vascular
invasion |
|
|
|
|
|
|
|
|
Negative | 56 | 87.50 |
|
| 91.07 |
|
|
|
Positive | 50 | 52.00 | 16.780 | 0.001 | 72.00 | 5.996 | 0.014 |
| Lymph node
status |
|
|
|
|
|
|
|
|
Negative | 42 | 85.71 |
|
| 92.86 |
|
|
|
Positive | 64 | 60.94 | 7.045 | 0.008 | 75.00 | 5.101 | 0.024 |
| Histological
type |
|
|
|
|
|
|
|
|
IDC | 96 | 69.79 |
|
| 81.25 |
|
|
| Special
type | 10 | 80.00 | 0.390 | 0.532 | 90.00 | 0.435 | 0.510 |
| Family history |
|
|
|
|
|
|
|
| No | 86 | 72.09 |
|
| 81.40 |
|
|
|
Yes | 20 | 65.00 | 0.036 | 0.849 | 85.00 | 0.724 | 0.395 |
| TNM stage (40) |
|
|
|
|
|
|
|
|
I/II | 79 | 75.95 |
|
| 84.81 |
|
|
|
III | 27 | 55.56 | 4.795 | 0.029 | 74.07 | 1.437 | 0.231 |
| T-cadherin |
|
|
|
|
|
|
|
|
Negative | 70 | 62.86 |
|
| 75.71 |
|
|
|
Positive | 36 | 86.11 | 6.061 | 0.014 | 94.44 | 5.246 | 0.022 |
| Therapy |
|
|
|
|
|
|
|
|
Chemotherapy | 43 | 83.72 |
|
| 90.70 |
|
|
|
Chemotherapy +
radiotherapy | 53 | 54.72 | 5.477 | 0.019 | 71.70 | 3.583 | 0.058 |
In terms of multivariate Cox regression analysis,
lymph-vascular invasion and tumor size >2 cm (Wald =15.148 and
Wald =4.255, respectively; P<0.001 and P=0.039, respectively)
were other factors that reached significance for predicting DFS
(Table III). Lymph-vascular
invasion was a factor that reached significance for predicting OS
(Wald =5.081; P=0.024; Table IV).
Furthermore, T-cadherin expression was an independent prognostic
factor for DFS (Wald =6.758; P=0.009; Table III) and OS (Wald =3.910; P=0.048;
Table IV).
| Table III.Multivariate analyses of disease-free
survival of 106 patients with triple-negative breast cancer. |
Table III.
Multivariate analyses of disease-free
survival of 106 patients with triple-negative breast cancer.
|
| 95.0% CI for
RR |
|---|
|
|
|
|---|
| Parameters | B | SE | Wald | P-value | RR | Lower | Upper |
|---|
| Age at
operation |
9.248 | 98.070 |
0.009 |
0.925 | 10,384.712 | 0.000 |
3.119×1087 |
| Menopausal
status | −10.025 | 98.070 |
0.010 |
0.919 |
0.000 | 0.000 |
1.328×1079 |
| Tumor size | −1.697 |
0.822 |
4.255 |
0.039 |
0.183 | 0.037 |
0.919 |
| BRE grade (39) |
0.858 |
0.515 |
2.770 |
0.096 |
2.358 | 0.859 |
6.474 |
| TNM stage (40) |
0.737 |
0.405 |
3.311 |
0.069 |
2.090 | 0.945 |
4.622 |
| Lymph node
status |
0.132 |
0.667 |
0.039 |
0.843 |
1.141 | 0.309 |
4.222 |
| Lymph-vascular
invasion |
2.050 |
0.527 | 15.148 | <0.001 |
7.767 | 2.766 | 21.805 |
| Histological
type |
0.814 |
0.748 |
1.186 |
0.276 |
2.258 | 0.521 |
9.779 |
| Family history | −0.193 |
0.472 |
0.167 |
0.683 |
0.825 | 0.327 |
2.081 |
| T-cadherin |
1.350 |
0.519 |
6.758 |
0.009 |
3.858 | 1.394 | 10.674 |
| Radiotherapy |
0.723 |
0.741 |
0.952 |
0.329 |
2.061 | 0.482 |
8.807 |
| Table IV.Multivariate analyses on overall
survival of 106 patients with triple-negative breast cancer. |
Table IV.
Multivariate analyses on overall
survival of 106 patients with triple-negative breast cancer.
|
| 95.0% CI for
RR |
|---|
|
|
|
|---|
| Parameters | B | SE | Wald | P-value | RR | Lower | Upper |
|---|
| Age at
operation | 9.427 | 133.133 | 0.005 | 0.944 | 12,418.991 | 0.000 | 2.612×10117 |
| Menopausal
status | −10.254 | 133.132 | 0.006 | 0.939 | 0.000 | 0.000 | 7.387×10108 |
| Tumor size | −2.349 | 1.278 | 3.381 | 0.066 | 0.095 | 0.008 | 1.167 |
| BRE grade (39) | 0.773 | 0.673 | 1.319 | 0.251 | 2.166 | 0.579 | 8.102 |
| TNM stage (40) | 0.503 | 0.522 | 0.929 | 0.335 | 1.654 | 0.594 | 4.606 |
| Lymph node
status | 1.009 | 0.885 | 1.298 | 0.255 | 2.742 | 0.483 | 15.551 |
| Lymph-vascular
invasion | 1.308 | 0.580 | 5.081 | 0.024 | 3.700 | 1.186 | 11.542 |
| Histological
type | 0.711 | 1.048 | 0.460 | 0.497 | 2.036 | 0.261 | 15.876 |
| Family history | −1.207 | 0.764 | 2.495 | 0.114 | 0.299 | 0.067 | 1.337 |
| T-cadherin | 1.534 | 0.776 | 3.910 | 0.048 | 4.636 | 1.014 | 21.207 |
| Radiotherapy | 1.253 | 1.138 | 1.213 | 0.271 | 3.502 | 0.377 | 32.575 |
Discussion
According to the current study, patients with
negative T-cadherin expression were associated with more aggressive
TNBC clinicopathological features. The DFS and OS of the patients
with T-cadherin-negative expression were decreased.
To the best of our knowledge, the present study is
the first to perform immunohistochemical analysis on T-cadherin
expression in TNBC. A significant association was identified
between negative T-cadherin expression and a tumor size >2 cm,
histological grade II and III, and positive lymph node status in
TNBC (P<0.05). Negative T-cadherin expression was significantly
associated with poor TNBC patient prognosis. Multivariate analysis
revealed that T-cadherin expression was an independent prognostic
factor for DFS (P=0.009) and OS (P=0.048).
There are several limitations to the present study.
First, the sample size was small, which reduced the power of the
study, and a number of patients were lost in follow-up, reducing
the power further. Second, patients with invasive lobular carcinoma
were excluded, thus whether invasive lobular carcinoma had altered
T-cadherin expression remains unknown. Third, data at the
molecular/genetic level were not provided. It is hoped that a
large-sample multi-center study will be performed in the future,
verifying the findings of the present study.
According to the results of the current study,
T-cadherin expression was associated with the clinicopathological
features and prognosis of TNBC. For patients with TNBC,
T-cadherin-negative expression was a prognostic factor, and
T-cadherin may serve as a marker of TNBC, contributing to more
precise prediction of prognosis.
Acknowledgements
The present study was supported by the Science and
Technology Development Plan of Jining No. 1 People's Hospital
(grant no. 2014jnjc14).
References
|
1
|
He Y, Mou J, Luo D, Gao B and Wen Y:
Primary malignant melanoma of the breast: A case report and review
of the literature. Oncol Lett. 8:238–240. 2014.PubMed/NCBI
|
|
2
|
Li FY, Wu SG, Zhou J, Sun JY, Lin Q, Lin
HX, Guan XX and He ZY: Prognostic value of Ki-67 in breast cancer
patients with positive axillary lymph nodes: A retrospective cohort
study. PLoS One. 9:e872642014. View Article : Google Scholar : PubMed/NCBI
|
|
3
|
Early Breast Cancer Trialists'
Collaborative Group (EBCTCG), . Effects of chemotherapy and
hormonal therapy for early breast cancer on recurrence and 15-year
survival: An overview of the randomised trials. Lancet.
365:1687–1717. 2005. View Article : Google Scholar
|
|
4
|
Fornier M and Fumoleau P: The paradox of
triple negative breast cancer: Novel approaches to treatment.
Breast J. 18:41–51. 2012. View Article : Google Scholar : PubMed/NCBI
|
|
5
|
Dent R, Trudeau M, Pritchard KI, Hanna WM,
Kahn HK, Sawka CA, Lickley LA, Rawlinson E, Sun P and Narod SA:
Triple-negative breast cancer: Clinical features and patterns of
recurrence. Clin Cancer Res. 13:4429–4434. 2007. View Article : Google Scholar : PubMed/NCBI
|
|
6
|
Millikan RC, Newman B, Tse CK, Moorman PG,
Conway K, Dressler LG, Smith LV, Labbok MH, Geradts J, Bensen JT,
et al: Epidemiology of basal-like breast cancer. Breast Cancer Res
Treat. 109:123–139. 2008. View Article : Google Scholar : PubMed/NCBI
|
|
7
|
D'Ippolito E and Iorio MV: MicroRNAs and
triple negative breast cancer. Int J Mol Sci. 14:22202–22220. 2013.
View Article : Google Scholar : PubMed/NCBI
|
|
8
|
McNamara KM, Yoda T, Nurani AM, Shibahara
Y, Miki Y, Wang L, Nakamura Y, Suzuki K, Yang Y, Abe E, et al:
Androgenic pathways in the progression of triple-negative breast
carcinoma: A comparison between aggressive and non-aggressive
subtypes. Breast Cancer Res Treat. 145:281–293. 2014. View Article : Google Scholar : PubMed/NCBI
|
|
9
|
Jang NY, Kim DH, Cho BJ, Choi EJ, Lee JS,
Wu HG, Chie EK and Kim IA: Radiosensitization with combined use of
olaparib and PI-103 in triple-negative breast cancer. BMC Cancer.
15:892015. View Article : Google Scholar : PubMed/NCBI
|
|
10
|
Liu P, Tang H, Chen B, He Z, Deng M, Wu M,
Liu X, Yang L, Ye F and Xie X: miR-26a suppresses tumour
proliferation and metastasis by targeting metadherin in triple
negative breast cancer. Cancer Lett. 357:384–392. 2015. View Article : Google Scholar : PubMed/NCBI
|
|
11
|
Bisso A, Faleschini M, Zampa F, Capaci V,
De Santa J, Santarpia L, Piazza S, Cappelletti V, Daidone M, Agami
R and Del Sal G: Oncogenic miR-181a/b affect the DNA damage
response in aggressive breast cancer. Cell Cycle. 12:1679–1687.
2013. View
Article : Google Scholar : PubMed/NCBI
|
|
12
|
Ma F, Li H, Wang H, Shi X, Fan Y, Ding X,
Lin C, Zhan Q, Qian H and Xu B: Enriched CD44(+)/CD24(−) population
drives.the aggressive phenotypes presented in triple-negative
breast cancer (TNBC). Cancer Lett. 353:153–159. 2014. View Article : Google Scholar : PubMed/NCBI
|
|
13
|
van Roy F: Beyond E-cadherin: Roles of
other cadherin superfamily members in cancer. Nat Rev Cancer.
14:121–134. 2014. View
Article : Google Scholar : PubMed/NCBI
|
|
14
|
Berx G and van Roy F: Involvement of
members of the cadherin superfamily in cancer. Cold Spring Harb
Perspect Biol. 1:a0031292009. View Article : Google Scholar : PubMed/NCBI
|
|
15
|
Andrews JL, Kim AC and Hens JR: The role
and function of cadherins in the mammary gland. Breast Cancer Res.
14:2032012. View
Article : Google Scholar : PubMed/NCBI
|
|
16
|
Gheldof A and Berx G: Cadherins and
epithelial-to-mesenchymal transition. Prog Mol Biol Transl Sci.
116:317–336. 2013. View Article : Google Scholar : PubMed/NCBI
|
|
17
|
Philippova M, Joshi MB, Kyriakakis E,
Pfaff D, Erne P and Resink TJ: A guide and guard: The many faces of
T-cadherin. Cell Signal. 21:1035–1044. 2009. View Article : Google Scholar : PubMed/NCBI
|
|
18
|
Guillaume E, Comunale F, Do Khoa N,
Planchon D, Bodin S and Gauthier-Rouvière C: Flotillin microdomains
stabilize cadherins at cell-cell junctions. J Cell Sci.
126:5293–5304. 2013. View Article : Google Scholar : PubMed/NCBI
|
|
19
|
Adachi Y, Takeuchi T, Nagayama T, Ohtsuki
Y and Furihata M: Zeb1- mediated T-cadherin repression increases
the invasive potential of gallbladder cancer. FEBS Lett.
583:430–436. 2009. View Article : Google Scholar : PubMed/NCBI
|
|
20
|
Philippova M, Joshi MB, Pfaff D,
Kyriakakis E, Maslova K, Erne P and Resink TJ: T-cadherin
attenuates insulin dependent signalling, eNOS activation, and
angiogenesis in vascular endothelial cells. Cardiovasc Res.
93:498–507. 2012. View Article : Google Scholar : PubMed/NCBI
|
|
21
|
Maslova K, Kyriakakis E, Pfaff D, Frachet
A, Frismantiene A, Bubendorf L, Ruiz C, Vlajnic T, Erne P, Resink
TJ and Philippova M: EGFR and IGF-1R in regulation of prostate
cancer cell phenotype and polarity: Opposing functions and
modulation by T- cadherin. FASEB J. 29:494–507. 2015. View Article : Google Scholar : PubMed/NCBI
|
|
22
|
Makarla PB, Saboorian MH, Ashfaq R,
Toyooka KO, Toyooka S, Minna JD, Gazdar AF and Schorge JO: Promoter
hypermethylation profile of ovarian epithelial neoplasms. Clin
Cancer Res. 11:5365–5369. 2005. View Article : Google Scholar : PubMed/NCBI
|
|
23
|
Tang Y, Dai Y and Huo J: Decreased
expression of T-cadherin is associated with gastric cancer
prognosis. Hepatogastroenterology. 59:1294–1298. 2012.PubMed/NCBI
|
|
24
|
Toyooka S, Toyooka KO, Harada K, Miyajima
K, Makarla P, Sathyanarayana UG, Yin J, Sato F, Shivapurkar N,
Meltzer SJ and Gazdar AF: Aberrant methylation of the CDH13
(H-cadherin) promoter region in colorectal cancers and adenomas.
Cancer Res. 62:3382–3386. 2002.PubMed/NCBI
|
|
25
|
Li DL, Zhang ZQ, Chen SH, Zhang SA, Fang
J, Lin ZQ, Zhang X and Jiang Y: Expression of T-cadherin in
hepatocellular carcinoma and its relationship with relapse and
metastasis of tumor. Med J Chin PLA. 40:315–318. 2015.
|
|
26
|
Lin Y, Sun G, Liu X, Chen Y and Zhang C:
Clinical significance of T-cadherin tissue expression in patients
with bladder transitional cell carcinoma. Urol Int. 86:340–345.
2011. View Article : Google Scholar : PubMed/NCBI
|
|
27
|
Takeuchi T, Misaki A, Chen BK and Ohtsuki
Y: H-cadherin expression in breast cancer. Histopathology.
35:87–88. 1999. View Article : Google Scholar : PubMed/NCBI
|
|
28
|
Ciatto C, Bahna F, Zampieri N,
VanSteenhouse HC, Katsamba PS, Ahlsen G, Harrison OJ, Brasch J, Jin
X, Posy S, et al: T-cadherin structures reveal a novel adhesive
binding mechanism. Nat Struct Mol Biol. 17:339–347. 2010.
View Article : Google Scholar : PubMed/NCBI
|
|
29
|
Andreeva AV and Kutuzov MA: Cadherin 13 in
cancer. Genes Chromosomes Cancer. 49:775–790. 2010.PubMed/NCBI
|
|
30
|
Ellmann L, Joshi MB, Resink TJ, Bosserhoff
AK and Kuphal S: BRN2 is a transcriptional repressor of CDH13
(T-cadherin) in melanoma cells. Lab Invest. 92:1788–1800. 2012.
View Article : Google Scholar : PubMed/NCBI
|
|
31
|
Lee SW: H-cadherin, a novel cadherin with
growth inhibitory functions and diminished expression in human
breast cancer. Nat Med. 2:776–782. 1996. View Article : Google Scholar : PubMed/NCBI
|
|
32
|
Feng W, Orlandi R, Zhao N, Carcangiu ML,
Tagliabue E, Xu J, Bast RC Jr and Yu Y: Tumor suppressor genes are
frequently methylated in lymph node metastases of breast cancers.
BMC Cancer. 10:3782010. View Article : Google Scholar : PubMed/NCBI
|
|
33
|
Toyooka KO, Toyooka S, Virmani AK,
Sathyanarayana UG, Euhus DM, Gilcrease M, Minna JD and Gazdar AF:
Loss of expression and aberrant methylation of the CDH13
(H-cadherin) gene in breast and lung carcinomas. Cancer Res.
61:4556–4560. 2001.PubMed/NCBI
|
|
34
|
Bradshaw SH, Pidutti D, Gravel DH, Song X
and Robertson SJ: Predicting OncoDX recurrence scores with
immunohistochemical markers: effect of stromelysin. Appl
Immunohistochem Mol Morphol. 23:26–30. 2015. View Article : Google Scholar : PubMed/NCBI
|
|
35
|
Kong DD, Yang J, Li L, Wang W, Chen YN,
Wang SB and Zhou YZ: T-cadherin association with
clinicopathological features and prognosis in axillary lymph
node-positive breast cancer. Breast Cancer Res Treat. 150:119–126.
2015. View Article : Google Scholar : PubMed/NCBI
|
|
36
|
Cavusoglu A Celebiler, Kilic Y, Saydam S,
Canda T, Başkan Z, Sevinc AI and Sakizli M: Predicting invasive
phenotype with CDH1, CDH13, CD44, and TIMP3 gene expression in
primary breast cancer. Cancer Sci. 100:2341–2345. 2009. View Article : Google Scholar : PubMed/NCBI
|
|
37
|
Qasim BJ, Ali HH and Hussein AG:
Immunohistochemical expression of matrix metalloproteinase-7 in
human colorectal adenomas using specified automated cellular image
analysis system: A clinicopathological study. Saudi J
Gastroenterol. 19:23–27. 2013. View Article : Google Scholar : PubMed/NCBI
|
|
38
|
Cimino-Mathews A, Hicks JL, Illei PB,
Halushka MK, Fetting JH, De Marzo AM, Park BH and Argani P:
Androgen receptor expression is usually maintained in initial
surgically resected breast cancer metastases but is often lost in
end-stage metastases found at autopsy. Hum Pathol. 43:1003–1011.
2012. View Article : Google Scholar : PubMed/NCBI
|
|
39
|
Lebok P, Öztürk M, Heilenkötter U,
Jaenicke F, Müller V, Paluchowski P, Geist S, Wilke C, Burandt E,
Lebeau A, et al: High levels of class III β-tubulin expression are
associated with aggressive tumor features in breast cancer. Oncol
Lett. 11:1987–1994. 2016.PubMed/NCBI
|
|
40
|
Tao Y, Mao J, Zhang Q and Li L:
Overexpression of Hedgehog signaling molecules and its involvement
in triple-negative breast cancer. Oncol Lett. 2:995–1001.
2011.PubMed/NCBI
|