Introduction
As the most common gastrointestinal malignancy,
gastric cancer ranks fourth in incidence and second only to lung
cancer in mortality among all malignant tumors (1). There is an absence of early specific
clinical manifestations of patients with advanced gastric cancer;
therefore, approximately 30%-70% of patients are newly diagnosed
with advanced gastric cancer and the 3-year recurrence and
metastasis rates of early gastric cancer cells after operation are
approximately 40%-80% (2). The
present study demonstrated that the occurrence and development of
gastric cancer cells is a multi-gene involved multi-stage process,
and the prognosis is closely related to tumor-node-metastasis (TNM)
staging, but is different in patients with same-stage gastric
cancer (3). Looking for molecular
markers with high sensitivity and specificity is of great
significance to improve the early diagnosis, treatment and
prognosis. Tspan-1 is a member of transmembrane-4 superfamily
(TM4SF) of proteins, is mainly located in the cell membrane, has a
common phenomenon of glycosylation and plays important roles in
intercellular adhesion, invasion and metastasis (4). Overexpression of Tspan-1 is found in
ovarian cancer (5), colorectal cancer
(6), hepatocellular carcinoma
(7), cervical cancer (8), breast cancer (9), pancreatic cancer (10) and glioma (11), and is closely correlated with clinical
features, therapeutic efficacy and survival prognoses of tumors.
Tspan-1 gene in vitro can regulate and control the
proliferation, differentiation, invasion, apoptosis, angiogenesis
and other behaviors of tumor cells (12). A few recent studies have also pointed
out that (13,14), the abnormal expression of Tspan-1 gene
may be closely associated with the occurrence and development of
gastric cancer cells. The present study analyzed the roles of
Tspan-1 expression in the processes of angiogenesis and
epithelial-mesenchymal transition (EMT), study whether it is
associated with clinical features and prognoses of patients with
advanced gastric cancer, to provide new targets for clinical
evaluation of diagnosis, treatment and prognosis.
Patients and methods
A total of 150 patients diagnosed with advanced
gastric cancer and admitted to the First Hospital of Putian from
January 2013 to June 2016 were continuously selected and
pathological diagnosis was confirmed. Among them were males (n=78)
and females (n=72), with an average age of 62.5±15.6 years and a
mean maximum tumor diameter of 3.3±1.4 cm. Patients were at stage
II (n=84)and stage III (n=66), according to the TNM staging.
Informed consent was obtained from the individuals who participated
in the research. The present study was approved by the Ethics
Committee at the First Hospital of Putian.
Study methods and observation
indicators
A therapeutic regimen recommended by standard
medical guidelines was used, i.e., a combination of surgical
therapy, radiotherapy and chemotherapy and targeted therapy.
Immunohistochemical staining method and semi-quantitative PCR
method were used to detect the positive expression rates and mRNA
relative expression levels of Tspan-1, vascular endothelial growth
factor (VEGF), E-cadherin and N-cadherin. The follow-up time was
3.0 to 45.0 months and the median time was 25.0 months. The median
survival time and survival rate were recorded. Related data were
collected, entered and analyzed by a third party.
Immunohistochemical staining
method
The following were purchased: Low temperature deep
refrigerators (Haier Group, Qingdao, China), runner histotomes
(LEICA RM2245; Leica Microsystems, Wetzlar, Germany), microscopes
(Olympus BX51; Olympus Corporation, Tokio, Japan), pathology tissue
bleaching and baking processors (TKY-TK; Hubei, China),
electric-heated thermostatic hot air ovens (303–3; Shanghai,
China), mouse anti-human Tspan-1, VEGF, E-cadherin and N-cadherin
monoclonal antibodies (Beyotime Biotech, Jiangsu, Japan), rabbit
anti-mouse IgG antibodies (Zhongshan Golden Bridge Biological Co.,
Ltd., Beijing, China), and PV-9000 second-generation
general-purpose two-step immunohistochemical detection kits (Sigma,
St. Louis, MO, USA).
Tissue sections were prepared through a routine
fabrication method, with a thickness of 5 µm, de-waxed in xylene,
rehydrated in gradient alcohol, then antigen retrieval, adding 3%
H2O2 solution and incubation at 27°C for 20
min, and then normal goat serum working solution added dropwise and
incubated at 27°C for 30 min. The sections were incubated with
primary antibodies (1:2,000) overnight at 4°C in a humidified
chamber. A negative control was designed by using normal mouse IgG
instead of primary antibody. Then, the sections were added with IgG
secondary antibodies dropwise (1:500) and incubated for 20 min at
27°C in the humidified chamber; horseradish-peroxidase-labeled
pronase avidin (Biyuntian Science & Technology Co., Ltd.,
Jiangsu, China) were added dropwise and the sections were incubated
for 20 min at 27°C in the humidified chamber and oscillated then
washed with PBS for 5 min × 3 times. The sections were developed
with DAB (diaminobenzidine), counterstained with hematoxylin,
differentiated with hydrochloric alcohol, blued with ammonia,
rehydrated in gradient alcohol, hyalinized in xylene, sealed with a
neutral gum, dried at room temperature, and observed with an
optical microscope. Result determination: the semi-quantitative
method based on both the staining intensity and the proportion of
stained cells was used; it was positive if the cytoplasm or nucleus
was stained dark brown from yellow. The staining intensity was
scored as: 0, negative; 1, weak; 2, moderate; 3, strong. The
proportion of stained cells was scored as: 0, ≤5%; 1, 6–25%; 2,
26–50%; 3, 51–75%; 4, >75%. If the product of the above two
scores was 0–3, it was considered negative, and if 4–12, it was
considered positive.
PCR method
Total RNA was extracted from cells according to a
conventional method using TRIzol reagents. Concentration and purity
were measured by using ultraviolet spectrophotometers. cDNA was
synthesized by using reverse transcription kits. The primer
sequences were synthesized by Sangon Biotech Co., Ltd. (Shanghai,
China) based on gene bank sequences were: Tspan-1: forward,
5′-GGTTTCATCCAGGATCGAGCAGG-3′ and reverse,
5′-ACAAAGATGGTCACGGTCTGCC-3′, 445 bp; VEGF: forward,
5′-ACTACTTCTCCCGCCGCTAC-3′, and reverse,
5′-GAAATCAAACAGAGGCCGCATG-3′, 332 bp; E-cadherin: forward,
5′-ATCAAAGGTATCACGGCAAACG-3′ and reverse,
5′-CGGAGAGCTCGTCCACGTAT-3′, 479 bp; N-cadherin: forward,
5′-GTGCCATTAGCCAAGGGAATTCAGC-3′, and reverse,
5′-GCGTTCCTGTTCCACTCATAGGAG-3′, 337 bp; GAPDH forward,
5′-CGCGAGAAGATGACCCAGAT-3′, and reverse,
5′-GCACTGTGTTGGCGTACAGG-3′, 225 bp. The reaction system was 2 µl
cDNA + 3 µl upper primers and 3 µl lower primers + 0.5 µl Taq
polymerase + 1 µl dNTPs + 3 µl MgCl2 + 5 µl 10X buffer +
2.5 µl ddH2O2; the reaction condition was
95°C for 5 min, then 95°C for 30 sec, 58°C for 30 sec and 72°C for
60 sec, with a total of 30 cycles, and lastly, 72°C for 10 min. PCR
products were identified by 2% agarose gel electrophoresis,
ultraviolet spectrometry images were formed by a gel documentation
and analysis system, and gray values of digital photos were
analyzed. The results were expressed by using the 2−ΔΔCq
method.
Statistical analysis
SPSS 20.0 software (IBM, Armonk, NY, USA) was used
for statistical analysis. Measurement data were expressed as mean ±
standard deviation and comparisons between groups were done by
using independent sample t-test; enumeration data were indicated as
case or percentage (%) and comparisons between groups were carried
out by using χ2 test; Kaplan-Meier model and log-rank
χ2 test were used for the median survival time; Pearson
or χ2 test was used for the correlation analysis.
P<0.05 was considered to indicate a statistically significant
difference.
Results
Analysis of immunohistochemical
results
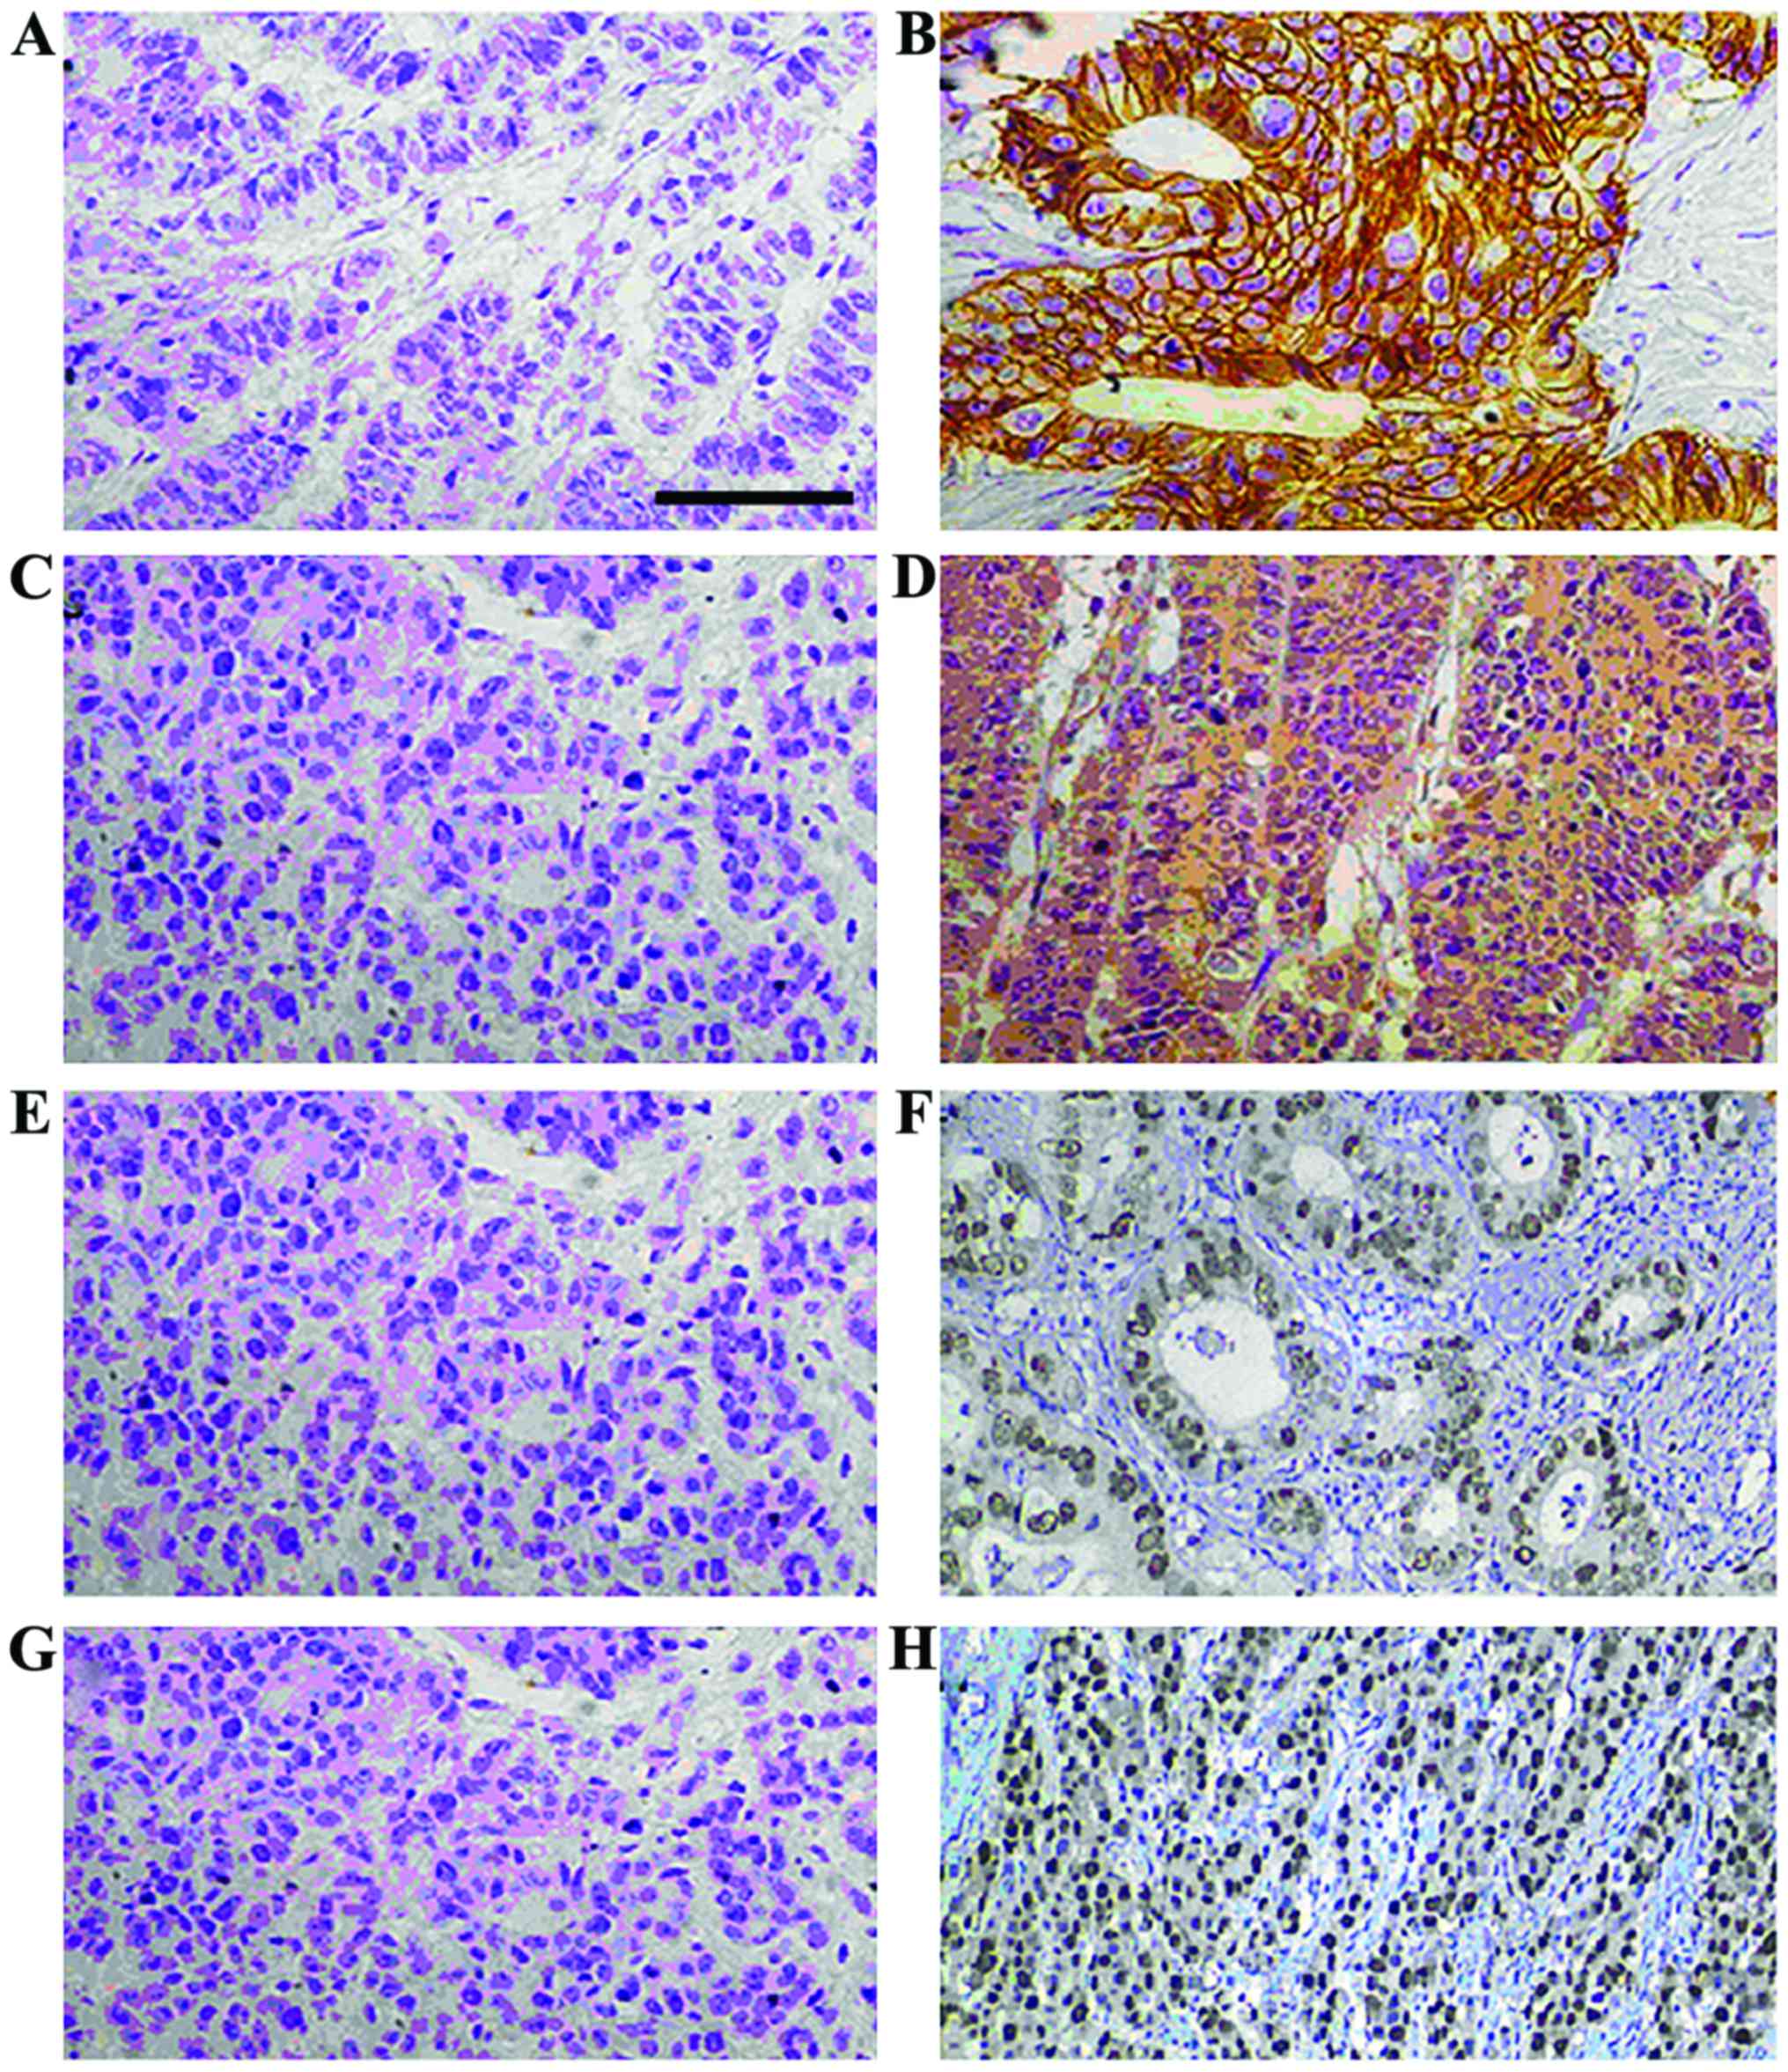
The positive expre-ssion rates of Tspan-1, VEGF,
E-cadherin and N-cadherin were 58.0% (87 patients), 50.0% (75
patients), 28.0% (42 patients) and 53.3% (80 patients),
respectively. The positive expressions of Tspan-1, VEGF, E-cadherin
and N-cadherin was not correlated with sex or age (P>0.05), but
associated with the cancer state (stage II or stage III) and
maximum tumor diameter (P<0.05), that is, with the increase of
stage and diameter, the positive rates of Tspan-1, VEGF and
N-cadherin were increased, while that of E-cadherin was decreased
(Fig. 1 and Table I).
 | Table I.Analysis of immunohistochemical
results. |
Table I.
Analysis of immunohistochemical
results.
|
| Tspan-1 | VEGF | E-cadherin | N-cadherin |
|---|
|
|
|
|
|
|
|---|
| Item | Positive (n=87) | Negative (n=63) | Positive (n=75) | Negative (n=75) | Positive (n=42) | Negative (n=108) | Positive (n=80) | Negative (n=70) |
|---|
| Male/female | 42/45 | 36/27 | 40/35 | 38/37 | 25/17 | 53/55 | 46/34 | 32/38 |
| Age, years | 59.8±13.9 | 64.4±16.7 | 62.3±15.8 | 63.8±14.2 | 63.5±12.9 | 61.2±15.6 | 64.9±17.2 | 60.2±13.5 |
| Stage II/III | 40/47 | 44/19 | 35/40 | 49/26 | 30/12 | 54/54 | 37/43 | 47/23 |
| Maximum tumor
diameter, cm | 3.9±1.6 | 3.1±1.2 | 3.8±1.7 | 3.2±1.3 | 3.1±1.3 | 3.7±1.6 | 4.1±2.1 | 2.8±1.3 |
Analysis of PCR results
The mRNA expression levels of Tspan-1, VEGF,
E-cadherin and N-cadherin were not correlated with sex and age
(P>0.05), but associated with the cancer state (stage II or
stage III) and maximum tumor diameter (P<0.05). With the
increase of cancer stage and diameter, the mRNA expression levels
of Tspan-1, VEGF and N-cadherin were increased, while that of
E-cadherin was decreased (Table
II).
| Table II.Analysis of PCR results. |
Table II.
Analysis of PCR results.
| Item | Tspan-1 | VEGF | E-cadherin | N-cadherin |
|---|
| Male |
0.4625±0.1325 |
0.3659±0.1324 |
0.1235±0.0685 |
0.4857±0.1526 |
| Female |
0.4526±0.1426 |
0.3529±0.1268 |
0.1325±0.0527 |
0.4759±0.1637 |
| Age, years |
|
<62 |
0.4429±0.1258 |
0.3652±0.1127 |
0.1426±0.0737 |
0.4659±0.1527 |
| ≥62 |
0.4725±0.1529 |
0.3528±0.1235 |
0.1258±0.0638 |
0.4925±0.1649 |
| Stage II |
0.3529±0.1123 |
0.3251±0.1426 |
0.1952±0.0859 |
0.3325±0.1323 |
| Stage III |
0.5214±0.1865 |
0.3956±0.1568 |
0.0965±0.0123 |
0.5968±0.1527 |
| Tumor diameter,
cm |
|
<3.3 |
0.4215±0.1238 |
0.3123±0.1257 |
0.1857±0.0785 |
0.4215±0.1538 |
| ≥3.3 |
0.4968±0.1857 |
0.4214±0.1869 |
0.0865±0.0232 |
0.5263±0.2123 |
Correlation analysis
In immunohistochemical results, the positive rate of
Tspan-1 was positively correlated with VEGF and N-cadherin
(r=0.426, P=0.013; r=0.521, P=0.009), and negatively related to
E-cadherin (r=0.467, P=0.011). In PCR results, the mRNA level of
Tspan-1 was positively correlated with VEGF and N-cadherin
(r=0.442, P=0.011; r=0.557, P=0.006), and negatively related to
E-cadherin (r=0.482, P=0.008).
Analysis of survival prognosis
Among patients with stage II/III advanced gastric
cancer, those with positive expression of Tspan-1, VEGF and
N-cadherin had lower median survival time and survival rates than
patients with negative expression, while patients with positive
expression of E-cadherin had higher median survival time and
survival rates than those with negative expression (P<0.05)
(Table III).
| Table III.Analysis of survival prognosis. |
Table III.
Analysis of survival prognosis.
|
| Tspan-1 | VEGF | E-cadherin | N-cadherin |
|---|
|
|
|
|
|
|
|---|
| Item | Positive | Negative | Positive | Negative | Positive | Negative | Positive | Negative |
|---|
| Stage II (n=84) |
| Median survival time,
months | 23.4 | 28.7 | 22.6 | 29.3 | 32.5 | 24.7 | 19.8 | 30.6 |
| Survival rate, % | 42.5 | 65.9 | 37.1 | 63.3 | 70.0 | 40.7 | 35.1 | 57.4 |
| Stage III (n=66) |
| Median survival time,
months | 14.6 | 21.2 | 12.9 | 20.4 | 22.3 | 14.8 | 10.7 | 19.8 |
| Survival rate, % | 25.5 | 52.6 | 30.0 | 65.4 | 58.3 | 24.1 | 27.9 | 56.5 |
Discussion
The present study showed that Tspan-1 plays
important roles in cell signaling, adhesion regulation, metastasis,
differentiation, proliferation and tumor cell immune escape
(15). According to results of the
study, the positive expression rates of Tspan-1, VEGF, E-cadherin
and N-cadherin were 58.0, 50.0, 28.0 and 53.3%, respectively in
patients with advanced gastric cancer. The positive expression and
mRNA levels of Tspan-1, VEGF, E-cadherin and N-cadherin was not
correlated with sex or age, but associated with the cancer state
(stage II or stage III) and maximum tumor diameter. With the
increase of cancer stage and tumor diameter, the positive rates and
mRNA levels of Tspan-1, VEGF and N-cadherin were increased, while
those of E-cadherin were decreased. It has been demonstrated that
VEGF is involved in the mechanism of tumor angiogenesis. Tumor
proliferation, invasion, migration, relapse and other processes are
inseparable from the nutrition support of blood microcirculation.
VEGF is a strong cytokine regulating angiogenesis (16). E-cadherin and N-cadherin are important
molecular markers of EMT, of which E-cadherin is a marker of
epithelial phenotype and N-cadherin is a marker of mesenchymal
phenotype. The expression of the marker of epithelial phenotype
decreased while that of the marker of mesenchymal phenotype
increased. This is conssistent with the EMT occurrence and tumor
metastasis. For malignant tumors of epithelial origin such as
gastric cancer, the EMT occurrence plays major roles in tumor
recurrence and metastasis (17).
A further correlation analysis showed that the
positive rate and mRNA level of Tspan-1 were positively correlated
with VEGF and N-cadherin, and negatively related to E-cadherin.
Among patients with stage II and III advanced gastric cancer, those
with positive expression of Tspan-1, VEGF and N-cadherin had lower
median survival time and survival rates than patients with negative
expressions, while patients with positive expression of E-cadherin
had higher median survival time and survival rates than those with
negative expression. This suggests that the high expression of
Tspan-1 gene is associated with the TNM staging of patients with
advanced gastric cancer and the tumor diameter influencing the
survival prognosis, and may involve the processes of angiogenesis
and EMT. Tspan-1 shows potential to become a target of early
clinical diagnosis, intervention and prognosis evaluation.
Therefore, additional sample size is needed, and the follow-up time
should be extended to validate the conclusion.
References
|
1
|
Yung KW, Yung TT, Chung CY, Tong GT, Liu
Y, Henderson J, Welbeck D and Oseni S: Principles of cancer
staging. Asian Pac J Surg Oncol. 1:1–16. 2015.
|
|
2
|
Zheng YF, Tan LK, Tan BH, Sterling H and
Kane R: Principles of surgical oncology. Asian Pac J Surg Oncol.
1:17–26. 2015.
|
|
3
|
Ghoneum M, Felo N, Nwaogu OM, Fayanju IY,
Jeffe JA and Margenthaler DB: Clinical trials in surgical oncology.
Asian Pac J Surg Oncol. 1:73–82. 2015.
|
|
4
|
Hi G, Dong M, Sheng W, Zhou J, Yu D and
Sun W: Expression and clinical significance of Tspan 1 and Integrin
α6 in human pancreatic ductal adenocarcinoma. Zhonghua Wai Ke Za
Zhi. 52:781–786. 2014.(In Chinese). PubMed/NCBI
|
|
5
|
Scholz CJ, Kurzeder C, Koretz K, Windisch
J, Kreienberg R, Sauer G and Deissler H: Tspan-1 is a tetraspanin
preferentially expressed by mucinous and endometrioid subtypes of
human ovarian carcinomas. Cancer Lett. 275:198–203. 2009.
View Article : Google Scholar : PubMed/NCBI
|
|
6
|
Chen L, Zhu YY, Zhang XJ, Wang GL, Li XY,
He S, Zhang JB and Zhu JW: TSPAN1 protein expression: A significant
prognostic indicator for patients with colorectal adenocarcinoma.
World J Gastroenterol. 15:2270–2276. 2009. View Article : Google Scholar : PubMed/NCBI
|
|
7
|
Chen L, Yuan D, Wang GL, Wang Y, Wu YY and
Zhu J: Clinicopathological significance of expression of Tspan-1,
Jab1 and p27 in human hepatocellular carcinoma. J Korean Med Sci.
25:1438–1442. 2010. View Article : Google Scholar : PubMed/NCBI
|
|
8
|
Hölters S, Anacker J, Jansen L,
Beer-Grondke K, Dürst M and Rubio I: Tetraspanin 1 promotes
invasiveness of cervical cancer cells. Int J Oncol. 43:503–512.
2013.PubMed/NCBI
|
|
9
|
Desouki MM, Liao S, Huang H, Conroy J,
Nowak NJ, Shepherd L, Gaile DP and Geradts J: Identification of
metastasis-associated breast cancer genes using a high-resolution
whole genome profiling approach. J Cancer Res Clin Oncol.
137:795–809. 2011. View Article : Google Scholar : PubMed/NCBI
|
|
10
|
Cao J, Yang JC, Ramachandran V, Arumugam
T, Deng DF, Li ZS, Xu LM and Logsdon CD: TM4SF1 regulates
pancreatic cancer migration and invasion in vitro and in vivo. Cell
Physiol Biochem. 39:740–750. 2016. View Article : Google Scholar : PubMed/NCBI
|
|
11
|
Wang P, Bao W, Zhang G, Cui H and Shi G:
Transmembrane-4-L-six-family-1, a potential predictor for poor
prognosis, overexpressed in human glioma. Neuroreport. 26:455–461.
2015. View Article : Google Scholar : PubMed/NCBI
|
|
12
|
Nabokina SM, Senthilkumar SR and Said HM:
Tspan-1 interacts with the thiamine transporter-1 in human
intestinal epithelial cells and modulates its stability. Am J
Physiol Gastrointest Liver Physiol. 301:G808–813. 2011. View Article : Google Scholar : PubMed/NCBI
|
|
13
|
Jiang X, Zhang J and Huang Y: Tetraspanins
in cell migration. Cell Adhes Migr. 9:406–415. 2015. View Article : Google Scholar
|
|
14
|
Lu Z, Luo T, Nie M, Pang T, Zhang X, Shen
X, Ma L, Bi J, Wei G, Fang G and Xue X: TSPAN1 functions as an
oncogene in gastric cancer and is downregulated by miR-573. FEBS
Lett. 589:1988–1994. 2015. View Article : Google Scholar : PubMed/NCBI
|
|
15
|
Scholz CJ, Sauer G and Deissler H:
Glycosylation of tetraspanin Tspan-1 at four distinct sites
promotes its transition through the endoplasmic reticulum. Protein
Pept Lett. 16:1244–1248. 2009. View Article : Google Scholar : PubMed/NCBI
|
|
16
|
Sciuto TE, Merley A, Lin CI, Richardson D,
Liu Y, Li D, Dvorak AM, Dvorak HF and Jaminet SC: Intracellular
distribution of TM4SF1 and internalization of TM4SF1-antibody
complex in vascular endothelial cells. Biochem Biophys Res Commun.
465:338–343. 2015. View Article : Google Scholar : PubMed/NCBI
|
|
17
|
Dai J, Qian C, Su M, Chen M and Chen J:
Gastrokine-2 suppresses epithelial mesenchymal transition through
PI3K/AKT/GSK3β signaling in gastric cancer. Tumour Biol.
37:12403–124010. 2016. View Article : Google Scholar : PubMed/NCBI
|