Introduction
Lung cancer is currently the leading cause of
mortality among all types of cancer worldwide (1). It may be divided into non-small cell
lung cancer (NSCLC) and small cell lung cancer (SCLC), which
account for ~80 and ~20% of cases, respectively. On the basis of
oncogene mutation profiles, epidermal growth factor receptor
(EGFR) mutations and Kirsten rat sarcoma viral oncogene
homolog (KRAS) mutations account for ~50 and ~10% of
patients with NSCLC in Asians and 10–15% and 30% in Caucasians
(1). Owing to its promising
therapeutic efficacy and low toxicity, targeted therapy,
particularly tyrosine kinase inhibitors, including gefitinib and
erlotinib, are being widely used in clinical therapy for patients
with NSCLC (2); however, patients
using tyrosine kinase inhibitors (TKIs) acquire drug resistance
within 7–11 months of administration. The mechanisms of TKI
resistance may be attributed to second-site mutations within the
EGFR kinase domain (T790M), met proto-oncogene (MET) gene
amplification, epithelial-mesenchymal transition (EMT) and
histological transformation from NSCLC to SCLC. Cancer stem cells
(CSCs) were also revealed to be responsible for drug resistance and
disease recurrence; however, previous studies revealed that EMT
induction and CSC emergence were associated (3,4). In
addition, disturbed microcirculation and structure induced a
hypoxic microenvironment in inner solid tumor tissues in
vivo (5). Sustained hypoxia in a
growing tumor induced deterioration of the disease and it was also
reported to serve important roles in TKI resistance, EMT induction
and CSC generation (6,7). A low-oxygen culture condition may induce
non-stem cancer cells to a more CSC-like phenotype (7). Hypoxia-inducible factor expression
levels under hypoxic conditions were suggested induce a dynamic
state of stemness in pathological conditions (8).
In the present study, in order to investigate the
synergistic effects of hypoxia and gefitinib, PC9 cells were
treated with gefitinib and/or hypoxia (1% O2). Aldehyde
dehydrogenase (ALDH), a detoxifying metabolic enzyme, was used as a
functional marker for sorting lung cancer stem cells (LCSCs). ALDH
serves roles in early differentiation of stem cells via oxidization
of retinol to retinoic acid, and has been used for isolation of
stem cell populations from a variety of tissues and cell lines
(9). The expression and phenotypes of
ALDH cells were investigated in various NSCLC cell lines with
different genetic backgrounds, which demonstrated consistent
enhanced tumorsphere-forming capacities in vitro.
Furthermore, compared with gefitinib or hypoxia treatment only,
co-treatment of PC9 cells with gefitinib and hypoxia significantly
increased the percentages of ALDH-positive cells, along with
significantly increased half-maximal inhibitory concentrations
(IC50) to gefitinib. Cell cycle analysis demonstrated
G0/G1 cell cycle phase enrichment upon
gefitinib or/and hypoxia treatment. Subsequently, ALDH-positive
LCSCs were sorted by fluorescence-activated cell sorting (FACs).
Genome-wide RNA-sequencing (seq) technology was performed to
analyze the transcriptome status among PC9 cells, gefitinib or/and
hypoxia-treated PC9 cells and ALDH-positive PC9 cells. By
comparison, data mining combined with cancer pathway enrichment
analysis revealed that interleukin-6 (IL-6) was an important factor
in gefitinib resistance mechanisms. Signaling transduction
enrichment analysis demonstrated that inflammation-associated tumor
necrosis factor (TNF), nuclear factor-κB (NF-κB) and the Janus
kinase (JAK)-signal transducer and activator of transcription
(STAT) signaling pathway upregulation, indicating the critical role
of inflammation signaling pathways in maintaining the core
transcription networks in gefitinib resistance. Western blotting
demonstrated co-treatment of PC9 cells with hypoxia and gefitinib
enhanced EMT acquisition. In addition, exposure of PC9 and HCC827
cells to IL-6 increased the IC50 of gefitinib,
indicating the important role of IL-6 in gefitinib resistance.
Clinical evidences revealed that IL-6 was a poor prognostic marker
in a cohort of 719 patients with adenocarcinoma in a KM plotter
database (10); however, the
investigations were performed in patients with general treatment
guidelines rather than in gefitinib-resistant patients. The role of
IL-6 will be elucidated if the clinical studies were performed
specifically in patients with adaptive resistant and recurrent
NSCLC following initial gefitinib treatment. In summary, the
findings of the present study suggested that combined targeting of
IL-6 signaling pathways with TKI administration may be a promising
strategy for the treatment of patients with NSCLC.
Materials and methods
Cell lines, cell culture and
chemotherapeutic reagents
The PC9 (EGFRE746_A750del), H1975
(EGFRT790M-L858R), HCC827 (EGFRE746_A750del)
and H358 (KRASG12C) human lung adenocarcinoma cell lines
were purchased from the American Type Culture Collection (Manassas,
VA, USA) and cultured according to the manufacturer's protocol.
Briefly, cells were cultured in RPMI-1640 medium (Gibco; Thermo
Fisher Scientific, Inc., Waltham, MA, USA) with 10% (v/v) fetal
bovine serum (HyClone; GE Healthcare Logan, UT, USA) supplemented
with 1% penicillin/streptomycin in humidified incubator at 37°C
supplied with 5% CO2. Gefitinib was purchased from
Selleck Chemicals (Houston, TX, USA).
ALDEFLUOR assay
The ALDEFLUOR assay was performed using an
ALDEFLUOR™ kit (Stemcell Technologies, Inc., Vancouver, BC, USA),
according to the manufacturer's protocol. Briefly,
BODIPY™-aminoacetaldehyde (BAAA) was used as a non-toxic
fluorescent substrate for ALDH. BAAA is able to freely diffuse into
intact and viable cells and ALDH is able to convert BAAA into
BODIPY™-aminoacetate and remain inside the cells. The expression
level of fluorescence is proportional to the ALDH activity. Viable
ALDH−bright cells may be evaluated or sorted using a
flow cytometer. Diethylaminobenzaldehyde, a specific inhibitor of
ALDH, was used as the control for background fluorescence. The ALDH
signal was detected in the green fluorescence channel (FL1, 530±15
nm) using an Accuri C6 flow cytometer (BD Biosciences, Franklin
Lakes, NJ, USA). A FACSAria flow cytometer (BD Biosciences) was
used for ALDH-positive cell sorting.
Tumorsphere formation
The ALDH-positive cells were sorted from PC9, H358
and H1975 cells using flow cytometry and plated at density of
1×10⁵ cells/ml in a AggreWell™ 400 microplate (Stemcell
Technologies, Inc.), which contained ~1,200 microwells with a
diameter of 400 µm. The medium for the tumorsphere analysis was
StemXVivo™ Serum-Free Tumorsphere Medium (R&D Systems, Inc.,
Minneapolis, MN, USA), supplemented with heparin (2 U/ml) and
hydrocortisone (0.5 µg/ml). A total of 20 ng/ml epidermal growth
factor (Gibco; Thermo Fisher Scientific, Inc.) and basic fibroblast
growth factor (Invitrogen; Thermo Fisher Scientific, Inc.) were
added to the culture medium every other day. After 7 days, the
tumorspheres formed were observed and manually counted under a
light microscope.
Cell treatment and cell growth
curves
PC9 cells were seeded in 10 cm culture dishes
(Corning Incorporated, Corning, NY, USA) at the density of
1×10⁶ cells/ml, treated with gefitinib or/and hypoxia at
37°C with 5% CO2 for 1 week. The concentration of
gefitinib was 0.1 µM and the hypoxia condition was controlled in a
hypoxic cell culture chamber (ProOx 110; BioSpherix, Ltd., Lacona,
IA, USA) with 1% O2. The cell morphology was observed
under an inverted phase-contrast microscope. The cells were counted
every day to create growth curves.
Half-maximal inhibitory concentration
(IC50) calculation
For IC50 determinations, serial dilutions
of compounds [10 mM stock concentration in dimethyl sulfoxide
(DMSO)] were performed in 100% DMSO with a three-fold dilution
factor. PC9 cells were seeded at a density of 5,000 cells per well
in 96-well plates. After 24 h at 37°C, the cells were treated with
dose concentrations of gefitinib for 72 h; the concentration
started at 100 µM and increased 3-fold each time for a series of 11
concentrations. The IC50 of gefitinib was investigated
using a Cell Counting Kit-8 (CCK-8) assay (Beyotime Institute of
Biotechnology, Haimen, China). Following a 72-h treatment of cells
with a dose concentration of gefitinib as previously described, 20
µl CCK-8 solution was added to each well and the plates were
incubated for an additional 4 h at 37°C. Optical density was
evaluated at 450 nm using SkanIt software version 2.4.3 analysis
program interfaced with a VarioskanFlash Microplate Reader (Thermo
Fisher Scientific, Inc.). For each concentration, the percentage
inhibition values were determined and the IC50 values
and Hill slopes were evaluated using a four-parameter dose-response
(variable slope) equation with GraphPad Prism 6.0 software
(GraphPad Software, Inc., La Jolla, CA, USA).
Cell cycle analysis
PC9 cells were harvested and washed in PBS.
Subsequently, 75% pre-cold ethanol was added dropwise to the cell
pellet for fixation and cells were fixed at −20°C overnight.
Subsequently, cells were washed in PBS to remove ethanol and were
treated with 25 µg/ml RNase (Cell Signaling Technology, Inc.,
Danvers, MA, USA) at 37°C for 20 min. Finally, propidium iodide
(PI) solution (50 µg/ml) was added for DNA staining. The cells were
incubated at room temperature for 30 min in the dark and put on
ice. The PI signal was detected in the PI fluorescence channel
(FL2, 585±20 nm) using an Accuri C6 flow cytometer (BD
Biosciences). BD Biosciences Accuri C6 software (version,
1.0.264.21) was used for data acquisition and analysis.
RNA-seq analysis
Total RNA was extracted from each group of PC9 cells
using TRIzol reagent (Invitrogen; Thermo Fisher Scientific, Inc.),
according to the manufacturer's protocol. The RNA quality and
quantity was determined using an Agilent 2100 Bioanalyzer
instrument (Agilent Technologies, Inc., Santa, Clara, CA, USA).
Subsequently, mRNA libraries were generated using a TruSeq RNA
Sample Preparation kit (Illumina, Inc., San Diego, CA, USA) and
high-throughput RNA sequencing studies were performed using a HiSeq
2500 System (Illumina, Inc.). Paired-end reads 125 bp in length
were mapped to the human reference transcriptome using Ensembl gene
database (ftp.ensembl.org/pub/release-75/fasta/homo_sapiens/dna)
and were aligned using Bowtie/Tophat software (ccb.jhu.edu/software/tophat/index.shtml). RNA
expression levels were evaluated as=total exon reads/mapped reads
(millions) × exon length (kb). Differentially expressed genes were
analyzed using Deseq (version, 1.28.0; Bioconductor, http://bioconductor.org/) and evaluated at
log2 fold-change (FC) threshold
(|log2FC|>1). The annotation and functional
enrichment of differentially expressed genes in Gene Ontology (GO;
http://www.geneontology.org/) and Kyoto
Encyclopedia of Genes and Genomes (KEGG; www.genome.jp/kegg/) were performed as GO and KEGG
databases provided arranged genes of specific informative groups.
P<0.05 was considered to indicate a statistically significant
difference. The RNA-seq and data analysis were performed by
Shanghai Personal Biotechnology Co., Ltd. (Shanghai, China). All
RNA-seq data have been deposited in the GEO database (GEO accession
no. GSE69599).
Western blotting
The cells were lysed in radioimmunoprecipitation
buffer (Cell Signaling Technology, Inc.) supplemented with a
protease inhibitor cocktail (Sigma-Aldrich; Merck KGaA, Darmstadt,
Germany) for 5 min on ice. A bicinchoninic acid assay (Pierce;
Thermo Fisher Scientific, Inc.) was used for the determination of
protein concentration, and 20–30 µg of total protein was loaded per
well. The lysates were separated by SDS-PAGE (10% gel) and
transferred onto polyvinylidene difluoride membranes. Blocking was
performed for 1 h at room temperature using PBS-Tween-20 (PBST)
buffer supplemented with 5% milk and incubated with primary
antibodies overnight at 4°C. Primary antibodies used include
antibodies specific for epithelial (E-)cadherin (cat. no, 3195),
vimentin (cat. no. 5741), slug (cat. no. 9585), NF-κB p65 (cat. no.
8242), phosphorylated NF-κB p65 (cat. no. 3033) and GAPDH (cat. no.
5174; all Cell Signaling Technology, Inc.) at a dilution of
1:1,000. The membranes were washed three times in PBST and
incubated with anti-rabbit horseradish-linked secondary antibody
(dilution, 1:2,000; cat. no. 7074; Cell Signaling Technology, Inc.)
for 1 h. Finally, following washing with PBST, the membranes were
developed using enhanced chemiluminescence (Pierce; Thermo Fisher
Scientific, Inc.) and images were captured using an Odyssey SA
Imaging system (LI-COR Biosciences, Lincoln, NE, USA). Densitometry
of western blot data relative to GAPDH was performed Image Lab 6.0
software (Bio-Rad Laboratories, Inc., Hercules, CA, USA).
Statistical analysis
Statistical analysis was performed using GraphPad
Prism software. Results are presented as the mean ± standard
deviation (n=3) and comparisons were performed using Student's
t-test between two groups. P<0.05 was considered to indicate a
statistically significant difference.
Results
ALDH is a cancer stem cell biomarker
for NSCLC cells with various genetic backgrounds
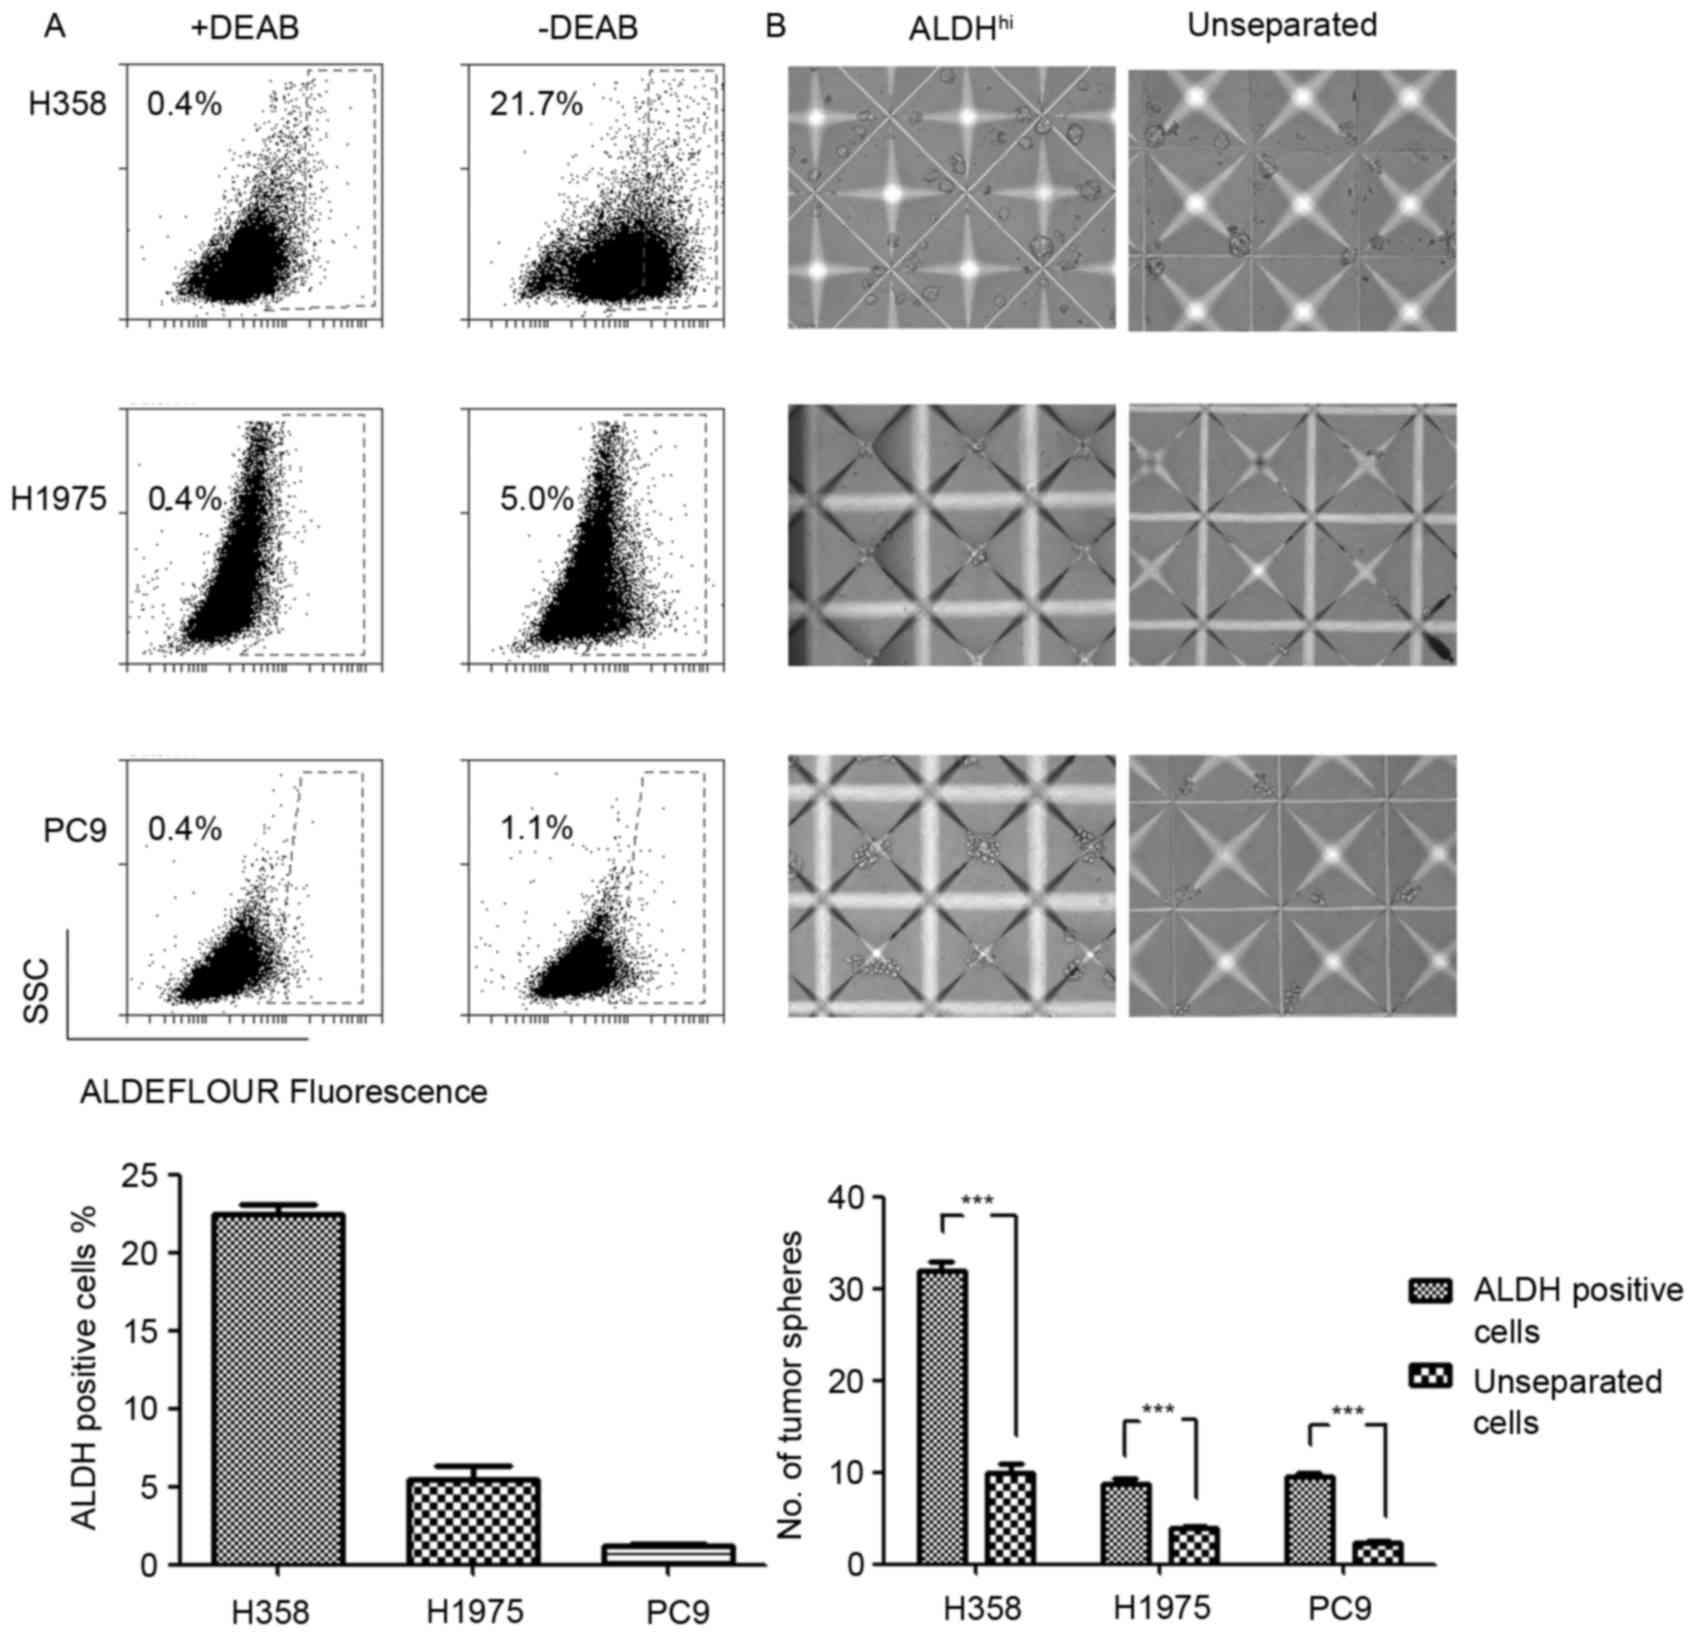
The expression levels and phenotypes of LCSC markers
varied due to distinct genetic backgrounds (11). The results of the present study
revealed differential expression levels of ALDH in EGFR and
KRAS mutated NSCLC cell lines. The ALDH expression levels in
H358 (KRASG12C), H1975 (EGFRT790M-L858R) and
PC9 (EGFRE746_A750del) cell lines were evaluated using
an ALDEFLUOR assay. The results demonstrated increased ALDH
expression levels in the KRAS mutated H358 cell line and
decreased expression levels in the EGFR mutated H1975 and
PC9 cell lines (Fig. 1A). Considering
the poor prognosis of patients with KRAS mutations with
NSCLC compared with patients with EGFR mutations, increased
ALDH expression levels may explain the poor prognosis of patients
with NSCLC with KRAS mutations to a certain extent.
Tumorsphere formation assay has previously been
typically used to evaluate the functional capacity of CSCs and
involves three-dimensional culture systems. The present study
sorted the ALDH-positive LCSCs in H358, H1975 and PC9 NSCLC cell
lines by FACS. The sorted ALDH-positive cells were cultured in
AggreWell™ 400 microplates to generate consistently sized and
shaped tumorspheres. As the control, the unseparated cells formed
significantly fewer tumorspheres compared with the ALDH-positive
cells. Three NSCLC cell lines were analyzed and demonstrated
consistent ALDH-positive cells phenotypes in the tumorsphere
formation assay (Fig. 1B). This
result indicated that ALDH was a reliable LCSCs marker in the
experimental system used.
Hypoxia and gefitinib exert
synergistic resistance effects in NSCLC cells
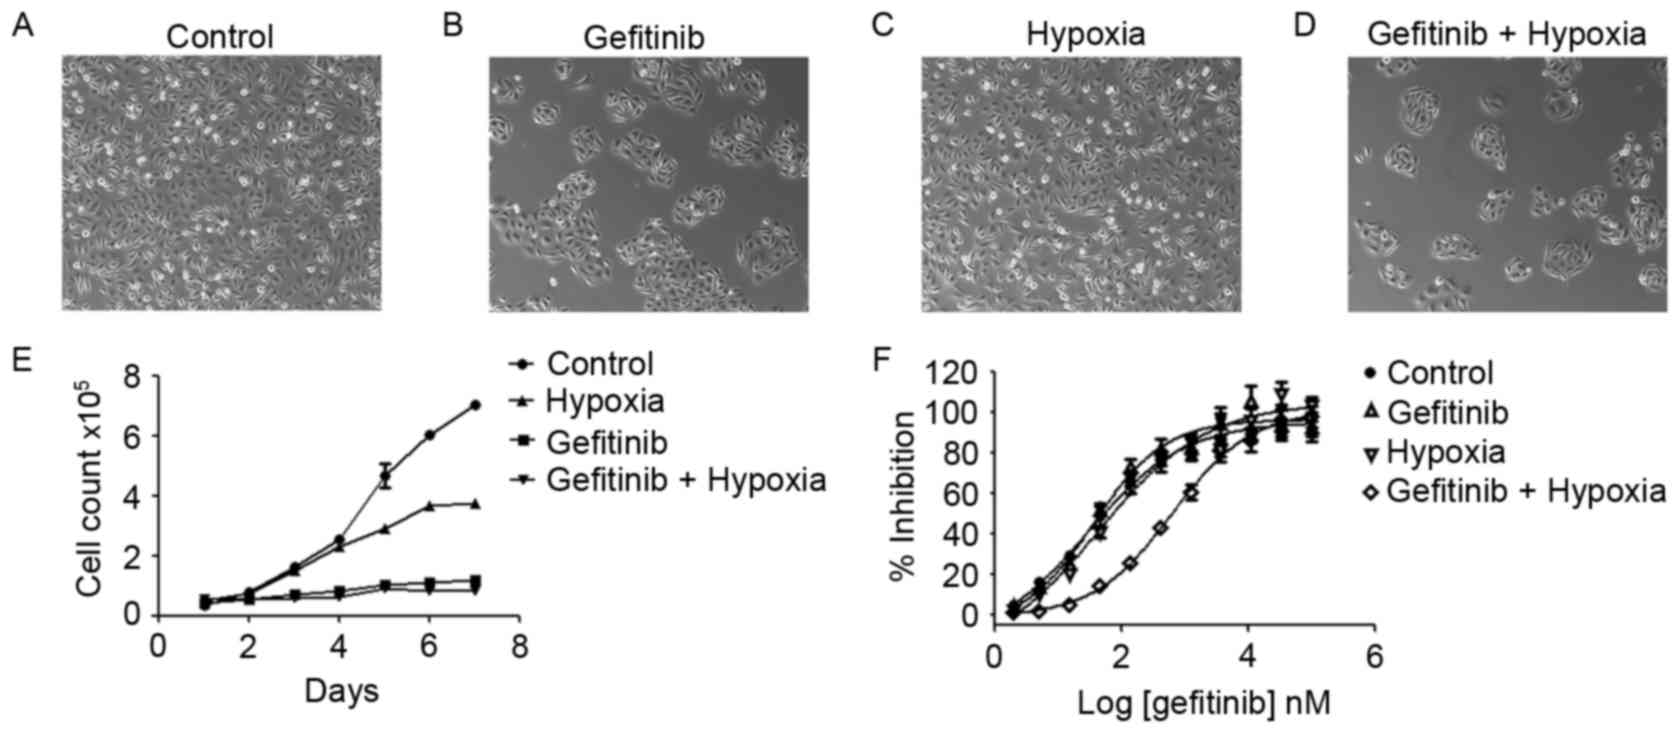
To investigate the treatment effects of PC9 cells
with gefitinib or/and hypoxia, PC9 cells were pretreated with
gefitinib (0.1 µM) or/and hypoxia (1% O2) for 1 week
(Fig. 2A-D). Treatment of PC9 cells
in normoxia (21% O2) with gefitinib significantly
inhibited the cell proliferation rate, whereas co-treatment with
hypoxia and gefitinib further inhibited PC9 cell growth (Fig. 2E). PC9 cells clustered under gefitinib
pretreatment. Gefitinib or hypoxia pretreatment alone slightly
increased the IC50 of gefitinib compared with the PC9
control cells; however, PC9 cells co-treated with gefitinib and
hypoxia revealed a markedly increased IC50 value, as
presented in Fig. 2F.
Hypoxia augments the gefitinib-induced
ALDH expression
The drug resistance and disease recurrence in
patients with NSCLC following long-term gefitinib administration in
clinics suggested that gefitinib induced cancer cell reprograming
to resist apoptosis and may also activate stemness related pathways
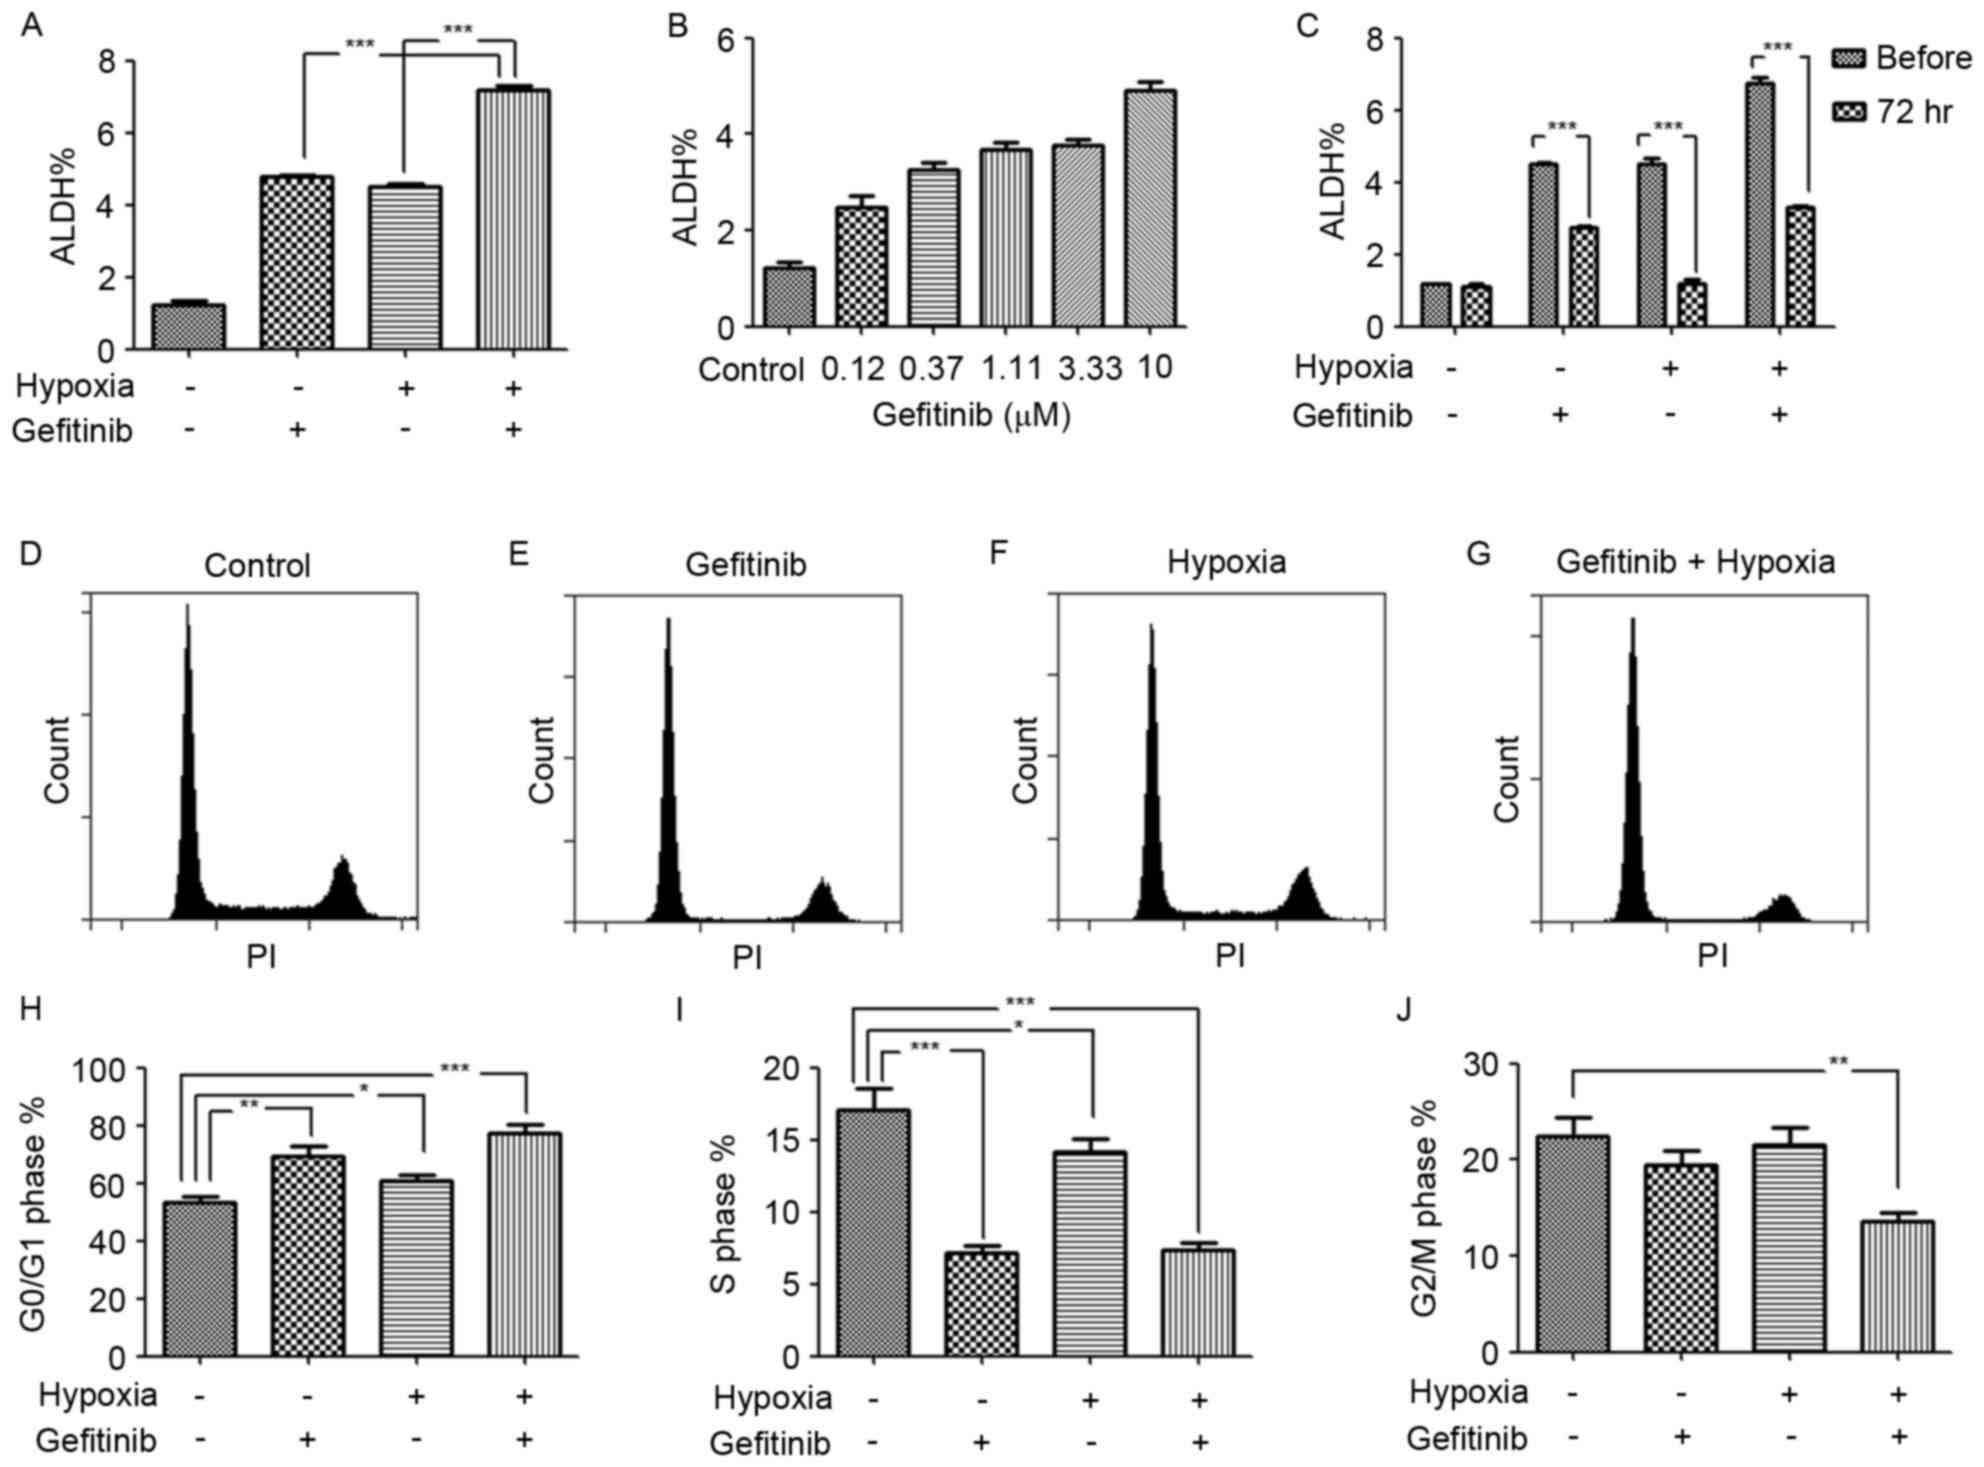
for recurrence. Of note, an increased ALDH expression level in
gefitinib or/and hypoxia treated PC9 cells was observed in the
present study. In particular, hypoxia enhanced the role of
gefitinib in the promotion of the ALDH expression level, as
revealed in gefitinib- and hypoxia-co-treated PC9 cells (Fig. 3A). This result indicated that a
hypoxic environment in inner solid tumor tissues was the
‘accomplice’ of gefitinib in cancer malignancy by enrichment of
LCSCs or transforming of lung cancer cells to LCSCs. In order to
verify the results, the dose response of gefitinib with regard to
the ALDH expression level was investigated. It was revealed that,
as the concentration of gefitinib increased, the ALDH expression
level also increased (Fig. 3B). This
result was in accordance with the hypothesis of therapy-induced
enrichment of LCSCs in a previous study (12). However, the expression level of ALDH
was unstable in PC9 cells treated with gefitinib or/and hypoxia, as
revealed by the decrease in ALDH expression 3 days after passaging
and cessation of treatment (Fig. 3C).
Correspondingly, short-term hypoxia or/and gefitinib treated PC9
cells may survive in an incomplete reprograming of stemness pathway
network status.
Hypoxia enhances the enrichment of
G0/G1 phase cells in gefitinib-treated PC9
cells
The LCSCs typically exhibit a quiescent slow-cycling
phenotype, which partially explains an inherent mechanism of
chemotherapy resistance and disease recurrence in clinics. Mizuno
et al (13) identified that
ALDH−high cells in ovarian carcinoma exhibited a more
quiescent characteristic (G0/G1 cell cycle
phase) compared with ALDH−low cells. Furthermore,
Brennan et al (14) identified
that ALDH-positive cells in mantle cell lymphoma remained in a
relatively quiescent state and were resistant to a wide variety of
agents. In the present study, following treatment with hypoxia (1%
O2) or gefitinib for 7 days, quiescent
G0/G1 phase cell enrichment was identified
following gefitinib or/and hypoxia treatment. Compared with PC9
control cells and gefitinib or hypoxia-treated only PC9 cells, the
ratio of G0/G1 phase cells increased mostly
in gefitinib- and hypoxia-co-treated PC9 cells, indicating the
synergistic role of hypoxia in promoting gefitinib-induced
G0/G1 phase cell enrichment (Fig. 3D-J).
Differential expression transcripts
and biological pathway analysis by genome-wide RNA-seq technology
identifies IL-6 as a candidate gene in hypoxia- and ALDH-based
gefitinib resistance mechanisms
Subsequently, genome-wide transcriptome analysis to
investigate the effects of gefitinib or/and hypoxia in PC9 cells
was performed in the present study. High-throughput RNA sequencing
of each group of PC9 cells was performed using a HiSeq 2500 System.
Differentially expressed transcripts were analyzed using Deseq and
evaluated at log2 fold-change thresholds
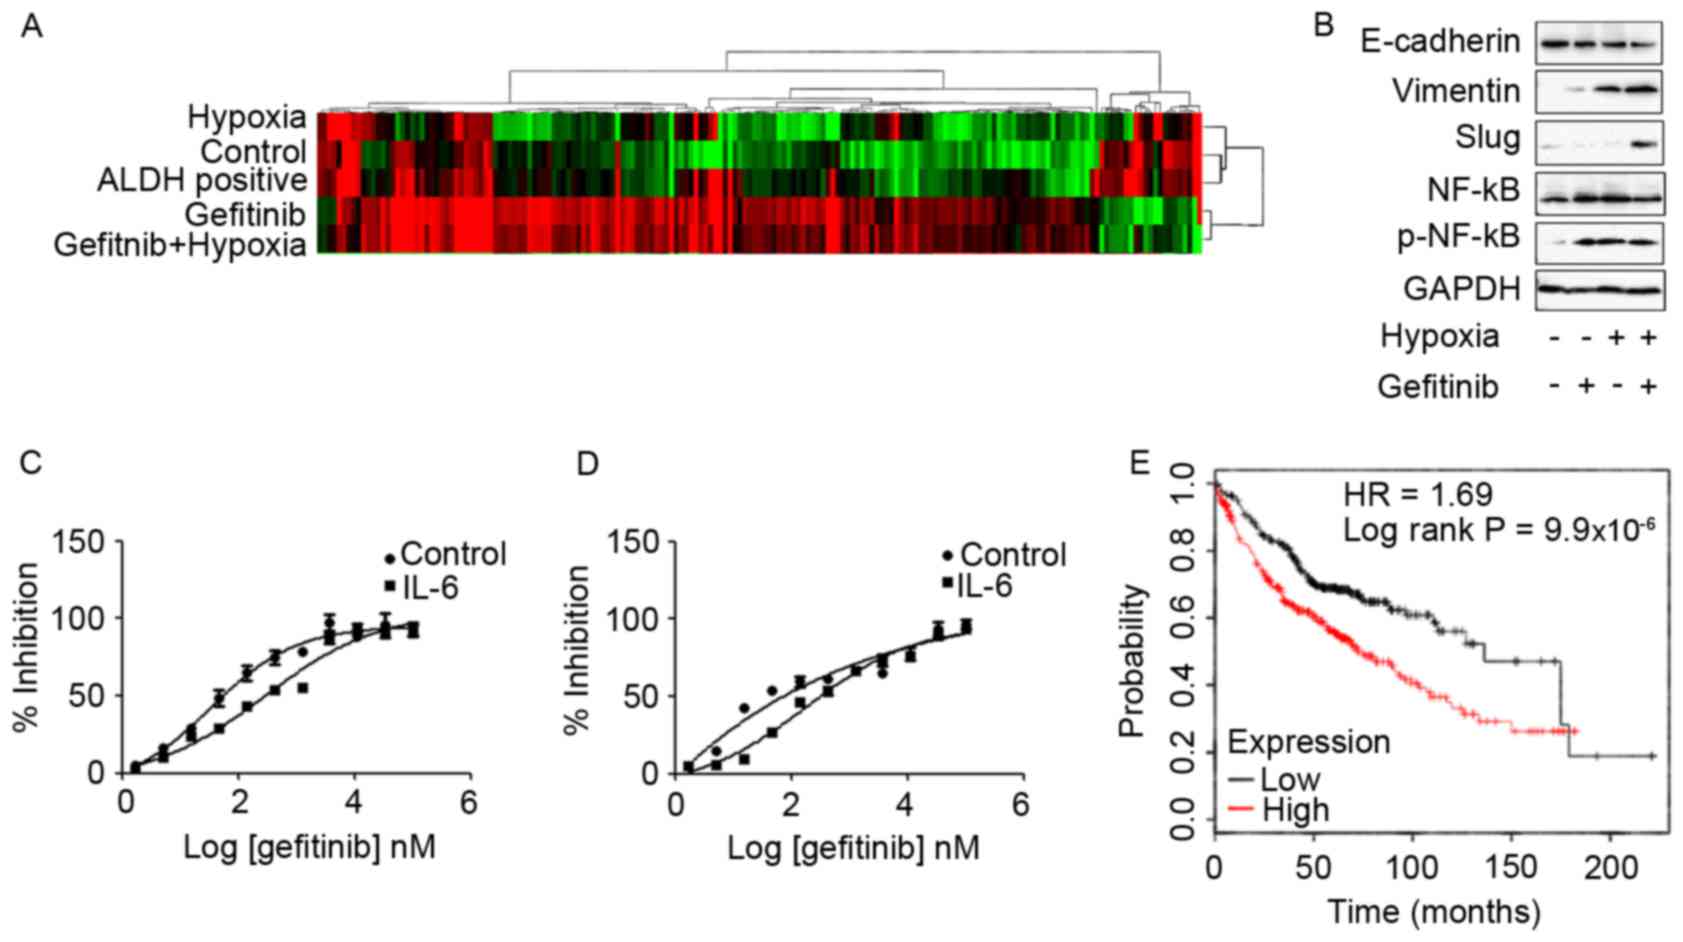
(|log2FC|>1). The hierarchical clustering and
heat-map analysis of the RNA-seq data are presented in Fig. 4A. In the present study, the common
upregulated transcripts in PC9 cells that exhibited high
IC50 values to gefitinib, including PC9 cells co-treated
with gefitinib and hypoxia and ALDH-positive PC9 cells, were
screened. Mapping of common differential transcripts to the KEGG
cancer signaling pathway revealed that, with the exception of
candidate genes also highly expressed in low gefitinib
IC50 PC9 cells, fibroblast growth factor 22, Axin2, IL-6
and Fms-related tyrosine kinase-3 ligand are candidate genes in
gefitinib resistance (Table I). Among
these genes, IL-6 was reported to confer acquired TKI resistance in
EGFR-driven NSCLC (15–17). IL-6 expression was associated with
EMT, and it was revealed that IL-6 was a common gefitinib
resistance gene shared in hypoxia and ALDH-based mechanisms.
Furthermore, the KEGG biological signaling pathway enrichment
analysis demonstrated that inflammation-associated TNF, NF-κB and
JAK-STAT signaling pathways were highly expressed in PC9 cells that
revealed increased expression levels of IL-6, as presented in
Table II. Enrichment of TNF, NF-κB
and the JAK-STAT signaling pathways may be due to IL-6
upregulation, since IL-6 activates the downstream NF-κB signaling
pathway to enhance drug resistance in lung cancer cells (18). Concerning the role of IL-6 in LCSCs,
previous studies revealed that IL-6 was indispensable for LCSC
generation, proliferation and phenotype maintenance (19,20).
 | Table I.Differentially expressed reference
pathway (KO) analysis of pathways in cancer. |
Table I.
Differentially expressed reference
pathway (KO) analysis of pathways in cancer.
| Genes overexpressed
in group 4 and 5 compared with group 1 | Genes overexpressed
in group 2, 3, 4 and 5 compared with group 1 |
|---|
|
|
|---|
| KO | Gene name | Description | KO | Gene name | Description |
|---|
| K04385 | AXIN2 | Axin2 | K06625 | CDKN1A | Cyclin-dependent
kinase inhibitor 1A (p21, Cip1) |
| K06625 | CDKN1A | Cyclin-dependent
kinase inhibitor 1A (p21, Cip1) | K06236 | COL11A2 | Collagen, type XI,
α2 |
| K06236 | COL11A2 | Collagen, type XI,
α2 | K06237 | COL4A1 | Collagen, type IV,
α1 |
| K06236 | COL1A2 | Collagen, type I,
α2 | K04547 | GNG13 | Guanine
nucleotide-binding protein (G-protein), γ13 |
| K06237 | COL4A1 | Collagen, type IV,
α1 | K08006 | MMP28 | Matrix
metallopeptidase 28 |
| K04358 | FGF22 | Fibroblast growth
factor 22 | K01403 | MMP9 | Matrix
metallopeptidase 9 (gelatinase B, 92 kDa gelatinase, 92 kDa type IV
collagenase) |
| K05454 | FLT3LG | Fms-related
tyrosine kinase 3 ligand | K11987 | PTGS2 |
Prostaglandin-endoperoxide synthase 2
(prostaglandin G/H synthase and cyclooxygenase) |
| K07826 | GNG2 | Guanine
nucleotide-binding protein (G-protein), γ2 | K01357 | WNT10B | Wingless-type MMTV
integration site family, member 10B |
| K04548 | GNGT1 | Guanine
nucleotide-binding protein (G-protein), γ transducing activity
polypeptide 1 | K01384 | WNT11 | Wingless-type MMTV
integration site family, member 11 |
| K05405 | IL6 | Interleukin 6
(interferon, β2) |
|
|
|
| K11987 | PTGS2 |
Prostaglandin-endoperoxide synthase 2
(prostaglandin G/H synthase and cyclooxygenase) |
|
|
|
| K01357 | WNT10B | Wingless-type MMTV
integration site family, member 10B |
|
|
|
| Table II.Signal transduction enrichment
analysis compared with PC9 parental cells. |
Table II.
Signal transduction enrichment
analysis compared with PC9 parental cells.
|
| Signal
transduction | No. of genes
expressed at increased levels compared with in PC9 parental
cells |
|---|
|
|
|
|
|---|
| KEGG orthology | Signaling
pathway | 1 vs. 1 | 2 vs.1 | 3 vs. 1 | 4 vs. 1 | 5 vs. 1 |
|---|
| ko04350 | TGF-β | 0 | −4 | 0 | 4 | 1 |
| ko04630 | JAK-STAT | 0 | −2 | 0 | 3 | 1 |
| ko04064 | NF-κB | 0 | −1 | 1 | 1 | 3 |
| ko04668 | TNF | 0 | −2 | 0 | 3 | 6 |
Co-treatment of PC9 cells with hypoxia
and gefitinib induced EMT- and IL-6-enhanced gefitinib resistance
in TKI-sensitive EGFR mutated PC9 cells and HCC827 cells
In order to investigate the effects of hypoxia and
gefitnib on PC9 cells, PC9 cells were treated with 1 µM gefitinib
and hypoxia for 2 weeks. Treatment of PC9 cells with gefitinib
or/and hypoxia activated the EMT signaling pathway expression. In
particular, co-treatment of PC9 cells with gefitinib and hypoxia
revealed significantly increased expression levels of mesenchymal
markers, including vimentin and slug, whereas decreased expression
levels of the epithelial marker E-cadherin compared with gefitinib
or hypoxia treatment alone (Fig. 4B).
Meanwhile, co-treatment of PC9 cells with gefitinib and hypoxia or
either treatment alone was enough to activate phosphorylated NF-κB
expression.
The function of IL-6 in promoting gefitinib
resistance was confirmed by exposure of PC9 and HCC827 cells to 10
ng/ml IL-6 for 72 h, and subsequently resistance to gefitinib was
analyzed in the presence of IL-6. IL-6 treatment significantly
enhanced the resistance of PC9 (Fig.
4C) and HCC827 (Fig. 4D) cells to
gefitinib. Furthermore, analyzing clinical data from a KM plotter
database in 719 patients with adenocarcinoma revealed unfavorable
clinical outcomes in patients with high expression of IL-6 with
decreased overall survival times (10). The patient samples were divided into
two groups with high and low expression levels of IL-6;
subsequently, the two patient cohorts were compared using a
Kaplan-Meier estimator survival plot and the hazard ratio (HR) with
95% confidence intervals and log rank P-value were determined. The
results demonstrated that HR=1.69 (1.34–2.14) and log rank
P=9.9×10⁻⁶ (Fig. 4E).
Discussion
Initial symptom relief, TKI drug resistance and
disease recurrence during clinical therapy of NSCLC suggest the
enrichment of LCSCs in this process. Treatment with gefitinib
markedly inhibited PC9 cancer cell activities in many aspects,
including proliferation and metabolism, whereas hypoxia serves
critical roles in assisting the adaptation of PC9 cells to
gefitinib resistance. Murakami et al (6) reported that hypoxic culture conditions
are able to increase the LCSC ratio and enhance gefitinib
resistance in NSCLC cells harboring TKI-sensitive EGFR
mutations following exposure of these cells to gefitinib.
Considering the disturbed microcirculation and structure due to the
hypoxic environment in solid tumor tissues in vivo, hypoxia
and gefitinib treatment may be the main cause of drug resistance,
and, in particular, disease recurrence at a late stage, as
confirmed by the increase in the ALDH-positive LCSC ratio in the
present study. CSCs are thought to be responsible for tumor
initiation, therapy resistance and particularly disease recurrence.
The challenges in studying the roles of LCSCs in adaptive
resistance to TKIs include controversies over LCSC biomarkers, the
scarcity of LCSCs and their unstable phenotypes in vitro
(21). ALDH has been validated as a
reliable biomarker in numerous types of CSC, and the stemness and
quiescent nature of ALDH-positive LCSCs was confirmed by
determining the tumorsphere-forming capacity and enrichment of
G0/G1 phase cells in the present study.
Transcriptome profiling by RNA-seq technology
indicates that IL-6 is an important gefitinib-resistance gene.
T790M, a secondary EGFR kinase domain mutation, may cause steric
hindrance to impair the binding of gefitinib/erlotinib (22). MET amplification leads to gefitinib
resistance in lung cancer by activating ERBB3 signaling (23). There are differences in acquired
resistance mechanisms associated with T790M and MET amplification;
adaptive resistance to TKIs occurs early in therapy with a number
of alterations to cancer cell signaling (24). Previously, Yao et al (17) revealed that the transforming growth
factor β (TFG-β)-IL-6 axis mediates the adaptive resistance of lung
cancer to TKIs. This study demonstrated that the inflammatory
response-induced IL-6 secretion released lung cancer cells from
EGFR dependency, decreased sensitivity to erlotinib and that IL-6
was indispensable for elotinib-resistant cell survival. In
accordance with these results, the results of the present study
revealed that exposure of PC9 and HCC827 cells harboring
TKI-sensitive EGFR mutations to IL-6 increased gefitinib
resistance. Increased expression levels of IL-6 in hypoxia- and
gefitinib-co-treated PC9 cells was associated with increased
expression levels of EMT signaling pathways. Furthermore, IL-6 was
reported to enhance TKI resistance primarily by induction of EMT
activation (17,18,25), and
was also revealed to be indispensable for LCSC enrichment and
phenotype maintenance (19,20). Accordingly, KEGG biological signaling
pathway enrichment analysis confirmed that there was
inflammation-associated pathways (TNF, NF-κB, JAK-STAT) enrichment
in gefitinib- and hypoxia-co-treated PC9 cells and ALDH-positive
PC9 cells. Of note, previously published studies have described the
importance of these inflammation pathways in EMT and ALDH
phenotypes maintenance. Kumar et al (26) demonstrated that TNF- and
TGFβ-stimulated NSCLC spheroid cells exhibited increased
EMT-associated core transcription factors, along with constitutive
NF-κB expression levels. Inhibition of NF-κB decreased the
expression levels of EMT-associated genes and resulted in EMT
phenotype inhibition (27). Of note,
Akunuru et al (28)
demonstrated that TGFβ-induced EMT in NSCLC cells was accompanied
by an increased ALDH expression level, which indicated a dynamic
transition balance between EMT and LCSCs. These results are
consistent with those of the present study that indicated that ALDH
expression levels and EMT activation were associated. Additionally,
these results also suggested an indispensable role of the NF-κB
signaling pathway in maintaining EMT and the stemness-associated
cell program (29). The stemness
state of cancer cells induces resistance to TKIs therapy and drives
tumorigenesis and metastasis (30).
For the JAK-STAT signaling pathway, previous functional studies
revealed that ALDH-positive LCSCs expressed increased levels of
activated STAT3 compared with ALDH-negative cells, and inhibition
of STAT3 decreased the number of ALDH-positive cells (31,32).
Similar studies also revealed increased expression levels of STAT3
in ALDH-positive breast cancer cells and inhibition of STAT3
decreased the ALDH-positive cell population, suggesting an
important role for STAT3 in ALDH-positive breast cancer stem cells
(31,33–35).
The prognostic value of IL-6 was confirmed in a
cohort of 719 patients with adenocarcinoma, as patients with high
expression levels of IL-6 revealed decreased overall survival times
(10). The unfavorable clinical
outcomes in patients with NSCLC and high expression levels of IL-6
were also supported by clinical evidence that the expression levels
of IL-6 in 245 patients with advanced NSCLC that had received
chemotherapy were negatively associated with survival time, as
analyzed by Kaplan-Meier estimator and Cox's proportional hazard
models (21). Additionally, patients
with high IL-6 expression levels responded poorly to chemotherapy
(36). However, although these
studies suggested that IL-6 may be associated with poor prognosis
in patients with NSCLC who received chemotherapy, the
investigations were performed in patients following standard
chemotherapy guidelines and not in patients who received TKI
therapy only (36). TKI treatment
regimens have been used as National Comprehensive Cancer Network
guidelines in recent years; therefore, the duration was limited for
collection of a sufficiently high number of patients for the IL-6
investigation of gefitinib resistance in clinical prognosis.
Although collection of clinical data from TKI-resistant patients
with NSCLC is difficult, it is crucial to investigate the
expression level of IL-6 in TKI-resistant patients with NSCLC to
validate the results.
In order to inhibit the IL-6 signaling pathways, the
majority of the research performed to date has been with
tocilizumab, the first humanized monoclonal antibody specific for
the IL-6 receptor, which is currently used in the treatment of
rheumatoid arthritis in clinics (37,38).
Clinical trials using humanized anti-IL-6 antibodies (ALD518;
NCT00866970) revealed that IL-6 appeared to be well-tolerated and
ameliorates NSCLC-associated anemia and cachexia (39); however, further studies are required
to elucidate its therapeutic effect in TKI resistance. Future
studies of combined anti-IL-6 as a target in adjuvant with
chemotherapy and/or radiotherapy may assist in overcoming NSCLC TKI
resistance.
Acknowledgements
The present study was supported by the Natural
Science Foundation of China (grant no. 81173084) and the Shanghai
Municipal Science Foundation (grant nos. 12ZR1415700, 14YZ032 and
2013-52).
References
|
1
|
Herbst RS, Heymach JV and Lippman SM: Lung
cancer. N Engl J Med. 359:1367–1380. 2008. View Article : Google Scholar : PubMed/NCBI
|
|
2
|
Jamal-Hanjani M, Wilson GA, McGranahan N,
Birkbak NJ, Watkins TBK, Veeriah S, Shafi S, Johnson DH, Mitter R,
Rosenthal R, et al: Tracking the evolution of non-small-cell lung
cancer. N Engl J Med. 376:2109–2121. 2017. View Article : Google Scholar : PubMed/NCBI
|
|
3
|
Lamouille S, Xu J and Derynck R: Molecular
mechanisms of epithelial-mesenchymal transition. Nat Rev Mol Cell
Biol. 15:178–196. 2014. View
Article : Google Scholar : PubMed/NCBI
|
|
4
|
Singh A and Settleman J: EMT, cancer stem
cells and drug resistance: An emerging axis of evil in the war on
cancer. Oncogene. 29:4741–4751. 2010. View Article : Google Scholar : PubMed/NCBI
|
|
5
|
Graves EE, Maity A and Le QT: The tumor
microenvironment in non-small-cell lung cancer. Semin Radiat Oncol.
20:156–163. 2010. View Article : Google Scholar : PubMed/NCBI
|
|
6
|
Murakami A, Takahashi F, Nurwidya F,
Kobayashi I, Minakata K, Hashimoto M, Nara T, Kato M, Tajima K,
Shimada N, et al: Hypoxia increases gefitinib-resistant lung cancer
stem cells through the activation of insulin-like growth factor 1
receptor. PLoS One. 9:e864592014. View Article : Google Scholar : PubMed/NCBI
|
|
7
|
Mazumdar J, Dondeti V and Simon MC:
Hypoxia-inducible factors in stem cells and cancer. J Cell Mol Med.
13:4319–4328. 2009. View Article : Google Scholar : PubMed/NCBI
|
|
8
|
Iida H, Suzuki M, Goitsuka R and Ueno H:
Hypoxia induces CD133 expression in human lung cancer cells by
up-regulation of OCT3/4 and SOX2. Int J Oncol. 40:71–79.
2012.PubMed/NCBI
|
|
9
|
Ma I and Allan AL: The role of human
aldehyde dehydrogenase in normal and cancer stem cells. Stem Cell
Rev. 7:292–306. 2011. View Article : Google Scholar : PubMed/NCBI
|
|
10
|
Győrffy B, Surowiak P, Budczies J and
Lánczky A: Online survival analysis software to assess the
prognostic value of biomarkers using transcriptomic data in
non-small-cell lung cancer. PLoS One. 8:e822412013. View Article : Google Scholar : PubMed/NCBI
|
|
11
|
Curtis SJ, Sinkevicius KW, Li D, Lau AN,
Roach RR, Zamponi R, Woolfenden AE, Kirsch DG, Wong KK and Kim CF:
Primary tumor genotype is an important determinant in
identification of lung cancer propagating cells. Cell Stem Cell.
7:127–133. 2010. View Article : Google Scholar : PubMed/NCBI
|
|
12
|
Freitas DP, Teixeira CA, Santos-Silva F,
Vasconcelos MH and Almeida GM: Therapy-induced enrichment of
putative lung cancer stem-like cells. Int J Cancer. 134:1270–1278.
2014. View Article : Google Scholar : PubMed/NCBI
|
|
13
|
Mizuno T, Suzuki N, Makino H, Furui T,
Morii E, Aoki H, Kunisada T, Yano M, Kuji S, Hirashima Y, et al:
Cancer stem-like cells of ovarian clear cell carcinoma are enriched
in the ALDH-high population associated with an accelerated
scavenging system in reactive oxygen species. Gynecol Oncol.
137:299–305. 2015. View Article : Google Scholar : PubMed/NCBI
|
|
14
|
Brennan SK, Meade B, Wang Q, Merchant AA,
Kowalski J and Matsui W: Mantle cell lymphoma activation enhances
bortezomib sensitivity. Blood. 116:4185–4191. 2010. View Article : Google Scholar : PubMed/NCBI
|
|
15
|
Terai H, Soejima K, Yasuda H, Nakayama S,
Hamamoto J, Arai D, Ishioka K, Ohgino K, Ikemura S, Sato T, et al:
Activation of the FGF2-FGFR1 autocrine pathway: A novel mechanism
of acquired resistance to gefitinib in NSCLC. Mol Cancer Res.
11:759–767. 2013. View Article : Google Scholar : PubMed/NCBI
|
|
16
|
Ware KE, Hinz TK, Kleczko E, Singleton KR,
Marek LA, Helfrich BA, Cummings CT, Graham DK, Astling D, Tan AC
and Heasley LE: A mechanism of resistance to gefitinib mediated by
cellular reprogramming and the acquisition of an FGF2-FGFR1
autocrine growth loop. Oncogenesis. 2:e392013. View Article : Google Scholar : PubMed/NCBI
|
|
17
|
Yao Z, Fenoglio S, Gao DC, Camiolo M,
Stiles B, Lindsted T, Schlederer M, Johns C, Altorki N, Mittal V,
et al: TGF-beta IL-6 axis mediates selective and adaptive
mechanisms of resistance to molecular targeted therapy in lung
cancer. Proc Natl Acad Sci USA. 107:15535–15540. 2010. View Article : Google Scholar : PubMed/NCBI
|
|
18
|
Yan HQ, Huang XB, Ke SZ, Jiang YN, Zhang
YH, Wang YN, Li J and Gao FG: Interleukin 6 augments lung cancer
chemotherapeutic resistance via ataxia-telangiectasia
mutated/NF-kappaB pathway activation. Cancer Sci. 105:1220–1227.
2014. View Article : Google Scholar : PubMed/NCBI
|
|
19
|
Liu CC, Lin JH, Hsu TW, Su K, Li AF, Hsu
HS and Hung SC: IL-6 enriched lung cancer stem-like cell population
by inhibition of cell cycle regulators via DNMT1 upregulation. Int
J Cancer. 136:547–559. 2015.PubMed/NCBI
|
|
20
|
Yi H, Cho HJ, Cho SM, Jo K, Park JA, Kim
NH, Amidon GL, Kim JS and Shin HC: Blockade of interleukin-6
receptor suppresses the proliferation of H460 lung cancer stem
cells. Int J Oncol. 41:310–316. 2012.PubMed/NCBI
|
|
21
|
Templeton AK, Miyamoto S, Babu A, Munshi A
and Ramesh R: Cancer stem cells: Progress and challenges in lung
cancer. Stem Cell Investig. 1:92014.PubMed/NCBI
|
|
22
|
Godin-Heymann N, Ulkus L, Brannigan BW,
McDermott U, Lamb J, Maheswaran S, Settleman J and Haber DA: The
T790M ‘gatekeeper’ mutation in EGFR mediates resistance to low
concentrations of an irreversible EGFR inhibitor. Mol Cancer Ther.
7:874–879. 2008. View Article : Google Scholar : PubMed/NCBI
|
|
23
|
Engelman JA, Zejnullahu K, Mitsudomi T,
Song Y, Hyland C, Park JO, Lindeman N, Gale CM, Zhao X, Christensen
J, et al: MET amplification leads to gefitinib resistance in lung
cancer by activating ERBB3 signaling. Science. 316:1039–1043. 2007.
View Article : Google Scholar : PubMed/NCBI
|
|
24
|
Rosell R, Karachaliou N, Morales-Espinosa
D, Costa C, Molina MA, Sansano I, Gasco A, Viteri S, Massuti B, Wei
J, et al: Adaptive resistance to targeted therapies in cancer.
Transl Lung Cancer Res. 2:152–159. 2013.PubMed/NCBI
|
|
25
|
Li L, Han R, Xiao H, Lin C, Wang Y, Liu H,
Li K, Chen H, Sun F, Yang Z, et al: Metformin sensitizes
EGFR-TKI-resistant human lung cancer cells in vitro and in vivo
through inhibition of IL-6 signaling and EMT reversal. Clin Cancer
Res. 20:2714–2726. 2014. View Article : Google Scholar : PubMed/NCBI
|
|
26
|
Kumar M, Allison DF, Baranova NN, Wamsley
JJ, Katz AJ, Bekiranov S, Jones DR and Mayo MW: NF-κB regulates
mesenchymal transition for the induction of non-small cell lung
cancer initiating cells. PLoS One. 8:e685972013. View Article : Google Scholar : PubMed/NCBI
|
|
27
|
Min C, Eddy SF, Sherr DH and Sonenshein
GE: NF-kappaB and epithelial to mesenchymal transition of cancer. J
Cell Biochem. 104:733–744. 2008. View Article : Google Scholar : PubMed/NCBI
|
|
28
|
Akunuru S, James Zhai Q and Zheng Y:
Non-small cell lung cancer stem/progenitor cells are enriched in
multiple distinct phenotypic subpopulations and exhibit plasticity.
Cell Death Dis. 3:e3522012. View Article : Google Scholar : PubMed/NCBI
|
|
29
|
Chang TS, Chen CL, Wu YC, Liu JJ, Kuo YC,
Lee KF, Lin SY, Lin SE, Tung SY, Kuo LM, et al: Inflammation
promotes expression of stemness-related properties in HBV-related
hepatocellular carcinoma. PLoS One. 11:e01498972016. View Article : Google Scholar : PubMed/NCBI
|
|
30
|
Medema JP: Cancer stem cells: The
challenges ahead. Nat Cell Biol. 15:338–344. 2013. View Article : Google Scholar : PubMed/NCBI
|
|
31
|
Lin L, Hutzen B, Lee HF, Peng Z, Wang W,
Zhao C, Lin HJ, Sun D, Li PK, Li C, et al: Evaluation of STAT3
signaling in ALDH+ and ALDH+/CD44+/CD24− subpopulations of breast
cancer cells. PLoS One. 8:e828212013. View Article : Google Scholar : PubMed/NCBI
|
|
32
|
Shao C, Sullivan JP, Girard L, Augustyn A,
Yenerall P, Rodriguez-Canales J, Liu H, Behrens C, Shay JW, Wistuba
II and Minna JD: Essential role of aldehyde dehydrogenase 1A3 for
the maintenance of non-small cell lung cancer stem cells is
associated with the STAT3 pathway. Clin Cancer Res. 20:4154–4166.
2014. View Article : Google Scholar : PubMed/NCBI
|
|
33
|
van der Zee M, Sacchetti A, Cansoy M,
Joosten R, Teeuwssen M, Heijmans-Antonissen C, Ewing-Graham PC,
Burger CW, Blok LJ and Fodde R: IL6/JAK1/STAT3 signaling blockade
in endometrial cancer affects the ALDHhi/CD126+ stem-like component
and reduces tumor burden. Cancer Res. 75:3608–3622. 2015.
View Article : Google Scholar : PubMed/NCBI
|
|
34
|
Han Z, Wang X, Ma L, Chen L, Xiao M, Huang
L, Cao Y, Bai J, Ma D, Zhou J and Hong Z: Inhibition of STAT3
signaling targets both tumor-initiating and differentiated cell
populations in prostate cancer. Oncotarget. 5:8416–8428. 2014.
View Article : Google Scholar : PubMed/NCBI
|
|
35
|
Lin L, Fuchs J, Li C, Olson V, Bekaii-Saab
T and Lin J: STAT3 signaling pathway is necessary for cell survival
and tumorsphere forming capacity in
ALDH+/CD133+ stem cell-like human colon
cancer cells. Biochem Biophys Res Commun. 416:246–251. 2011.
View Article : Google Scholar : PubMed/NCBI
|
|
36
|
Chang CH, Hsiao CF, Yeh YM, Chang GC, Tsai
YH, Chen YM, Huang MS, Chen HL, Li YJ, Yang PC, et al: Circulating
interleukin-6 level is a prognostic marker for survival in advanced
nonsmall cell lung cancer patients treated with chemotherapy. Int J
Cancer. 132:1977–1985. 2013. View Article : Google Scholar : PubMed/NCBI
|
|
37
|
Hennigan S and Kavanaugh A: Interleukin-6
inhibitors in the treatment of rheumatoid arthritis. Ther Clin Risk
Manag. 4:767–775. 2008. View Article : Google Scholar : PubMed/NCBI
|
|
38
|
Sebba A: Tocilizumab: The first
interleukin-6-receptor inhibitor. Am J Health Syst Pharm.
65:1413–1418. 2008. View Article : Google Scholar : PubMed/NCBI
|
|
39
|
Bayliss TJ, Smith JT, Schuster M, Dragnev
KH and Rigas JR: A humanized anti-IL-6 antibody (ALD518) in
non-small cell lung cancer. Expert Opin Biol Ther. 11:1663–1668.
2011. View Article : Google Scholar : PubMed/NCBI
|