Introduction
Metabolites are currently considered targets for
cancer treatments, particularly amino acids and glucose (1). Fatty acyl-Coenzyme A (CoA) esters are
essential components in lipid metabolism and are regulators of
multiple cellular functions (2).
Enzymes of the acyl-CoA synthetase (ACS) family, including the ACS
long-chain, ACS medium-chain, ACS short-chain and ACS bubblegum
families, ligate different lengths of fatty acid with CoA. Fatty
acyl-CoA esters are hydrolyzed into free fatty acids and CoA by
enzymes of the acyl-CoA thioesterase (ACOT) family (3,4). There are
>15 ACOT enzymes and 20 ACS enzymes in humans, and these enzymes
exhibit different tissue distribution, subcellular location and
substrate specificity (3,4).
Lung cancer is a leading cause of cancer-associated
mortality and is the second most commonly diagnosed cancer
(5). The majority (~85–90%) of
diagnosed cases of lung cancer are diagnosed as non-small cell lung
cancer (NSCLC) and adenocarcinoma is the most common subtype of
NSCLC (6). Compared with healthy
individuals, patients with lung adenocarcinoma possess a
significantly higher level of fatty acids (including arachidonic,
palmitic, linoleic and oleic acid) in their plasma (7,8). In
addition, overexpression of ACOT8 is associated with metastasis in
lung adenocarcinoma (9). However, the
cellular functions and the regulatory mechanisms of the majority of
ACOT and ACS enzymes in lung adenocarcinoma remain unclear. In the
present study, in order to systematically analyze the expression
pattern of these enzymes, expression levels of ACOT and ACS enzymes
were analyzed in clinical specimens of lung adenocarcinoma from six
microarray datasets that were collected from an online database. In
addition, the effect of these enzymes and their metabolic products
on cell proliferation was measured in lung adenocarcinoma cell
lines.
Materials and methods
Collection of microarray datasets of
human lung adenocarcinoma specimens
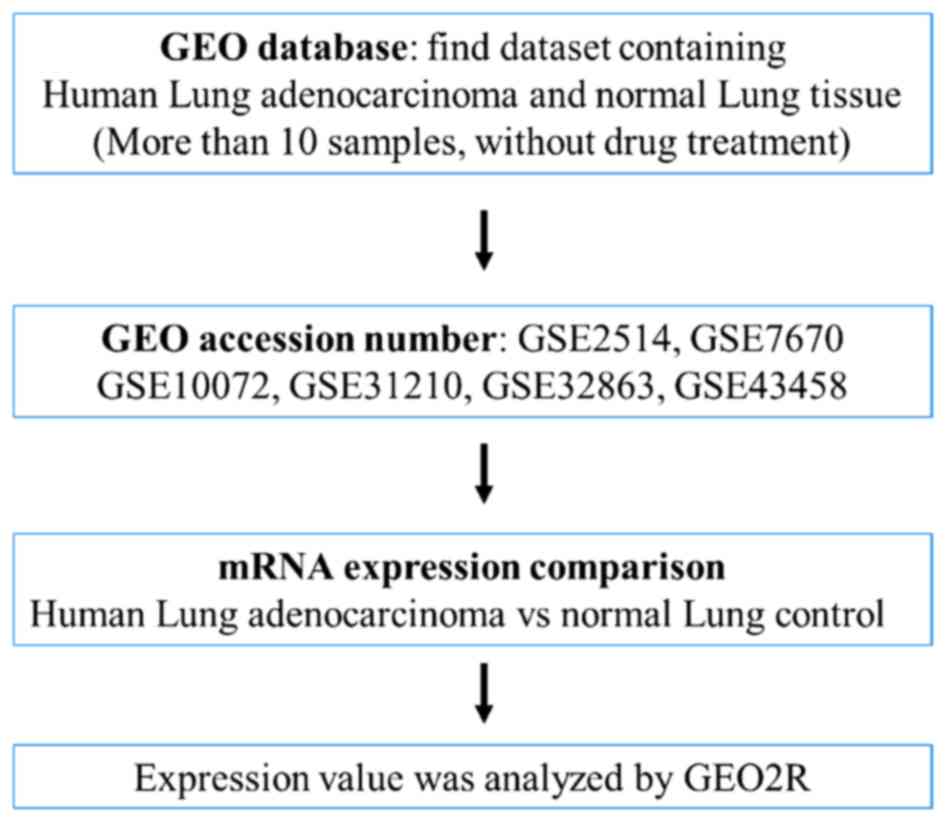
Expression profiling microarray data of human lung
adenocarcinoma clinical specimens, which was published between 2005
and 2015, was collected from the National Center for Biotechnology
Information Gene Expression Omnibus (GEO, http://www.ncbi.nlm.nih.gov/geo/) (10). Microarray data from cell lines or
small sample sizes (<10 samples) were excluded. Six microarray
datasets including GSE2514 (11),
GSE7670 (12), GSE10072 (13), GSE31210 (14), GSE32863 (15), and GSE43458 (16) were collected and the relative
expression levels of fatty acyl-CoA metabolic enzymes between
adjacent non-tumor lung tissue and lung adenocarcinoma were
analyzed in these microarray datasets. The expression value was
analyzed using the GEO2R interface (http://www.ncbi.nlm.nih.gov/geo/geo2r/).
Kaplan Meier (KM)-Plotter
The survival analysis in lung adenocarcinoma
patients with different expression levels of ACOT11 and ACOT13 was
performed using the KM-Plotter database (17). The prognostic value of each gene was
analyzed by splitting patient samples into two groups according to
median expression. After the subtype of lung cancer was restricted
(‘Histology: adenocarcinoma’) and survival rate was analyzed
through the ‘2015 version’ database and ‘excluded biased array’,
720 patients were analyzed.
Chemicals
Dimethyl sulfoxide (DMSO), puromycin, myristic acid,
palmitic acid and stearic acid were purchased from Sigma-Aldrich
(Merck KGaA, Darmstadt, Germany). Myristic acid, and palmitic acid
and stearic acid were dissolved in DMSO.
Cell culture
Human lung adenocarcinoma cell lines CL1-0 and CL1-5
were provided by Dr Pan-Chyr Yang (Department of Internal Medicine,
National Taiwan University Hospital, Taipei, Taiwan) and were
cultured in RPMI-1640 supplemented with 10% fetal bovine serum and
1% penicillin-streptomycin (all Thermo Fisher Scientific, Inc.,
Waltham, MA, USA) in a humidified incubator at 37°C with 5%
CO2 (18,19).
Short hairpin (sh)RNA and
transfection
shRNA targeting ACOT11 (shACOT11; TRCN0000048912;
targeting sequence: 5′-GTCTCCTCCTTGAAGATGCT-3′), ACOT13
(shACOT13-1; TRCN0000048954; targeting sequence:
5′-CGATATGAACATAACGTACAT-3′; shACOT13-2; targeting sequence:
TRCN0000048956; targeting sequence: 5′-GAAGAGCATACCAATGCAATA-3′)
and a negative control construct (luciferase shRNA, shLuc) were
obtained from the National Core Facility for Manipulation of Gene
Function by RNAi, miRNA, miRNA sponges, and CRISPR/Genomic Research
Center, Academia Sinica (Taipei, Taiwan). CL1-0 and CL1-5 cells
were transfected with each shRNA plasmid using
Lipofectamine® 2000 reagent (Invitrogen; Thermo Fisher
Scientific, Inc.) according to the manufacturer's protocol.
Transfected cells were selected and maintained in medium containing
2 µg/ml puromycin.
Reverse transcription-quantitative
polymerase chain reaction (RT-qPCR)
Total RNA was extracted from cells using TRIzol
reagent (Invitrogen; Thermo Fisher Scientific, Inc.) according to
manufacturer's protocol. Complementary DNA (cDNA) was reverse
transcribed from mRNA using the PrimeScript RT reagent kit
(Clontech Laboratories, Inc., Mountainview, CA, USA) according to
the manufacturer's protocol. PCR was performed using the following
primers: ACOT13 forward, 5′-TCTGCTATGCACGGAAAGGG-3′ and reverse,
5′-TTTCCTGTGGCCTTGTTGGT-3′; ACOT11 forward, 5′- GCG ATC TGG AGA GCA
GAG AC-3′ and reverse, 5′-GTGGCCACATTCTCCATCCA-3′; GAPDH forward,
5′-GAGTCAACGGATTTGGTCGT-3′ and reverse, 5′-TTGATTTTGGAGGGATCTCG-3′.
PCR was performed on a StepOne Plus Real-Time PCT System (Applied
Biosystems; Thermo Fisher Scientific, Inc.) using the Fast SYBR
Green Master Mix (Applied Biosystems; Thermo Fisher Scientific,
Inc.). The following settings were used: 1 cycle of 95°C for 20
sec, and 40 cycles of 95°C for 3 sec and 60°C for 30 sec. The mRNA
expression levels were normalized to the expression level of GAPDH
using the 2−∆∆Cq method (20).
Western blot analysis
Cells were lysed in radioimmunoprecipitation assay
buffer (EMD Millipore, Billerica, MA, USA) and the total cell
lysate was collected by centrifugation at 4°C, 12,000 × g for 15
min. Quantification of protein concentration was performed using a
BCA protein assay kit (EMD Millipore). A total of 30 µg/lane
protein was loaded, subjected to 10% SDS-PAGE and transferred to
polyvinylidene difluoride membranes (EMD Millipore). Membranes were
blocked with 5% dried skimmed milk in Tris-buffered saline with
Tween-20 buffer and then incubated with the primary antibodies
overnight at 4°C. Protein expression was detected using the
following primary antibodies: Anti-ACOT11 (dilution, 1:3,000; cat.
no. ab153835), anti-ACOT13 (dilution, 1:1,000; cat. no. ab166684;
both Abcam, Cambridge, UK) and anti-GAPDH (dilution, 1:6,000; cat.
no. MAB374; EMD Millipore). Each membrane was then incubated with
secondary andibodies, including peroxidase conjugated goat
anti-rabbit IgG (dilution, 1:5,000; cat. no. AP132P) and peroxidase
conjugated goat anti-mouse IgG, (dilution, 1:5,000; cat. no.
AP124P; both EMD Millipore) at room temperature for 1 h.
Immunoreactive signals were detected with Immobilon horseradish
peroxidase substrate enhanced chemiluminescence reagents (EMD
Millipore) and analyzed with the Alpha Innotech FluorChem FC2
imaging system (ProteinSimple; Bio-Techne, Minneapolis, MN,
USA).
Cell proliferation assay
For cell proliferation measurements, WST-1 (Clontech
Laboratories, Inc.) was used. A total of 5×10³ CL1-0 or
2.5×10³ CL1-5 cells were seeded in 96-well plates. The
proliferation rate was determined at a wavelength of 450 nm on a
microplate spectrophotometer (PowerWave X340, BioTek Instruments,
Inc., Winooski, VT, USA).
Free fatty acid quantification
A total of 1×10⁶ CL1-0 cells were seeded
into 10 cm dishes with 8 ml of culture medium. After 48 h, culture
medium and cells were collected for free fatty acid quantification.
Free fatty acids released into the culture medium and intracellular
free fatty acid were quantified using a Free Fatty Acid
Quantification Colorimetric/Fluorometric kit (BioVision, Inc.,
Milpitas, CA, USA) according to the manufacturer's protocol. The
results were determined on a fluorescent microplate reader at
excitation/emission=485/590 nm (FLX800 Microplate Fluorescence
Reader; BioTek Instruments, Inc.).
Statistical analysis
All statistical analyses were performed using
GraphPad Prism software (version 5.03; GraphPad Software, Inc., La
Jolla, CA, USA). All error bars in the figures represent standard
error of the mean. The differences between two independent groups
were analyzed using a Student's t-test. A log-rank test was
performed to assess differences in survival rate. P<0.05 was
considered to indicate a statistically significant difference.
Results
High ACOT11 and ACOT13 expression is
associated with lung adenocarcinoma and poor overall survival
rate
To investigate whether the expression of ACSs and
ACOTs was associated with lung adenocarcinoma, microarray datasets
with lung adenocarcinoma specimens were collected from the GEO
database. Following the exclusion of microarray data regarding cell
line studies and small sample sizes (<10 samples), six
microarrays that were performed by five different array platforms
were selected for the current study (Fig.
1). A number of enzymes were significantly differentially
expressed in lung adenocarcinoma tissue compared with non-tumor
lung tissue (Tables I and II). ACOT11 and ACOT13 overexpression was
observed in lung adenocarcinoma tissue across all selected
microarray datasets (Table I). A
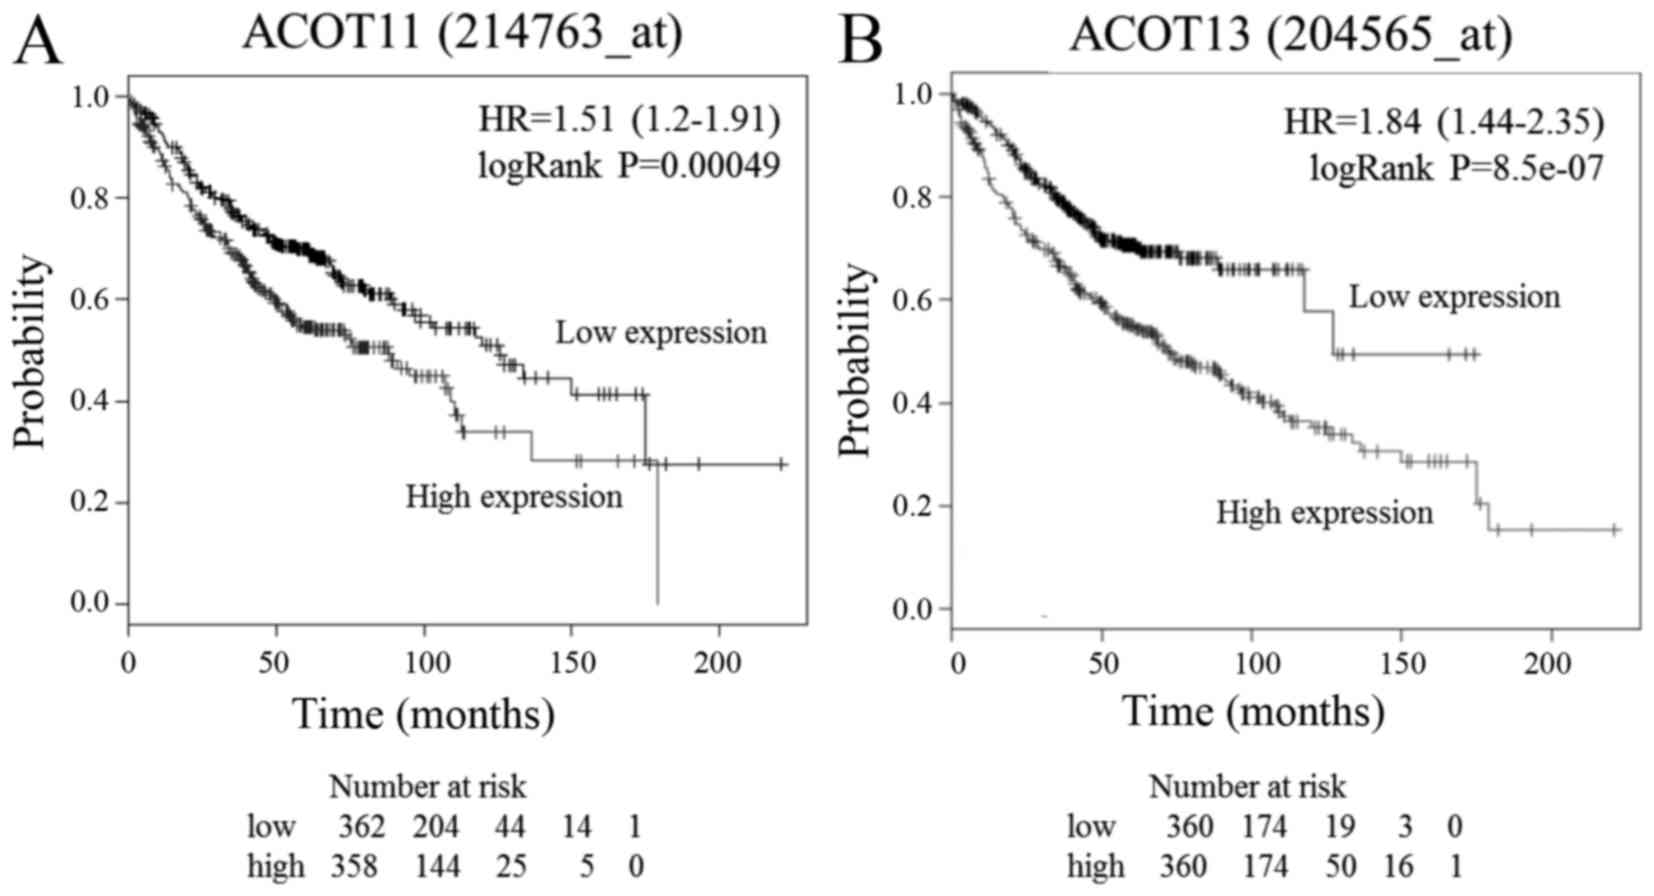
KM-Plotter database was used to further investigate the association
between the expression of ACOT11 and ACOT13 and clinical outcome.
Poor overall survival rate of patients with lung adenocarcinoma was
associated with high expression of ACOT11 and ACOT13 (P<0.001;
Fig. 2). These results suggest that
ACOT11 and ACOT13 serve roles in the development of lung
adenocarcinoma.
 | Table I.mRNA expression of ACOT enzymes in
lung adenocarcinoma tissue compared with normal tissue, from the
GEO database. |
Table I.
mRNA expression of ACOT enzymes in
lung adenocarcinoma tissue compared with normal tissue, from the
GEO database.
| Variable | Expression ratio
(normal/tumor) | P-value | Probe |
|---|
| Adjacent non-tumor
(n=19) vs. Lung adenocarcinoma (n=20); |
|
|
|
| GEO accession
number: GSE2514; GPL8300 platform (11) |
|
|
|
|
ACOT1/ACOT2 | 1.141 | 0.2120 | 36625_at |
|
ACOT7 | 0.823 | 0.0279 | 37945_at |
|
ACOT8 | 0.863 | 0.1003 | 36841_at |
|
ACOT11 | 0.880 | 0.3971 | 32405_at |
|
ACOT13 | 0.715 | <0.0001 | 41058_g_at |
| Adjacent non-tumor
(n=26) vs. Lung adenocarcinoma (n=26); |
|
|
|
| GEO accession
number: GSE7670; GPL96 platform (12) |
|
|
|
|
ACOT1/ACOT2 | 1.070 | 0.5266 | 202982_s_at |
|
ACOT7 | 0.861 | 0.1354 | 208002_s_at |
|
ACOT8 | 0.843 | 0.1336 | 204212_at |
|
ACOT9 | 1.120 | 0.8513 | 221641_s_at |
|
ACOT11 | 0.564 | 0.0002 | 214763_at |
|
ACOT13 | 0.678 | 0.0004 | 204565_at |
| Non-tumor tissue
(49) vs. Lung adenocarcinoma (58); |
|
|
|
| GEO accession
number: GSE10072; GPL96 platform (13) |
|
|
|
|
ACOT1/ACOT2 | 1.037 | 0.0002 | 202982_s_at |
|
ACOT7 | 0.991 | 0.4437 | 208002_s_at |
|
ACOT8 | 1.002 | 0.3531 | 204212_at |
|
ACOT9 | 1.010 | 0.1675 | 221641_s_at |
|
ACOT11 | 0.976 | 0.0001 | 214763_at |
|
ACOT13 | 0.934 | <0.0001 | 204565_at |
| Normal lung tissue
(n=20) vs. Lung adenocarcinoma (n=226); |
|
|
|
| GEO accession
number: GSE31210; GPL570 platform (14) |
|
|
|
|
ACOT2 | 1.047 | 0.7030 | 202982_s_at |
|
ACOT4 | 0.699 | 0.0215 | 229534_at |
|
ACOT6 | 1.122 | 0.6088 | 241949_at |
|
ACOT7 | 0.693 | 0.7152 | 208002_s_at |
|
ACOT8 | 0.681 | 0.0338 | 236514_at |
|
ACOT9 | 0.981 | 0.7506 | 221641_s_at |
|
ACOT11 | 0.256 | 0.0017 | 214763_at |
|
ACOT12 | 1.007 | 0.9543 | 238160_at |
|
ACOT13 | 0.549 | <0.0001 | 204565_at |
| Adjacent non-tumor
(n=58) vs. Lung adenocarcinoma (n=58); |
|
|
|
| GEO accession
number: GSE32863; GPL6884 platform (15) |
|
|
|
|
ACOT1 | 1.012 | 0.0049 | ILMN_2121389 |
|
ACOT2 | 1.007 | 0.0065 | ILMN_2188959 |
|
ACOT4 | 0.998 | 0.8718 | ILMN_1764321 |
|
ACOT6 | 0.999 | 0.7702 | ILMN_2156699 |
|
ACOT7 | 0.998 | 0.5223 | ILMN_1719178 |
|
ACOT8 | 1.004 | 0.5715 | ILMN_1679600 |
|
ACOT9 | 0.991 | 0.2383 | ILMN_2367070 |
|
ACOT11 | 0.879 | <0.0001 | ILMN_1739594 |
|
ACOT12 | 1.005 | 0.0271 | ILMN_1785474 |
|
ACOT13 | 0.963 | 0.0010 | ILMN_2098743 |
| Normal lung tissure
(30) vs. Lung adenocarcinoma (80); |
|
|
|
| GEO accession
number: GSE43458; GPL6244 platform (16) |
|
|
|
|
ACOT1 | 1.017 | 0.0716 | 7975598 |
|
ACOT2 | 1.045 | 0.0002 | 7975602 |
|
ACOT4 | 0.982 | 0.0794 | 7975607 |
|
ACOT6 | 0.987 | 0.0810 | 7975613 |
|
ACOT7 | 0.960 | 0.0095 | 7912012 |
|
ACOT8 | 1.010 | 0.1137 | 8066598 |
|
ACOT9 | 1.052 | <0.0001 | 8171802 |
|
ACOT11 | 0.952 | <0.0001 | 7901613 |
|
ACOT12 | 0.995 | 0.4263 | 8112920 |
|
ACOT13 | 0.965 | 0.0039 | 8117219 |
| Table II.mRNA expression of ACS enzymes in
lung adenocarcinoma tissue compared with normal tissue, from the
GEO database. |
Table II.
mRNA expression of ACS enzymes in
lung adenocarcinoma tissue compared with normal tissue, from the
GEO database.
| Variable | Expression ratio
(normal/tumor) | P-value | Probe |
|---|
| Adjacent non-tumor
(n=19) vs. Lung adenocarcinoma (n=20); |
|
|
|
| GEO accession
number: GSE2514; GPL8300 platform (11) |
|
|
|
|
ACSBG1 | 0.838 | 0.4937 | 32537_at |
|
ACSM1 | 0.851 | 0.6678 | 34050_at |
|
ACSM2A | 1.120 | 0.6902 | 37800_r_at |
|
ACSM3 | 0.707 | 0.0260 | 33280_r_at |
|
ACSL1 | 1.163 | 0.1418 | 40082_at |
|
ACSL3 | 0.941 | 0.6506 | 33880_at |
|
ACSL4 | 1.172 | 0.1663 | 38099_r_at |
|
ACSL6 | 1.083 | 0.7825 | 31834_r_at |
| Adjacent non-tumor
(n=26) vs. Lung adenocarcinoma (n=26); |
|
|
|
| GEO accession
number: GSE7670; GPL96 platform (12) |
|
|
|
|
ACSBG1 | 0.901 | 0.7335 | 206466_at |
|
ACSBG2 | 0.892 | 0.4825 | 221716_s_at |
|
ACSF2 | 0.861 | 0.3332 | 218844_at |
|
ACSM1 | 0.641 | 0.1782 | 215432_at |
|
ACSM2A/ACSM2B | 0.667 | 0.0532 | 214069_at |
|
ACSM3 | 0.587 | 0.0023 | 210377_at |
|
ACSM5 | 1.450 | 0.0357 | 220061_at |
|
ACSS3 | 1.098 | 0.3422 | 219616_at |
|
ACSL1 | 1.154 | 0.2702 | 207275_s_at |
|
ACSL3 | 1.391 | <0.0001 | 201660_at |
|
ACSL4 | 1.240 | 0.0936 | 202422_s_at |
|
ACSL5 | 0.822 | 0.1353 | 218322_s_at |
|
ACSL6 | 0.852 | 0.0875 | 216409_at |
| Non-tumor tissue
(49) vs. Lung adenocarcinoma (58); |
|
|
|
| GEO accession
number: GSE10072; GPL96 platform (13) |
|
|
|
|
ACSBG1 | 1.025 | 0.0007 | 206466_at |
|
ACSBG2 | 1.016 | 0.0283 | 221716_s_at |
|
ACSF2 | 0.989 | 0.1715 | 218844_at |
|
ACSM1 | 0.998 | 0.8514 | 215432_at |
|
ACSM2A/ACSM2B | 1.003 | 0.6717 | 214069_at |
|
ACSM3 | 1.013 | 0.2957 | 210377_at |
|
ACSM5 | 1.054 | <0.0001 | 220061_at |
|
ACSS3 | 1.038 | <0.0001 | 219616_at |
|
ACSL1 | 1.041 | 0.0003 | 207275_s_at |
|
ACSL3 | 1.052 | <0.0001 | 201660_at |
|
ACSL4 | 1.073 | <0.0001 | 202422_s_at |
|
ACSL5 | 1.026 | 0.0613 | 218322_s_at |
|
ACSL6 | 1.000 | 0.9467 | 216409_at |
| Normal lung tissue
(n=20) vs. Lung adenocarcinoma (n=226); |
|
|
|
| GEO accession
number: GSE31210; GPL570 platform (14) |
|
|
|
|
ACSBG1 | 2.087 | 0.0085 | 206465_at |
|
ACSBG2 | 1.030 | 0.8264 | 221716_s_at |
|
ACSF1 | 0.712 | 0.0040 | 218434_s_at |
|
ACSF2 | 0.653 | 0.0005 | 218844_at |
|
ACSM1 | 0.716 | 0.2056 | 215432_at |
|
ACSM2B | 1.052 | 0.6555 | 214069_at |
|
ACSM3 | 0.422 | 0.0031 | 205942_s_at |
|
ACSM5 | 1.006 | 0.9542 | 1554514_at |
|
ACSS1 | 0.767 | 0.0995 | 234484_s_at |
|
ACSS2 | 0.857 | 0.3373 | 234312_s_at |
|
ACSS3 | 1.220 | 0.1480 | 219616_at |
|
ACSL1 | 1.133 | 0.2698 | 207275_at |
|
ACSL3 | 0.826 | 0.0403 | 201661_s_at |
|
ACSL4 | 1.701 | <0.0001 | 1557419_a_at |
|
ACSL6 | 0.814 | 0.1151 | 211207_s_at |
| Adjacent non-tumor
(n=58) vs. Lung adenocarcinoma (n=58); |
|
|
|
| GEO accession
number: GSE32863; GPL6884 platform (15) |
|
|
|
|
ACSBG1 | 1.022 | 0.0072 | ILMN_2227011 |
|
ACSBG2 | 1.011 | <0.0001 | ILMN_1730002 |
|
ACSF1 | 0.953 | <0.0001 | ILMN_1698554 |
|
ACSF2 | 0.955 | 0.0007 | ILMN_1711928 |
|
ACSM1 | 1.000 | 0.9545 | ILMN_1661434 |
|
ACSM2A | 1.003 | 0.1501 | ILMN_1754517 |
|
ACSM2B | 0.999 | 0.6416 | ILMN_1765912 |
|
ACSM3 | 0.960 | <0.0001 | ILMN_1662738 |
|
ACSM4 | 0.999 | 0.6885 | ILMN_1791923 |
|
ACSM5 | 1.004 | 0.0358 | ILMN_1801698 |
|
ACSL1 | 1.068 | <0.0001 | ILMN_1684585 |
|
ACSL3 | 0.985 | 0.0964 | ILMN_2360605 |
|
ACSL4 | 0.999 | 0.6174 | ILMN_1691714 |
|
ACSL5 | 0.978 | 0.1879 | ILMN_2370882 |
| Normal lung tissue
(30) vs. Lung adenocarcinoma (80); |
|
|
|
| GEO accession
number: GSE43458; GPL6244 platform (16) |
|
|
|
|
ACSBG1 | 0.994 | 0.4965 | 7990683 |
|
ACSBG2 | 0.997 | 0.7000 | 8025011 |
|
ACSF2 | 1.021 | 0.1409 | 8008321 |
|
ACSF3 | 0.980 | 0.0043 | 7997863 |
|
ACSM1 | 0.991 | 0.2103 | 7999981 |
|
ACSM2A/ACSM2B | 0.971 | 0.0021 | 7993737 |
|
ACSM3 | 0.973 | 0.3288 | 7993756 |
|
ACSM5 | 1.008 | 0.3576 | 7993726 |
|
ACSM6 | 1.026 | 0.0003 | 7929497 |
|
ACSS1 | 1.021 | 0.0387 | 8065444 |
|
ACSS2 | 1.040 | 0.0009 | 8062041 |
|
ACSS3 | 1.181 | <0.0001 | 7957386 |
|
ACSL1 | 1.047 | 0.0012 | 8103951 |
|
ACSL3 | 1.007 | 0.4760 | 8048733 |
|
ACSL4 | 1.067 | <0.0001 | 8174474 |
|
ACSL5 | 0.970 | 0.0587 | 7930498 |
|
ACSL6 | 0.976 | 0.0021 | 8113938 |
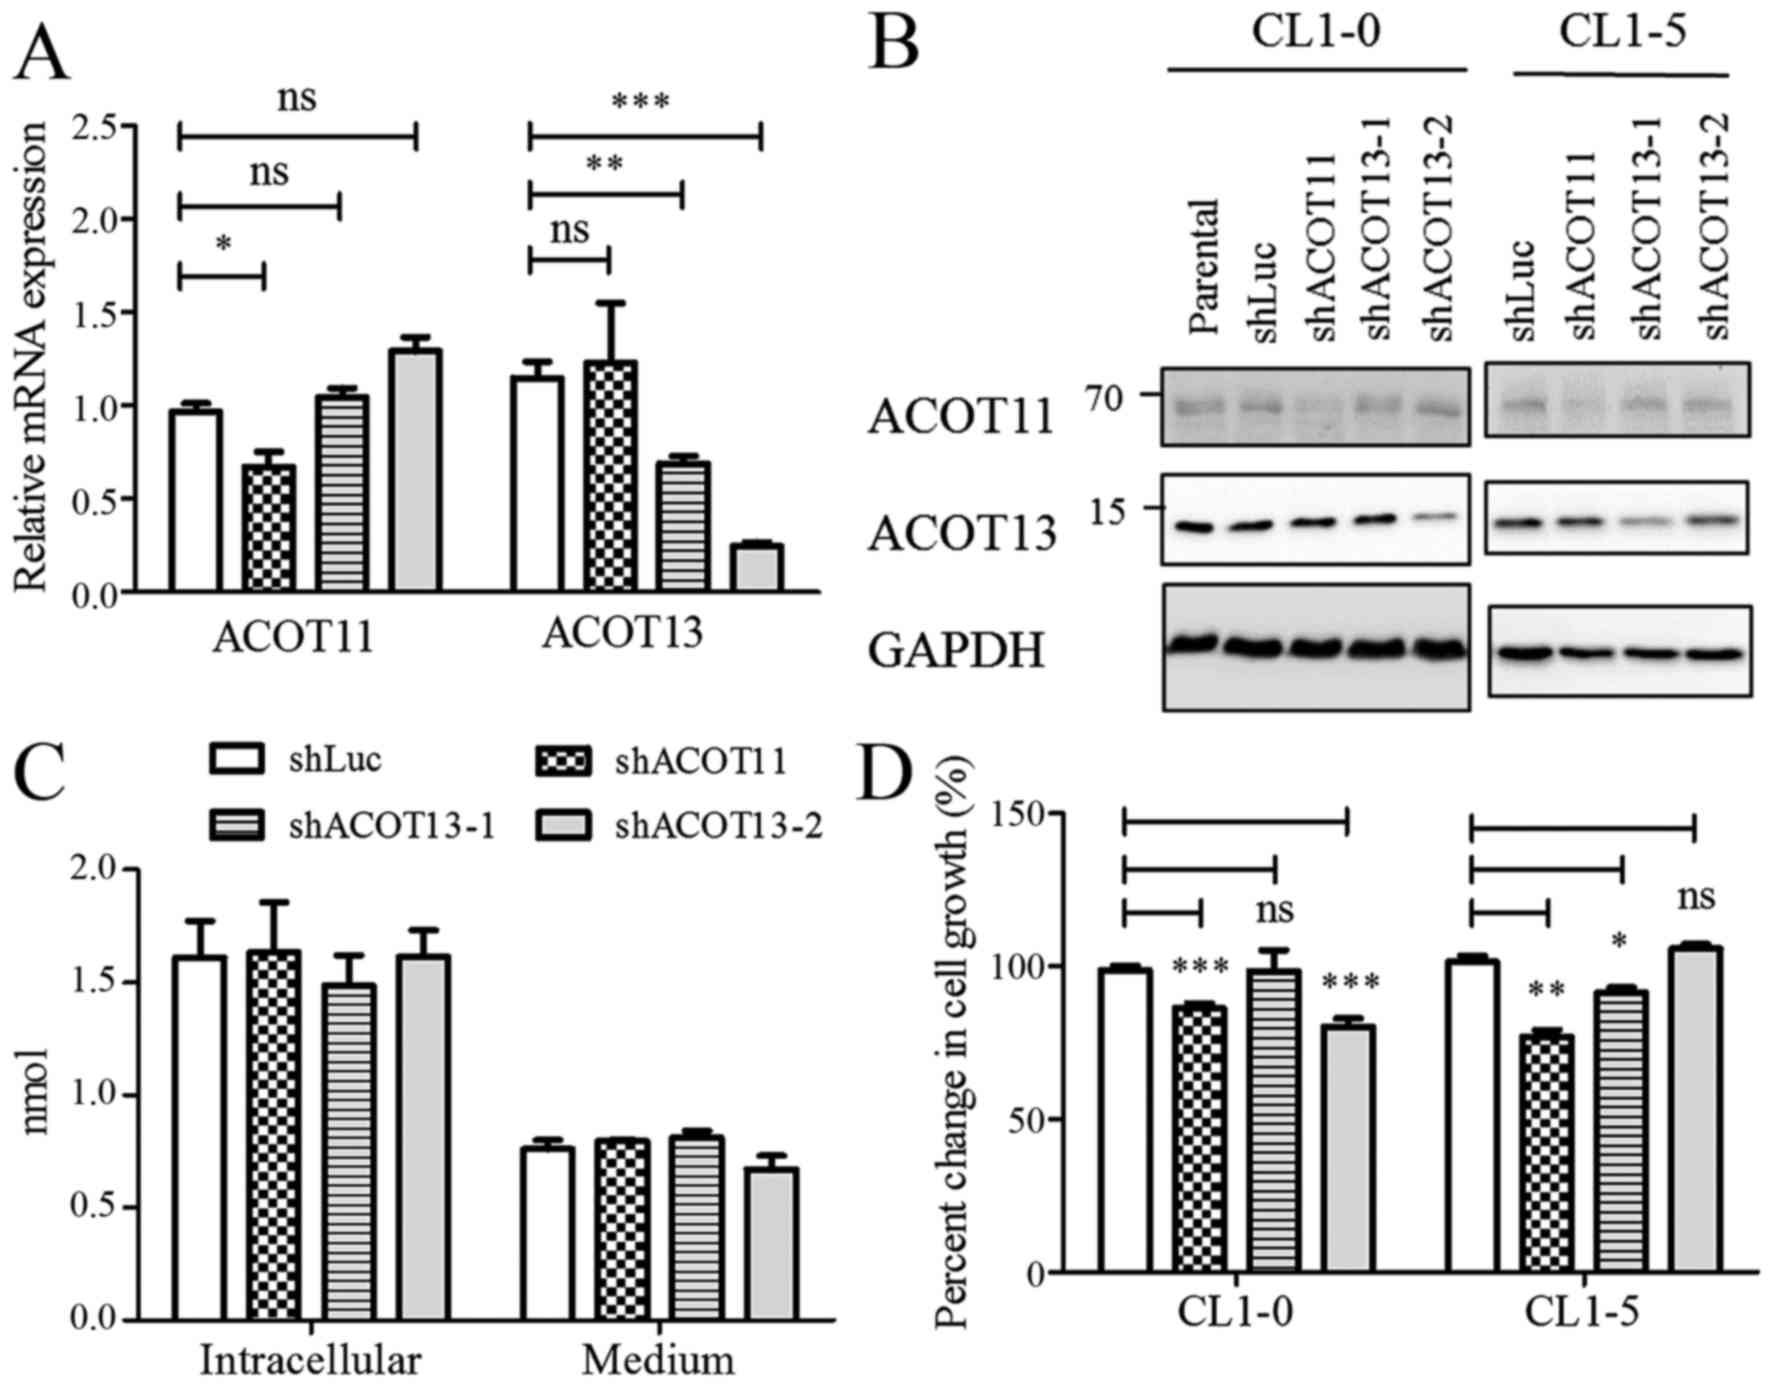
ACOT11 and ACOT13 knockdown decreases
cell proliferation but does not affect the level of free fatty
acids
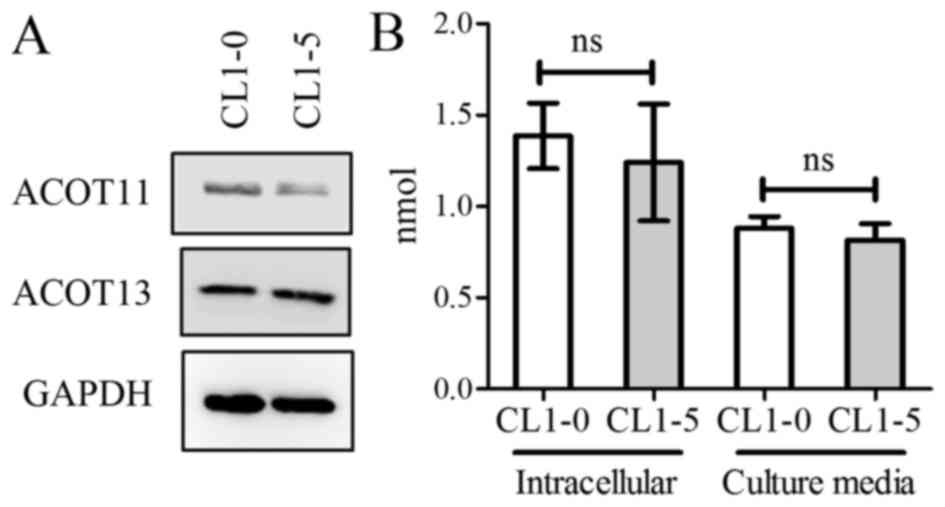
The CL1-0 and CL1-5 cell lines were established from
a patient with lung adenocarcinoma and exhibit different invasive
and metastatic properties (19).
Similar protein levels of ACOT11 and ACOT13, and similar levels of
intracellular and medium free fatty acid, were observed in the two
cell lines (Fig. 3A and B). In order
to determine the role of ACOT11 and ACOT13, shRNAs targeting ACOT11
(shACOT11) and ACOT13 (shACOT13-1 and shACOT13-2) were transfected
into CL1-0 and CL1-5 cells. Cells treated with shACOT11 exhibited
significantly decreased expression of ACOT11 (P<0.05; Fig. 4A). Similarly, cells treated with
shACOT13-1/−2 exhibited significantly decreased expression of
ACOT13 (P<0.01 and P<0.001, respectively; Fig. 4A). These changes were also exhibited
at the protein level (Fig. 4B).
Although decreasing expression of ACOT11 and ACOT13 did not result
in a significant change in total free fatty acids (Fig. 4C), significantly decreased
proliferation rates were observed in CL1-0 and CL1-5 cells treated
with shACOT11 compared with the control (P<0.001 and P<0.01,
respectively; Fig. 4D). In addition,
CL1-0 cells treated with shACOT13-2, and CL1-5 cells treated with
ahACOT13-1 exhibited significantly decreased proliferation rates
compared with the control (P<0.001 and P<0.05, respectively;
Fig. 4D). These results suggest that
ACOT11 and ACOT13 are critical for proliferation in lung
adenocarcinoma cell lines.
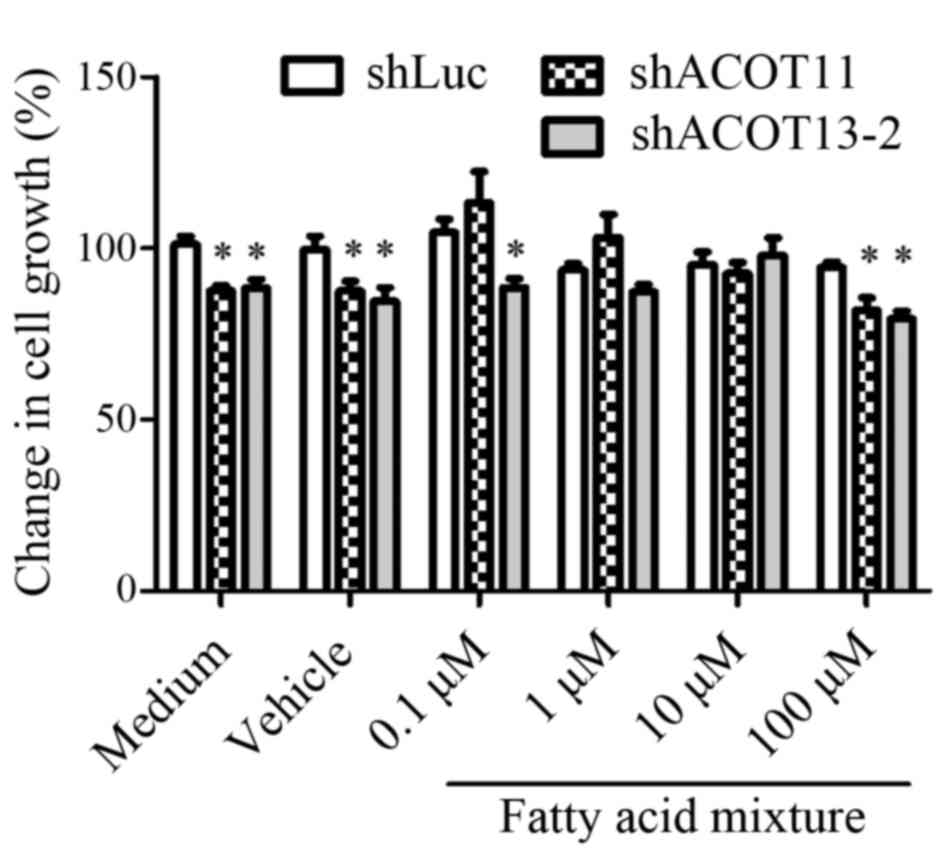
Free fatty acid supplements rescue the
decreased proliferation rate induced by ACOT11 and ACOT13
knockdown
ACOT11 and ACOT13 are members of the Type II ACOT
family (21). The substrates of
ACOT11 and ACOT13 include medium (6–12 carbon) to long (13–21
carbon) chain acyl CoA (22). It was
hypothesized that the observed decreased proliferation rates
following ACOT11/13 knockdown were associated with insufficient
availability of free fatty acids. Therefore ACOT11/13 knockdown
CL1-0 cells were treated with a fatty acid mixture, including
myristic (C14:0), palmitic (C16:0) and stearic acid (C18:0). The
cell proliferation rate was significantly decreased in the control
groups (medium and vehicle) following treatment with shACOT11/13-2
compared with the control luciferase shRNA group (P<0.05;
Fig. 5); however, treatment with the
fatty acid mixture (0.1–10 µM) restored shACOT11 and
shACOT13-mediated growth inhibition. However, this effect was
abolished following the addition of mixed free fatty acids at the
highest dose (100 µM), which may indicate a negative feedback
mechanism. The results suggest that the proliferation of lung
adenocarcinoma cells is dependent on ACOT11 and ACOT13-mediated
metabolic products.
Discussion
Dysregulation of metabolism is a hallmark of cancer
development. Acyl-CoAs are involved in the biosynthesis of lipids,
signal transduction and gene transcription (23). Previous studies have demonstrated that
certain types of fatty acid are increased in the serum or plasma of
patients with lung adenocarcinoma (7,8). Notably,
the level of fatty acids (palmitic, stearic, oleic, linoleic,
arachidonic and palmitoleic acid) decreased in the serum of
patients with lung cancer compared with the healthy controls
(24). This suggests that different
types of lung cancer may possess unique metabolic networks.
Although previous studies have demonstrated associations between a
single enzyme and a specific tumor type, including the association
between ACSL3, ACOT8 and liver cancer (25,26), very
long-chain ACS-3 (ACSVL3) and lung cancer (27), and ACOT8 and metastatic lung
adenocarcinoma (9), the associations
between types of tumor and the enzyme network of acyl-CoA and
acyl-CoA esters remain unclear. To systematically determine the
potential roles of all ACS and ACOT enzymes in lung adenocarcinoma,
the gene expression values from six different microarray datasets
were analyzed using five different platforms. Several enzymes
exhibited significantly different expression levels between normal
and lung adenocarcinoma tissue. High expression of ACOT11 and
ACOT13 was observed in tumors compared with normal tissue in each
dataset. KM-Plotter analysis demonstrated that high ACOT11/13
expression was correlated with poor overall survival rate. Since
the criteria was not restricted to metastatic lung adenocarcinoma,
ACOT8 expression levels in tumor tissue were not significantly
different compared with normal tissue in the present study. These
results indicated that ACOT11 and ACOT13 enzymes are potential
oncogenes in lung adenocarcinoma.
ACOT11 is highly expressed in brown adipose tissue
compared with other tissues (28).
The ACOT11 structure comprises two ‘hotdog’ domains and a
C-terminal lipid-binding steroidogenic acute regulatory
transfer-related (START) domain (22). Although a previous study suggested
that the START domain may be an important regulatory element for
ACOT11 (29), the exact mechanisms
underlying the regulation and function of ACOT11 remain unknown in
lung adenocarcinoma and other tissues. ACOT11 knockout mice
revealed increased energy consumption and resistance to high fat
diet-induced obesity compared with control mice (30). In addition, loss of ACOT11 leads to
resistance to obesity-induced inflammation and endoplasmic
reticulum stress (30). A high fat
diet significantly induced ACOT11 expression in mouse liver
(3). These observations suggest that
ACOT11 expression may serve as a risk factor for obesity. The
results from the present study demonstrate that ACOT11 expression
is associated with cell proliferation, suggesting that inhibition
of ACOT11 may be a strategy to treat lung adenocarcinoma.
AOCT13 comprises a single ‘hotdog’ domain and is
expressed in a number of tissues, including liver, heart, kidney
and brown adipose tissue (3). In
ACOT13 knockout mice, increasing concentrations of long-chain fatty
acyl-CoA and decreasing concentrations of free fatty acids is
detected in the liver (31). When
mice are fed with a high-fat diet, ACOT13 knockout mice resist
increases in glucose production in the liver (31). This observation suggests that ACOT13
serves a role in the regulation of lipid and glucose metabolism in
the liver. Notably, ACOT13 interacts with phosphatidylcholine
transfer protein (PC-TP), which possesses a START domain (32). Addition of recombinant PC-TP increases
ACOT13 enzyme activity in vitro (32). The interaction affects the
transcriptional activity of peroxisome proliferator-activated
receptor alpha and hepatocyte nuclear factor 4 alpha in the liver
(33). Since ACOT11 contains a START
domain, these observations imply that ACOT13 may also interact with
ACOT11. Since overexpression of ACOT11 and ACOT13 was observed in
the present study, these interactions may regulate critical
biological functions in lung adenocarcinoma.
The level of free fatty acids is significantly
altered in brown adipose tissue and liver in ACOT11 and ACOT13
knockout mice, respectively (30,31).
However, in the present study, ACOT11 and ACOT13 knockdown did not
affect the level of total amount of free fatty acid in CL1-0 cells.
There are two possible reasons for this. First, ACOT11 and ACOT13
may not be major lipid-metabolic enzymes in the lung adenocarcinoma
cell. Decreasing levels of ACOT11 and ACOT13-hydrolyzed free fatty
acids (medium to long-chain) may account for a small part of the
total free fatty acid pool. Second, free fatty acids may be
adequately supplied from the culture medium. Although ACOT11 and
ACOT13 knockdown results in the reduction of certain types of free
fatty acid, the effect may be diluted in the free fatty acid pool.
Addition of free fatty acid mixture restored the growth inhibition.
The results suggest that metabolic products of ACOT11 and ACOT13
(14 to 18 carbon) are important regulators for lung adenocarcinoma.
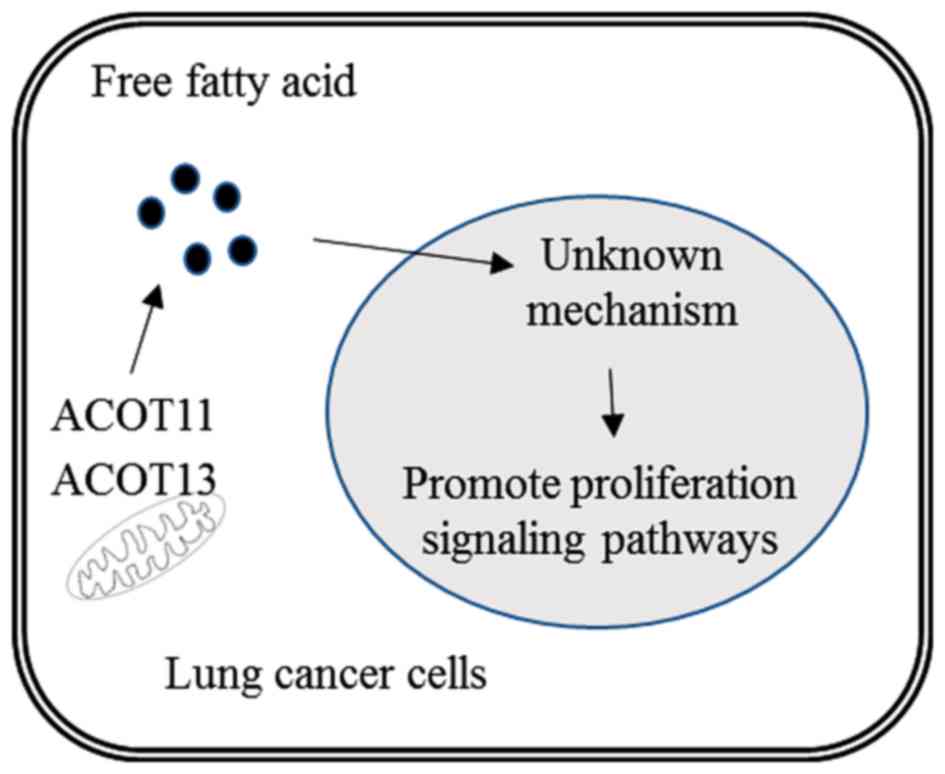
The findings are summarized in Fig.
6.
In conclusion, the results from the present study
reported the role of ACOT11 and ACOT13 in lung adenocarcinoma. High
ACOT11 and ACOT13 expression was associated with lung
adenocarcinoma and poor overall survival rate. Knockdown of ACOT11
and ACOT13 significantly decreased cell proliferation, an effect
that could be rescued by supplementing cells with free fatty acids.
To the best of our knowledge, this is the first report regarding
the potential oncogenic properties of ACOT11 and ACOT13 in lung
adenocarcinoma. ACOT11 and ACOT13 may represent targets for novel
treatments for patients with lung adenocarcinoma.
Acknowledgments
The present study was supported by grants from the
Ministry of Science and Technology of the Republic of China (grant
nos. MOST 103-2320-B-037-006-MY3 and MOST 104-2314-B-037-053-MY4),
the KMU-KMUH Co-Project of Key Research (grant no. KMU-DK 105002
from Kaohsiung Medical University) and the Chi-Mei Medical Center
and Kaohsiung Medical University Research Foundation (grant no. HSU
104CM-KMU-01).
References
|
1
|
Tennant DA, Durán RV and Gottlieb E:
Targeting metabolic transformation for cancer therapy. Nat Rev
Cancer. 10:267–277. 2010. View
Article : Google Scholar : PubMed/NCBI
|
|
2
|
Faergeman NJ and Knudsen J: Role of
long-chain fatty acyl-CoA esters in the regulation of metabolism
and in cell signalling. Biochem J. 323:1–12. 1997. View Article : Google Scholar : PubMed/NCBI
|
|
3
|
Ellis JM, Bowman CE and Wolfgang MJ:
Metabolic and tissue-specific regulation of acyl-CoA metabolism.
PLoS One. 10:e01165872015. View Article : Google Scholar : PubMed/NCBI
|
|
4
|
Hunt MC, Tillander V and Alexson SE:
Regulation of peroxisomal lipid metabolism: The role of acyl-CoA
and coenzyme A metabolizing enzymes. Biochimie. 98:45–55. 2014.
View Article : Google Scholar : PubMed/NCBI
|
|
5
|
Siegel RL, Miller KD and Jemal A: Cancer
statistics, 2015. CA Cancer J Clin. 65:5–29. 2015. View Article : Google Scholar : PubMed/NCBI
|
|
6
|
World Health Organisation, . World Cancer
Report 2014. Chapter 5.1. 2014.
|
|
7
|
Wen T, Gao L, Wen Z, Wu C, Tan CS, Toh WZ
and Ong CN: Exploratory investigation of plasma metabolomics in
human lung adenocarcinoma. Mol Biosyst. 9:2370–2378. 2013.
View Article : Google Scholar : PubMed/NCBI
|
|
8
|
Liu J, Mazzone PJ, Cata JP, Kurz A, Bauer
M, Mascha EJ and Sessler DI: Serum free fatty acid biomarkers of
lung cancer. Chest. 146:670–679. 2014. View Article : Google Scholar : PubMed/NCBI
|
|
9
|
Jung WY, Kim YH, Ryu YJ, Kim BH, Shin BK,
Kim A and Kim HK: Acyl-CoA thioesterase 8 is a specific protein
related to nodal metastasis and prognosis of lung adenocarcinoma.
Pathol Res Pract. 209:276–283. 2013. View Article : Google Scholar : PubMed/NCBI
|
|
10
|
Barrett T, Wilhite SE, Ledoux P,
Evangelista C, Kim IF, Tomashevsky M, Marshall KA, Phillippy KH,
Sherman PM, Holko M, et al: NCBI GEO: Archive for functional
genomics data sets-update. Nucleic Acids Res. 41:(Database issue).
D991–D995. 2013. View Article : Google Scholar : PubMed/NCBI
|
|
11
|
Stearman RS, Dwyer-Nield L, Zerbe L,
Blaine SA, Chan Z, Bunn PA Jr, Johnson GL, Hirsch FR, Merrick DT,
Franklin WA, et al: Analysis of orthologous gene expression between
human pulmonary adenocarcinoma and a carcinogen-induced murine
model. Am J Pathol. 167:1763–1775. 2005. View Article : Google Scholar : PubMed/NCBI
|
|
12
|
Su LJ, Chang CW, Wu YC, Chen KC, Lin CJ,
Liang SC, Lin CH, Whang-Peng J, Hsu SL, Chen CH and Huang CY:
Selection of DDX5 as a novel internal control for Q-RT-PCR from
microarray data using a block bootstrap re-sampling scheme. Bmc
Genomics. 8:1402007. View Article : Google Scholar : PubMed/NCBI
|
|
13
|
Landi MT, Dracheva T, Rotunno M, Figueroa
JD, Liu H, Dasgupta A, Mann FE, Fukuoka J, Hames M, Bergen AW, et
al: Gene expression signature of cigarette smoking and its role in
lung adenocarcinoma development and survival. PLoS One.
3:e16512008. View Article : Google Scholar : PubMed/NCBI
|
|
14
|
Okayama H, Kohno T, Ishii Y, Shimada Y,
Shiraishi K, Iwakawa R, Furuta K, Tsuta K, Shibata T, Yamamoto S,
et al: Identification of genes upregulated in ALK-positive and
EGFR/KRAS/ALK-negative lung adenocarcinomas. Cancer Res.
72:100–111. 2012. View Article : Google Scholar : PubMed/NCBI
|
|
15
|
Selamat SA, Chung BS, Girard L, Zhang W,
Zhang Y, Campan M, Siegmund KD, Koss MN, Hagen JA, Lam WL, et al:
Genome-scale analysis of DNA methylation in lung adenocarcinoma and
integration with mRNA expression. Genome Res. 22:1197–1211. 2012.
View Article : Google Scholar : PubMed/NCBI
|
|
16
|
Kabbout M, Garcia MM, Fujimoto J, Liu DD,
Woods D, Chow CW, Mendoza G, Momin AA, James BP, Solis L, et al:
ETS2 mediated tumor suppressive function and MET oncogene
inhibition in human non-small cell lung cancer. Clin Cancer Res.
19:3383–3395. 2013. View Article : Google Scholar : PubMed/NCBI
|
|
17
|
Győrffy B, Surowiak P, Budczies J and
Lánczky A: Online Survival Analysis Software to Assess the
Prognostic Value of Biomarkers Using Transcriptomic data in
Non-Small-Cell Lung Cancer. PLoS One. 8:e822412013. View Article : Google Scholar : PubMed/NCBI
|
|
18
|
Kao YR, Shih JY, Wen WC, Ko YP, Chen BM,
Chan YL, Chu YW, Yang PC, Wu CW and Roffler SR: Tumor-associated
antigen L6 and the invasion of human lung cancer cells. Clin Cancer
Res. 9:2807–2816. 2003.PubMed/NCBI
|
|
19
|
Chu YW, Yang PC, Yang SC, Shyu YC, Hendrix
MJ, Wu R and Wu CW: Selection of invasive and metastatic
subpopulations from a human lung adenocarcinoma cell line. Am J
Respir Cell Mol Biol. 17:353–360. 1997. View Article : Google Scholar : PubMed/NCBI
|
|
20
|
Livak KJ and Schmittgen TD: Analysis of
relative gene expression data using real-time quantitative PCR and
the 2(−Delta Delta C(T)) Method. Methods. 25:402–408. 2001.
View Article : Google Scholar : PubMed/NCBI
|
|
21
|
Kirkby B, Roman N, Kobe B, Kellie S and
Forwood JK: Functional and structural properties of mammalian
acyl-coenzyme A thioesterases. Prog Lipid Res. 49:366–377. 2010.
View Article : Google Scholar : PubMed/NCBI
|
|
22
|
Cohen DE: New players on the metabolic
stage: How do you like Them Acots? Adipocyte. 2:3–6. 2013.
View Article : Google Scholar : PubMed/NCBI
|
|
23
|
Hunt MC and Alexson SE: The role Acyl-CoA
thioesterases play in mediating intracellular lipid metabolism.
Prog Lipid Res. 41:99–130. 2002. View Article : Google Scholar : PubMed/NCBI
|
|
24
|
Li Y, Song X, Zhao XJ, Zou LJ and Xu GW:
Serum metabolic profiling study of lung cancer using ultra high
performance liquid chromatography/quadrupole time-of-flight mass
spectrometry. J Chromatogr B Analyt Technol Biomed Life Sci.
966:147–153. 2014. View Article : Google Scholar : PubMed/NCBI
|
|
25
|
Chang YS, Tsai CT, Huangfu CA, Huang WY,
Lei HY, Lin CF, Su IJ, Chang WT, Wu PH, Chen YT, et al: ACSL3 and
GSK-3β are essential for lipid upregulation induced by endoplasmic
reticulum stress in liver cells. J Cell Biochem. 112:881–893. 2011.
View Article : Google Scholar : PubMed/NCBI
|
|
26
|
Hung YH, Chan YS, Chang YS, Lee KT, Hsu
HP, Yen MC, Chen WC, Wang CY and Lai MD: Fatty acid metabolic
enzyme acyl-CoA thioesterase 8 promotes the development of
hepatocellular carcinoma. Oncol Rep. 31:2797–2803. 2014.PubMed/NCBI
|
|
27
|
Pei Z, Fraisl P, Shi X, Gabrielson E,
Forss-Petter S, Berger J and Watkins PA: Very Long-Chain Acyl-CoA
Synthetase 3: Overexpression and Growth Dependence in Lung Cancer.
PLoS One. 8:e693922013. View Article : Google Scholar : PubMed/NCBI
|
|
28
|
Adams SH, Chui C, Schilbach SL, Yu XX,
Goddard AD, Grimaldi JC, Lee J, Dowd P, Colman S and Lewin DA:
BFIT, a unique acyl-CoA thioesterase induced in thermogenic brown
adipose tissue: Cloning, organization of the human gene and
assessment of a potential link to obesity. Biochem J. 360:135–142.
2001. View Article : Google Scholar : PubMed/NCBI
|
|
29
|
Thorsell AG, Lee WH, Persson C, Siponen
MI, Nilsson M, Busam RD, Kotenyova T, Schüler H and Lehtiö L:
Comparative structural analysis of lipid binding START domains.
PLoS One. 6:e195212011. View Article : Google Scholar : PubMed/NCBI
|
|
30
|
Zhang Y, Li Y, Niepel MW, Kawano Y, Han S,
Liu S, Marsili A, Larsen PR, Lee CH and Cohen DE: Targeted deletion
of thioesterase superfamily member 1 promotes energy expenditure
and protects against obesity and insulin resistance. Proc Natl Acad
Sci USA. 109:5417–5422. 2012. View Article : Google Scholar : PubMed/NCBI
|
|
31
|
Kang HW, Niepel MW, Han S, Kawano Y and
Cohen DE: Thioesterase superfamily member 2/acyl-CoA thioesterase
13 (Them2/Acot13) regulates hepatic lipid and glucose metabolism.
FASEB J. 26:2209–2221. 2012. View Article : Google Scholar : PubMed/NCBI
|
|
32
|
Wei J, Kang HW and Cohen DE: Thioesterase
superfamily member 2 (Them2)/acyl-CoA thioesterase 13 (Acot13): A
homotetrameric hotdog fold thioesterase with selectivity for
long-chain fatty acyl-CoAs. Biochem J. 421:311–322. 2009.
View Article : Google Scholar : PubMed/NCBI
|
|
33
|
Kang HW, Kanno K, Scapa EF and Cohen DE:
Regulatory role for phosphatidylcholine transfer protein/StarD2 in
the metabolic response to peroxisome proliferator activated
receptor alpha (PPARalpha). Biochim Biophys Acta. 1801:496–502.
2010. View Article : Google Scholar : PubMed/NCBI
|