Introduction
Despite a decline in the incidence rate in recent
decades, gastric cancer (GC) remained the world's third leading
cause of cancer-associated mortality in 2012, responsible for
723,100 mortalities (1). Early-stage
GC treated with standardized surgery with endoscopic submucosal
dissection has been demonstrated to present with a good outcome.
However, for advanced GC (AGC), systematic treatment strategies
exhibit limited efficacy; even with radical surgery and
perioperative adjuvant chemo/radiotherapy, the 5-year survival rate
remains only between 25 and 35% (2).
Unfortunately, the majority of patients with GC are diagnosed at an
advanced stage, and their prognosis is uncertain due to the risk of
relapse, distant metastasis and chemo-resistance (3). Studies have demonstrated that
intratumoral micro-vascular and micro-lymphatic vessels are
associated with metastasis of GC and the poor prognosis of the
patients (4), which may be reasoned
by the higher micro-vessel density (MVD) and micro-lymphatic vessel
density (LVD), the more microvascular and lymphatic invasion of GC
(5). However, histological
examination of MVD or LVD has been restricted by its invasiveness,
deficiency of specimens, and sampling-bias.
Imaging modalities with contrast enhancement
techniques possess the potential to map the vascularity of tumors
non-invasively (6–9). Dynamic contrast-enhanced magnetic
resonance imagery, computed tomography (CT) perfusion and
contrast-enhanced power Doppler endosonography, for example, have
been used to investigate the association between their exclusive
parameters and angiogenesis in GC. Lately developed spectral CT,
with a fast keV switching tube and a garnet crystal detector,
enables increased precision dual-energy data acquisition
simultaneously. With virtual monochromatic spectral (VMS) and
material decomposition (MD) images, spectral CT provides additional
information beyond the anatomical image; it can quantitatively
estimate the iodine concentration (IC) in lesions and normal tissue
(10). The IC value has been
demonstrated to possess a strong linear correlation with the real
IC in the phantom (11).
A number of studies have been conducted on the use
of dual energy images for diagnostic workup (10,12,13),
prediction of treatment response (14,15),
particularly for imaging biomarker (16). We hypothesized that quantitative
imaging biomarkers may have an unknown connection to the
aforementioned pathological biomarkers to fulfill their function. A
limited number of studies have investigated the association between
spectral CT and pathological prognostic features in patients with
GC. Therefore, the aim of the present study was to investigate the
relevance of micro-vessel IC values (micro-blood vessels and
micro-lymphatic vessels) to clinicopathological features in
AGC.
Patients and methods
Patients
The present study was approved by the institutional
review board of The First Affiliated Hospital of Zhengzhou
University (Zhengzhou, China) and all patients provided written
informed consent prior to participation. All procedures performed
in the present study involving humans were in accordance with
ethical standards.
Between June 2014 and September 2015, 55 adult
patients with gastric adenocarcinoma confirmed by endoscopic
biopsy, who were scheduled for surgery in The First Affiliated
Hospital of Zhengzhou University, were enrolled in the present
study. Exclusion criteria were as follows: i) Allergy to
intravenous contrast media, or cardiac or renal insufficiency; ii)
history of chemotherapy or radiotherapy; iii) no tumor visible at
CT data acquisition; iv) tumor with visible distant metastasis; and
v) failure of the histopathological specimen preparation.
A total of 6 patients rejected surgery in favor of
neoadjuvant chemotherapy. The remaining 49 patients underwent a
radical gastrectomy and D2 lymphadenectomy procedure within 1 week
of enhanced bi-phase spectral CT examination (Discovery CT750 HD;
GE Medical Systems, Milwaukee, WI, USA). Pathological results
revealed 2 early-stage cases that CT scans failed to identify and 1
case of neuroendocrine GC. Additionally, 4 cases failed
immunostaining. These 7 patients were excluded from analysis.
Therefore, 42 patients, 29 men and 13 women, with complete CT,
postoperative pathological and immunohistochemistry data were
studied. Patient records and pathological data including tumor
location and size, invasion depth, lymph node involvement,
pathological tumor-node-metastasis (pTNM) staging (17) and histological grading are presented
in Table I.
 | Table I.Clinical characteristics of the
patients (n=42). |
Table I.
Clinical characteristics of the
patients (n=42).
| Characteristic | Value |
|---|
| Sexa |
|
| Male | 29 (69.05) |
|
Female | 13 (30.95) |
| Age,
yearsb | 30–73 (57±1.7) |
| Tumor size,
cmc | 4.8±1.2 |
| Tumor
locationa |
|
|
Cardia | 17 (40.48) |
|
Body | 11 (26.19) |
|
Pylorus | 14 (33.33) |
| Nodal
statusa,d |
|
| N0 | 14 (33.33) |
| N1 | 12 (28.57) |
| N2 | 7 (16.67) |
| N3 | 9 (21.43) |
| Depth of
invasiona,d |
|
|
pT2 | 5 (11.90) |
|
pT3 | 3 (7.14) |
|
pT4a | 28 (66.67) |
|
pT4b | 6 (14.29) |
| Distant
metastasisa |
|
| M0 | 39 (92.86) |
| M1 | 3e (7.14) |
| pTNMa |
|
| Ib | 4 (9.52) |
| II | 14 (33.33) |
|
III | 21 (50.00) |
| IV | 3 (7.14) |
| Histological
gradinga |
|
|
Moderately differentiated | 17 (40.48) |
| Poorly
differentiated | 25 (59.52) |
CT protocol
Following an overnight fast, each patient was
administered an intramuscular injection of 10 mg anisodamine
(Hangzhou Minsheng Pharmaceutical Group Co. Ltd., Hangzhou, China)
to suppress peristalsis, and 800–1,000 ml water was ingested to
distend the stomach immediately prior to examination. Subsequently
a supine bi-phase enhanced CT scan that incorporated the area
between the diaphragmatic dome and the pubic symphysis was
performed. Scanning parameters were as follows: Rotation time, 0.6
sec; helical pitch, 1.375:1; section thickness and intervals, 5-mm.
A 0.5-msec tube voltage switch (140 and 80 kVp) and gemstone
spectral imaging (GSI) assist technique determined the required
mode. A total of 60–110 ml (1.3 ml/kg) of the non-ionic contrast
material iohexol (350 mg I/ml; GE Pharmaceutical, Shanghai, China)
was injected into the peripheral vein with a dual high-pressure
syringe at a rate of 3.5 ml/sec. Arterial phase (AP) scanning was
triggered 9 sec after the attenuation of the diaphragmatic
abdominal aorta reached 100 HU. Venous phase (VP) scanning followed
with 30 sec intervals.
Image analysis
All CT datasets were transferred to a commercially
available workstation for analysis (Advantage Windows version 4.6;
GE Healthcare). Subsequently, two experienced radiologists (with 25
and 5 years of abdominal CT experience, respectively), who were
blinded to clinical data and pathological results, analyzed the
images. According to a previous study (18), VMS images captured at 70 keV using 40%
adaptive statistical reconstruction techniques exhibited decreased
levels of image noise and high contrast-noise-ratio compared with
120 kVp images. The IC value (measured in 100 µg/ml, throughout the
text) was then measured using axial iodine-based MD image at
1.25-mm thickness (Figs. 1A-D and
2A-D). The outline of the region of
interest (ROI)-lesions encompassed the largest area of the lesion
in 2 or 3 consecutive layers, while avoiding areas of necrosis,
vessels, air and fat attenuation. ICs in the AP (ICAP)
and the VP (ICVP) were measured separately. Circular ROI
was assigned to the abdominal aorta in the same layer as the
ROI-lesion for calculating the normalized IC (nIC);
nIC=IClesion/ICaorta (11). All of the ICAP/VP and
nICAP/VP data obtained from the ROIs of the same tumor
were averaged and recorded (Table
II).
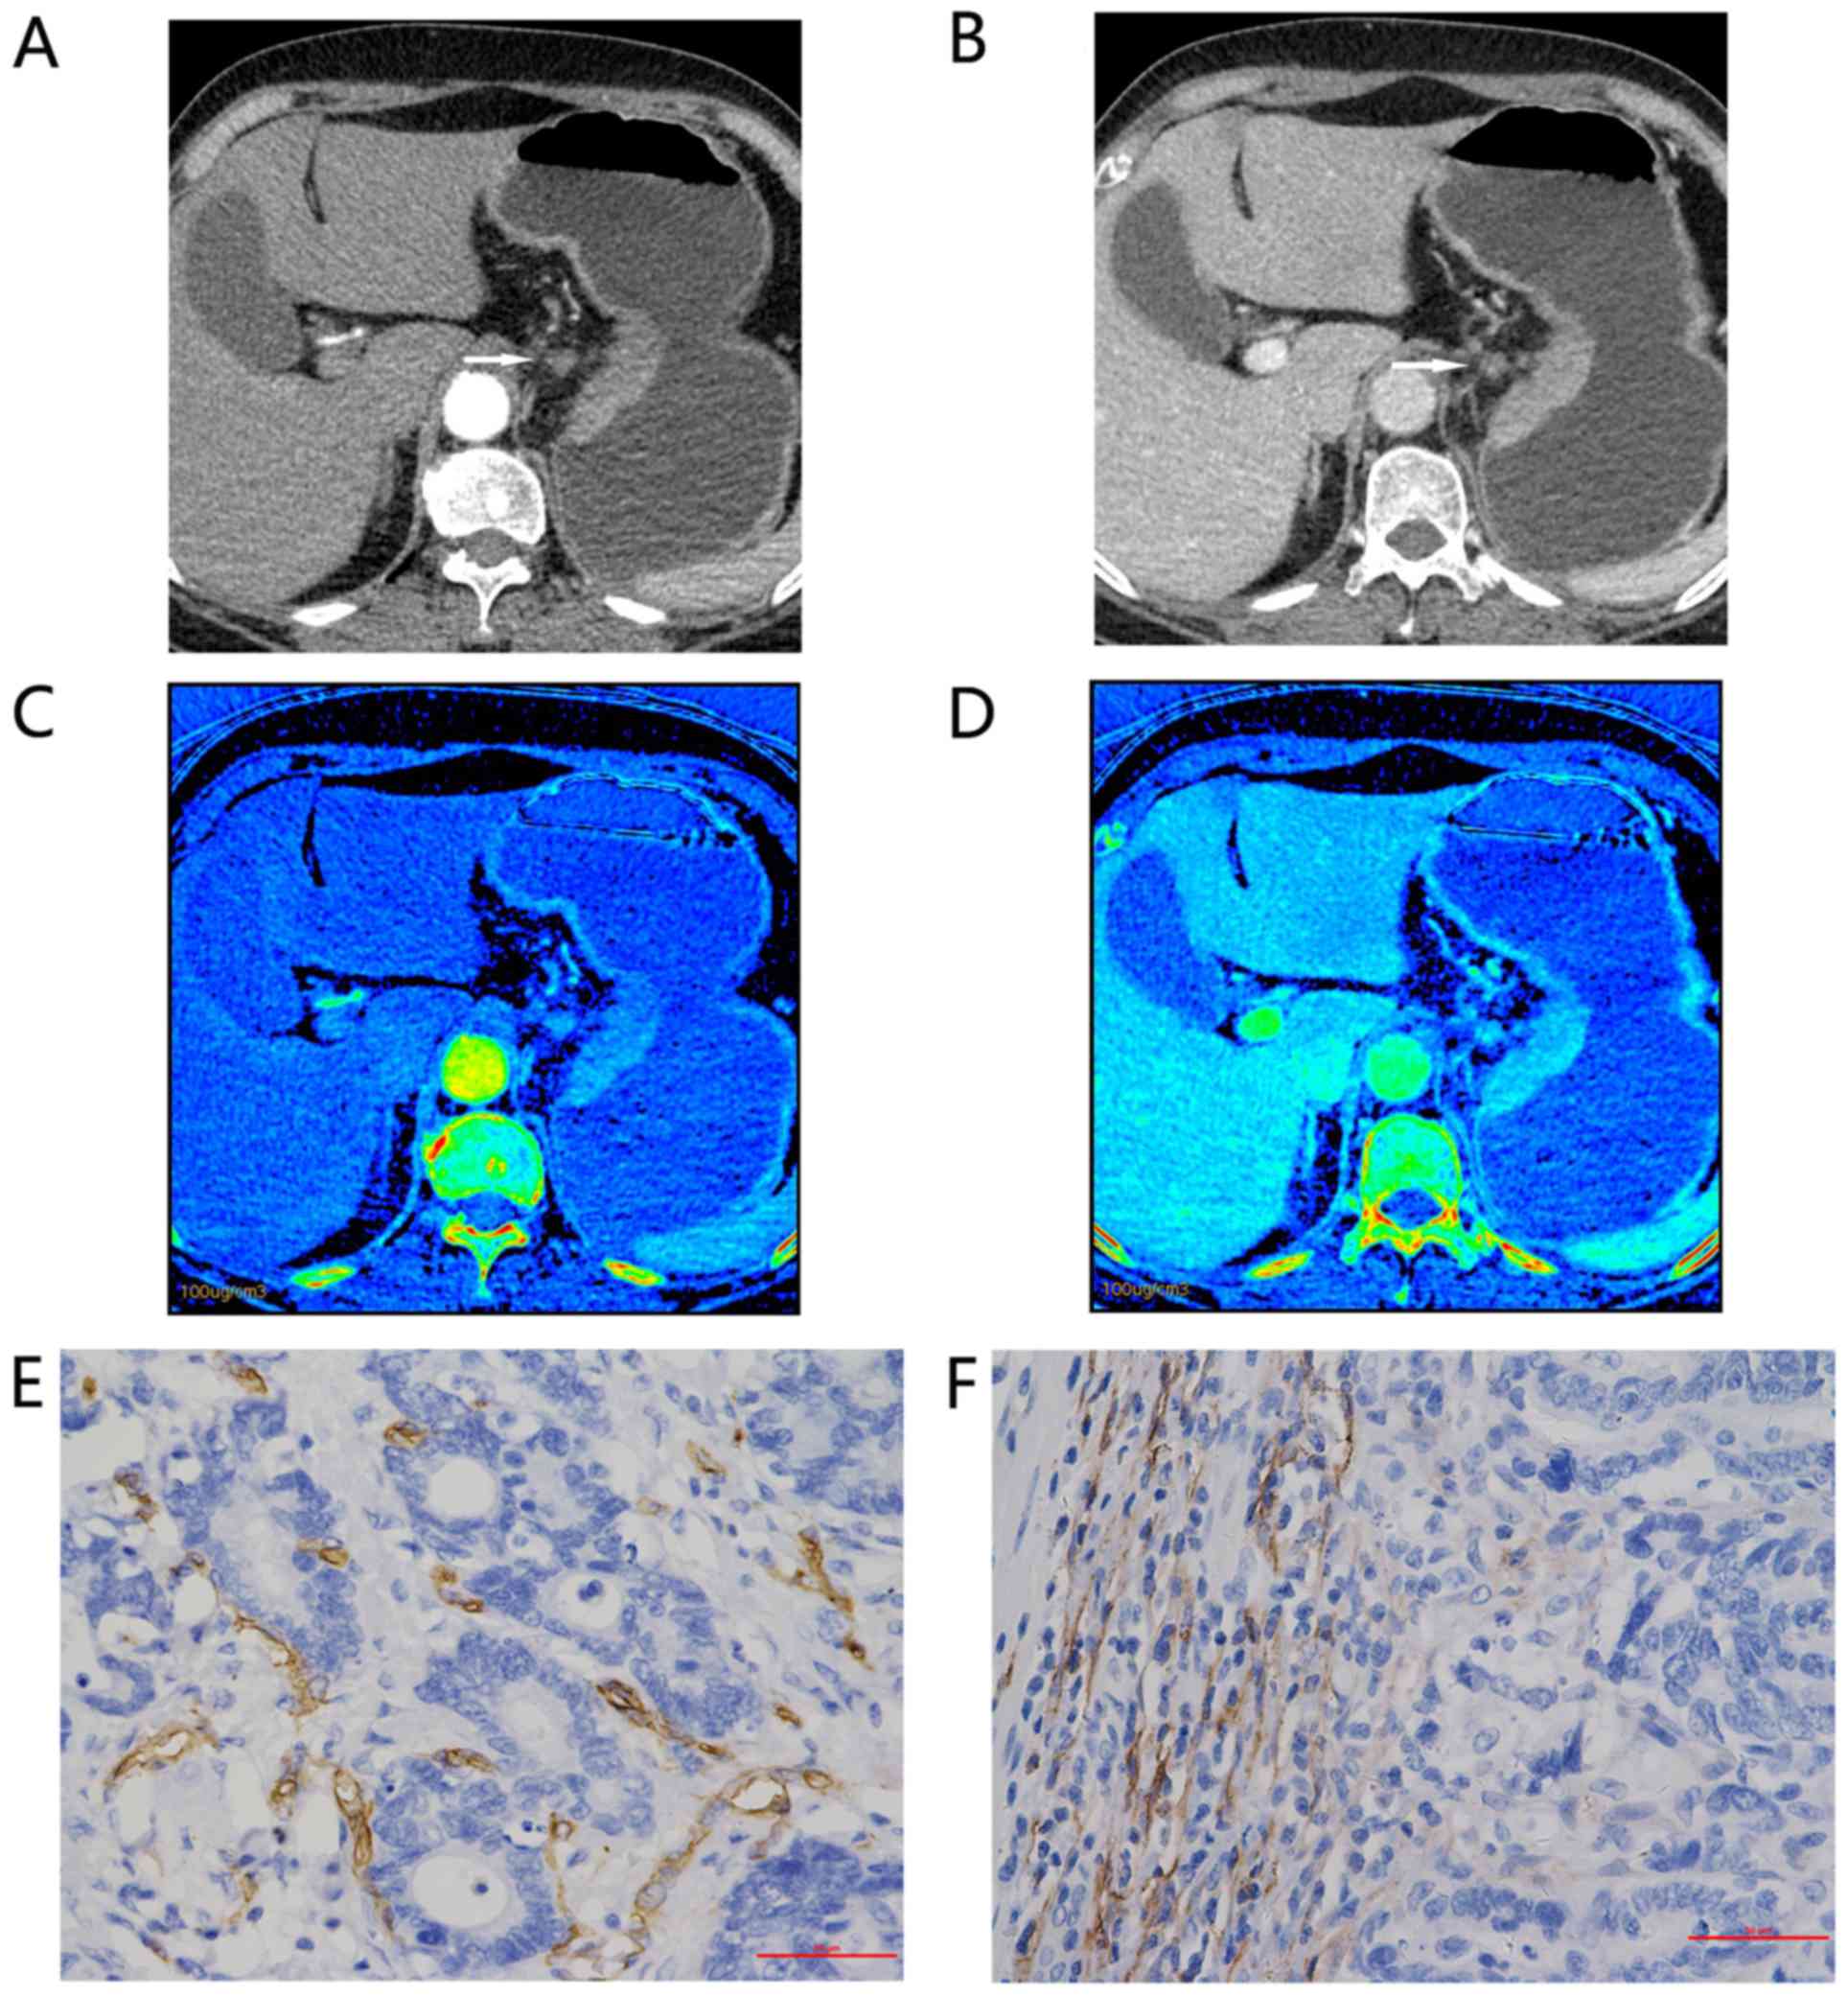 | Figure 1.Representative findings for a
67-year-old woman with moderately differentiated adenocarcinoma of
the gastric cardia and lesser curvature, staging IIIb (T4aN2M0).
Enhanced gemstone spectral imaging-computed tomography scans
revealed focal wall thickening in the lesser curvature, with mild
inhomogeneous enhancement. Distinct 70-keV monochromatic axial
images (lymphatic nodular enlargement identified with an arrow) in:
(A) AP and (B) VP. Iodine-based material decomposition axial images
in: (C) AP, demonstrating an IC value of 9.32 and an nIC value of
0.10; and (D) VP, demonstrating an IC value of 19.25 and an nIC
value of 0.403. Immunohistochemical staining revealed: (E) Brown
CD34-positive micro-vessels (micro-vessel density count, 22;
magnification, ×400); and (F) brown D2-40-positive lymphatic
vessels (lymphatic vessel density count, 28; magnification, ×400).
All IC values in 100 µg/ml. AP, arterial phase; VP, portal venous
phase; nIC, normalized iodine concentration. |
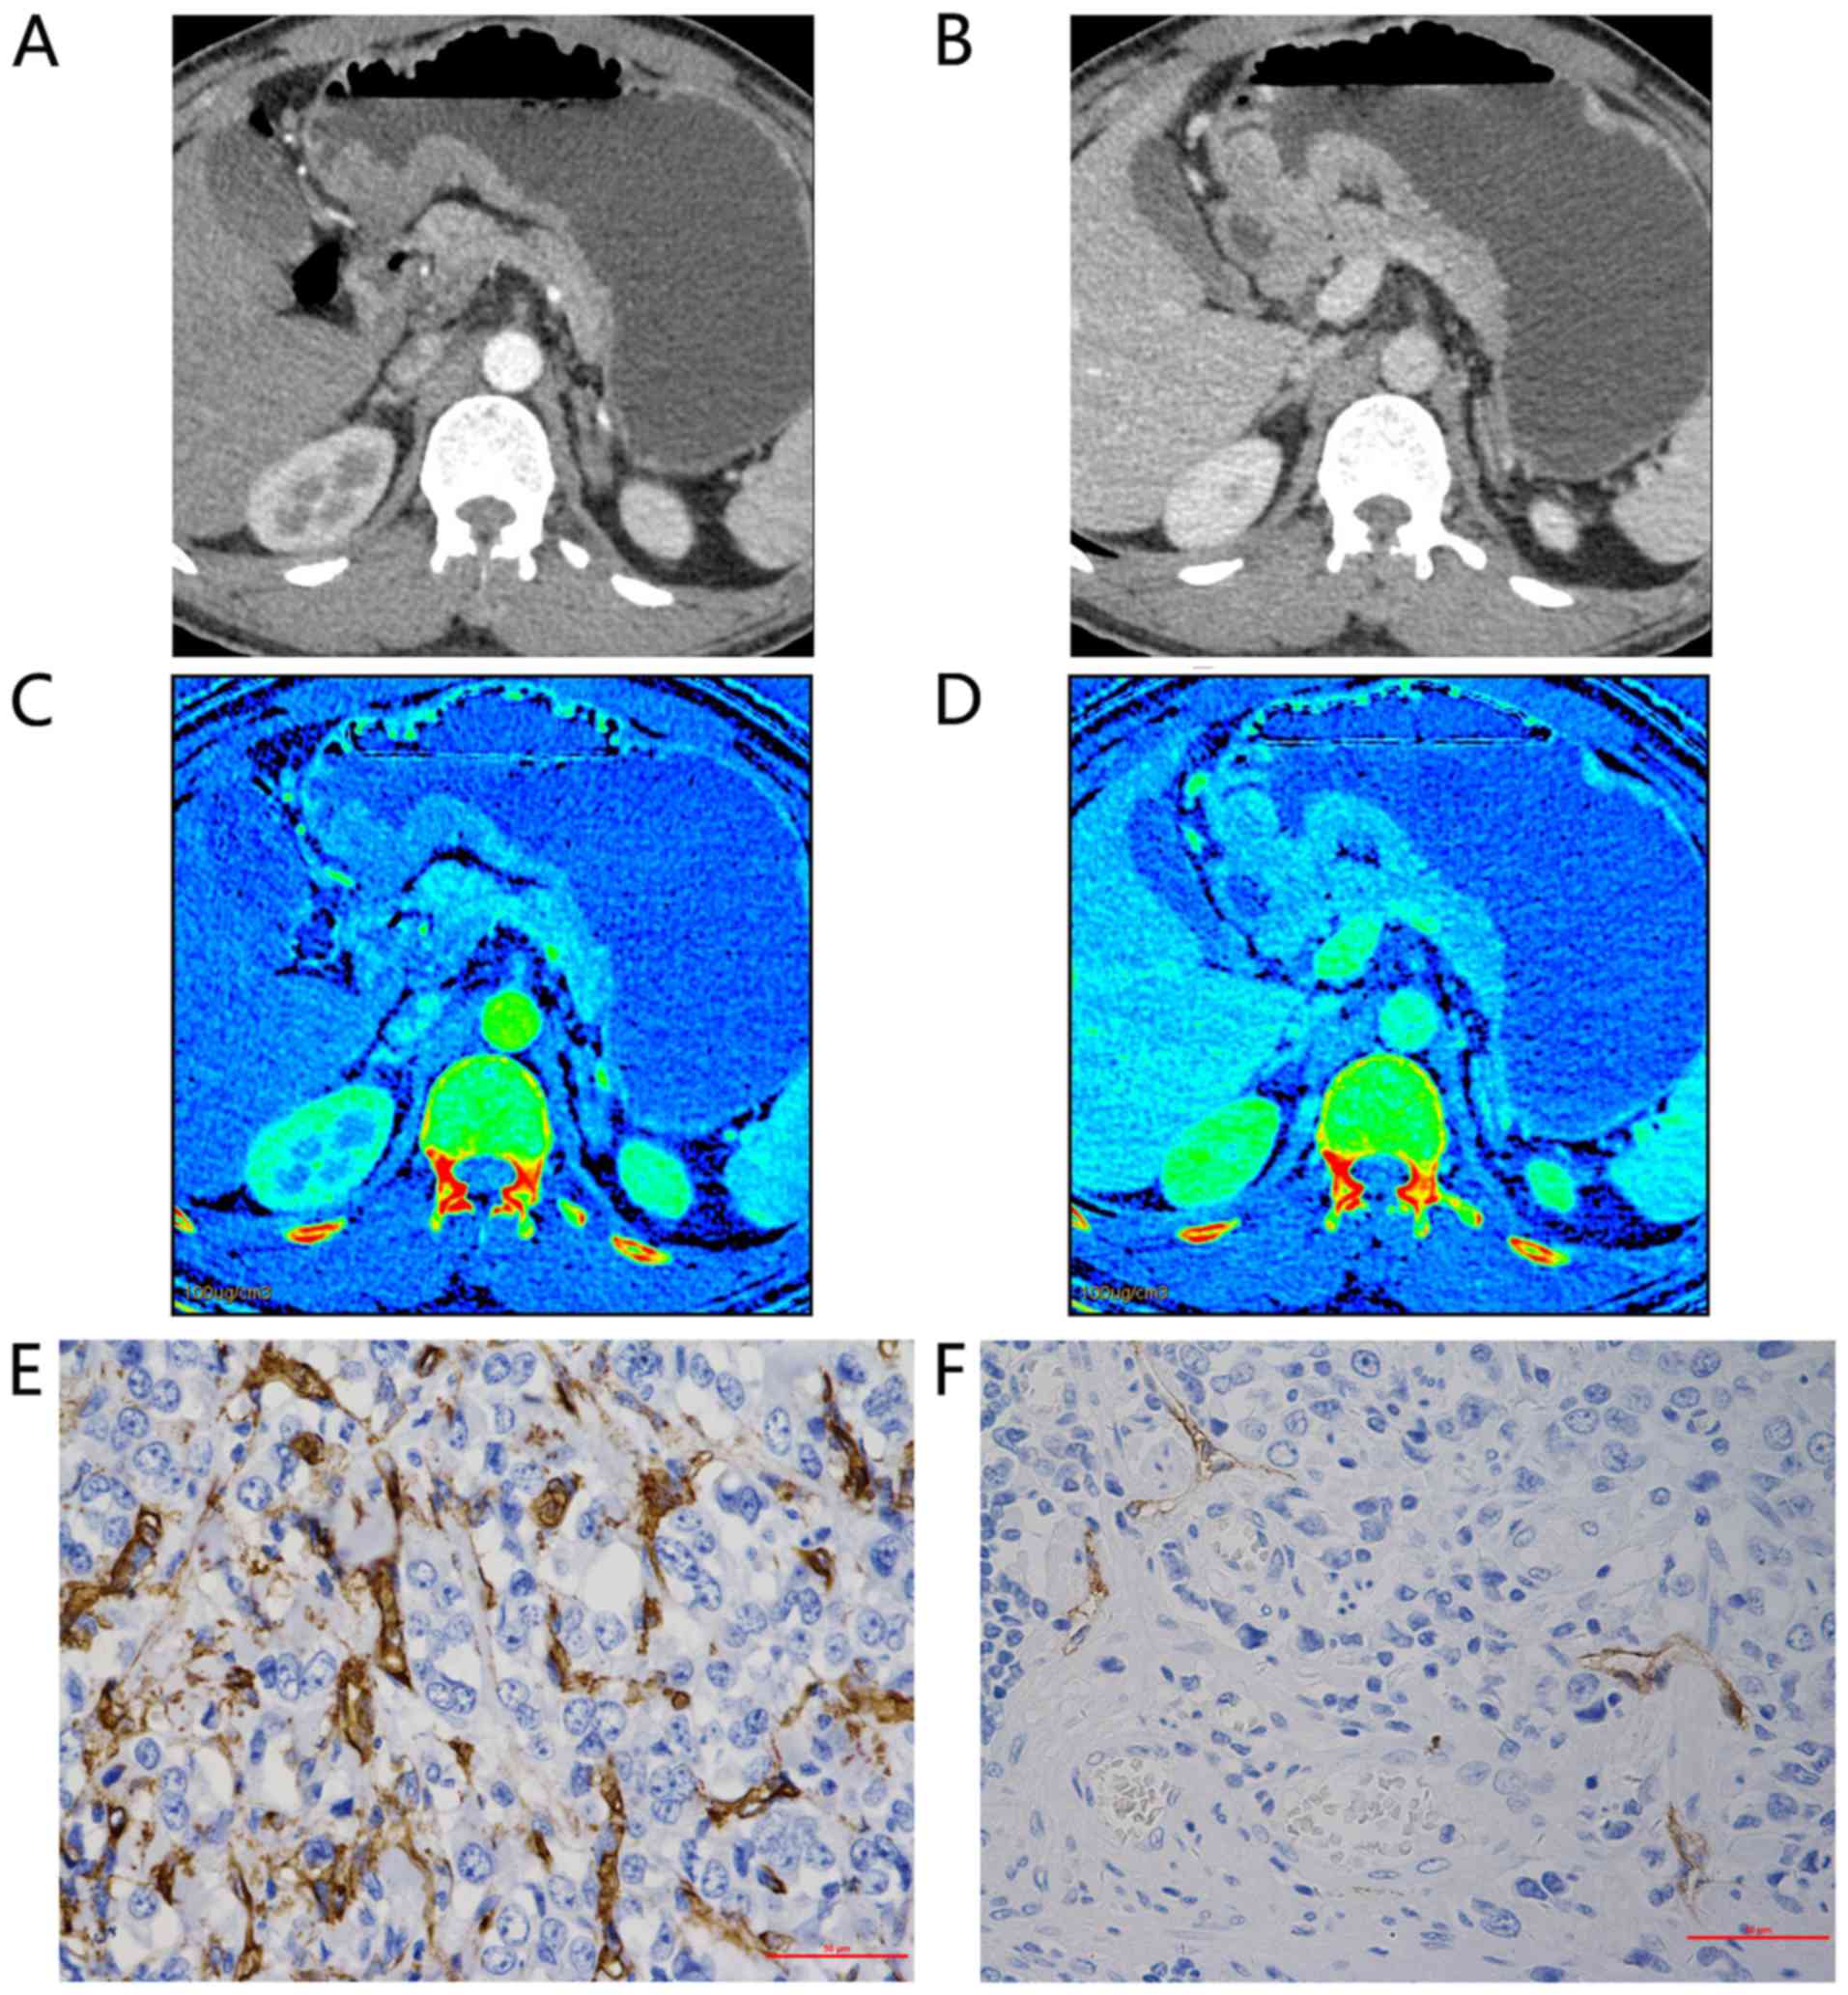 | Figure 2.Representative findings for a
48-year-old man with poorly differentiated adenocarcinoma of the
gastric antrum, tumor-node-metastasis staging IIIa (T4aN1M0). Axial
bi-phase gemstone spectral imaging-computed tomography scan
revealed focal wall thickening with an ulcer in the antral tube
with moderate inhomogeneous enhancement. 70-keV monochromatic
images in: (A) AP and (B) VP. The iodine-based material
decomposition image in: (C) AP, demonstrating an IC value of 10.07
and an nIC value of 0.15; and (D) VP, demonstrating an IC value of
19.85 and an nIC value of 0.51. Immunohistochemical staining
revealed: (E) Brown CD34-positive micro-vessels (micro-vessel
density count, 54; magnification, ×400); and (F) brown
D2-40-positive lymphatic vessels (lymphatic vessel density count,
4; magnification, ×400). All IC values in 100 µg/ml. AP, arterial
phase; VP, portal venous phase; nIC, normalized iodine
concentration. |
| Table II.Comparison of spectral computed
tomography parameters between high- and low-MVD and -LVD
groups. |
Table II.
Comparison of spectral computed
tomography parameters between high- and low-MVD and -LVD
groups.
|
| MVD | LVD |
|---|
|
|
|
|
|---|
| Parameter | High | Low | P-value | High | Low | P-value |
|---|
|
ICAP | 13.71±4.74 | 10.52±3.47 | 0.017 | 11.31±3.85 | 12.84±4.87 | 0.265 |
|
ICVP | 23.60±6.31 | 19.00±3.74 | 0.008 | 20.54±5.71 | 21.89±5.47 | 0.440 |
|
nICAP |
0.13±0.03 |
0.11±0.03 | 0.019 |
0.11±0.03 |
0.13±0.03 | 0.041 |
|
nICVP |
0.43±0.07 |
0.37±0.05 | 0.002 |
0.39±0.06 |
0.40±0.07 | 0.653 |
Histopathological evaluation
Specimens obtained from the 42 patients were fixed
overnight in 10% formalin at room temperature, then
paraffin-embedded. The blocks comprising the central portion of the
tumor were sliced to 4-µm thick and stained with hematoxylin and
eosin (19). All tumor sections were
reviewed and confirmed to be gastric adenocarcinomas. The
clinicopathological findings were determined according to the 7th
edition of the American Joint Committee on Cancer staging system
(17). In order to examine the status
of micro-vessels, mouse-monoclonal anti-CD34 (dilution, 1:150; cat.
no. ZM-0046) for MVD and anti-D2-40 (dilution, 1:100; cat. no.
ZM-0465) for LVD (Beijing Zhongshan Goldenbridge Company, Beijing,
China) were used for immunohistochemical staining (incubated at
room temperature for 1.5 h). The streptavidin-peroxidase protocol
was performed as previously described (4).
MVD and LVD were measured according to the Weidner
method (20). The area of greatest
cell density was identified at a low magnification (×100) in order
to select two ‘hot-spots’. Subsequently, three fields of view for
each case were measured at high magnification (×400) for each slide
(Fig. 1E and F; Fig. 2E and F). Slices were examined using an
optical microscope (CX22; Olympus Corporation, Tokyo, Japan). The
mean of the LVD or MVD was determined by an experienced pathologist
(25 years of experience) who was blinded to the CT and
clinicopathological data. Single endothelial cells or endothelial
cell clusters were measured as one blood capillary or lymphatic
vessel, with branch constructs or discrete breaks also being
counted. However, vessels with muscular walls, or a diameter of
>8 erythrocytes, were excluded from MVD counting.
Statistical analysis
All data were analyzed using SPSS (version 21.0; IBM
Corp., Armonk, NY, USA). Patients were divided into high and low
micro-vessel groups using the mean of MVD (29.67; normal data) and
the median of LVD (4.00; skewed data) as threshold values,
respectively. Similarly, nodal status and depth of invasion were
classified into positive and negative groups depending upon lymph
node metastasis and serosal involvement. Differences between
categorical groups were statistically analyzed using an independent
sample t-test. When analyzing the correlation between the
clinicopathological results, scatter plots were created between
continuous variables, followed by the use of one of either
Pearson's, Kendall's τ or Spearman's rank correlation tests. A
two-tailed P-value of <0.05 was considered to indicate a
statistically significant difference. Receiver operating
characteristic (ROC) analysis was performed to evaluate the most
efficient parameter. The threshold value was determined by the
highest Youden's index: Youden's index=sensitivity +
specificity-1).
Results
Histopathological examination confirmed that of the
42 patients enrolled in the present study, 17 exhibited moderately
differentiated AGC and 25 exhibited poorly differentiated AGC. A
total of 3 patients were revealed to possess distant metastasis; 1
patient tested positive for cancer cells via a peritoneal lavage
cytological examination, and peritoneal dissemination was
identified in 2 patients. A total of 24 patients (57.14%) presented
at pTNM stage Ш or above (Table I).
The mean ± standard deviation of ICAP and
ICVP was 12.04±4.38 and 21.19±5.57, respectively, while
nICAP and nICVP were 0.12±0.03 and 0.40±0.07,
respectively. The mean MVD value was 29.67. LVD ranged between 0
and 28, with a median value of 4.
IC and nIC values in the dual-phase CT images
revealed a significant difference between high- and low-MVD groups
(Table II). However, only the
nICAP value demonstrated a statistically significant
difference between high- and low-LVD groups. No significant
differences in spectral CT parameters between serosal involvement
and presence of lymph node metastasis were identified. However,
nICAP and nICVP were significantly increased
in the poorly differentiated group compared with the moderately
differentiated group (P=0.040 and P=0.011, respectively) (Table III).
| Table III.Comparison of spectral computed
tomography parameters between serosal involvement, lymph node
metastasis and differentiation groups. |
Table III.
Comparison of spectral computed
tomography parameters between serosal involvement, lymph node
metastasis and differentiation groups.
|
| Serosal involvement
(+/−) | Lymph node
metastasis (+/−) | Differentiation
(moderate/poor) |
|---|
|
|
|
|
|
|---|
| Parameter | t | P-value | t | P-value | t | P-value |
|---|
|
ICAP | 1.44 | 0.158 | 1.17 | 0.249 | 1.30 | 0.200 |
|
ICVP | 0.07 | 0.947 | 1.32 | 0.195 | 0.76 | 0.455 |
|
nICAP | 1.37 | 0.180 | 0.66 | 0.515 | 2.12 | 0.040 |
|
nICVP | 1.12 | 0.270 | 0.39 | 0.699 | 2.66 | 0.011 |
A statistically significant positive linear
correlation between IC parameters and MVD was observed using
Pearson's correlation, particularly for nICVP (r=0.635;
P<0.001; Table IV). The IC and
nIC values in arterial and venous phases appeared to exhibit
negative correlations with LVD, however, no statistical
significance was identified. The nICVP demonstrated a
statistically significant positive correlation with tumor
differentiation (r=0.492; P=0.003), whereas the ICAP,
ICVP and nICAP did not (Table IV). No significant correlations
between IC parameters and pTNM tumor staging were identified.
| Table IV.Correlation of IC to MVD and LVD
expression, pTNM grade and differentiation groups. |
Table IV.
Correlation of IC to MVD and LVD
expression, pTNM grade and differentiation groups.
|
| MVDa | LVDb | pTNM
gradec |
Differentiationb |
|---|
|
|
|
|
|
|
|---|
| Parameter | r | P-value | r | P-value | r | P-value | r | P-value |
|---|
|
ICAP | 0.351 | 0.023 | −0.122 | 0.440 | −0.044 | 0.721 | 0.236 | 0.132 |
|
ICVP | 0.394 | 0.010 | −0.133 | 0.400 | 0.097 | 0.426 | 0.096 | 0.545 |
|
nICAP | 0.416 | 0.006 | −0.295 | 0.058 | −0.041 | 0.747 | 0.300 | 0.054 |
|
nICVP | 0.635 | 0.000 | −0.098 | 0.537 | 0.126 | 0.316 | 0.492 | 0.003 |
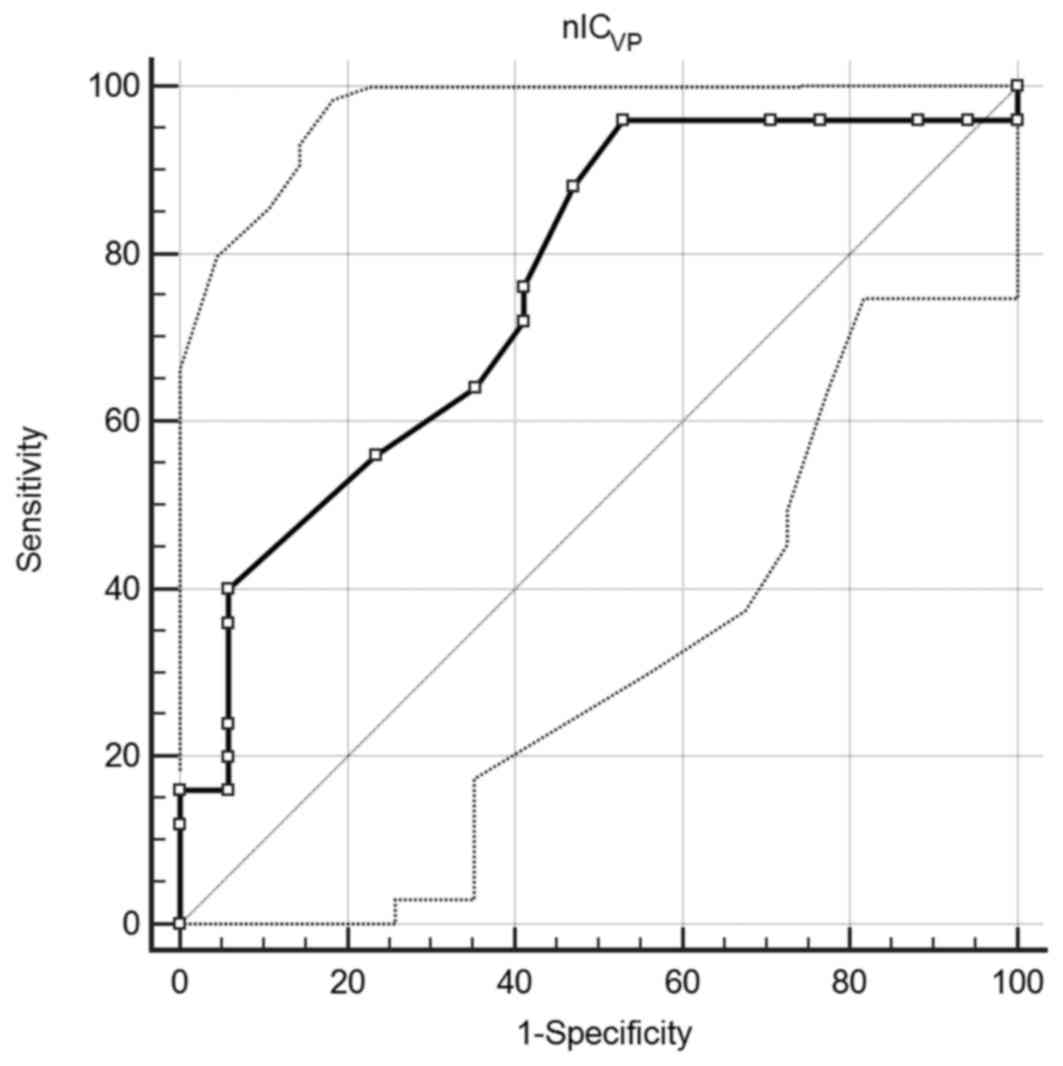
A ROC curve comparing nICVP to AGC
differentiation was created. An area under the curve of 0.759 (95%
confidence interval, 0.602–0.877; P=0.0008) was observed, which
suggested that nICVP is a good classifier. When the
value of 0.345 was employed as the cut-off, the sensitivity and
specificity were 96.0 and 47.1%, respectively (Fig. 3).
Discussion
Iodine is the main component of the contrast agent
in the enhanced CT modality. Tumor enhancement depends only on the
accumulation of contrast medium. The use of the MD technique with
spectral CT revealed that IC may be quantitatively obtained from
the iodine-attenuation images, which potentially reflect organ
perfusion (21). Based on this
theory, assessment of vascularization using pathology MVD and IC
values in solid tumors, including pancreatic carcinoma (22) and hepatocarcinoma (14), has revealed certain negative and
positive correlations. In contrast to solid tumors,
gastrointestinal lesions interfere with peristalsis and dilation,
which leads to inferior consistency in follow-up. Spectral CT
provides an opportunity to functionally evaluate GC beyond
morphology.
In the present study, all the IC parameters were
significantly positively correlated with MVD, a prognostic
determinant with locoregional and hematogenous recurrence (23). These results were consistent with
those of a previous study into pancreatic adenocarcinoma, which
demonstrated that arterial tumor enhancement at MD-CT correlated
with angiogenesis (24). Similarly,
Komori et al (25) revealed
that the tumor-to-normal wall enhancement ratio correlated with
tumor angiogenesis and was a useful prognostic indicator in
patients with AGC under curative resection. Therefore, we
hypothesized that the IC parameters may assist in investigating
tumor angiogenesis.
LVD, representing lymph angiogenesis in tumors,
serves an important role in the progression of GC (26). Presence of lymphatic marker D2-40 can
accurately diagnose lymphatic invasion in primary GC, and thus
improve our understanding of the molecular mechanism of lymph node
metastasis in GC (5). In the present
study, nICAP was revealed to be significantly increased
in the low-LVD group, and negative correlations were identified
between LVD and IC parameters, but without significance, suggesting
that tumors with increased arterial blood supply exhibited
decreased intratumoral LVD. However, reasons for this may be partly
due to the specific intratumoral sample examined in the present
study. It was revealed in the present study that at the center of
the GC tumor, lymphatic vessels were increasingly dispersed and
scarce, with 5 patients negatively expressing D2-40. Yonemura et
al (27) suggested that the high
interstitial pressure in the tumor center led to the destruction of
lymphatic vessels, resulting in the decreased lymphatic vessel
number. Whether arterial blood supply increases the interstitial
pressure or if there is competition between hematogenous and
lymphatic metastasis remains unclear. To the best of our knowledge,
no study has clearly demonstrated the topographic association
between LVD and MVD. Another potential reason for negative
associations between LVD and IC may be that the contrast agent was
not absorbed through the lymphatic system, or that there was
limited connection between micro-lymphatic vessels and micro-blood
vessels. Notably, drawing the ROI exactly at the peritumoral site
on the CT images was difficult in AGC, therefore only intratumoral
LVD was analyzed in the present study.
The results of the present study also suggested that
nICAP and nICVP had the potential to
distinguish between moderately and poorly differentiated AGC,
particularly nICVP. Compared with the IC, the nIC
decreased the personalized difference, such as heart output and
injection rate, and thereby minimized the bias in statistical
processing. In the scanning settings of the present study, the AP
and VP were initiated at between 20–30 and 50–60 sec, respectively,
which was routine for clinical abdominal examination. However, such
time windows may not be suitable for GC. Komori et al
(25) hypothesized that 40 sec was
the appropriate AP scanning time for GC, when the majority of the
injected contrast medium remained in the intravascular space. Based
on this theory, the AP acquisition time selected for the present
study was a little earlier in tracing the contrast media, while the
VP phase fits well.
The results of the present study demonstrate that
the poorer the tumor differentiation, the higher the values of MVD.
Additionally, the degree of angiogenesis in GC was associated with
the histological type and level of differentiation (28). A previous study revealed that the
extent of CT enhancement is associated with angiogenesis and the
histopathological grading of pancreatic tumors (29). Similarly, Zhang et al (6) demonstrated that increased
surface-permeability was associated with poorer differentiation in
GC. Compared with the extent of CT enhancement, nIC and its
perfusion characteristics (30) may
be accurately and conveniently used to reflect the enhancement. As
a result, we hypothesize that the nIC values that reflect tumor
differentiation may be indirectly due to mapping AGC angiogenesis.
In the present study, ROC analysis of nICVP with regard
to level of differentiation of AGC revealed that the threshold
value of 0.345 was highly sensitive. However, the general accuracy
of 76.19% was not high, which may be as a result of the ROI
selection method used. A larger area of ROI selection may decrease
the representativeness (25).
Therefore, methodological research of ROI data, such as texture
based analysis (31), may be
beneficial. Associations between IC parameters and these clinical
features require extended research with lengthy follow-up
times.
Furthermore, no significant differences in IC
between patients with and without serosal involvement, or with and
without lymph node metastasis, were identified in the present
study. Additionally, no correlation between the nIC value and pTNM
grade, which is commonly used to guide clinical strategy, was
identified.
Several limitations of the present study should be
considered. First, as aforementioned, scanning acquisition times
were not intentionally adjusted to meet GC enhancement, and no
delayed phase was performed. This may lead to less precise data,
but is more apt to clinical research and provides patients with the
utmost protection from excessive radiation dose. Secondly, MVD and
LVD were spatially heterogeneous, particularly at the peritumoral
site. Therefore, exact matching of histopathological specimens to
corresponding ROI placement was difficult. Thirdly, survival rate
analysis was not performed to validate these results due to the
prognostic emphasis of the study. This part of the study should be
updated in the following years. Lastly, due to the high
heterogeneity and distinct preoperative stages of GC, explicating
the prognosis with the limited case numbers observed in the present
study is difficult. The association between the IC value and the
clinicopathological features is complex.
In summary, the results of the present study suggest
that IC parameters may quantitatively measure the angiogenesis
status, but not lymph-angiogenesis, in tumor lesions of AGC.
Furthermore, nICs, particularly nICVP, possess biomarker
potential for evaluating the level of tumor differentiation
non-invasively.
Acknowledgements
The authors wish to thank Dr Jun Ma (The Second
Affiliated Hospital of Zhengzhou University) for his revision of
the original manuscript.
Glossary
Abbreviations
Abbreviations:
|
AGC
|
advanced gastric adenocarcinoma
|
|
IC
|
iodine concentration
|
|
nIC
|
normalized iodine concentration
|
|
MVD
|
micro-vessel density
|
|
LVD
|
lymphatic vessel density
|
|
AP
|
arterial phase
|
|
VP
|
venous phase
|
References
|
1
|
Torre LA, Bray F, Siegel RL, Ferlay J,
Lortet-Tieulent J and Jemal A: Global cancer statistics, 2012. CA
Cancer J Clin. 65:87–108. 2015. View Article : Google Scholar : PubMed/NCBI
|
|
2
|
Robb WB and Mariette C: Predicting the
response to chemotherapy in gastric adenocarcinoma: Who benefits
from neoadjuvant chemotherapy? Recent Results Cancer Res.
196:241–268. 2012. View Article : Google Scholar : PubMed/NCBI
|
|
3
|
Saka M, Morita S, Fukagawa T and Katai H:
Present and future status of gastric cancer surgery. Jpn J Clin
Oncol. 41:307–313. 2011. View Article : Google Scholar : PubMed/NCBI
|
|
4
|
Cao F, Hu YW, Li P, Liu Y, Wang K, Ma L,
Li PF, Ni CR and Ding HZ: Lymphangiogenic and angiogenic
microvessel density in chinese patients with gastric carcinoma:
Correlation with clinicopathologic parameters and prognosis. Asian
Pac J Cancer Prev. 14:4549–4552. 2013. View Article : Google Scholar : PubMed/NCBI
|
|
5
|
Gresta LT, Rodrigues-Júnior IA, de Castro
LP, Cassali GD and Cabral MM: Assessment of vascular invasion in
gastric cancer: A comparative study. World J Gastroenterol.
19:3761–3769. 2013. View Article : Google Scholar : PubMed/NCBI
|
|
6
|
Zhang H, Pan Z, Du L, Yan C, Ding B, Song
Q, Ling H and Chen K: Advanced gastric cancer and perfusion imaging
using a multidetector row computed tomography: Correlation with
prognostic determinants. Korean J Radiol. 9:119–127. 2008.
View Article : Google Scholar : PubMed/NCBI
|
|
7
|
Iordache S, Filip MM, Georgescu CV,
Angelescu C, Ciurea T and Săftoiu A: Contrast-enhanced power
Doppler endosonography and pathological assessment of
vascularization in advanced gastric carcinomas-a feasibility study.
Med Ultrason. 14:101–107. 2012.PubMed/NCBI
|
|
8
|
Rezai P, Pisaneschi MJ, Feng C and Yaghmai
V: A radiologist's guide to treatment response criteria in
oncologic imaging: Functional, molecular, and disease-specific
imaging biomarkers. AJR Am J Roentgenol. 201:246–256. 2013.
View Article : Google Scholar : PubMed/NCBI
|
|
9
|
Joo I, Lee JM, Han JK, Yang HK, Lee HJ and
Choi BI: Dynamic contrast-enhanced MRI of gastric cancer:
Correlation of the perfusion parameters with pathological
prognostic factors. J Magn Reson Imaging. 41:1608–1614. 2015.
View Article : Google Scholar : PubMed/NCBI
|
|
10
|
Wu LM, Li YL, Yin YH, Hou GQ, Zhu R, Hua
XL, Xu JR and Chen ZA: Usefulness of dual-energy computed
tomography imaging in the differential diagnosis of sellar
meningiomas and pituitary adenomas: Preliminary report. PLoS One.
9:e906582014. View Article : Google Scholar : PubMed/NCBI
|
|
11
|
Lv P, Lin X, Gao J and Chen K: Spectral
CT: Preliminary studies in the liver cirrhosis. Korean J Radiol.
13:434–442. 2012. View Article : Google Scholar : PubMed/NCBI
|
|
12
|
Lv P, Lin XZ, Li J, Li W and Chen K:
Differentiation of small hepatic hemangioma from small
hepatocellular carcinoma: Recently introduced spectral CT method.
Radiology. 259:720–729. 2011. View Article : Google Scholar : PubMed/NCBI
|
|
13
|
Pan Z, Pang L, Ding B, Yan C, Zhang H, Du
L, Wang B, Song Q, Chen K and Yan F: Gastric cancer staging with
dual energy spectral CT imaging. PLoS One. 8:e536512013. View Article : Google Scholar : PubMed/NCBI
|
|
14
|
Lee JA, Jeong WK, Kim Y, Song SY, Kim J,
Heo JN and Park CK: Dual-energy CT to detect recurrent HCC after
TACE: Initial experience of color-coded iodine CT imaging. Eur J
Radiol. 82:569–576. 2013. View Article : Google Scholar : PubMed/NCBI
|
|
15
|
Tang L, Li ZY, Li ZW, Zhang XP, Li YL, Li
XT, Wang ZL, Ji JF and Sun YS: Evaluating the response of gastric
carcinomas to neoadjuvant chemotherapy using iodine concentration
on spectral CT: A comparison with pathological regression. Clin
Radiol. 70:1198–1204. 2015. View Article : Google Scholar : PubMed/NCBI
|
|
16
|
Dai X, Schlemmer HP, Schmidt B, Höh K, Xu
K, Ganten TM and Ganten MK: Quantitative therapy response
assessment by volumetric iodine-uptake measurement: Initial
experience in patients with advanced hepatocellular carcinoma
treated with sorafenib. Eur J Radiol. 82:327–334. 2013. View Article : Google Scholar : PubMed/NCBI
|
|
17
|
Washington K: 7th edition of the AJCC
cancer staging manual: Stomach. Ann Surg Oncol. 17:3077–3079. 2010.
View Article : Google Scholar : PubMed/NCBI
|
|
18
|
Yamada Y, Jinzaki M, Hosokawa T, Tanami Y,
Abe T and Kuribayashi S: Abdominal CT: An intra-individual
comparison between virtual monochromatic spectral and polychromatic
120-kVp images obtained during the same examination. Eur J Radiol.
83:1715–1722. 2014. View Article : Google Scholar : PubMed/NCBI
|
|
19
|
Fischer AH, Jacobson KA, Rose J and Zeller
R: Hematoxylin and eosin staining of tissue and cell sections. CSH
Protoc. 2008:pdb.prot4986. 2008.
|
|
20
|
Weidner N, Semple JP, Welch WR and Folkman
J: Tumor angiogenesis and metastasis-correlation in invasive breast
carcinoma. N Engl J Med. 324:1–8. 1991. View Article : Google Scholar : PubMed/NCBI
|
|
21
|
Sun YS, Zhang XY, Cui Y, Tang L, Li XT,
Chen Y and Zhang XP: Spectral CT imaging as a new quantitative
tool? Assessment of perfusion defects of pulmonary parenchyma in
patients with lung cancer. Chin J Cancer Res. 25:722–728.
2013.PubMed/NCBI
|
|
22
|
Hu S, Huang W, Chen Y, Song Q, Lin X, Wang
Z and Chen K: Spectral CT evaluation of interstitial brachytherapy
in pancreatic carcinoma xenografts: Preliminary animal experience.
Eur Radiol. 24:2167–2173. 2014. View Article : Google Scholar : PubMed/NCBI
|
|
23
|
Koyama Y, Okayama H, Kumamoto K, Saito K,
Nakamura I, Ohki S and Takenoshita S: Overexpression of endoglin
(CD105) is associated with recurrence in radically resected gastric
cancer. Exp Ther Med. 1:627–633. 2010. View Article : Google Scholar : PubMed/NCBI
|
|
24
|
Hattori Y, Gabata T, Matsui O, Mochizuki
K, Kitagawa H, Kayahara M, Ohta T and Nakanuma Y: Enhancement
patterns of pancreatic adenocarcinoma on conventional dynamic
multi-detector row CT: Correlation with angiogenesis and fibrosis.
World J Gastroenterol. 15:3114–3121. 2009. View Article : Google Scholar : PubMed/NCBI
|
|
25
|
Komori M, Asayama Y, Fujita N, Hiraka K,
Tsurumaru D, Kakeji Y and Honda H: Extent of arterial tumor
enhancement measured with preoperative MDCT gastrography is a
prognostic factor in advanced gastric cancer after curative
resection. AJR Am J Roentgenol. 201:W253–W261. 2013. View Article : Google Scholar : PubMed/NCBI
|
|
26
|
Coskun U, Akyurek N, Dursun A and Yamaç D:
Peritumoral lymphatic microvessel density associated with tumor
progression and poor prognosis in gastric carcinoma. J Surg Res.
164:110–115. 2010. View Article : Google Scholar : PubMed/NCBI
|
|
27
|
Yonemura Y, Endou Y, Tabachi K, Kawamura
T, Yun HY, Kameya T, Hayashi I, Bandou E, Sasaki T and Miura M:
Evaluation of lymphatic invasion in primary gastric cancer by a new
monoclonal antibody, D2-40. Hum Pathol. 37:1193–1199. 2006.
View Article : Google Scholar : PubMed/NCBI
|
|
28
|
Grigore D, Simionescu CE, Mărgăritescu C,
Bălăşoiu M, Balasoiu M, Georgescu CC, Cernea D and Dumitrescu D:
Assessment of CD105, α-SMA and VEGF expression in gastric
carcinomas. Rom J Morphol Embryol. 54 3 Suppl:S701–S707. 2013.
|
|
29
|
Wang SH, Sun YF and Liu Y, Zhou Y and Liu
Y: CT contrast enhancement correlates with pathological grade and
microvessel density of pancreatic cancer tissues. Int J Clin Exp
Pathol. 8:5443–5449. 2015.PubMed/NCBI
|
|
30
|
Pang LF, Zhang H, Lu W, Yang WJ, Xiao H,
Xu WQ, Chen Y, Liu Y, Bu YL, Pan ZL, et al: Spectral CT imaging of
myocardial infarction: Preliminary animal experience. Eur Radiol.
23:133–138. 2013. View Article : Google Scholar : PubMed/NCBI
|
|
31
|
Ba-Ssalamah A, Muin D, Schernthaner R,
Kulinna-Cosentini C, Bastati N, Stift J, Gore R and Mayerhoefer ME:
Texture-based classification of different gastric tumors at
contrast-enhanced CT. Eur J Radiol. 82:e537–e543. 2013. View Article : Google Scholar : PubMed/NCBI
|