Introduction
Oral squamous cell carcinoma (OSCC) is the most
common type of head and neck squamous cell carcinoma (HNSCC), and
is among the 10 most prevalent cancer types worldwide (1,2). In spite
of improvements in the diagnosis and prognosis of OSCC, long-term
survival rates have not improved in the past decade (3). To develop effective therapies, an
improved understanding of the biological features and underlying
molecular mechanisms of OSCC are required.
In previous studies, it has been suggested that the
cancer stem cell (CSC) hypothesis may be applied to a number of
types of cancer (4,5). According to the hypothesis, a tumor may
be viewed as an aberrant organ initiated by a subpopulation of
cells, termed CSCs, which exhibit self-renewing capacities and are
responsible for tumor maintenance and metastasis (6). The hypothesis provides a novel insight
into the understanding of tumorigenesis and since then, the
isolation and identification of CSCs have been studied in depth.
Previous studies have supported the validity of this hypothesis in
a number of malignant diseases, including breast cancer, brain
tumor, colon cancer, melanomas and prostate cancer (7–11). In
addition, the existence of CSCs has been identified in HNSCC and
has been associated with the expression of aldehyde dehydrogenase
(ALDH) (12). Cells with increased
ADLH ‘bright’ activity (ALDHbr) exhibit CSC-associated
properties, including radio-resistance and the ability to produce
tumors with a limited number of cells, which is in contrast to
cells with decreased ALDH activity (ALDHlow) (13,14).
However, the gene expression profile of the two cell subpopulations
remains unknown, which is required to understand the underlying
molecular mechanisms of CSCs in HNSCC.
In the present study, ALDHbr and
ALDHlow cells were isolated from the OSCC TCA8113 cell
line and suppression subtractive hybridization (SSH) was
subsequently performed to identify differentially expressed genes
in the two subpopulations. Known and unknown differentially
expressed genes were identified in subtracted clones, and the known
genes were functionally characterized using bioinformatical tools.
The results of the present study suggested that the identified
genes may be biomarkers for the identification of CSCs in OSCC.
Materials and methods
Cells and cell culture
The tongue squamous cell carcinoma TCA8113 cell line
was obtained from the West China College of Stomatology of Sichuan
University (Sichuan, China). Cells were maintained in RPMI 1640
medium (Invitrogen; Thermo Fisher Scientific, Inc., Waltham, MA,
USA), supplemented with 10% fetal bovine serum (Invitrogen; Thermo
Fisher Scientific, Inc.), 1% glutamine and 1%
penicillin-streptomycin at 37°C in a humidified atmosphere
containing 5% CO2.
ALDH assay and cell sorting
An Aldefluor kit (Stemcell Technologies, Inc.,
Vancouver, BC, Canada) was used to determine ALDH activity in
TCA8113 cells, according to the manufacturer's protocol. Cells were
suspended in Aldefluor assay buffer, which contained an activated
Aldefluor substrate (BAAA, 1 µmol/1×106 cells), as
recommended by the manufacturer. As a negative control for all
samples, an aliquot of ‘Aldefluor-exposed’ cells (1×10⁸
cells) was transfused into the control tube, which contained 5 µl
diethylaminobenzaldehyde (DEAB), a specific ALDH inhibitor.
Following incubation at 37°C for 40 min, the cells were centrifuged
at 250 × g for 5 min and the supernatant was removed. Subsequently,
the cell pellets were resuspended in 0.5 ml ice-cold Aldefluor
Assay Buffer, and flow cytometric analysis was performed using
FACSAria (BD Biosciences, Franklin Lakes, NJ, USA). Aldefluor
staining was determined using a green fluorescence channel. Samples
treated with DEAB were used as controls and set the threshold that
defined the ALDHbr region.
Tumorsphere formation
Since CSCs typically form tumorspheres and non-CSCs
die in serum-free medium (15,16),
tumorsphere formation in ALDHbr and ALDHlow
cells was investigated in the present study. Cells were plated at a
low density (1,000 cells/ml) in RPMI1 640 serum-free medium,
supplemented with human recombinant epidermal growth factor (20
ng/ml; PeproTech, Inc., Rocky Hill, NJ, USA), basic fibroblast
growth factor (20 ng/ml; PeproTech, Inc.) and B27 serum-free
supplements (20 µl/ml; Invitrogen; Thermo Fisher Scientific, Inc.).
The formation of tumorspheres was observed daily using an inverted
phase contrast microscope (magnification, ×100).
Preparation of total RNA
Total RNA was isolated from ALDHbr and
ALDHlow cells using TRIzol reagent (Invitrogen; Thermo
Fisher Scientific, Inc.), according to the manufacturer's protocol.
Total RNA was quantified using a Unico UV-2000 spectrophotometer
(Unico Technologies Co., Ltd., Jiangsu, China). The
A260/A280 ratio was between 1.8 and 2.0.
Total RNA (~1 µg) was separated on denaturing agarose (1.2% gel) to
confirm integrity.
cDNA synthesis
cDNA was synthesized using the SMART™ cDNA Synthesis
kit (Clontech Laboratories, Inc., Mountain View, CA, USA) according
to the manufacturer's protocol. Total RNA (1 µg) was reverse
transcribed (42°C, 1.5 h) in a 10-µl reaction mixture containing
PowerScript™ reverse-transcriptase. Sterile H2O (24.2
µl), 5X Second-Strand Buffer (8.0 µl), dNTP mix (10 mM; 0.8 µl) and
20X Second-Strand Enzyme Cocktail (2.0 µl) were added to the 10 µl
first-strand synthesis reaction tubes and incubated at 16°C for 2 h
in water. T4 DNA polymerase (Clontech Laboratories, Inc.) 2 µl was
then added followed by incubation at 16°C for 30 min in a water
bath. Subsequently, 4 µl of 20X EDTA/glycogen mix was added to
terminate second-strand synthesis, followed by addition of 100 µl
of phenol:chloroform:isoamyl alcohol (25:24:1). Centrifugation was
then performed at 2,191.28 × g for 10 min at room temperature. The
top aqueous layer was collected and placed in a fresh 0.5-ml
microcentrifuge tube. The inter and lower phases were discarded and
disposed appropriately. Next, 100 µl of chloroform:isoamyl alcohol
(24:1) was added, followed by addition of 40 µl of 4 M
NH4OAc and 300 µl of 95% ethanol. Subsequently,
centrifugation was performed at 2,191.28 × g for 20 min at room
temperature, and the supernatant was collected. The pellet was
overlayed with 500 µl of 80% ethanol, and then centrifuged at
2,191.28 × g for 10 min at room temperature. The supernatant was
removed and the pellet was air-dried for ~10 min to evaporate
residual ethanol. Precipitate was dissolved in 50 µl of sterile
H2O, and 6 µl was transferred to a fresh microcentrifuge
tube. This sample was stored at −20°C until after RsaI
digestion (for agarose gel electrophoresis) to estimate yield and
size range of ds cDNA products synthesized.
SSH
Synthesized two-target cDNA was used for SSH,
performed with the PCR-select™ cDNA Subtraction kit (Clontech
Laboratories, Inc.), according to the manufacturer's protocol. cDNA
from ALDHbr and ALDHlow cells was used as the
‘tester’ and ‘driver’, respectively, in the forward subtraction and
vice versa for the reverse subtraction. For each subtraction, the
‘tester’ was ligated to adaptor 1 and adaptor 2R in separate
ligation reactions, whereas the ‘driver’ was not ligated to
adaptors. Following ligation, two samples were subjected to
hybridization. For the first hybridization, an excess of ‘driver’
cDNA was added to each adaptor-ligated ‘tester’ cDNA in the
hybridization buffer, heat-denatured (98°C, 1.5 min) and
subsequently annealed (68°C, 8 h). The two samples from the first
hybridization were mixed and fresh denatured ‘driver’ cDNA was
added and annealed at 68°C overnight. Following the second
hybridization, the sample was diluted in 200 µl dilution buffer and
incubated at 68°C for 7 min in a thermal cycler. Subsequently, PCR
was performed using the subtracted cDNAs to amplify the desired
differentially expressed sequences. The first-round PCR was
performed using PCR primer 1 (5′-CTAATACGACTCACTATAGGGC-3′) and the
cycling parameters were 72°C for 10 min and 95°C for 2 min,
followed by 25 cycles of 94°C for 30 sec, 62°C for 45 sec, 72°C for
1 min and 72°C for 6 min. The second-round PCR reaction was
performed using nested primer 1 (5′-TCGAGCGGCCGCCCGGGCAGGT-3′) and
nested primer 2R (5′-AGCGTGGTCGCGGCCGAGGT-3′), and the cycling
parameters were 95°C for 2 min, followed by 29 cycles of 94°C for
30 sec, 65°C for 45 sec, 72°C for 1 min and 72°C for 6 min.
Cloning of SSH-PCR products
The purified secondary SSH-PCR products were cloned
into PMD-18T vector (Takara Bio, Inc., Otsu, Japan) and the ligated
products were transformed into E. coli DH5α competent cells.
Transformed colonies were selected on Luria-Bertani (LB) agar
medium (MP Biomedicals, Santa Ana, CA, USA) containing ampicillin
(100 mg/l) at 37°C and ~1,000 positive colonies were obtained,
which represented subtraction libraries enriched with
differentially expressed genes. A total of 240 positive colonies
were selected randomly. A single clone was inoculated in 2 ml
LB-ampicillin (100 mg/l) and incubated overnight at 37°C with
gentle agitation at 44.72 × g.
PCR amplification of cDNA inserts
To assess the size of inserts, colony PCR was
performed in a 50-µl reaction system containing 12.5 µl 10X buffer
(Takara Bio, Inc.), 1 µl 10 mM dNTP (Shanghai CPG Biotechnology
Co., Ltd., Shanghai, China), 5 µl MgCl2 (Takara Bio,
Inc.), 1 µl 50 pM/µl Nested primer 1 (Clontech Laboratories, Inc.),
1 µl 50 pM/µl 2R primer (Clontech Laboratories, Inc.), and 2.5 U
Taq DNA polymerase (Takara Bio, Inc.). The PCR parameters were:
95°C for 2 min, followed by 35 cycles of 95°C for 30 sec, 62°C for
45 sec and 72°C for 1 min. Colony PCR products (2 µl) were
separated using agarose (1.2% gel) to identify the presence and the
size of the inserts prior to sequencing. The controls for this
protocol included the unsubtracted tester control for the forward
subtraction, the unsubtracted tester control for the reverse
subtraction and the unsubtracted tester control for the control
skeletal muscle tester cDNA [made from the Control Poly
A+ RNA (from human skeletal muscle) provided with the
kit (the SMART™ cDNA Synthesis kit (Clontech Laboratories, Inc.)].
It serves as control driver cDNA subtraction. All protocols were
repeated 3 times.
Expressed sequenced tag (EST)
sequencing and bioinformatical analysis
The selected positive clones were sequenced at the
Beijing Genomics Institute (Beijing, China) and the sequences were
edited to remove the adaptor-primer and vector DNA sequences. ESTs
were compared with non-redundant public databases using the Basic
Local Alignment Search Tool (BLAST) (blast.ncbi.nlm.nih.gov/Blast.cgi) nucleotide to
retrieve data from GenBank (www.ncbi.nlm.nih.gov/nucleotide) and BLASTX
(blast.ncbi.nlm.nih.gov/Blast.cgi?PROGRAM=blastx&PAGE_TYPE=BlastSearch&LINK_LOC=blasthome)
algorithms of the National Center for Biotechnology Information
(NCBI; blast.ncbi.nlm.nih.gov/Blast.cgi). ESTs with E<0.01
were deemed to exhibit significant homology. Homologies >50
nucleotides that exhibited >90% identity to sequences in the
database were considered to have significant homologies, as
previously described (17). The
physiological functions of these ESTs were classified according to
Gene Ontology (www.geneontology.org). Pathway analysis was performed
using the Gene Set Analysis Toolkit V2 online system (www.webgestalt.org/option.php).
Results
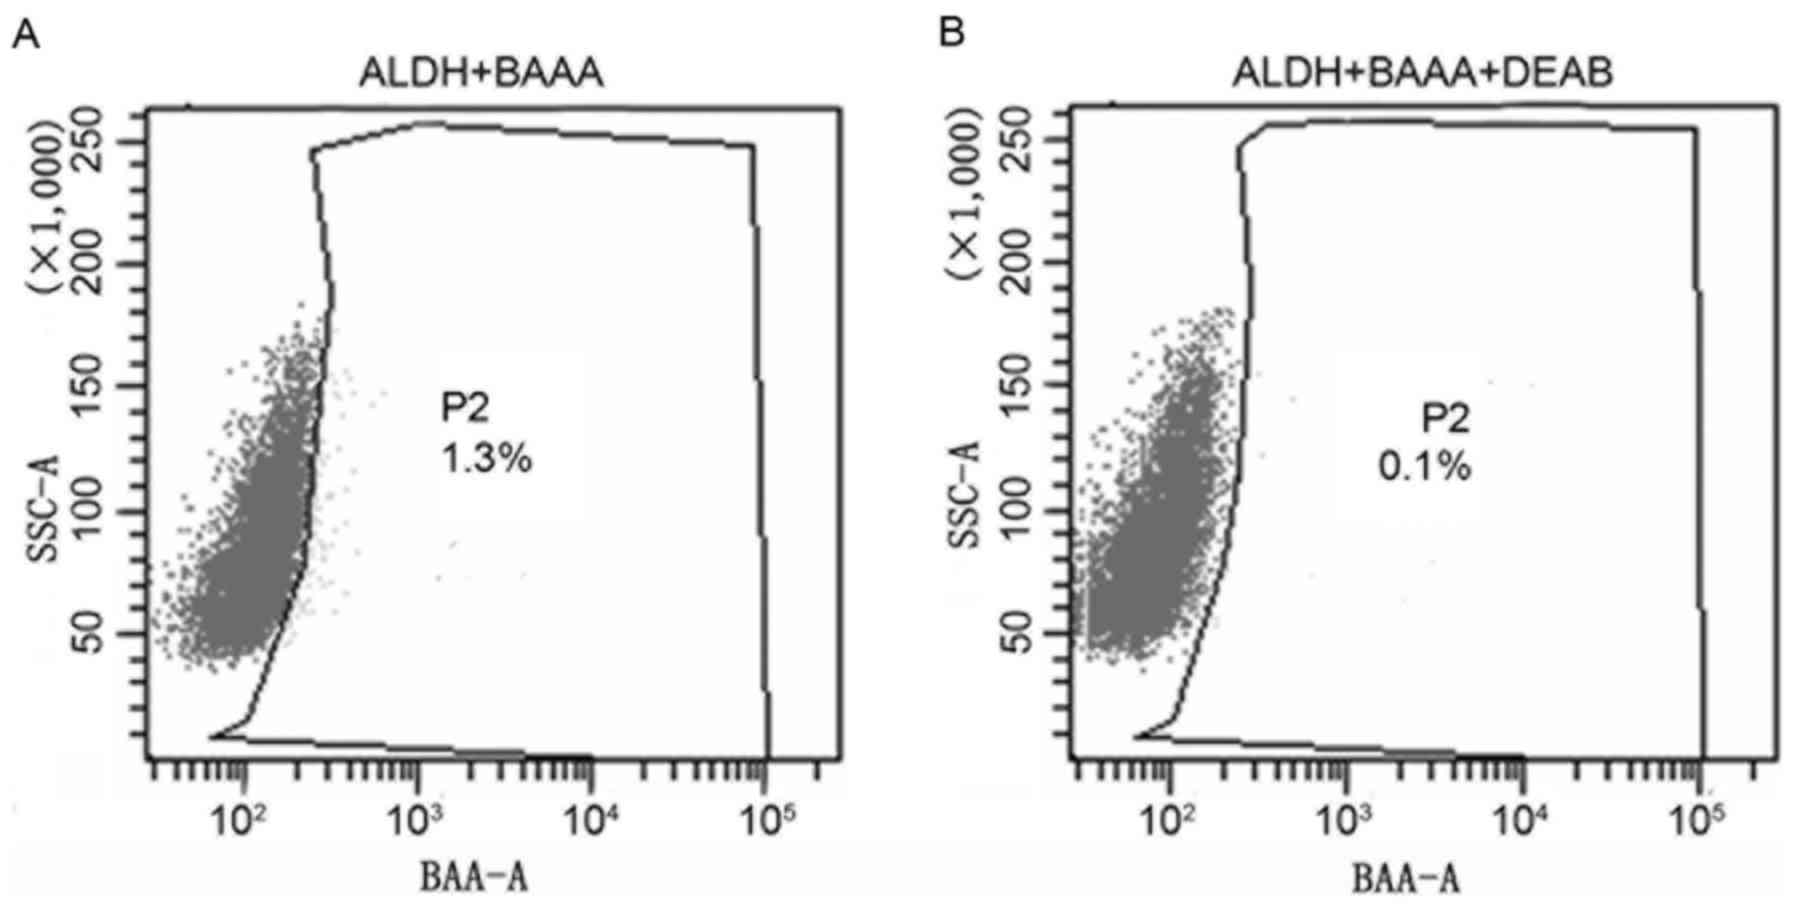
Isolation of ALDHbr cells
in tongue squamous cell carcinoma TCA8113 cells
Using the ALDEFLUOR assay and fluorescence-activated
cell sorting analysis, the ALDH enzymatic activity in the tongue
squamous cell carcinoma TCA8113 cell line was identified to be
heterogeneous. As presented in Fig.
1, only a limited proportion (1.3%) of the cells displayed
increased ALDH activity (ALDHbr; Fig. 1A), whereas the remaining cells
expressed decreased levels of ALDH activity (ALDHlow).
DEAB, the specific inhibitor of ALDH, resulted in a decreased
proportion of sorted ALDHbr cells (0.1%; Fig. 1B), suggesting the effective isolation
of ALDHbr cells. The results of the present study
revealed that cancer stem cells with ALDHbr were
successfully isolated. Subpopulation cells were selected for
additional analysis.
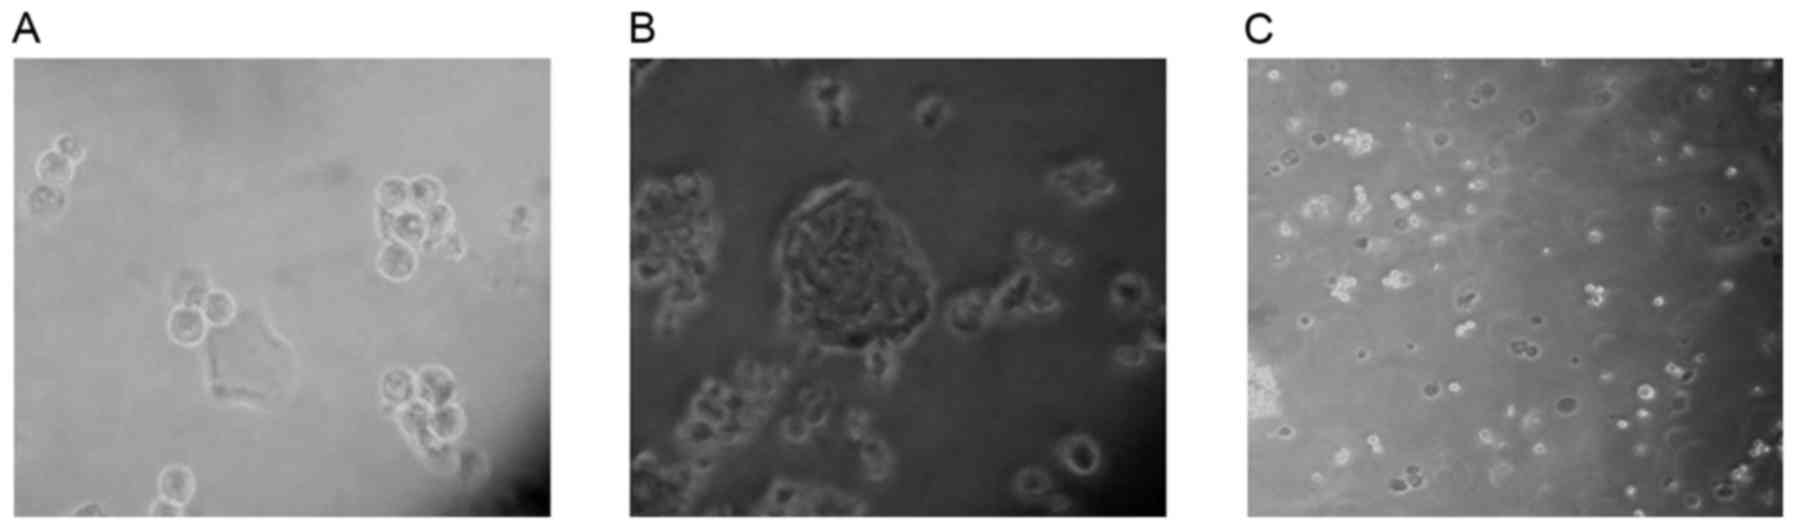
ALDHbr cells form
spheres
CSCs may be effectively enriched in serum-free
medium (18–20). The majority of cells die in serum-free
medium due to a lack of nutritive materials; however, CSCs may
survive, proliferate and form three-dimensional spheres. In the
present study, ALDHbr cells maintained in serum-free
medium proliferated and formed spheres within 5 days, whereas
ALDHlow cells, maintained in the same medium, did not
form spheres and were apoptotic (Fig.
2). The results of the present study indicated that the
isolated ALDHbr cells exhibited typical CSC
features.
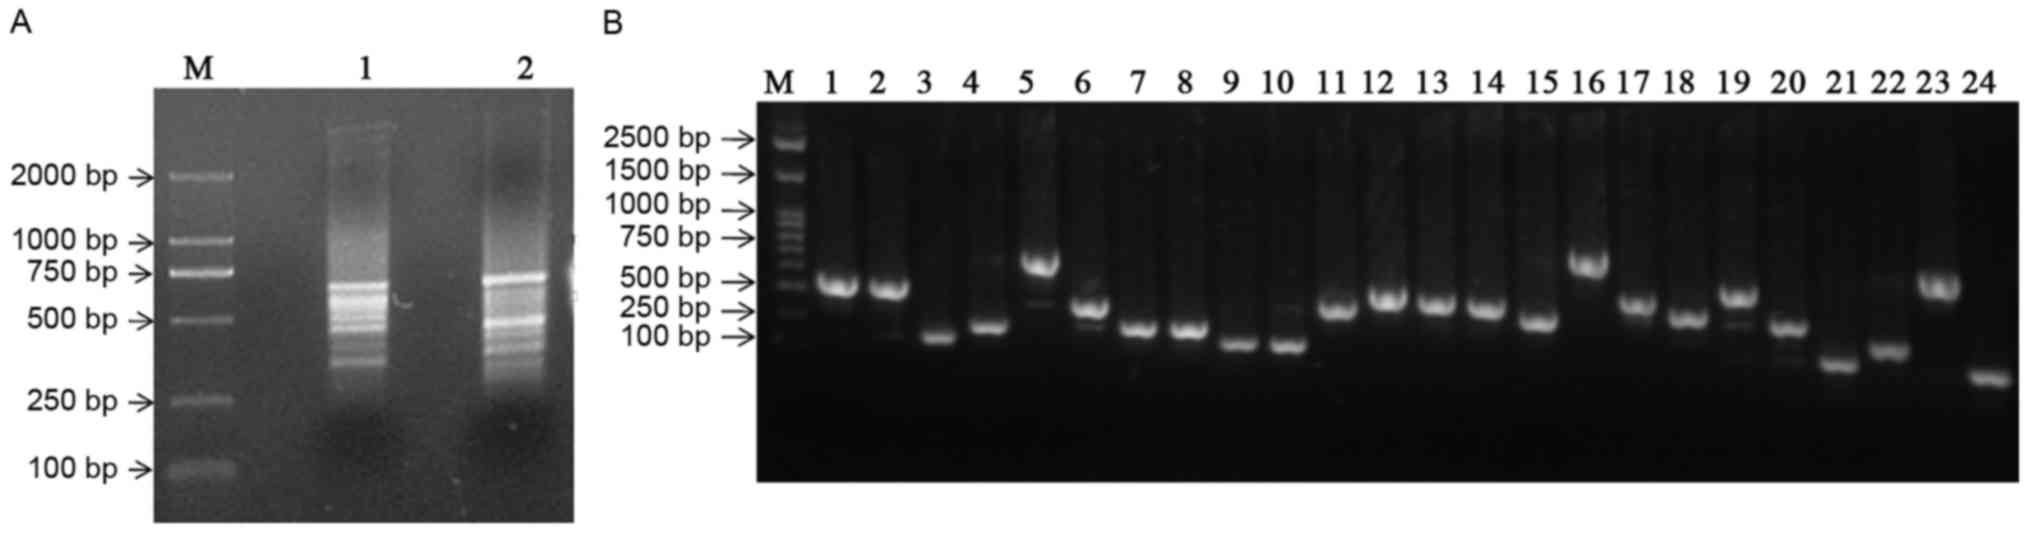
Constructing the SSH library
Using cDNA from ALDHbr cells as ‘testers’
and that of ALDHlow cells as ‘drivers’ and vice versa,
PCR-selected cDNA subtraction for forward and reverse libraries,
respectively, was performed. Following subtraction, a pool of
putative differentially expressed cDNA fragments was obtained. The
cDNA fragments ranged between 200 bp and 1 kb, with the majority
distributed between 400 and 600 bp (Fig.
3A). Subtracted amplicons were ligated into the PMD-18T plasmid
vector and transformed into E. coli DH5α competent cells. In
total, 240 white colonies were randomly selected and 48 of these
clones were subjected to colony PCR, using nested primers. All the
recombinants determined revealed amplicons ranging between 200 and
800 bp (Fig. 3B).
Identification of differentially
expressed ESTs
All 240 clones were selected and sequenced.
Sequences were not obtained for 14 clones and those were omitted
from the present study. Comparison of the unique sequences obtained
from each library against the GenBank databases identified 104
unique clones, 62 of which corresponded to known genes and 42 of
which were unknown genes, while the remaining 122 clones were
redundant. Of the known genes, 28 and 34 genes were upregulated and
downregulated in ALDHbr cells, respectively (Tables I and II). The unknown clones were divided into
two groups in the NCBI databases, 28 represented human genomic
sequences and 14 were present in the human EST database.
 | Table I.Characteristics of overexpressed
known genes in aldehyde dehydrogenase-positive subpopulation
cells. |
Table I.
Characteristics of overexpressed
known genes in aldehyde dehydrogenase-positive subpopulation
cells.
| No. | Length, bp | Gene | Accession no. | Identities (%) | E-value | Gene ID | Gene symbol | Chromosomal
location |
|---|
| 1 | 206 | Drosophila
melanogaster CG4699 (CG4699), transcript variant J |
ref|NM_001170153.1| | 163/166 (99) |
2.00×10−76 | 41911 CG4699 | CG4699 (WAH) | Unknown |
| 2 | 402 | Homo sapiens
solute carrier family 25, member 13 (citrin) (SLC25A13), RefSeqGene
on chromosome 7 |
ref|NG_012247.1| | 388/389 (99) | 0 | 10165 | SLC25A13 | 7q21.3 |
| 3 | 303 | Homo sapiens
kelch-like 2, Mayven (Drosophila) (KLHL2), transcript
variant 3, mRNA |
ref|NM_001161522.1| | 284/285 (99) |
8.00×10−145 | 11275 KLHL2 | KLHL2 | 4q21.2 |
| 4 | 225 | Homo sapiens
Niemann-Pick disease, type C1 (NPC1), RefSeqGene on chromosome
18 |
ref|NG_012795.1| | 174/175 (99) |
3.00×10−83 | 4864 | NPC1 |
18q11-q12 |
| 5 | 369 | Homo sapiens
EP300 interacting inhibitor of differentiation 1 (EID1), mRNA |
ref|NM_014335.2| | 353/354 (99) | 0 | 23741 EID1 | EID1 | 15q21.1-q21.2 |
| 6 | 289 | Homo sapiens
notch 2 (NOTCH2), RefSeqGene on chromosome 1 |
ref|NG_008163.1| | 512/514 (99) | 0 | 4853 | NOTCH2 | 1p13-p11 |
| 7 | 234 | Homo sapiens
BRCA1 associated RING domain 1 (BARD1), RefSeqGene |
ref|NG_012047.1| | 215/216 (99) |
1.00×10−106 | 157266327 | BARD1 | 2q34-q35 |
| 8 | 272 | Homo sapiens
inositol 1,4,5-triphosphatereceptor, type 1 (ITPR1), RefSeqGene on
chromosome 3 |
ref|NG_016144.1| | 253/254 (99) |
1.00Ex10−127 | 269954693 | ITPR1 | 3p26-p25 |
| 9 | 289 | Homo sapiens
FRG1 (FRG1) gene, complete cds; |
gb|AF146191.1|AF146191 | 264/272 (98) |
2.00×10−125 | AAD46768.1 | FRG1 | 4q35 |
| 10 | 280 | Homo sapiens
methylcrotonoyl-CoA carboxylase 2 (beta) (MCCC2), RefSeqGene on
chromosome 5 |
ref|NG_008882.1| | 263/263 (100) |
3.00×10−134 | 64087 | MCCC2 | 5q12-q13 |
| 11 | 410 | Homo sapiens
ribosomal protein, large, P0 (RPLP0), transcript variant 1,
mRNA |
ref|NM_001002.3| | 388/390 (99) | 0 | 6175 RPLP0 | RPLP0 | 12q24.2 |
| 12 | 468 | Homo sapiens
dedicator of cytokinesis 8 (DOCK8), transcript variant 3, mRNA |
ref|NM_001193536.1| | 449/450 (99) | 0 | 81704 DOCK8 | DOCK8 | 9p24.3 |
| 13 | 365 | Homo sapiens
GLIS family zinc finger 3 (GLIS3), RefSeqGene on chromosome 9 |
ref|NG_011782.1| | 342/347 (99) |
1.00×10−172 | 169792 | GLIS3 | 9p24.2 |
| 14 | 412 | Homo sapiens
PARK2 co-regulated (PACRG) on chromosome 6 |
ref|NG_011525.1| | 352/392 (90) |
5.00×10−138 | 135138 | PACRG | 6q26 |
| 15 | 153 | Homo sapiens
collagen, type VII, alpha 1(COL7A1), mRNA |
ref|NM_000094.3| | 134/135 (99) |
7.00×10−63 | 1294 COL7A1 | COL7A1 | 3p21.1 |
| 16 | 226 | Homo sapiens
epidermal growth factor receptor(EGFR), RefSeqGene on chromosome
7 |
ref|NG_007726.1| | 207/208 (99) |
3.00×10−102 | 1956 | EGFR | 7p12 |
| 17 | 450 | Homo sapiens
neuron navigator 2 (NAV2), transcript variant 4, mRNA |
ref|NM_001111019.1| | 391/399 (98) | 0 | 89797 NAV2 | NAV2 | 11p15.1 |
| 18 | 288 | Homo sapiens
retinoblastoma 1 (RB1), mRNA |
ref|NM_000321.2| | 269/270 (99) |
1.00×10−137 | 5925 RB1 | RB1 | 13q14.2 |
| 19 | 274 | Homo sapiens
tetratricopeptide repeat protein 12 (TTC12) gene, complete cds,
alternatively spliced | gb|EF445041.1| | 214/257 (84) |
4.00×10−58 | ACA06092.1 | TTC12 | 11q23.1 |
| 20 | 232 | Homo sapiens
nuclear receptor corepressor 1 (NCOR1), transcript variant 3,
mRNA |
ref|NM_001190440.1| | 213/214 (99) |
1.00×10−106 | 9611
NCOR1 | NCOR1 | 17p11.2 |
| 21 | 283 | Homo sapiens
SMAD family member 1 (SMAD1), transcript variant 2, mRNA |
ref|NM_001003688.1| | 262/263 (99) |
1.00×10−133 | 4086 SMAD1 | SMAD1 | 7p15 |
| 22 | 646 | Homo sapiens
kelch-like 13 (Drosophila) (KLHL13), RefSeqGene on
chromosome X |
ref|NG_016759.1| | 628/630 (99) | 0 | 90293 | KLHL13 | Xq23-q24 |
| 23 | 418 | Homo sapiens
PRP39 pre-mRNA processing factor 39 homolog (S. cerevisiae)
(PRPF39), mRNA |
ref|NM_017922.3| | 395/399 (99) | 0 | 55015 PRPF39 | PRPF39 | 14q21.3 |
| 24 | 398 | Homo sapiens
septin 9 (SEPT9), transcript variant 4, mRNA |
ref|NM_001113495.1| | 379/380 (99) | 0 | 10801 SEPT9 | SEPT | 17q25 |
| 25 | 537 | Homo sapiens
ATPase, Ca++ transporting, plasma membrane 4 (ATP2B4),
transcript variant 1, mRNA |
ref|NM_001001396.1| | 186/188 (99) |
5.00×10−90 | 493 ATP2B4 | ATP2B4 | 1q32.1 |
| 26 | 392 | PREDICTED: Homo
sapiens hypothetical LOC441072 (FLJ31104), partial miscRNA |
ref|XR_113742.1| | 203/225 (91) |
3.00×10−76 | 441072
FLJ31104 | FLJ31104 | 5q11.2 |
| 27 | 227 | Homo sapiens
CD44 molecule (Indian blood group) (CD44), RefSeqGene on chromosome
11 |
ref|NG_008937.1| | 207/207 (100) |
3.00×10−103 | 960 | CD44 | 11p13 |
| 28 | 364 | Pongo abelii
probable methyltransferase TARBP1-like (LOC100447859), mRNA |
ref|XM_002809289.1| | 120/124 (97) |
3.00×10−51 | 100447859
LOC100447859 | LOC100447859 | Unknown |
| Table II.Characteristics of downregulated
known genes in aldehyde dehydrogenase-positive subpopulation
cells. |
Table II.
Characteristics of downregulated
known genes in aldehyde dehydrogenase-positive subpopulation
cells.
| No. | Length, bp | Gene | Accession no. | Identities (%) | E-value | Gene ID | Gene symbol | Chromosomal
location |
|---|
| 1 | 410 | Pan troglodytes
hypothetical protein LOC736141 (LOC736141), mRNA |
ref|XM_001135501.1| | 322/364 (89) |
3.00×10−117 | 736141
LOC736141 | LOC736141 | X |
| 2 | 505 | Homo sapiens
claudin domain containing 1 (CLDND1), transcript variant 6,
mRNA |
ref|NM_001040199.1| | 318/320 (99) |
9.00×10−163 | 56650 CLDND1 | CLDND1 | 3q12.1 |
| 3 | 383 | Homo sapiens
ankyrin repeat domain 36B (ANKRD36B), mRNA |
ref|NM_025190.3| | 297/368 (81) |
4.00×10−70 | 57730 ANKRD36B | ANKRD36B | 2q11.2 |
| 4 | 357 | Homo sapiens
catenin (cadherin-associated protein), alpha 1, 102 kDa (CTNNA1),
mRNA |
ref|NM_001903.2| | 336/337 (99) |
1.00×10−174 | 1495 CTNNA1 | | CTNNA1 | 5q31 |
| 5 | 364 | Homo sapiens
electron-transfer-flavoprotein, alpha polypeptide (ETFA),
RefSeqGene on chromosome 15 |
ref|NG_007077.2| | 344/346
(99) |
5.00×10−177 | 2108 | ETFA | 15q23-q25 |
| 6 | 493 | Pan troglodytes
RAB7, member RAS oncogene family-like 1, transcript variant 1
(RAB7L1), mRNA |
ref|XM_001162387.1| | 264/296 (90) |
9.00×10−98 | 469654 RAB7L1 | RAB7L1 | 1q32 |
| 7 | 635 | Homo sapiens
wings apart-like homolog (Drosophila) (WAPAL), mRNA |
ref|NM_015045.2| | 617/618 (99) | 0 | 23063 WAPAL | WAPAL/WAPL | 10q23.2 |
| 8 | 459 | Homo sapiens
KIAA0101 (KIAA0101), transcript variant 2, mRNA |
ref|NM_001029989.1| | 441/442 (99) | 0 | 9768 KIAA0101 | KIAA0101/PAF | 15q22.31 |
| 9 | 299 | Homo sapiens
RAN binding protein 10 (RANBP10), mRNA |
ref|NM_020850.1| | 281/281
(100) |
2.00×10−145 | 57610 RANBP10 | RANBP10 | 16q22.1 |
| 10 | 224 | Homo sapiens
mitochondrial ribosomal protein S27 (MRPS27), nuclear gene encoding
mitochondrial protein, mRNA |
ref|NM_015084.2| | 202/204 (99) |
2.00×10−99 | 23107 MRPS27 | MRPS27 | 5q13.2 |
| 11 | 426 | Homo sapiens
vacuolar protein sorting 13 homolog A (S. cerevisiae)
(VPS13A), RefSeqGene on chromosome 9 |
ref|NG_008931.1| | 408/410 (99) | 0 | 23230 | VPS13A | 9q21 |
| 12 | 413 | Homo sapiens
SET binding factor 2 (SBF2), RefSeqGene on chromosome 11 |
ref|NG_008074.1| | 392/396 (99) | 0 | 81846 | SBF2 | 11p15.4 |
| 13 | 613 | Homo sapiens
MT-RNR2-like 2 (MTRNR2L2), mRNA |
ref|NM_001190470.1| | 562/597 (95) | 0 | 100462981 | MTRNR2L2 | Unknown |
| 14 | 423 | Homo sapiens
MT-RNR2-like 8 (MTRNR2L8), mRNA |
ref|NM_001190702.1| | 373/399 (94) |
9.00×10−167 |
100463486 MTRNR2L8 | MTRNR2L8 | Unknown |
| 15 | 588 | Homo sapiens
WD repeat domain 7 (WDR7), transcript variant 2, mRNA |
ref|NM_052834.2| | 133/133 (100) |
2.00×10−63 | 23335 WDR7 | WDR7 | 18q21.1-q22 |
| 16 | 261 | Pan troglodytes
similar to ORF1; putative (LOC745921), mRNA |
ref|XR_021946.1| | 276/326 (85) |
6.00×10−83 | 745921
LOC745921 | LOC745921 | Unknown |
| 17 | 459 | Homo sapiens
ornithine decarboxylase 1 (ODC1), mRNA |
ref|NM_002539.1| | 570/570 (100) | 0 | 4953 ODC1 | | ODC1 | 2p25 |
| 18 | 411 | Homo sapiens
ataxin 7 (ATXN7), RefSeqGene on chromosome 3 |
ref|NG_008227.1| | 393/394 (99) | 0 | 80145 | ATXN7 | 3p21.1-p12 |
| 19 | 494 | Homo sapiens
zinc finger protein 573 (ZNF573), transcript variant 5, mRNA |
ref|NM_001172692.1| | 476/476 (100) | 0 | 126231 ZNF573 | ZNF573 | 19q13.12 |
| 20 | 538 | Homo sapiens
bromodomain containing 2 (BRD2), transcript variant 3, mRNA |
ref|NM_001199455.1| | 297/299 (99) |
4.00×10−151 | 6046 BRD2 | BRD2 | 6p21.3 |
| 21 | 353 | PREDICTED: Pan
troglodytes similar to uracil DNA glycosylase (LOC743143),
mRNA |
ref|XR_021793.1| | 326/332 (98) |
2.00×10−163 | 743143
LOC743143 | LOC743143 | Unknown |
| 22 | 380 | Homo sapiens
SET nuclear oncogene (SET), transcript variant 1, mRNA |
ref|NM_001122821.1| | 360/360 (100) | 0 | 6418 SET | SET | 9q34 |
| 23 | 205 | Homo sapiens
peroxisomal biogenesis factor 19 (PEX19), transcript variant 4,
mRNA |
ref|NM_001193644.1| | 184/185 (99) |
2.00×10−90 | 5824 PEX19 | PEX19 | 1q22 |
| 24 | 386 | Homo sapiens
microphthalmia-associated transcription factor (MITF), RefSeqGene
on chromosome 3 |
ref|NG_011631.1| | 369/369 (100) | 0 | 4286 | MITF | 3p14.2-p14.1 |
| 25 | 449 | Homo sapiens
fatty acid desaturase 1 (FADS1), mRNA |
ref|NM_013402.4| | 431/432 (99) | 0 | 3992 FADS1 | FADS1 | 11q12.2-q13.1 |
| 26 | 352 | Homo sapiens
protein tyrosine phosphatase type IVA, member 1 (PTP4A1), mRNA |
ref|NM_003463.3| | 332/335 (99) |
3.00×10−170 | 7803 PTP4A1 | PTP4A1 | 6q12 |
| 27 | 323 | Homo sapiens
chromosome X open reading frame 57 (CXorf57), transcript variant 2,
mRNA |
ref|NM_001184782.1| | 303/305 (99) |
2.00×10−155 | 55086 CXorf57 | CXorf57 | Xq22.3 |
| 28 | 214 | Homo sapiens
CREB binding protein (CREBBP), RefSeqGene on chromosome |
ref|NG_009873.1| | 197/198
(99) |
1.00×10−96 | 1387 | CREBBP | 16p13.3 |
| 29 | 436 | Homo sapiens
mesencephalic astrocyte-derived neurotrophic factor (MANF),
mRNA |
ref|NM_006010.4| | 411/415 (99) | 0 | 7873 MANF | MANF | Unknown |
| 30 | 263 | Homo sapiens
ADP-ribosylation factor-like 6 interacting protein 1 (ARL6IP1),
mRNA |
ref|NM_015161.1| | 243/243 (100) |
3.00×10−124 | 23204 ARL6IP1 | ARL6IP1 | 16p12-p11.2 |
| 31 | 501 | Homo sapiens
RNA, 18S ribosomal 1 (RN18S1), ribosomal RNA |
ref|NR_003286.2| | 479/480 (99) | 0 | 100008588
RN18S1 | RN18S1 | Unknown |
| 32 | 248 | Homo sapiens
eukaryotic elongation factor-2 kinase (EEF2K), mRNA |
ref|NM_013302.3| | 227/227 (100) |
3.00×10−115 | 29904 EEF2K | EEF2K | 16p12.1 |
| 33 | 486 | Homo sapiens
myeloid/lymphoid or mixed-lineage leukemia (trithorax homolog,
Drosophila) (MLL), transcript variant 2, mRNA |
ref|NM_005933.3| | 466/469 (99) | 0 | 4297 MLL | MLL | 11q23 |
| 34 | 499 | PREDICTED:
Macaca mulatta ATP synthase subunit a-like (LOC100426362),
mRNA |
ref|XM_002806045.1| | 359/441 (81) |
3.00×10−93 | 100426362
LOC100426362 | LOC100426362 | Unknown |
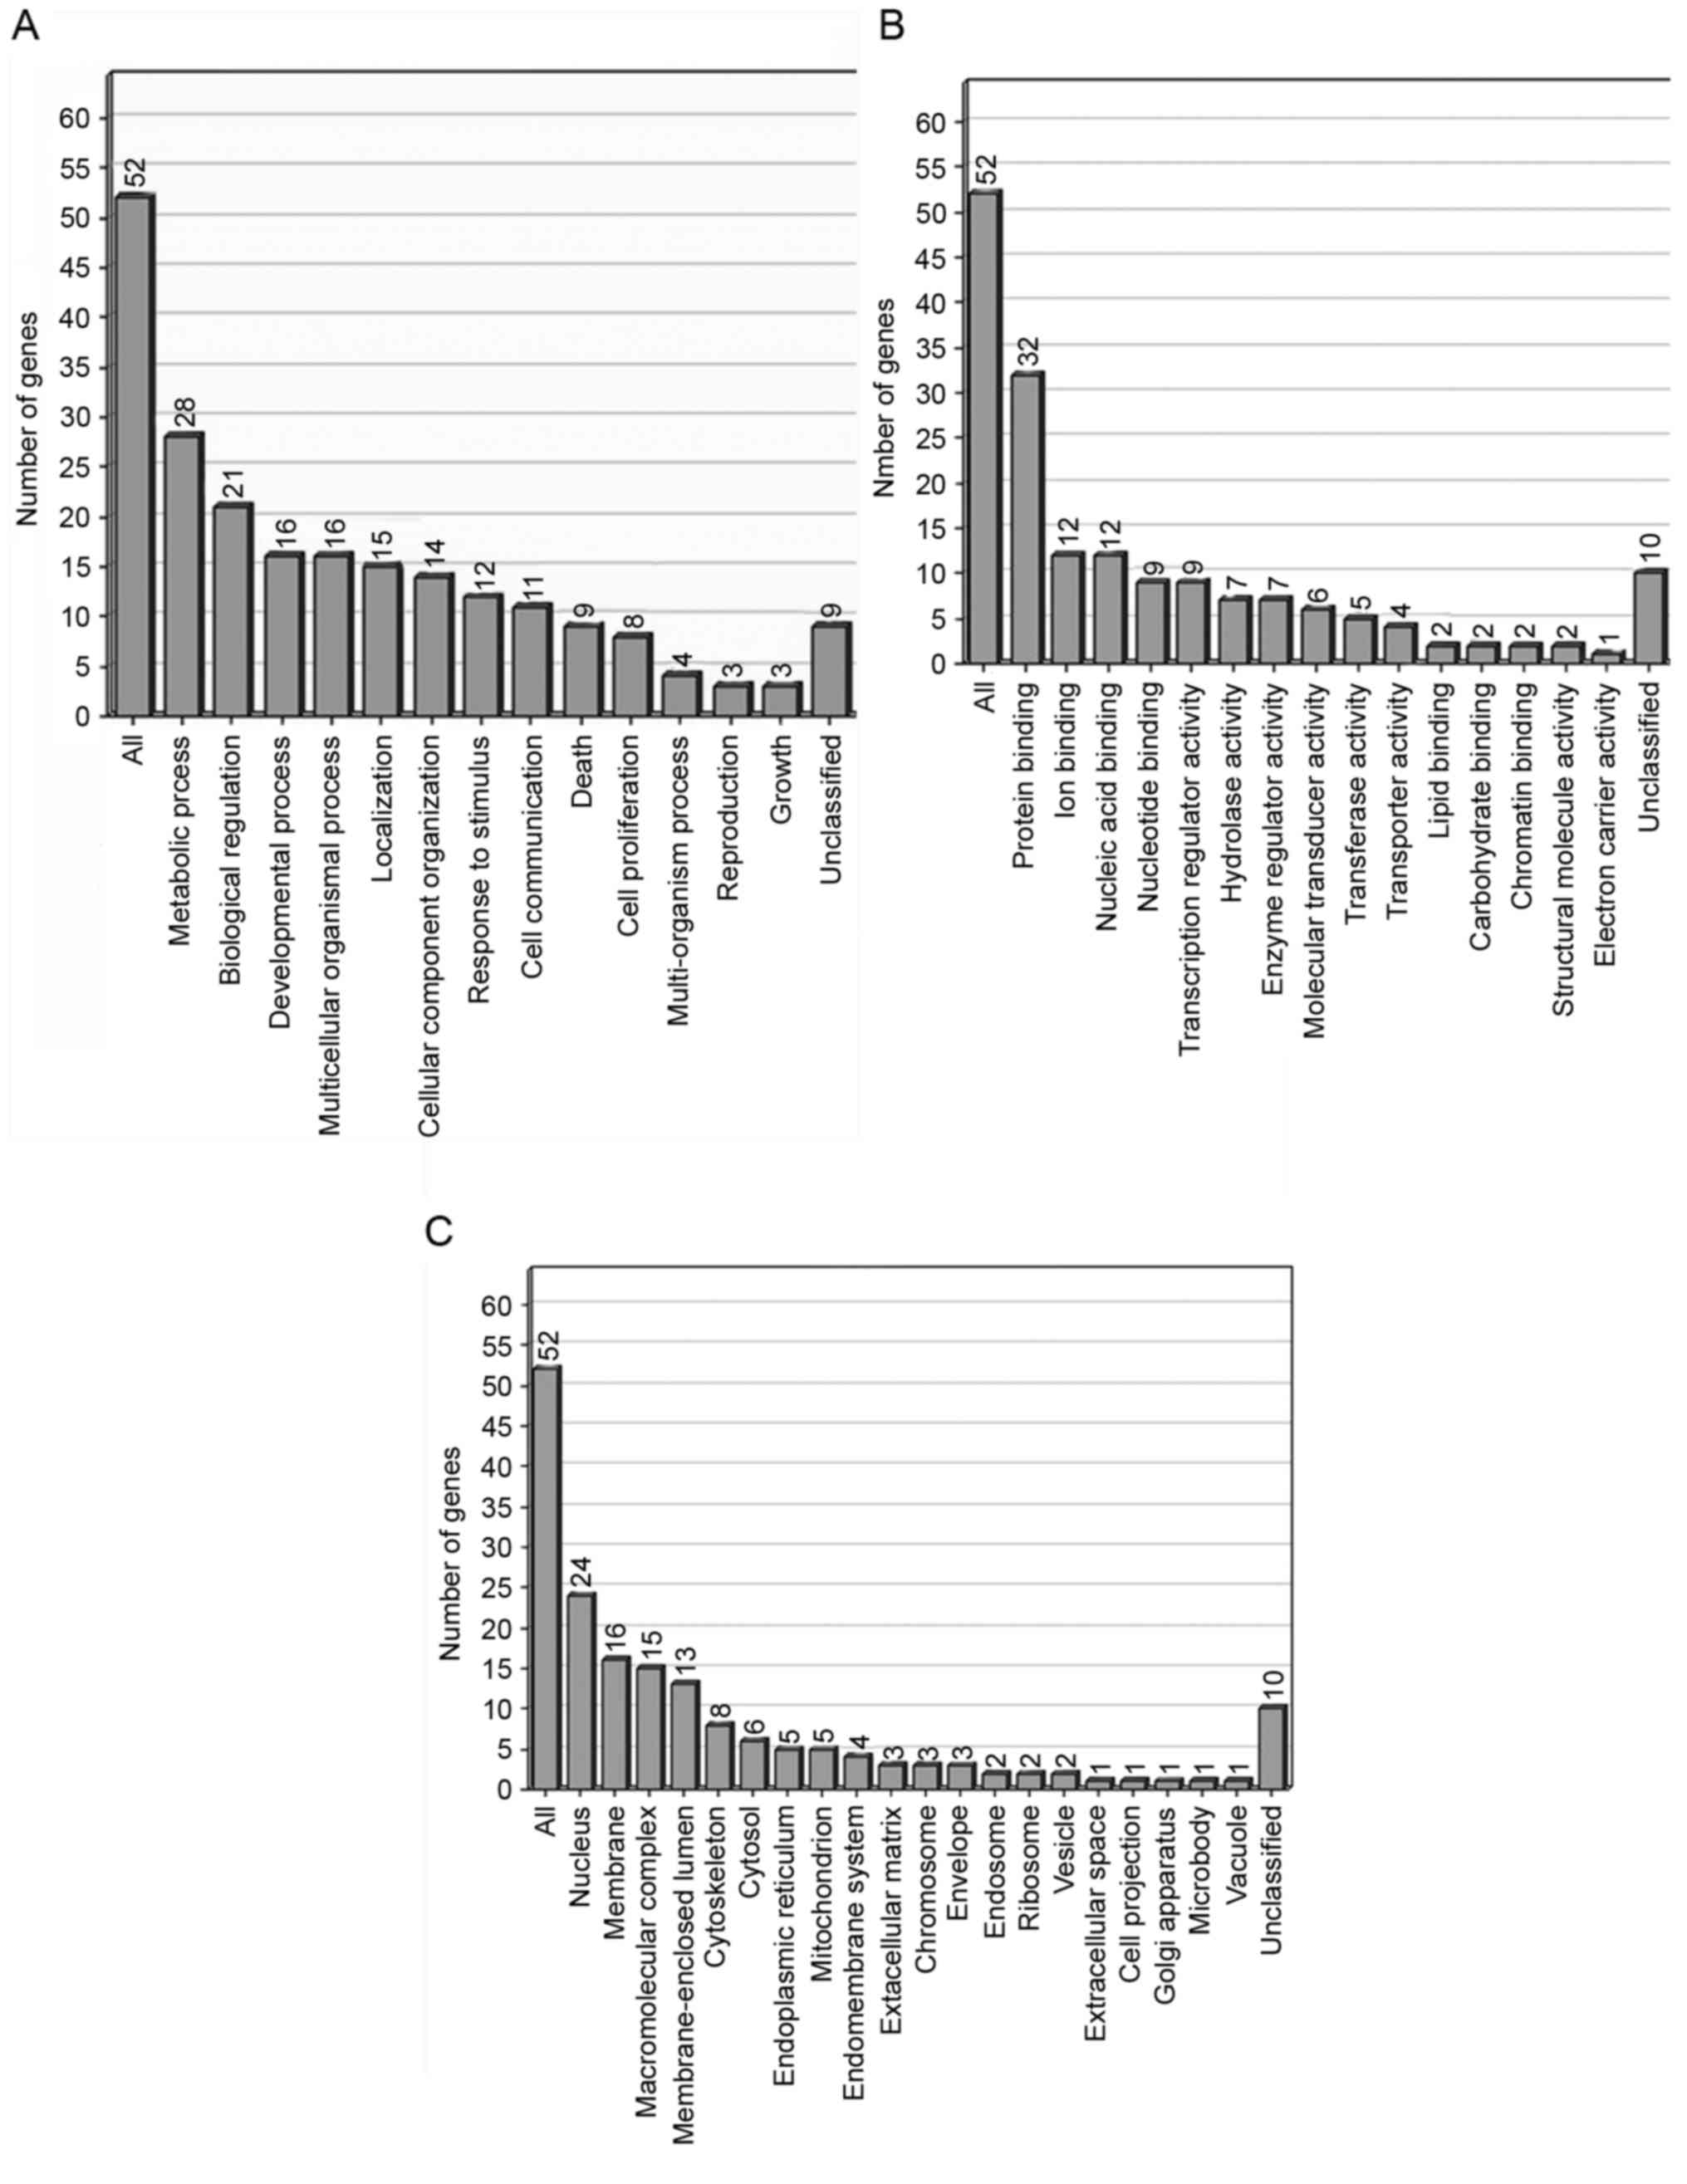
Functional classification of
differentially expressed ESTs
On the basis of the functional annotation using Gene
Ontology (GO) software, 62 differentially expressed genes were
grouped into a number of categories (Fig.
4). In the GO category of biological processes, the highly
enriched categories included those associated with metabolic
processes (28 genes), biological regulation (21 genes) and
developmental processes (16 genes). The molecular functions with
those highly enriched genes were associated with protein binding
(32 genes) and cellular components in the nucleus (24 genes).
Pathway analysis of differentially
expressed ESTs
Signal pathway analysis was performed based on the
Wikipathways database and the Pathway Commons database, using the
Gene Set Analysis Toolkit V2. The 10 signaling pathways with the
most marked alterations in each database are presented in Tables III and IV, and included the transforming growth
factor (TGF-) β signaling pathway, the Notch signaling pathway and
the c-kit pathway. Typically, ~10 genes were enriched in these
pathways and each gene may participate in a number of pathways.
| Table III.Pathway analysis, on the basis of the
pathway commons database. |
Table III.
Pathway analysis, on the basis of the
pathway commons database.
| Signaling
pathway | Entrez IDs | Enrichment
statistics |
|---|
| Notch-HLH
transcription | 1387, 4853 | C=6; O=2; E=0.01;
R=290.63; rawP=1.93×10⁻⁵; adjP=0.0004 |
| TGF-β receptor | 1387, 5925,
960 | C=126; O=3; E=0.14;
R=20.76; rawP=0.0004; adjP=0.0032 |
| Generic
transcription | 1387, 4853 | C=28; O=2; E=0.03;
R=62.28; rawP=0.0005; adjP=0.0032 |
|
Microphthalmia-associated transcription
factor | 1387, 4286 | C=51; O=2; E=0.06;
R=34.19; rawP=0.0016; adjP=0.0051 |
| Signaling events
mediated by stem cell factor receptor (c-Kit) | 1387, 9611, 4286,
29904 | C=436; O=4; E=0.50;
R=8.00; rawP=0.0016; adjP=0.0051 |
| BMP receptor | 4086, 4286,
29904 | C=189; O=3; E=0.22;
R=13.84; rawP=0.0014; adjP=0.0051 |
| NOTCH | 4853, 9611 | C=58; O=2; E=0.07;
R=30.07; rawP=0.0020; adjP=0.0054 |
| Regulation of
cytoplasmic and nuclear SMAD2/3 | 9611, 4286,
29904 | C=265; O=3; E=0.30;
R=9.87; rawP=0.0035; adjP=0.0066 |
| TGF-β receptor | 9611, 4286,
29904 | C=265; O=3; E=0.30;
R=9.87; rawP=0.0035; adjP=0.0066 |
| Androgen
receptor | 1387, 5925 | C=79; O=2; E=0.09;
R=22.07; rawP=0.0038; adjP=0.0066 |
| Table IV.Pathway analysis, on the basis of the
Wikipathways database. |
Table IV.
Pathway analysis, on the basis of the
Wikipathways database.
| Signaling
pathway | Entrez IDs | Enrichment
statistics |
|---|
| ∆-Notch | 9611, 4853, 4086,
1956 | C=86; O=4; E=0.10;
R=40.55; rawP=3.05×10⁻⁶; adjP=3.97×10⁻⁵ |
| Senescence and
autophagy | 5925, 960,
4297 | C=60; O=3; E=0.07;
R=43.60; rawP=4.65×10⁻⁵; adjP=0.0003 |
| Androgen
receptor | 1387, 5925,
1956 | C=115; O=3; E=0.13;
R=22.75; rawP=0.0003; adjP=0.0013 |
| B cell
receptor | 5925, 3708,
493 | C=158; O=3; E=0.18;
R=16.56; rawP=0.0008; adjP=0.0021 |
| TGF-β receptor | 1387, 5925,
960 | C=155; O=3; E=0.18;
R=16.88; rawP=0.0008; adjP=0.0021 |
| Notch | 1387, 4853 | C=46; O=2; E=0.05;
R=37.91; rawP=0.0013; adjP=0.0026 |
| Id | 5925, 4086 | C=51; O=2; E=0.06;
R=34.19; rawP=0.0016; adjP=0.0026 |
| TGF-β | 1387, 4086 | C=52; O=2; E=0.06;
R=33.53; rawP=0.0016; adjP=0.0026 |
| Estrogen | 1387, 9611 | C=76; O=2; E=0.09;
R=22.94; rawP=0.0035; adjP=0.0051 |
| Wnt and
pluripotency | 1387, 960 | C=98; O=2; E=0.11;
R=17.79; rawP=0.0057; adjP=0.0067 |
Discussion
CSCs refer to a subset of tumor cells that exhibit
the capability to self-renew and generate diverse cells that
comprise the tumor (4,21), and have been termed CSCs to reflect
the ‘stem-like’ properties and the ability to sustain
tumorigenesis. CSCs share important properties with healthy tissue
stem cells, including the capacity for self-renewal and
differentiation. An implication of the CSC hypothesis is that
cancer cells are hierarchically arranged with CSCs located at the
apex of the hierarchy (22). CSCs are
the only cells that may maintain tumor viability indefinitely. The
remaining cells, although actively proliferating and comprising the
majority of the tumor, are differentiating and destined to die. The
identification of CSCs has marked implications in the study of
cancer biology. Previous studies (7–11) have
indicated the existence of CSCs in a number of solid tumors and a
variety of cell surface makers have been used to isolate CSC
subpopulations, including cluster of differentiation (CD)24, CD133
and CD24; however, none of these markers are exclusively expressed
by CSCs in solid tumors.
ALDH is a member of the family of
NAD(P)+-dependent enzymes involved in detoxifying a
variety of aldehydes to the corresponding weak carboxylic acids
(23). The use of ALDH activity in
flow cytometry-based methods has enabled the isolation of viable
CSC subpopulations in a number of cancer types (24–26). In
the present study, CSCs were enriched from the tongue squamous cell
carcinoma TCA8113 cell line, according to the overexpression of
ALDHbr. ALDHbr cells comprised 1.3% of the
total cell population, which is consistent with previous studies
(13,14). Therefore, ALDHbr-associated
CSCs were successfully isolated for additional investigation.
In order to identify stem cell associated genes
differentially expressed in ALDHbr and
ALDHlow cells, SSH was performed. SSH is advantageous
compared with other PCR-based techniques as it selectively
amplifies target cDNA fragments (differentially expressed), and
simultaneously suppresses non-target DNA amplification, to generate
a library of differentially expressed sequences (27). The normalization step equalizes the
abundance of cDNAs within a target population and the subtraction
step excludes the common sequences between the driver and tester
populations (27). In addition, the
advantage compared with microarrays is that SSH may isolate novel
differentially expressed genes (28).
In the present study, two SSH libraries were constructed from cDNAs
obtained from ALDHbr and ALDHlow cells, and a
total of 240 clones were selected and sequenced. Using GenBank
databases, 28 and 34 known genes were identified from the forward
and reverse libraries, respectively. A total of 28 of clones
revealed homology with chromosome sequences and 14 clones
demonstrated homology with ESTs. The known genes were grouped into
functional categories on the basis of GO.
In the GO category of biological process, the highly
enriched categories included those associated with metabolic
processes (28 genes), biological regulation (21 genes) and
developmental processes (16 genes). The results of the present
study suggested that abnormal stem cell homeostasis associated with
the aforementioned processes would result in malignant changes in
stem cells.
Signaling pathway analysis identified the 10
pathways that exhibited marked alterations in the Wikipathways
database and Pathway Commons database, which included Notch and
TGF-β signaling pathways, which have been identified to serve
important roles in the regulation of stem cell self-renewal,
multi-potency and cell-fate determination (29,30). In
addition, one gene may participate in different signaling pathways
at the same time; for example, the gene encoding cAMP response
element-binding protein (CREB) binding protein (CREBBP/CBP) was
involved in 7 of the aforementioned signaling pathways and notably
interacted with Wnt signaling to maintain the pluriporency of
murine embryonic stem cells in long-term culture (31). A previous study demonstrated that CBP
was critical in maintaining an adequate pool of murine
hematopoietic stem cells through self-renewal and was important for
preventing hematological tumor formation (32), suggesting that CBP was associated with
the biological regulation of normal stem cells. There have been a
limited number of studies on the expression and function of CBP in
CSCs, therefore, whether CBP is a marker of CSCs in tongue squamous
cell carcinoma remains unknown. Additionally, nuclear receptor
corepressor 1 (NCOR1) was involved in a number of signaling
pathways and was initially defined as a regulator of nuclear
receptor-mediated repression. NCOR is expressed in the nucleus of
neural stem cells (NSCs) and is a regulator of neural stem cells.
Following phosphorylation, NCOR translocates to the cytoplasm and
induces the astrocytic differentiation of NSCs (33). Furthermore, NCOR has been identified
to maintain normal intestinal epithelial cell viability, and
silencing of NCOR1 expression in proliferating cells of crypt
origin resulted in a rapid viability arrest without associated cell
death (34). In glioblastoma
multiforme (GBM), NCOR was expressed in the nucleus of
undifferentiated CSCs and the nuclear localization of NCOR may
function as a marker of GBM stem cells (35).
Differentially expressed genes in tongue squamous
carcinoma stem-like cells were profiled using the SSH technique. A
total of 62 genes were identified as upregulated or downregulated
in tongue squamous carcinoma stem-like cells (termed
ALDHbr cells), suggesting that distinct gene expression
profiles are present in CSCs. CBP and NCOR1 genes were involved in
a number of signaling pathways in ALDHbr cells. The
results of a literature review suggested that CBP and NcoR1 may be
CSCs markers (32–35), which is consistent with the results of
the present study. Although the results of the present study are
preliminary, a group of candidate genes have been identified, which
require additional study.
Acknowledgements
The present study was supported by the ChonQing
Science and Technology Commission Project (grant no. 2013-1-030).
The authors thank Medjaden Bioscience Ltd. (Hong Kong, China) for
assisting in the preparation of the original manuscript.
References
|
1
|
Parkin DM, Pisani P and Ferlay J: Global
cancer statistics. CA Cancer J Clin. 49:33–64. 1999. View Article : Google Scholar : PubMed/NCBI
|
|
2
|
Jemal A, Bray F, Center MM, Ferlay J, Ward
E and Forman D: Global cancer statistics. CA Cancer J Clin.
61:69–90. 2011. View Article : Google Scholar : PubMed/NCBI
|
|
3
|
Haddad RI and Shin DM: Resent advances in
head and neck cancer. N Engl J Med. 359:1143–1154. 2008. View Article : Google Scholar : PubMed/NCBI
|
|
4
|
Reya T, Morrison SJ, Clarke MF and
Weissman IL: Stem cell, cancer, and cancer stem cell. Nature.
414:105–111. 2001. View
Article : Google Scholar : PubMed/NCBI
|
|
5
|
Pardal R, Clarke MF and Morrison SJ:
Applying the principles of stem-cell biology to cancer. Nat Rev
Cancer. 3:895–902. 2003. View
Article : Google Scholar : PubMed/NCBI
|
|
6
|
Brabletz T, Jung A, Spaderna S, Hlubek F
and Kirchner T: Opinion: Migrating cancer stem cell-an intergrated
concept of malignant tumour progression. Nat Rev Cancer. 5:744–749.
2005. View
Article : Google Scholar : PubMed/NCBI
|
|
7
|
Al-Hajj M, Wicha MS, Benito-Hernandez A,
Morrison SJ and Clarke MF: Prospective identification of
tumorigenic breast cancer cells. Proc Natl Acad Sci USA. 100:pp.
3983–3988. 2003, View Article : Google Scholar : PubMed/NCBI
|
|
8
|
Singh SK, Hawkins C, Clarke ID, Squire JA,
Bayani J, Hide T, Henkelman RM, Cusimano MD and Dirks PB:
Identification of human brain tumour initiating cells. Nature.
432:396–401. 2004. View Article : Google Scholar : PubMed/NCBI
|
|
9
|
Ricci-Vitiani L, Lombardi DG, Pilozzi E,
Biffoni M, Todaro M, Peschle C and De Maria R: Identification and
expansion of human colon-cancer-initiating cells. Nature.
445:111–115. 2007. View Article : Google Scholar : PubMed/NCBI
|
|
10
|
Schatton T, Murphy GF, Frank NY, Yamaura
K, Waaga-Gasser AM, Gasser M, Zhan Q, Jordan S, Duncan LM,
Weishaupt C, et al: Identification of cells initiating human
melanomas. Nature. 451:345–349. 2008. View Article : Google Scholar : PubMed/NCBI
|
|
11
|
Pfeiffer MJ and Schalken JA: Stem cell
characteristics in prostate cancer cell lines. Eur Urol.
57:246–255. 2010. View Article : Google Scholar : PubMed/NCBI
|
|
12
|
Clay MR, Tabor M, Owen JH, Carey TE,
Bradford CR, Wolf GT, Wicha MS and Prince ME: Single-marker
identification of head and neck squamous cell carcinoma cancer stem
cells with aldehyde dehydrogenase. Head Neck. 32:1195–1201. 2010.
View Article : Google Scholar : PubMed/NCBI
|
|
13
|
Chen YC, Chen YW, Hsu HS, Tseng LM, Huang
PI, Lu KH, Chen DT, Tai LK, Yung MC, Chang SC, et al: Aldehyde
dehydrogenase 1 is a putative marker for cancer stem cells in head
and neck squamous cancer. Biochem Biophys Res Commun. 385:307–313.
2009. View Article : Google Scholar : PubMed/NCBI
|
|
14
|
Clay MR, Tabor M, Owen JH, Carey TE,
Bradford CR, Wolf GT, Wicha MS and Prince ME: Single-marker
identification of head and neck squamous cell carcinoma cancer stem
cells with aldehyde dehydrogenase. Head Neck. 32:1195–1201. 2010.
View Article : Google Scholar : PubMed/NCBI
|
|
15
|
Galli R, Binda E, Orfanelli U, Cipelletti
B, Gritti A, De Vitis S, Fiocco R, Foroni C, Dimeco F and Vescovi
A: Isolation and characterization of tumorigenic, stem-like neural
precursors from human glioblastoma. Cancer Res. 64:7011–7021. 2004.
View Article : Google Scholar : PubMed/NCBI
|
|
16
|
Yuan X, Curtin J, Xiong Y, Liu G,
Waschsmann-Hogiu S, Farkas DL, Black KL and Yu JS: Isolation of
cancer stem cells from adult glioblastoma multiforme. Oncogene.
23:9392–9400. 2004. View Article : Google Scholar : PubMed/NCBI
|
|
17
|
Mahalingam R, Gomez-Buitrago A, Eckardt N,
Shah N, Guevara-Garcia A, Day P, Raina R and Fedoroff NV:
Characterizing the stress/defense transcriptome of Arabidopsis.
Genome Biol. 4:R202003. View Article : Google Scholar : PubMed/NCBI
|
|
18
|
Hemmati HD, Nakano I, Lazareff JA,
Masterman-Smith M, Geschwind DH, Bronner-Fraser M and Kornblum HI:
Cancerous stem cells can arise from pediatric brain tumors. Proc
Natl Acad Sci USA. 100:pp. 15178–15183. 2003, View Article : Google Scholar : PubMed/NCBI
|
|
19
|
Fang D, Nguyen TK, Leishear K, Finko R,
Kulp AN, Hotz S, Van Belle PA, Xu X, Elder DE and Herlyn M: A
tumorigenic subpopulation with stem cell properties in melanomas.
Cancer Res. 65:9328–9337. 2005. View Article : Google Scholar : PubMed/NCBI
|
|
20
|
Vermeulen L, Todaro M, de Sousa Mello F,
Sprick MR, Kemper K, Perez Alea M, Richel DJ, Stassi G and Medema
JP: Single-cell cloning of colon cancer stem cells reveals a
multi-lineage differentiation capacity. Proc Natl Acad Sci USA.
105:pp. 13427–13432. 2008, View Article : Google Scholar : PubMed/NCBI
|
|
21
|
Clarke MF, Dick JE, Dirks PB, Eaves CJ,
Jamieson CH, Jones DL, Visvader J, Weissman IL and Wahl GM: Cancer
stem cells-perstectives on current status and future directions:
AACR Workshop on cancer stem cells. Cancer Res. 66:9339–9344. 2006.
View Article : Google Scholar : PubMed/NCBI
|
|
22
|
Bommet D and Dick JE: Human acute myeloid
leukemia is organized as a hierarchy that originates from a
primitive hematopoietic cell. Nat Med. 3:730–737. 1997. View Article : Google Scholar : PubMed/NCBI
|
|
23
|
Sládek NE: Human aldehyde dehydrogenases:
Potential pathological, pharmacological, and toxicological impact.
J Biochem Mol Toxicol. 17:7–23. 2003. View Article : Google Scholar : PubMed/NCBI
|
|
24
|
Ginestier C, Hur MH, Charafe-Jauffret E,
Monville F, Dutcher J, Brown M, Jacquemier J, Viens P, Kleer CG,
Liu S, et al: ALDH1 is a marker of normal and malignant human
mammary stem cells and a predictor of poor clinical outcome. Cell
Stem Cell. 1:555–567. 2007. View Article : Google Scholar : PubMed/NCBI
|
|
25
|
Chu P, Clanton DJ, Snipas TS, Lee J,
Mitchell E, Nguyen ML, Hare E and Peach RJ: Characterization of a
subpopulation of colon cancer cells with stem cell-like properties.
Int J Cancer. 124:1312–1321. 2009. View Article : Google Scholar : PubMed/NCBI
|
|
26
|
van den Hoogen C, van der Horst G, Cheung
H, Buijs JT, Lippitt JM, Guzmán-Ramírez N, Hamdy FC, Eaton CL,
Thalmann GN, Cecchini MG, et al: High aldehyde dehydrogenase
activity identifies tumor-initiating and metastasis-initiating
cells in human prostate cancer. Cancer Res. 70:5163–5173. 2010.
View Article : Google Scholar : PubMed/NCBI
|
|
27
|
Hillmann A, Dunne E and Kenny D: cDNA
amplification by SMART-PCR and suppression subtractive
hybridization (SSH)-PCR. Methods Mol Biol. 496:223–243. 2009.
View Article : Google Scholar : PubMed/NCBI
|
|
28
|
Niu L, Mantri N, Li CG, Xue C and Pang E:
Array-based techniques for fingerprinting medicinal herbs. Chin
Med. 6:182011. View Article : Google Scholar : PubMed/NCBI
|
|
29
|
Wang Z, Li Y, Banerjee S and Sarkar FH:
Emerging role of Notch in stem cells and cancer. Cancer Lett.
279:8–12. 2009. View Article : Google Scholar : PubMed/NCBI
|
|
30
|
Mendelson J, Song S, Li Y, Maru DM, Mishra
B, Davila M, Hofstetter WL and Mishra L: Dysfunctional transforming
growth factor-β signaling with constitutively active notch
signaling in Barrett's esophageal Adenocarcinoma. Cancer.
117:3691–3702. 2011. View Article : Google Scholar : PubMed/NCBI
|
|
31
|
Miyabayashi T, Teo JL, Yamamoto M,
McMillan M, Nguyen C and Kahn M: Wnt/beta-catenin/CBP signaling
maintains long-term murine embryonic stem cell pluripotency. Proc
Natl Acad Sci USA. 104:pp. 5668–5673. 2007, View Article : Google Scholar : PubMed/NCBI
|
|
32
|
Rebel VI, Kung AL, Tanner EA, Yang H,
Bronson RT and Livingston DM: Distinct roles for CREB-binding
protein and p300 in hematopoietic stem cell self-renewal. Proc Natl
Acad Sci USA. 99:pp. 14789–14794. 2002, View Article : Google Scholar : PubMed/NCBI
|
|
33
|
Hermanson O, Jepsen K and Rosenfeld MG:
N-CoR controls differentiation of neural stem cells into
astrocytes. Nature. 419:934–939. 2002. View Article : Google Scholar : PubMed/NCBI
|
|
34
|
Doyon G, St-Jean S, Darsigny M, Asselin C
and Boudreau F: Nuclear receptor co-repressor is required to
maintain proliferation of normal intestinal epithelial cells in
culture and down-modulates the expression of pigment epithelium
derived factor. J Biol Chem. 284:25220–25229. 2009. View Article : Google Scholar : PubMed/NCBI
|
|
35
|
Park DM, Li J, Okamoto H, Akeju O, Kim SH,
Lubensky I, Vortmeyer A, Dambrosia J, Weil RJ, Oldfield EH, et al:
N-CoR pathway tatgeting induces glioblastoma derived cancer stem
cell differentiation. Cell Cycle. 6:467–470. 2007. View Article : Google Scholar : PubMed/NCBI
|