Introduction
Thyroid follicular cells are found in the thyroid
gland, specifically in the epithelial monolayer. In total, >95%
of thyroid tumors are derived from these follicular cells (1). In 2016, the incidence of thyroid tumors
rose globally, largely due to technological and diagnostic advances
(2). However, it remains difficult to
distinguish whether a thyroid nodule is benign or malignant.
Follicular thyroid tumors may be divided into malignant follicular
thyroid carcinoma (FTC) and benign follicular thyroid adenoma (FA).
Only 5–10% of thyroid nodules are malignant (3). Patients with follicular tumors usually
must undergo thyroid lobectomy for diagnosis, which is often an
unnecessary surgery, as the disease is usually benign. Fine-needle
aspiration cytology is considered the most accurate method for the
diagnosis of FTC and FA (4).
Previously, microRNAs (miRNAs/miRs) have been
demonstrated to be involved in the pathogenesis of various
diseases, like cancer, diabetes and osteoarthritis (5–7). miRNAs
are small (18–25 nucleotides) non-coding, single-stranded RNA
molecules that bind to targets in a base pair-mediated manner,
resulting in the degradation or inhibition of the expression and
function of protein-coding mRNAs. miRNAs often bind to the
3′-untranslated region (3′UTR) of target genes (8), although they are usually only partially
complementary to the target (9).
miRNAs regulate ~30% of the human genes associated with
proliferation, apoptosis, metastasis, cell immunity and
differentiation (10). Each miRNA is
able to regulate several hundred mRNAs, and each mRNA may be the
target of several miRNAs. Therefore, a regulatory control network
exists between miRNAs and mRNAs (11). Furthermore, miRNAs have been
associated with several types of tumors, including non-small cell
lung cancer, colon and esophageal cancer, and FTC (12–14).
However, there are few studies of specific miRNA and mRNA analyses
of follicular thyroid tumors.
Several microarray studies have already described
the differentially expressed genes (DEGs) between malignant and
benign thyroid nodules. However, these studies have several
restrictions, including the fact that the samples are limited, they
contain significant false-negatives, and they require external
analysis at an offsite company laboratory (15–17).
Certain studies have aimed to reveal the potential miRNAs
associated with follicular thyroid tumors (18).
In the present study, an integrated analysis of
differentially expressed miRNAs (DEMs) and DEGs between FTC and FA
was performed. A Gene Ontology (GO) analysis of the DEGs was
performed. A total of 36 miRNA-gene pairs were identified between
the DEGs and the target genes of the DEMs. A miRNA-mRNA network
analysis was then performed to additionally investigate the
pathogenesis of FTC.
Materials and methods
Analysis of mRNA and miRNA profiling
datasets
Expression profile datasets containing mRNA and
miRNA were acquired from the Gene Expression Omnibus (GEO;
http://www.ncbi.nlm.nih.gov/geo/). The
expression profiling data of GSE29315 (Tomas et al,
unpublished) are mRNA profiling data, originally obtained from a
cohort of 9 FTC and 17 FA samples. The GSE62054 dataset contains
miRNA profiling data, which was originally obtained from 17 FTC and
8 FA samples (19). Additionally,
GSE29315 was hybridized on the Affymetrix U95 GeneChip platform
(Affymetrix; ThermoFisher Scientific, Inc., Waltham, MA, USA) and
GSE62054 was performed on the Illumina Human v2 miRNA expression
BeadChip (Illumina, Inc., San Diego, CA, USA).
Preprocessing of profiling data
GSE29315 and GSE62054 data were first preprocessed
by the Affy package in R language version 3.4.0 and then were
processed by log2 transformation, background correction
and data normalization using the Robust Multi-array Average
algorithm (20).
Identification of DEMs, DEGs and GO
enrichment analysis
Identification of DEMs and DEGs were conducted by
the Limma package version 3.32.5 in R software (21). The threshold values for different
expression were log2 (fold-change)>0.5 or
log2 (fold-change)<-0.5 with P<0.05 (22). GO enrichment analysis for DEGs was
performed with the Database for Annotation, Visualization and
Integrated Discovery (DAVID) (23).
Overlapping genes of DEGs and the
predicted target genes of the DEMs
The predicted target mRNAs of the DEMs were
generated using the miRWalk (24),
miRecords (25) and TarMir databases
(26). The overlapping DEGs and the
predicted target mRNAs of the DEMs were identified for additional
network analysis.
Construction and analysis of
miRNA-mRNA regulatory network
To obtain an improved understanding of the
biological function of the miRNA-mRNA regulatory network,
node-degree analysis was performed, based on the overlapping genes
and their upstream miRNAs. The network was visualized using the
Cytoscape platform software version 3.0.1 (27).
Results
Identifying DEMs and DEGs between FTC
and FA
GSE29315 and GSE62054 were downloaded from GEO and
then normalized, and corrected by the quantile normalization method
and hierarchical clustering analysis using R software. DEMs and
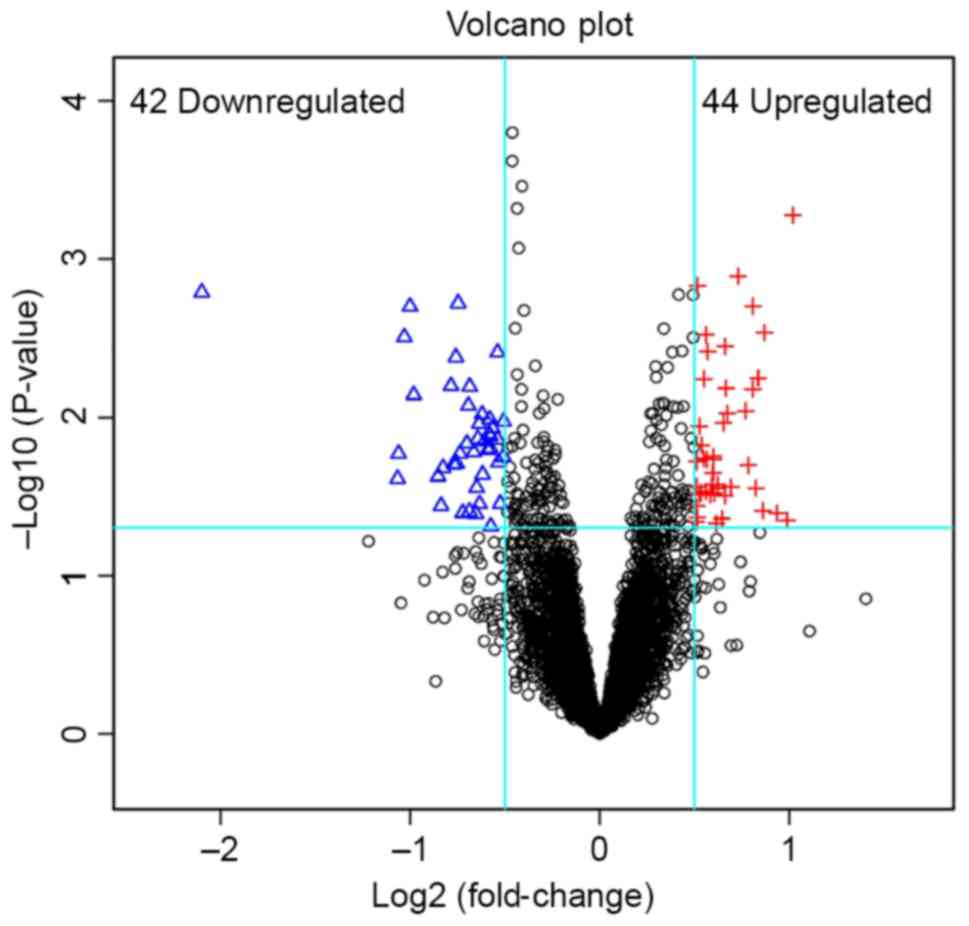
DEGs were identified between the FTC and FA. A total of 86 DEGs and
32 DEMs were obtained when the threshold values were set at
P<0.05 and log2(fold-change)>0.5 or
log2 (fold-change)<-0.5. The top 5 downregulated DEMs
were miR-7, miR-1179, miR-7-2, miR-486-5p and miR-130b. The top 5
upregulated DEMs were miR-663b, miR-137, miR-30c-1, miR-767-5p and
miR-603 (Table I). As for the DEGs,
the top 5 downregulated genes were fatty acid binding protein 4
(FABP4), cytidine monophospho-N-acetylneruaminic acid (CMAHP),
integral membrane protein 2A (ITM2A), carbonic anhydrase 4 (CA4)
and family with sequence similarity 189 member A2 (FAM189A2), and
the top 5 upregulated genes were erythrocyte membrane protein band
4.1 like 3 (EPB41L3), secretogranin V (SCG5), paired box 1 (PAX1),
methylenetetrahydrofolate dehydrogenase (NADP + dependent) 2,
methenyltetrahydrofolate cyclohydrolase (MTHFD2) and cadherin 2
(CDH2) (Table II). A volcano plot
was constructed to identify the DEGs (Fig. 1).
 | Table I.Top 5 differentially expressed miRNAs
of malignant follicular thyroid carcinoma compared with benign
follicular thyroid adenoma. |
Table I.
Top 5 differentially expressed miRNAs
of malignant follicular thyroid carcinoma compared with benign
follicular thyroid adenoma.
| miRNA | P-value |
log2(fold-change) |
|---|
| Downregulated |
|
|
|---|
|
miR-7 | 0.0041392 | −1.7320437 |
|
miR-1179 | 0.0081728 | −1.3950195 |
|
miR-7–2 | 0.0006626 | −1.2525509 |
|
miR-486-5p | 0.0412501 | −1.0502825 |
|
miR-130b | 0.0028172 | −0.9176468 |
| Upregulated |
|
|
|
miR-663b | 0.0009353 | 0.9881272 |
|
miR-137 | 0.0088044 | 0.9341108 |
|
miR-30c-1 | 0.0059237 | 0.8695624 |
|
miR-767-5p | 0.0036048 | 0.7353497 |
|
miR-603 | 0.0392875 | 0.6646499 |
| Table II.Top 5 differentially expressed mRNAs
of malignant follicular thyroid carcinoma compared with benign
follicular thyroid adenoma. |
Table II.
Top 5 differentially expressed mRNAs
of malignant follicular thyroid carcinoma compared with benign
follicular thyroid adenoma.
| mRNA | P-value |
log2(fold-change) |
|---|
| Downregulated |
|
|
|
FABP4 | 0.001621719 | −2.100023748 |
|
CMAHP | 0.024414059 | −1.066127774 |
|
ITM2A | 0.016922069 | −1.060957028 |
|
CA4 | 0.003105875 | −1.030691864 |
|
FAM189A2 | 0.001993414 | −1.000814956 |
| Upregulated |
|
|
|
EPB41L3 | 0.000527208 | 1.020917517 |
|
SCG5 | 0.044745635 | 0.990761798 |
|
PAX1 | 0.040281329 | 0.936795356 |
|
MTHFD2 | 0.002917107 | 0.870767506 |
|
CDH2 | 0.038829964 | 0.862357097 |
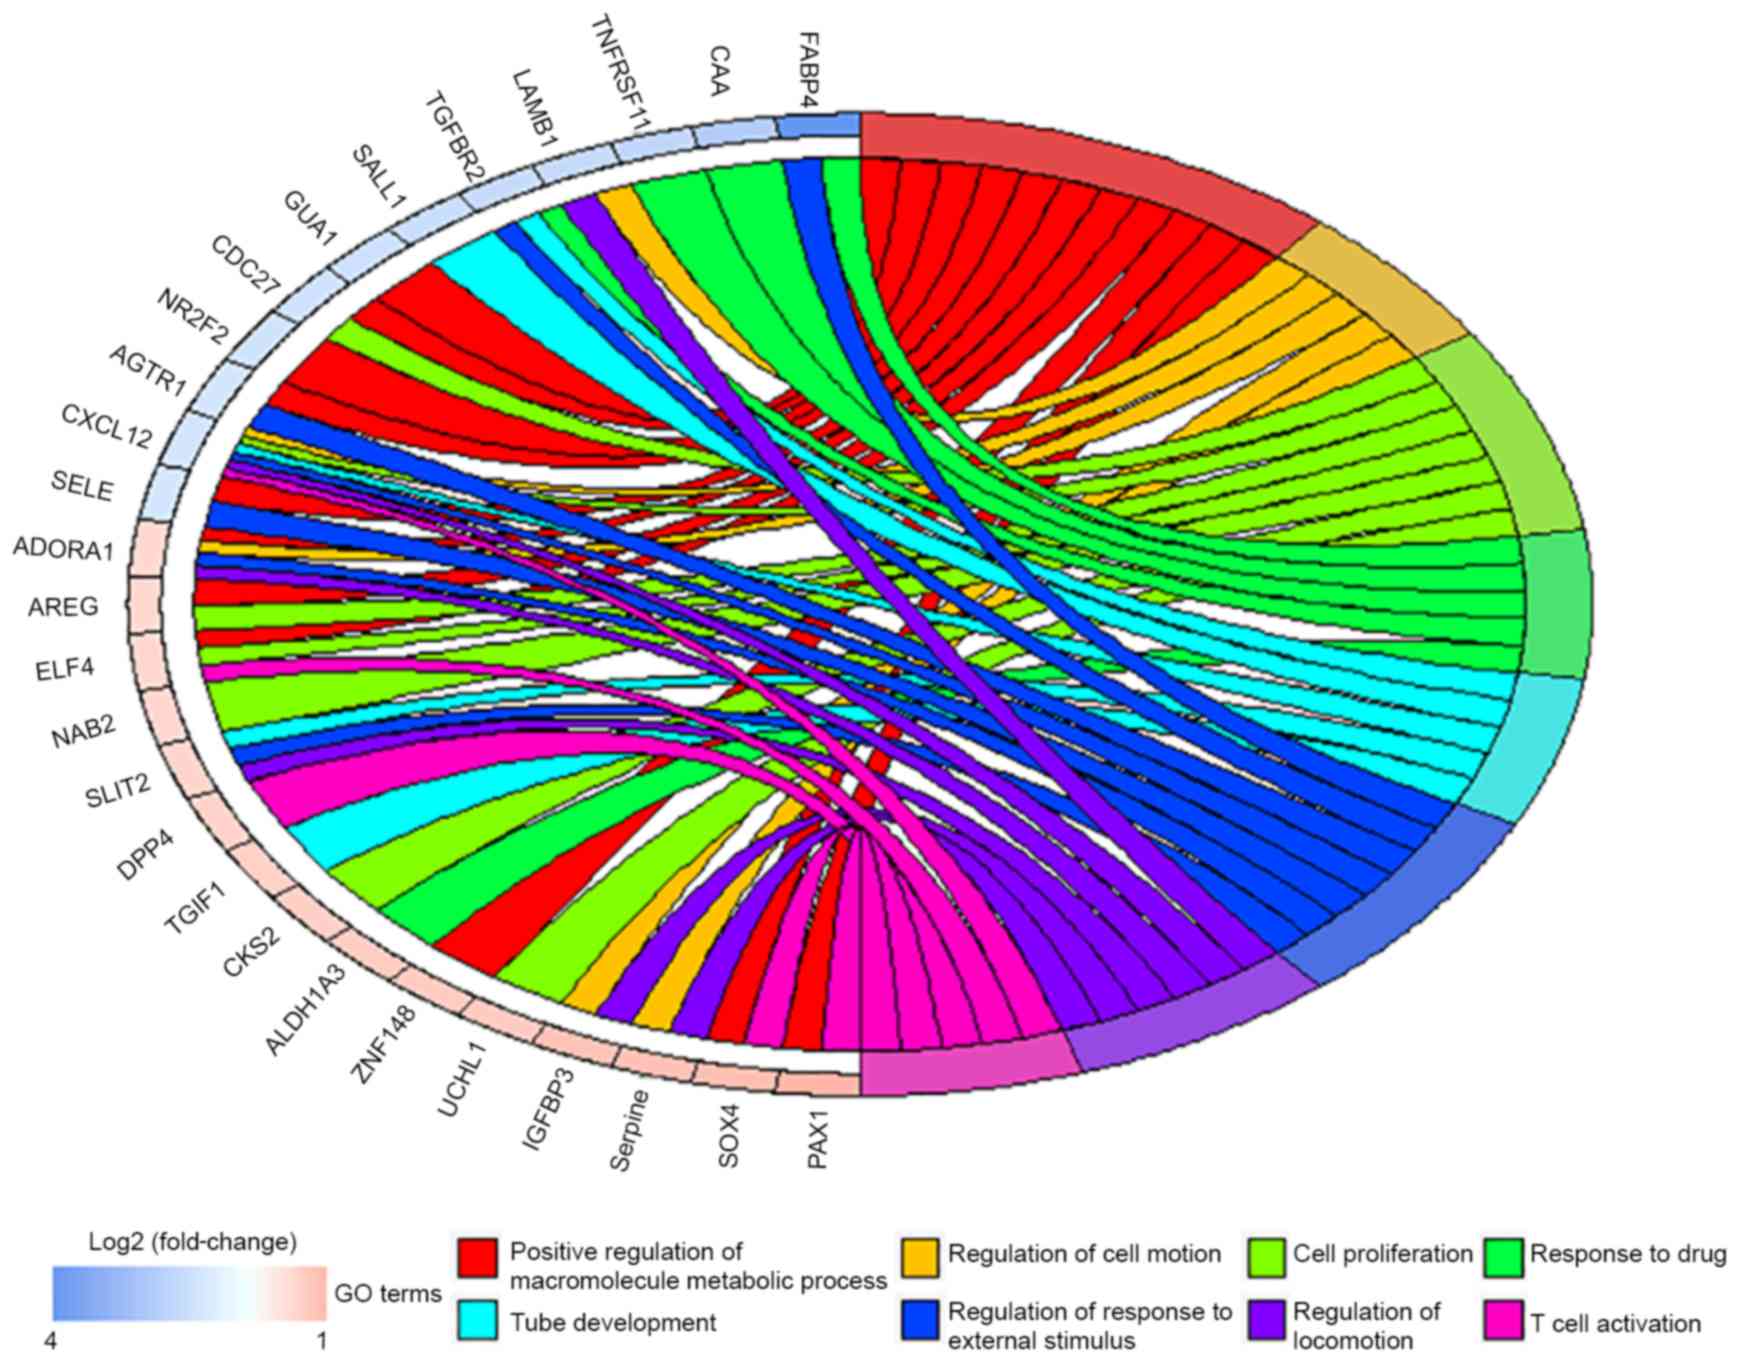
GO enrichment analysis of DEGs
GO analysis of all the DEGs (Table III) identified 8 associated
biological processes: Positive regulation of macromolecule
metabolic process, regulation of cell motion, cell proliferation,
tube development, regulation of response to external stimulus,
regulation of locomotion, response to drug and T cell activation
(Fig. 2).
| Table III.Differentially expressed mRNAs of
malignant follicular thyroid carcinoma compared with benign
follicular thyroid adenoma. |
Table III.
Differentially expressed mRNAs of
malignant follicular thyroid carcinoma compared with benign
follicular thyroid adenoma.
| Gene | P-value | log2
(fold-change) |
|---|
| FABP4 | 0.001621719 | −2.100023748 |
| CMAHP | 0.024414059 | −1.066127776 |
| ITM2A | 0.016922069 | −1.060957028 |
| CA4 | 0.003105875 | −1.030691864 |
| FAM189A2 | 0.001993414 | −1.000814956 |
| MPPED2 | 0.007206792 | −0.981309728 |
| HGD | 0.023615869 | −0.852452356 |
| TNFRSF11B | 0.036234193 | −0.836887107 |
| SLC16A4 | 0.020876545 | −0.826437495 |
| BZRAP1 | 0.006323889 | −0.784389089 |
| PDGFRL | 0.019724555 | −0.769696713 |
| TFF3 | 0.004160978 | −0.758375163 |
| LAMB1 | 0.019590536 | −0.754903323 |
| UBR2 | 0.001897906 | −0.746515077 |
| TGFBR2 | 0.016942031 | −0.736954014 |
| CPQ | 0.040123761 | −0.722559518 |
| RDX | 0.014625862 | −0.700582583 |
| PTPRN2 | 0.008418827 | −0.692563257 |
| SALL1 | 0.039302461 | −0.687132893 |
| LRRN3 | 0.006382367 | −0.685656353 |
| TRAM2 | 0.016638751 | −0.664343953 |
| SLITRK5 | 0.040721395 | −0.652918137 |
| RGS16 | 0.027819411 | −0.648828034 |
| STARD13 | 0.013643606 | −0.642603503 |
| THBD | 0.010984131 | −0.635676793 |
| GJA1 | 0.035287842 | −0.633044868 |
| TNFSF10 | 0.009577025 | −0.620052341 |
| PKIA | 0.022943634 | −0.617442203 |
| CLDN8 | 0.014099121 | −0.606720582 |
| IL11RA | 0.016027339 | −0.589253369 |
| CDC27 | 0.012718038 | −0.584208837 |
| SLC35D2 | 0.010299633 | −0.579905832 |
| IFI44L | 0.015727697 | −0.576791484 |
| NR2F2 | 0.013187137 | −0.575425266 |
| CHD9 | 0.048840737 | −0.573993055 |
| FCGRT | 0.011662768 | −0.566086321 |
| AGTR1 | 0.013773676 | −0.538397573 |
| CXCL12 | 0.003888448 | −0.538189987 |
| HSD17B8 | 0.019222754 | −0.533271237 |
| LOC728093 | 0.035060908 | −0.524392385 |
| SELE | 0.017742851 | −0.507241011 |
| AKAP12 | 0.010628133 | −0.506141506 |
| PVALB | 0.045712444 | 0.509393237 |
| NNT | 0.027397598 | 0.513526356 |
| ADORA1 | 0.036372247 | 0.513841883 |
| GPI | 0.018981531 | 0.514219746 |
| AREG | 0.042790083 | 0.515091119 |
| ELF4 | 0.001468499 | 0.516939945 |
| NAB2 | 0.011359365 | 0.527142113 |
| GPC1 | 0.030827537 | 0.529427807 |
| SLC25A5 | 0.029858761 | 0.534298394 |
| RYR1 | 0.014981235 | 0.538436907 |
| PEG10 | 0.018255692 | 0.549699307 |
| SLIT2 | 0.005701378 | 0.551929669 |
| ESYT1 | 0.003009396 | 0.561757654 |
| CRLF1 | 0.029356956 | 0.562850973 |
| DPP4 | 0.018431425 | 0.567301902 |
| CES2 | 0.003842477 | 0.571035541 |
| CYCS | 0.030715945 | 0.585863898 |
| BASP1 | 0.026758782 | 0.594217929 |
| KLHL21 | 0.022505203 | 0.599053201 |
| LCN2 | 0.017669691 | 0.601124995 |
| EEF1A2 | 0.018392179 | 0.602560272 |
| TGIF1 | 0.030147532 | 0.605396529 |
| TSPYL2 | 0.046736047 | 0.617648983 |
| CKS2 | 0.026759687 | 0.623716633 |
| SPAG5 | 0.027923235 | 0.624868361 |
| CKMT2 | 0.043578063 | 0.645621487 |
| ALDH1A3 | 0.010848438 | 0.653685247 |
| ZNF148 | 0.031227695 | 0.661077991 |
| UCHL1 | 0.003566593 | 0.663217388 |
| ASNS | 0.006539605 | 0.667304137 |
| NPTXR | 0.009448284 | 0.674187256 |
| FKBP5 | 0.027541727 | 0.694255151 |
| GOT1 | 0.001282557 | 0.730143285 |
| IGFBP3 | 0.009116606 | 0.771327366 |
| SERPINE2 | 0.020069598 | 0.785032654 |
| SOX4 | 0.006616428 | 0.808876177 |
| BSG | 0.001981905 | 0.809699733 |
| SCNN1A | 0.027983691 | 0.825462627 |
| NPC2 | 0.005654992 | 0.837641446 |
| CDH2 | 0.038829964 | 0.862357097 |
| MTHFD2 | 0.002917107 | 0.870767506 |
| PAX1 | 0.040281329 | 0.936795356 |
| SCG5 | 0.044745635 | 0.990761798 |
| EPB41L3 | 0.000527208 | 1.020917517 |
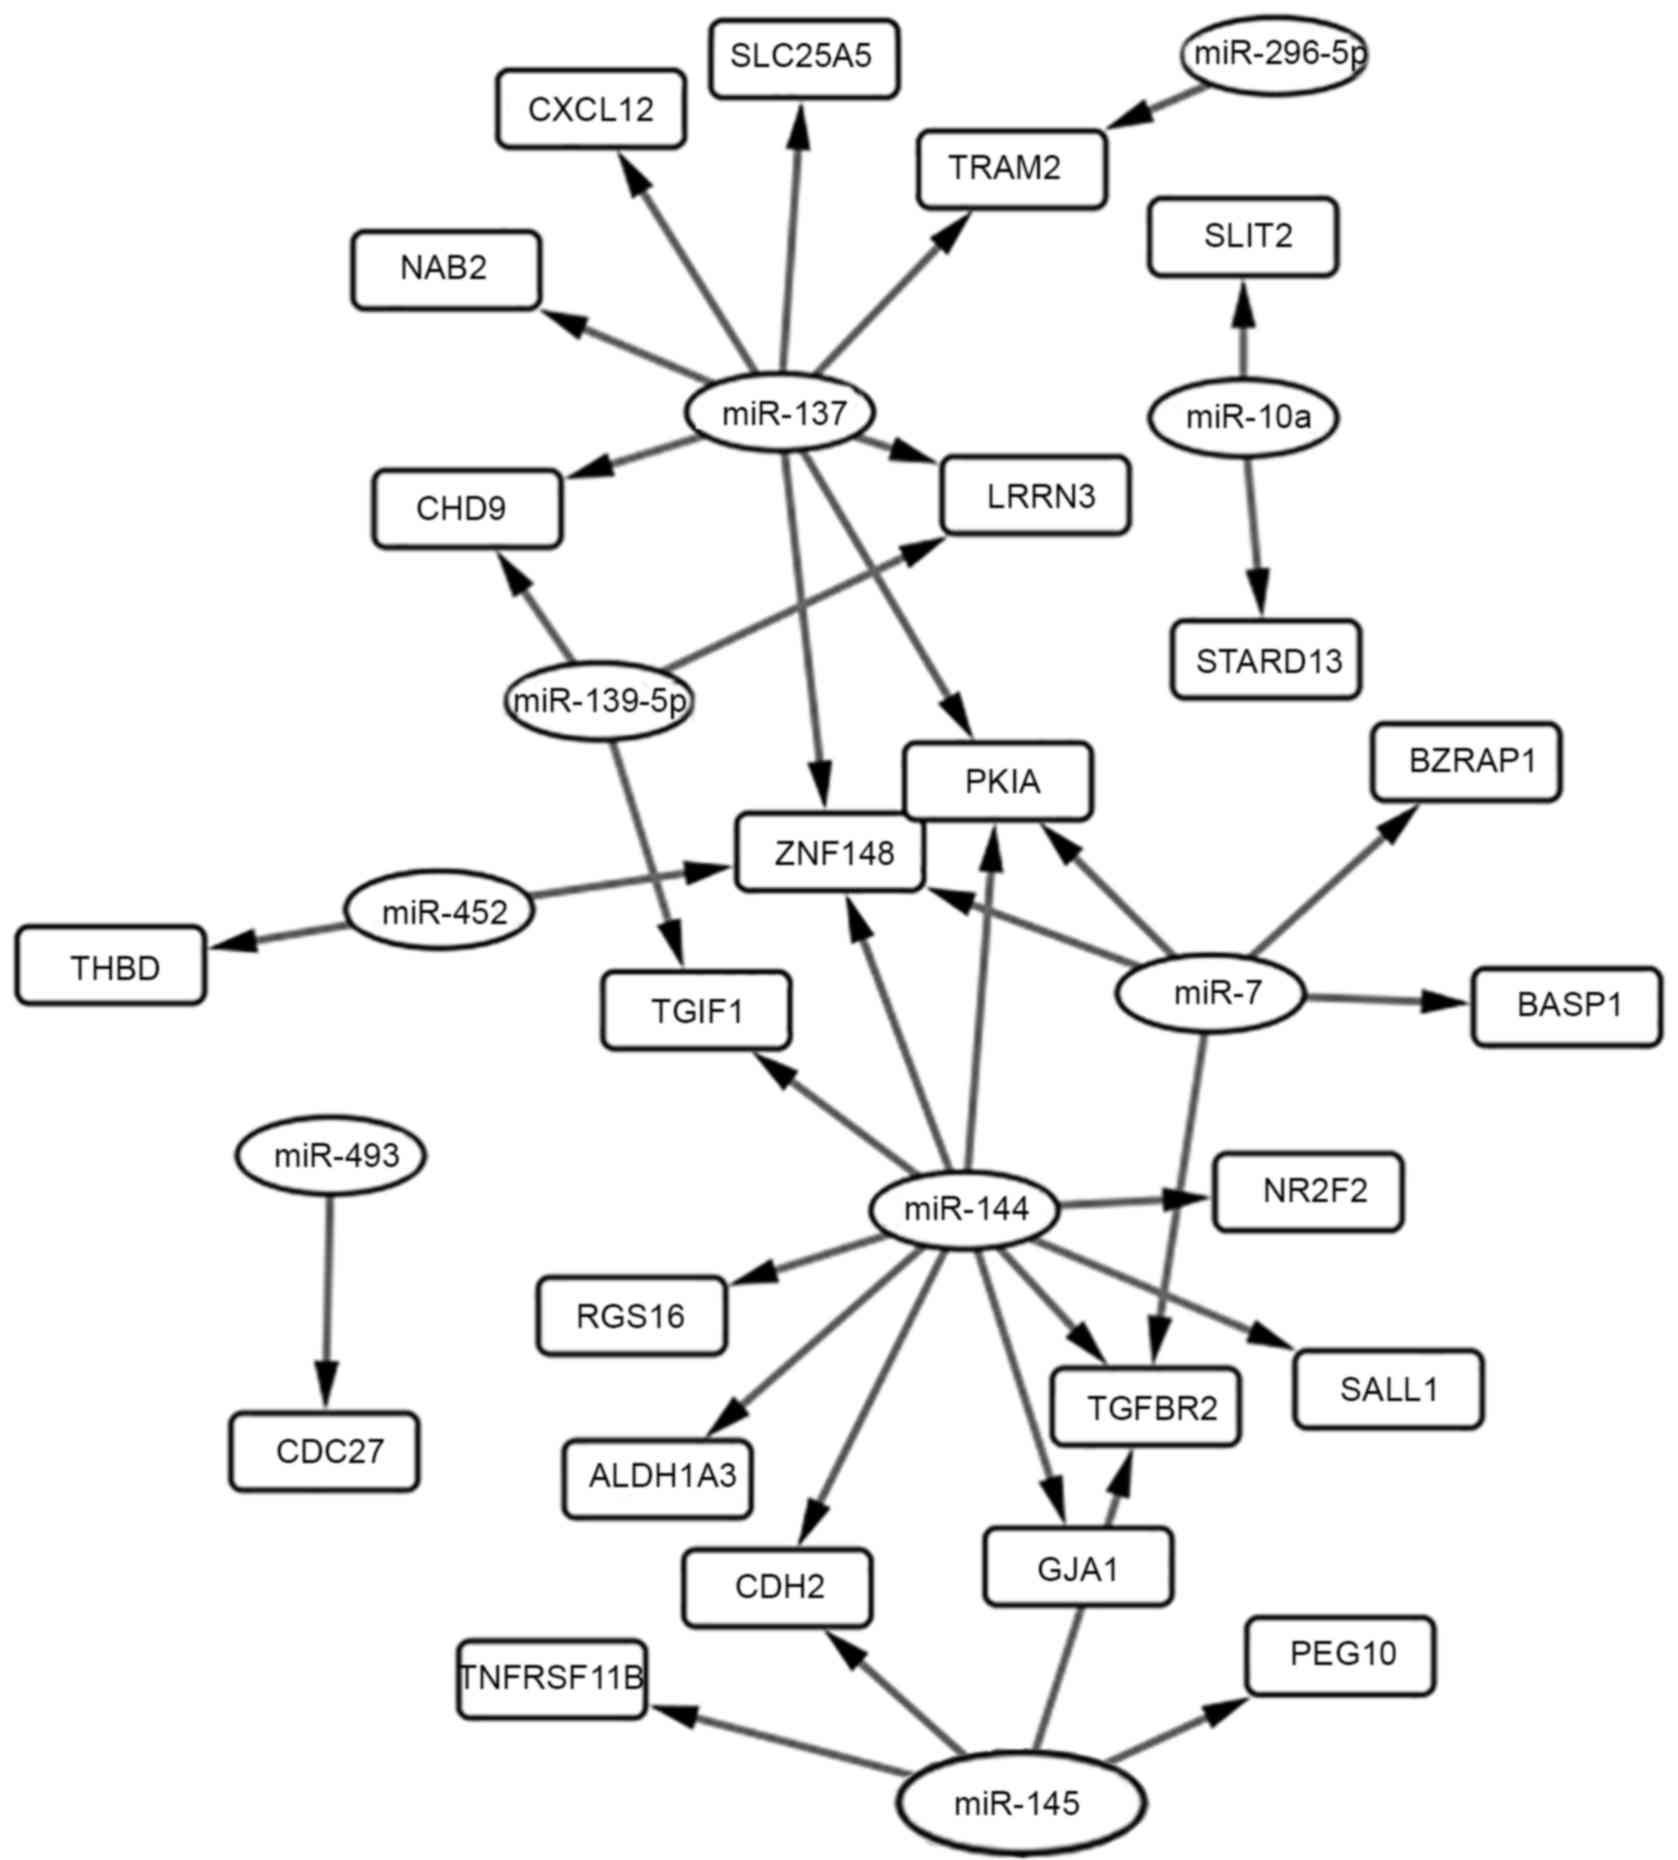
Integrated network analysis of
miRNA-mRNA interaction
From the miRWalk, miRecords and TarMir databases,
target genes of the DEMs were identified. A total of 24 overlapping
genes were identified between the targets genes and DEGs (Table IV). Furthermore, 36 miRNA-gene pairs
were obtained among the 24 overlapping genes and 9 DEMs (Table V). Node-degree analysis is summarized
in Table VI. The regulation network
between those overlapping genes and their upstream miRNAs is
presented in Fig. 3.
| Table IV.Significant regulation of mRNAs in
the specific miRNA-mRNA interacting regulatory network. |
Table IV.
Significant regulation of mRNAs in
the specific miRNA-mRNA interacting regulatory network.
| Gene | P-value | log2
(fold-change) |
|---|
| TNFRSF11B | 0.036234 | −0.836892 |
| BZRAP1 | 0.006324 | −0.784391 |
| TGFBR2 | 0.016942 | −0.736951 |
| SALL1 | 0.039302 | −0.687134 |
| LRRN3 | 0.006382 | −0.685662 |
| TRAM2 | 0.016639 | −0.664343 |
| RGS16 | 0.027819 | −0.648836 |
| STARD13 | 0.013644 | −0.642635 |
| THBD | 0.010984 | −0.635682 |
| GJA1 | 0.035288 | −0.633043 |
| PKIA | 0.022944 | −0.617443 |
| CDC27 | 0.012718 | −0.584214 |
| NR2F2 | 0.013187 | −0.575433 |
| CHD9 | 0.048841 | −0.573992 |
| CXCL12 | 0.003888 | −0.538192 |
| NAB2 | 0.011359 | 0.527142 |
| SLC25A5 | 0.029859 | 0.534298 |
| PEG10 | 0.018256 | 0.549699 |
| SLIT2 | 0.005701 | 0.551934 |
| BASP1 | 0.026759 | 0.594218 |
| TGIF1 | 0.030148 | 0.605397 |
| ALDH1A3 | 0.010848 | 0.653685 |
| ZNF148 | 0.031228 | 0.661078 |
| CDH2 | 0.038832 | 0.862357 |
| Table V.Significant regulation of miRNAs in
the specific miRNA-mRNA interacting regulatory network. |
Table V.
Significant regulation of miRNAs in
the specific miRNA-mRNA interacting regulatory network.
| miRNA | P-value | log2
(fold-change) |
|---|
| miR-7 | 0.0041392 | −1.7320437 |
| miR-137 | 0.0088043 | 0.9341108 |
| miR-144 | 0.0059723 | −0.8403724 |
| miR-139-5p | 0.0147834 | −0.5824534 |
| miR-145 | 0.0087553 | −0.5871226 |
| miR-296-5p | 0.0124989 | −0.5545413 |
| miR-10a | 0.0061396 | −0.7961598 |
| miR-452 | 0.0325921 | −0.5399825 |
| miR-493 | 0.0186862 | 0.6062014 |
| Table VI.Node-degree analysis of miRNA-mRNA
interactions. |
Table VI.
Node-degree analysis of miRNA-mRNA
interactions.
| Node | Degree |
|---|
| miR-144 | 10 |
| miR-137 | 9 |
| miR-145 | 5 |
| miR-7 | 5 |
| ZNF148 | 4 |
| miR-139-5p | 3 |
| PKIA | 3 |
| TGFBR2 | 3 |
| TRAM2 | 3 |
| TGIF1 | 2 |
Discussion
The important roles of miRNAs in the pathogenesis of
FTC have been identified previously (28). miRNAs exhibit different expression
patterns within different tumor types, and are closely associated
with the diagnosis, treatment and prognosis of tumors (29–31). Ak
et al (21) observed that DEMs
and differentially expressed mRNAs vary between benign and
malignant tumors, which may suggest the different roles of these
miRNAs and mRNAs. miR-197 and miR-346 have been indicated to be
overexpressed in FTC, resulting in the dysregulation of their
target genes (32). However, studies
regarding DEMs and DEGs in FTC are rare. In the present study, the
difference between miRNA-mRNA regulatory networks from FTC and FA
samples were compared in order to investigate the mechanism of FTC.
It was identified that miR-7, miR-1179, miR-7-2, miR-486-5p and
miR-130b were the top downregulated miRNAs, and that miR-663b,
miR-137, miR-30c-1, miR-767-5p and miR-603 were the top upregulated
miRNAs. For the DEGs, the top downregulated genes were FABP4,
CMAHP, ITM2A, CA4 and FAM189A2, and the top upregulated genes were
EPB41L3, SCG5, PAX1, MTHFD2 and CDH2. In addition, miR-7,
miR-296-5p, miR-10a, miR-144, miR-139-5p, miR-452 and miR-145 were
downregulated, and miR-137 and miR-493 were upregulated in the FTC
miRNA-mRNA regulatory network compared with those in FA. The gene
arrays identified DEGs, in which leucine rich repeat neuronal 3,
chromodomain helicase DNA binding protein 9, PKIA, zinc finger
protein 148 (ZNF148), TGFB induced factor homeobox 1, transforming
growth factor β receptor 2, gap junction protein α1 and CDH2 were
observed to be target genes inversely correlated with miR-7,
miR-144, miR-139-5p, miR-145 and miR-137. In other studies, FTC or
FA have been compared with normal tissue, and differences in miRNA
expression were observed to occur in the range between 1.2- and
2-fold, which was similar to the data of the present study
(33–35).
In the present study, it was identified that miR-7,
miR-296-5p, miR-10a, miR-144, miR-139-5p, miR-452, miR-145, miR-137
and miR-493 are important miRNAs that are differentially expressed
between carcinoma and adenoma samples. Certain studies have
suggested that miR-7 is not only a tumor promoter, but also a tumor
suppressor. As a tumor suppressor, miR-7 is downregulated in
tumors, such as thyroid cancer, breast cancer and
castration-resistant prostate cancer, leading to a derepression of
the oncogenes epidermal growth factor receptor, insulin receptor
substrate 1, Raf-1 proto-oncogene, serine/threonine kinase,
tyrosine kinase non-receptor 2,
phosphatidylinositol-4,5-bisphosphate 3-kinase catalytic subunit δ,
mechanistic target of rapamycin kinase, Ribosomal protein S6 kinase
β-1 and phosphatidylinositol-4,5-bisphosphate 3-kinase (36–38).
miR-296-5p has been revealed to be significantly inversely
correlated with post-contrast T1 values for diffuse myocardial
fibrosis in patients with hypertrophic cardiomyopathy, and is a
downstream effector under conditions that promote glioblastoma stem
cell stemness, and inhibit glioblastoma cell stemness and their
capacity to self-renew as spheres and propagate glioma xenografts
in vivo (39,40). miR-10a has been identified as a
downregulated miRNA associated with human metastatic medullary
thyroid carcinoma, and it may be important for tumor development
and/or reflect C-cell lineage (41,42).
miR-144 may suppress the invasion and migration capability of
thyroid cancer and suppress the expression of zinc finger
E-box-binding homeobox (ZEB)1 and ZEB2, the two E-cadherin
suppressors, by directly binding their 3′UTRs (43). miR-137 was indicated to participate in
hematopoiesis, particularly in the efficacy of warfarin, wherein
miR-137 may cause aberrant vitamin K epoxide reductase complex
subunit 1 expression (44).
miR-139-5p is an oncogenic molecule in the process of
tumorigenesis, and has been demonstrated to be a sensitive and
specific biomarker for the diagnosis of thyroid tumors and others
tumor types (45). Furthermore, it
may be of use as a tractable therapeutic target to decrease the
mortality rate and increase the survival rate (46). miR-145 has primarily been indicated as
being downregulated in colorectal tumors. Previously, certain
studies have identified that miR-145 is highly expressed in
mesenchymal cells such as fibroblasts and smooth muscle cells
(47). The miRNA was demonstrated to
directly regulate the expression of thyroid hormone receptor TRβ1
in renal cancer cells and to correlate with intracellular
triiodothyronine concentrations in renal tumors (48). miR-493 also promoted the invasion and
chemoresistance of gastric cancer cells. However, dickkopf
related-protein 1 overexpression reversed its effects on
proliferation, invasion and chemo-sensitivity (49). Based on these data, we hypothesize
that these miRNAs serve important roles in FTC with different
pathways.
In the present study, several genes that were
overlapping were identified between the DEGs and the target genes
of the DEMs. These may be upregulated or downregulated. However,
they all contributed to the development of FTC. Certain functions
of these genes in cancer have been studied. For example, ZNF148 is
a member of the human zinc finger Krüppel family and it maps to
regions implicated in recurrent chromosomal rearrangements in
hematological malignancies (50). The
present study identified spalt-like transcription factor 1 (SALL1),
which is one of the four human family members of the Spalt family.
Members of the Spalt family are highly conserved zinc-finger
transcription factors that are conserved from Caenorhabditis
elegans to vertebrates, with regulatory functions in
organogenesis, limb formation and cell fate assignment during
neural development. SALL1 expression has been identified to
correlate with the expression of CDH1, which is consistent with its
tumor suppressive function and suggests its potential involvement
in epithelial-to-mesenchymal transition (51,52). Cell
division cycle 27 (CDC27) is a core component of the
anaphase-promoting complex and is involved in the regulation of
mitotic checkpoints to ensure chromosomal integrity (53). CDC27 may significantly affect the
function of the polymeric protein complex and is also a target of
certain anticancer drugs (54,55).
Nuclear receptor subfamily 2 group F member 2 (NR2F2), also known
as chicken ovalbumin upstream promoter transcription factor, is
highly prioritized as a candidate gene associated with hypertension
(56). Certain studies have
demonstrated that NR2F2 is nuclear receptor transcription factor
vital for angiogenesis and heart development (57). These data suggest that several genes
have functions in numerous pathways involved in tumorigenesis and
progression.
Each miRNA is able to regulate several hundred
mRNAs. In addition, each mRNA may be targeted by several miRNAs and
each mRNA participates in several biological functions in the human
body. Therefore, each miRNA may affect different biological
processes and pathways through a miRNA-mRNA network (58,59). It is
important to understand the pathogenesis and treatment of tumors by
investigating the specific miRNA-mRNA co-regulation effects. In the
present study, mRNAs and their functions were described with GO
enrichment analysis. There were 86 mRNAs and 8 biological functions
involved. In total, ~80% of follicular carcinomas contain Ras gene
mutations or a paired box gene 8/peroxisome proliferator-activated
receptor γ gene rearrangement, which leads to uncontrolled
proliferation. Mutations in the phosphatase and tensin homologue
suppressor gene and the phosphatidylinositol 3-kinase pathway may
be an important factor in the development of more aggressive
thyroid cancer types and may be more common in follicular cancer,
which is responsible for cell motility, locomotion and response to
external stimulus (60–62). Other factors that have been implicated
in the pathogenesis of FTC include gene mutations in p53, c-myc,
c-fos and the thyrotropin receptor (63–66). These
molecules serve functions in cell proliferation, apoptosis,
cytoskeleton rearrangement and responses to drugs. Additionally,
FTC, but not adenoma, recruits tumor-associated macrophages by
releasing Chemokine (C-C motif) ligand 5; therefore, an abnormal
immune response, including T cell activation, may be involved in
follicular cancer. Other GO terms may be validated in future
studies (3,67).
In conclusion, the present study identified 86 DEGs
and 32 DEMs between FTC and FA. A total of 24 overlapping genes
were identified between the DEGs and the target genes of the DEMs.
Network analysis indicated a co-regulatory association between
miR-296-5p, miR-10a, miR-139-5p, miR-452, miR-493, miR-7, miR-137,
miR-144, miR-145 and corresponding targeted mRNAs in FTC. However,
the present study has limitations, such as the small sample size,
although attention was paid to ensure the use of two genetically
homogenous populations to avoid population stratification. The
mechanism of the miRNA-mRNA network and the roles of these genes in
FTC require additional study and validation in vitro and
in vivo.
References
|
1
|
Kondo T, Ezzat S and Asa SL: Pathogenetic
mechanisms in thyroid follicular-cell neoplasia. Nat Rev Cancer.
6:292–306. 2006. View
Article : Google Scholar : PubMed/NCBI
|
|
2
|
Enewold L, Zhu K, Ron E, Marrogi AJ,
Stojadinovic A, Peoples GE and Devesa SS: Rising thyroid cancer
incidence in the United States by demographic and tumor
characteristics, 1980–2005. Cancer Epidemiol Biomarkers Prev.
18:784–791. 2009. View Article : Google Scholar : PubMed/NCBI
|
|
3
|
McHenry CR and Phitayakorn R: Follicular
adenoma and carcinoma of the thyroid gland. Oncologist. 16:585–593.
2011. View Article : Google Scholar : PubMed/NCBI
|
|
4
|
Francis GL, Waguespack SG, Bauer AJ,
Angelos P, Benvenga S, Cerutti JM, Dinauer CA, Hamilton J, Hay ID,
Luster M, et al: Management guidelines for children with thyroid
nodules and differentiated thyroid cancer. Thyroid. 25:716–759.
2015. View Article : Google Scholar : PubMed/NCBI
|
|
5
|
Macfarlane LA and Murphy PR: MicroRNA:
Biogenesis, function and role in cancer. Curr Genomics. 11:537–561.
2010. View Article : Google Scholar : PubMed/NCBI
|
|
6
|
Yu C, Chen WP and Wang XH: MicroRNA in
osteoarthritis. J Int Med Res. 39:1–9. 2011. View Article : Google Scholar : PubMed/NCBI
|
|
7
|
Wang C, Wan S, Yang T, Niu D, Zhang A,
Yang C, Cai J, Wu J, Song J, Zhang CY, et al: Increased serum
microRNAs are closely associated with the presence of microvascular
complications in type 2 diabetes mellitus. Sci Rep. 6:200322016.
View Article : Google Scholar : PubMed/NCBI
|
|
8
|
Ambros V: The functions of animal
microRNAs. Nature. 431:350–355. 2004. View Article : Google Scholar : PubMed/NCBI
|
|
9
|
Bartel DP: MicroRNAs: Genomics,
biogenesis, mechanism, and function. Cell. 116:281–297. 2004.
View Article : Google Scholar : PubMed/NCBI
|
|
10
|
Croce CM and Calin GA: miRNAs, cancer, and
stem cell division. Cell. 122:6–7. 2005. View Article : Google Scholar : PubMed/NCBI
|
|
11
|
Chiang HR, Schoenfeld LW, Ruby JG, Auyeung
VC, Spies N, Baek D, Johnston WK, Russ C, Luo S, Babiarz JE, et al:
Mammalian microRNAs: Experimental evaluation of novel and
previously annotated genes. Genes Dev. 24:992–1009. 2010.
View Article : Google Scholar : PubMed/NCBI
|
|
12
|
Lu J, Getz G, Miska EA, Alvarez-Saavedra
E, Lamb J, Peck D, Sweet-Cordero A, Ebert BL, Mak RH, Ferrando AA,
et al: MicroRNA expression profiles classify human cancers. Nature.
435:834–838. 2005. View Article : Google Scholar : PubMed/NCBI
|
|
13
|
Hu Z, Chen X, Zhao Y, Tian T, Jin G, Shu
Y, Chen Y, Xu L, Zen K, Zhang C and Shen H: Serum microRNA
signatures identified in a genome-wide serum microRNA expression
profiling predict survival of non-small-cell lung cancer. J Clin
Oncol. 28:1721–1726. 2010. View Article : Google Scholar : PubMed/NCBI
|
|
14
|
Ji J, Shi J, Budhu A, Yu Z, Forgues M,
Roessler S, Ambs S, Chen Y, Meltzer PS, Croce CM, et al: MicroRNA
expression, survival, and response to interferon in liver cancer. N
Engl J Med. 361:1437–1447. 2009. View Article : Google Scholar : PubMed/NCBI
|
|
15
|
Finley DJ, Zhu B, Barden CB and Fahey TJ
III: Discrimination of benign and malignant thyroid nodules by
molecular profiling. Ann Surg. 240:425–437. 2004. View Article : Google Scholar : PubMed/NCBI
|
|
16
|
Barden CB, Shister KW, Zhu B, Guiter G,
Greenblatt DY, Zeiger MA and Fahey TJ III: Classification of
follicular thyroid tumors by molecular signature: Results of gene
profiling. Clin Cancer Res. 9:1792–1800. 2003.PubMed/NCBI
|
|
17
|
Aldred MA, Huang Y, Liyanarachchi S,
Pellegata NS, Gimm O, Jhiang S, Davuluri RV, de la Chapelle A and
Eng C: Papillary and follicular thyroid carcinomas show distinctly
different microarray expression profiles and can be distinguished
by a minimum of five genes. J Clin Oncol. 22:3531–3539. 2004.
View Article : Google Scholar : PubMed/NCBI
|
|
18
|
de la Chapelle A and Jazdzewski K:
MicroRNAs in thyroid cancer. J Clin Endocrinol Metab. 96:3326–3336.
2011. View Article : Google Scholar : PubMed/NCBI
|
|
19
|
Stokowy T, Wojtaś B, Krajewska J,
Stobiecka E, Dralle H, Musholt T, Hauptmann S, Lange D, Hegedüs L,
Jarząb B, et al: A two miRNA classifier differentiates follicular
thyroid carcinomas from follicular thyroid adenomas. Mol Cell
Endocrinol. 399:43–49. 2015. View Article : Google Scholar : PubMed/NCBI
|
|
20
|
Irizarry RA, Hobbs B, Collin F,
Beazer-Barclay YD, Antonellis KJ, Scherf U and Speed TP:
Exploration, normalization, and summaries of high density
oligonucleotide array probe level data. Biostatistics. 4:249–264.
2003. View Article : Google Scholar : PubMed/NCBI
|
|
21
|
Ak G, Tomaszek SC, Kosari F, Metintas M,
Jett JR, Metintas S, Yildirim H, Dundar E, Dong J, Aubry MC, Wigle
DA and Thomas CF Jr: MicroRNA and mRNA features of malignant
pleural mesothelioma and benign asbestos-related pleural effusion.
Biomed Res Int. 635748:2015.
|
|
22
|
Liu MY, Zhang H, Hu YJ, Chen YW and Zhao
XN: Identification of key genes associated with cervical cancer by
comprehensive analysis of transcriptome microarray and methylation
microarray. Oncol Lett. 12:473–478. 2016.PubMed/NCBI
|
|
23
|
Huang da W, Sherman BT and Lempicki RA:
Systematic and integrative analysis of large gene lists using DAVID
bioinformatics resources. Nat Protoc. 4:44–57. 2009. View Article : Google Scholar : PubMed/NCBI
|
|
24
|
Dweep H, Sticht C, Pandey P and Gretz N:
miRWalk-database: Prediction of possible miRNA binding sites by
‘walking’ the genes of three genomes. J Biomed Inform. 44:839–847.
2011. View Article : Google Scholar : PubMed/NCBI
|
|
25
|
Xiao F, Zuo Z, Cai G, Kang S, Gao X and Li
T: miRecords: An integrated resource for microRNA-target
interactions. Nucleic Acids Res. 37:(Database issue). D105–D110.
2009. View Article : Google Scholar : PubMed/NCBI
|
|
26
|
Liu PF, Jiang WH, Han YT, He LF, Zhang HL
and Ren H: Integrated microRNA-mRNA analysis of pancreatic ductal
adenocarcinoma. Genet Mol Res. 14:10288–10297. 2015. View Article : Google Scholar : PubMed/NCBI
|
|
27
|
Yeung N, Cline MS, Kuchinsky A, Smoot ME
and Bader GD: Exploring biological networks with Cytoscape
software. Curr Protoc Bioinformatics Chapter. 8:Unit 8.13. 2008.
View Article : Google Scholar
|
|
28
|
Stokowy T, Wojtas B, Jarzab B, Krohn K,
Fredman D, Dralle H, Musholt T, Hauptmann S, Lange D, Hegedüs L, et
al: Two-miRNA classifiers differentiate mutation-negative
follicular thyroid carcinomas and follicular thyroid adenomas in
fine needle aspirations with high specificity. Endocrine.
54:440–447. 2016. View Article : Google Scholar : PubMed/NCBI
|
|
29
|
Cerutti JM, Delcelo R, Amadei MJ,
Nakabashi C, Maciel RM, Peterson B, Shoemaker J and Riggins GJ: A
preoperative diagnostic test that distinguishes benign from
malignant thyroid carcinoma based on gene expression. J Clin
Invest. 113:1234–1242. 2004. View
Article : Google Scholar : PubMed/NCBI
|
|
30
|
Umbricht CB, Conrad GT, Clark DP, Westra
WH, Smith DC, Zahurak M, Saji M, Smallridge RC, Goodman S and
Zeiger MA: Human telomerase reverse transcriptase gene expression
and the surgical management of suspicious thyroid tumors. Clin
Cancer Res. 10:5762–5768. 2004. View Article : Google Scholar : PubMed/NCBI
|
|
31
|
Weber F, Shen L, Aldred MA, Morrison CD,
Frilling A, Saji M, Schuppert F, Broelsch CE, Ringel MD and Eng C:
Genetic classification of benign and malignant thyroid follicular
neoplasia based on a three-gene combination. J Clin Endocrinol
Metab. 90:2512–2521. 2005. View Article : Google Scholar : PubMed/NCBI
|
|
32
|
Weber F, Teresi RE, Broelsch CE, Frilling
A and Eng C: A limited set of human MicroRNA is deregulated in
follicular thyroid carcinoma. J Clin Endocrinol Metab.
91:3584–3591. 2006. View Article : Google Scholar : PubMed/NCBI
|
|
33
|
Iorio MV, Ferracin M, Liu CG, Veronese A,
Spizzo R, Sabbioni S, Magri E, Pedriali M, Fabbri M, Campiglio M,
et al: MicroRNA gene expression deregulation in human breast
cancer. Cancer Res. 65:7065–7070. 2005. View Article : Google Scholar : PubMed/NCBI
|
|
34
|
Murakami Y, Yasuda T, Saigo K, Urashima T,
Toyoda H, Okanoue T and Shimotohno K: Comprehensive analysis of
microRNA expression patterns in hepatocellular carcinoma and
non-tumorous tissues. Oncogene. 25:2537–2545. 2006. View Article : Google Scholar : PubMed/NCBI
|
|
35
|
He H, Jazdzewski K, Li W, Liyanarachchi S,
Nagy R, Volinia S, Calin GA, Liu CG, Franssila K, Suster S, et al:
The role of microRNA genes in papillary thyroid carcinoma. Proc
Natl Acad Sci USA. 102:pp. 19075–19080. 2005, View Article : Google Scholar : PubMed/NCBI
|
|
36
|
Fang Y, Xue JL, Shen Q, Chen J and Tian L:
MicroRNA-7 inhibits tumor growth and metastasis by targeting the
phosphoinositide 3-kinase/Akt pathway in hepatocellular carcinoma.
Hepatology. 55:1852–1862. 2012. View Article : Google Scholar : PubMed/NCBI
|
|
37
|
Jiang L, Liu X, Chen Z, Jin Y, Heidbreder
CE, Kolokythas A, Wang A, Dai Y and Zhou X: MicroRNA-7 targets
IGF1R (insulin-like growth factor 1 receptor) in tongue squamous
cell carcinoma cells. Biochem J. 432:199–205. 2010. View Article : Google Scholar : PubMed/NCBI
|
|
38
|
Reddy SD, Ohshiro K, Rayala SK and Kumar
R: MicroRNA-7, a homeobox D10 target, inhibits p21-activated kinase
1 and regulates its functions. Cancer Res. 68:8195–8200. 2008.
View Article : Google Scholar : PubMed/NCBI
|
|
39
|
Fang L, Ellims AH, Moore XL, White DA,
Taylor AJ, Chin-Dusting J and Dart AM: Circulating microRNAs as
biomarkers for diffuse myocardial fibrosis in patients with
hypertrophic cardiomyopathy. J Transl Med. 13:3142015. View Article : Google Scholar : PubMed/NCBI
|
|
40
|
Lopez-Bertoni H, Lal B, Michelson N,
Guerrero-Cázares H, Quiñones-Hinojosa A, Li Y and Laterra J:
Epigenetic modulation of a miR-296-5p:HMGA1 axis regulates Sox2
expression and glioblastoma stem cells. Oncogene. 35:4903–4913.
2016. View Article : Google Scholar : PubMed/NCBI
|
|
41
|
Santarpia L, Calin GA, Adam L, Ye L, Fusco
A, Giunti S, Thaller C, Paladini L, Zhang X, Jimenez C, et al: A
miRNA signature associated with human metastatic medullary thyroid
carcinoma. Endocr Relat Cancer. 20:809–823. 2013. View Article : Google Scholar : PubMed/NCBI
|
|
42
|
Hudson J, Duncavage E, Tamburrino A,
Salerno P, Xi L, Raffeld M, Moley J and Chernock RD: Overexpression
of miR-10a and miR-375 and downregulation of YAP1 in medullary
thyroid carcinoma. Exp Mol Pathol. 95:62–67. 2013. View Article : Google Scholar : PubMed/NCBI
|
|
43
|
Guan H, Liang W, Xie Z, Li H, Liu J, Liu
L, Xiu L and Li Y: Down-regulation of miR-144 promotes thyroid
cancer cell invasion by targeting ZEB1 and ZEB2. Endocrine.
48:566–574. 2015. View Article : Google Scholar : PubMed/NCBI
|
|
44
|
Shomron N: MicroRNAs and pharmacogenomics.
Pharmacogenomics. 11:629–632. 2010. View Article : Google Scholar : PubMed/NCBI
|
|
45
|
Xia T, Liao Q, Jiang X, Shao Y, Xiao B, Xi
Y and Guo J: Long noncoding RNA associated-competing endogenous
RNAs in gastric cancer. Sci Rep. 4:60882014. View Article : Google Scholar : PubMed/NCBI
|
|
46
|
Zhang HD, Jiang LH, Sun DW, Li J and Tang
JH: MiR-139-5p: Promising biomarker for cancer. Tumour Biol.
36:1355–1365. 2015. View Article : Google Scholar : PubMed/NCBI
|
|
47
|
Kent OA, McCall MN, Cornish TC and
Halushka MK: Lessons from miR-143/145: The importance of cell-type
localization of miRNAs. Nucleic Acids Res. 42:7528–7538. 2014.
View Article : Google Scholar : PubMed/NCBI
|
|
48
|
Kobayashi K, Imazu Y, Kawabata M and
Shohmori T: Effect of long-term storage on monoamine metabolite
levels in human cerebrospinal fluid. Acta Med Okayama. 41:179–181.
1987.PubMed/NCBI
|
|
49
|
Jia X, Li N, Peng C, Deng Y, Wang J, Deng
M, Lu M, Yin J, Zheng G, Liu H and He Z: miR-493 mediated DKK1
down-regulation confers proliferation, invasion and
chemo-resistance in gastric cancer cells. Oncotarget. 7:7044–7054.
2016. View Article : Google Scholar : PubMed/NCBI
|
|
50
|
Tommerup N and Vissing H: Isolation and
fine mapping of 16 novel human zinc finger-encoding cDNAs identify
putative candidate genes for developmental and malignant disorders.
Genomics. 27:259–264. 1995. View Article : Google Scholar : PubMed/NCBI
|
|
51
|
de Celis JF and Barrio R: Regulation and
function of Spalt proteins during animal development. Int J Dev
Biol. 53:1385–1398. 2009. View Article : Google Scholar : PubMed/NCBI
|
|
52
|
May CD, Sphyris N, Evans KW, Werden SJ,
Guo W and Mani SA: Epithelial-mesenchymal transition and cancer
stem cells: A dangerously dynamic duo in breast cancer progression.
Breast Cancer Res. 13:2022011. View Article : Google Scholar : PubMed/NCBI
|
|
53
|
Link LA, Howley BV, Hussey GS and Howe PH:
PCBP1/HNRNP E1 protects chromosomal integrity by translational
regulation of CDC27. Mol Cancer Res. 14:634–646. 2016. View Article : Google Scholar : PubMed/NCBI
|
|
54
|
Thornton BR, Ng TM, Matyskiela ME, Carroll
CW, Morgan DO and Toczyski DP: An architectural map of the
anaphase-promoting complex. Genes Dev. 20:449–460. 2006. View Article : Google Scholar : PubMed/NCBI
|
|
55
|
Lee SJ and Langhans SA: Anaphase-promoting
complex/cyclosome protein Cdc27 is a target for curcumin-induced
cell cycle arrest and apoptosis. BMC Cancer. 12:442012. View Article : Google Scholar : PubMed/NCBI
|
|
56
|
Browning BL and Browning SR: Haplotypic
analysis of wellcome trust case control consortium data. Hum Genet.
123:273–280. 2008. View Article : Google Scholar : PubMed/NCBI
|
|
57
|
Huggins GS, Bacani CJ, Boltax J, Aikawa R
and Leiden JM: Friend of GATA 2 physically interacts with chicken
ovalbumin upstream promoter-TF2 (COUP-TF2) and COUP-TF3 and
represses COUP-TF2-dependent activation of the atrial natriuretic
factor promoter. J Biol Chem. 276:28029–28036. 2001. View Article : Google Scholar : PubMed/NCBI
|
|
58
|
Song HM, Luo Y, Li DF, Wei CK, Hua KY,
Song JL, Xu H, Maskey N and Fang L: MicroRNA-96 plays an oncogenic
role by targeting FOXO1 and regulating AKT/FOXO1/Bim pathway in
papillary thyroid carcinoma cells. Int J Clin Exp Pathol.
8:9889–9900. 2015.PubMed/NCBI
|
|
59
|
Chruścik A and Lam AK: Clinical
pathological impacts of microRNAs in papillary thyroid carcinoma: A
crucial review. Exp Mol Pathol. 99:393–398. 2015. View Article : Google Scholar : PubMed/NCBI
|
|
60
|
Nicholson KM and Anderson NG: The protein
kinase B/Akt signalling pathway in human malignancy. Cell Signal.
14:381–395. 2002. View Article : Google Scholar : PubMed/NCBI
|
|
61
|
Xue G and Hemmings BA: PKB/Akt-dependent
regulation of cell motility. J Natl Cancer Inst. 105:393–404. 2013.
View Article : Google Scholar : PubMed/NCBI
|
|
62
|
Osaki M, Oshimura M and Ito H: PI3K-Akt
pathway: Its functions and alterations in human cancer. Apoptosis.
9:667–676. 2004. View Article : Google Scholar : PubMed/NCBI
|
|
63
|
Manzella L, Stella S, Pennisi MS, Tirrò E,
Massimino M, Romano C, Puma A, Tavarelli M and Vigneri P: New
insights in thyroid cancer and p53 family proteins. Int J Mol Sci.
18:pii: E1325. 2017. View Article : Google Scholar : PubMed/NCBI
|
|
64
|
Zhu X, Zhao L, Park JW, Willingham MC and
Cheng SY: Synergistic signaling of KRAS and thyroid hormone
receptor β mutants promotes undifferentiated thyroid cancer through
MYC up-regulation. Neoplasia. 16:757–769. 2014. View Article : Google Scholar : PubMed/NCBI
|
|
65
|
Kataki A, Sotirianakos S, Memos N,
Karayiannis M, Messaris E, Leandros E, Manouras A and Androulakis
G: P53 and C-FOS overexpression in patients with thyroid cancer: An
immunohistochemical study. Neoplasma. 50:26–30. 2003.PubMed/NCBI
|
|
66
|
Aliyev A, Soundararajan S, Bucak E, Gupta
M, Hatipoglu B, Nasr C, Siperstein A and Berber E: The utility of
peripheral thyrotropin receptor mRNA in the management of
differentiated thyroid cancer. Surgery. 158:1089–1094. 2015.
View Article : Google Scholar : PubMed/NCBI
|
|
67
|
Huang FJ, Zhou XY, Ye L, Fei XC, Wang S,
Wang W and Ning G: Follicular thyroid carcinoma but not adenoma
recruits tumor-associated macrophages by releasing CCL15. BMC
Cancer. 16:982016. View Article : Google Scholar : PubMed/NCBI
|