Introduction
Lung cancer, a malignant tumor, is a common disease
with high mortality in China (1). It
has been reported that lung cancer is the leading cause of cancer
mortality in men aged ≥40 years (2,3). Surgery,
chemotherapy and radiotherapy are the primary treatment methods for
lung cancer. However, the efficacy of chemotherapy and radiotherapy
is limited due to drug resistance, and surgical operation is
restricted as a result of local anatomical limitations. The
five-year survival rate of lung cancer patients is ~15% following
primary diagnosis (4).
The development of lung cancer may involve the
inactivation of tumor suppressor genes, the overexpression of
oncogenes or the deregulation of various signaling proteins. Liu
et al (5) has suggested that
differentially expressed microRNAs in lung cancer compared with the
adjacent normal lung tissues may serve tumor suppressive or
oncogenic roles. Investigating the alterations in gene expression
during tumorigenesis has been demonstrated to serve an important
role in the diagnosis of patients with lung cancer, predicting
patient survival in early-stage lung adenocarcinomas, and serve as
guides for targeted therapies (6,7).
Therefore, characterizing the differential expression of functional
genes, particularly the known cancer-associated genes, is of great
importance, and may provide potential gene-targeted therapies.
Differentially expressed genes (DEGs), identified by
the comparison of the gene expression profiles of lung cancer
samples with healthy controls, may present a large volume of
information for gene-targeted therapies. A previous study performed
a microarray analysis to identify the DEGs contributing to
radio-resistance in lung cancer cells (8). Another study identified that the network
analysis of DEGs revealed key genes in small cell lung cancer
(9). The present study aimed to
combine the comparative analysis of DEGs between lung cancer and
normal tissue with network analysis in the development of lung
cancer, to promote the understanding about this disease and to also
identify potential targets for diagnostic and therapeutic
usage.
In the present study, firstly, an analysis of DEGs
in lung cancer tissues was performed, then the protein interaction
and transcriptional regulatory networks were identified and
analyzed to provide additional insights into the pathogenic
mechanism of lung cancer. Pituitary tumor-transforming gene-1
(PTTG1) and matrix metalloproteinase-9 (MMP9) were hypothesized to
serve major roles in the development of lung cancer. Secondly,
reverse transcription-quantitative polymerase chain reaction
(RT-qPCR) and western blotting were performed to verify the
expression of these two genes in lung cancer tissues. Finally, the
effect of the PTTG1or MMP9 overexpression on migration,
proliferation, colony formation and apoptosis in the human
bronchial epithelial BEAS-2Bcell line was examined.
Materials and methods
Microarray data
Microarray data setsGSE3268 and GSE19804 were
downloaded from Gene Expression Omnibus (GEO; https://www.ncbi.nlm.nih.gov/geo/). GSE3268
contains 10 samples, including 5 squamous lung cancer and 5 healthy
controls. The annotation information of chip was downloaded from
Affymetrix Human Genome U133A Array (http://www.affymetrix.com/support/technical/manual/expression_manual.affx)
(10). GSE19804 contains 120 samples,
including 60 lung cancer and 60 healthy controls. The annotation
information of chip was downloaded from Affymetrix Human Genome
U133 Plus 2.0 Array (http://www.affymetrix.com/support/technical/manual/expression_manual.affx)
(11).
Differential expression analysis
The probe number of the series matrix data was
changed to ‘gene name’. A gene corresponding to a plurality of
probes was taken as the expression average value. As the data was
from different platforms, the same data in the two expression
profiles was combined. For the combination of two expression
profiles, batch error was removed and the datasets were
standardized. Then, an expression profile containing 8,172 genes
was obtained. The analysis of difference expression was taken by
using the Limma package from the Bioconductor project (http://www.bioconductor.org;version 2.7.1) (12). |logFC|>1 and FDR<0.05 were set
as the cut-offs to screen out the differentially expressed genes
(DEGs) of the lung cancer-associated genes.
Protein interaction networks and
transcriptional regulatory networks
The differentially expressed proteins were analyzed
using the Search Tool for the Retrieval of Interacting Genes
(STRING) database (https://string-db.org/) to derive protein interaction
networks and predict hub proteins (13). The networks between the differentially
expressed gene and transcription factors (TFs) in the present study
were constructed by using the association between TFs and target
genes, which was predicted by University of California Santa Cruz
Genome Browser (14).
Patients
A total of 20 patients with lung cancer (with a mean
age of 65±3 years;12 male and 8 female) were enrolled from Peking
Union Medical College Hospital (Beijing, China) between December
2013 and January 2015. The diagnosis of lung cancer was established
using World Health Organization (WHO) morphological criteria
(15). Cancerous sample and adjacent
non-cancerous lung tissue samples (control) were collected during
surgery. Surgically removed samples were stored in liquid nitrogen
until use. Written informed consent was obtained from all patients
participating in the present study. The present study was approved
by the Ethics Committee of Peking Union Medical College
Hospital.
Cell and culture
The human bronchial epithelial BEAS-2Bcell line was
purchased from the American Type Culture Collection (Manassas, MA,
USA). The BEAS-2B cells were cultured in bronchial epithelial cell
growth medium (BEGM; Lonza Group, Ltd., Basel, Switzerland) and
incubated at 37°C in 5% CO2 as previously described
(16).
Plasmid construction and
transfection
The DNA fragments of PTTG1 and MMP9 were synthesized
by Takara Bio, Inc. (Otsu, Japan). The plasmid pcDNA3.1/V5-His was
used to construct expression plasmid pcDNA3.1/V5-His-PTTG1and
pcDNA3.1/V5-His-MMP9. For the plasmids transfection experiments,
BEAS-2Bcells were transfected with pcDNA3.1/V5-His-PTTG1,
pcDNA3.1/V5-His-MMP9 and pcDNA3.1/V5-His empty vectors mixed in
Lipofectamine® 2000 (Invitrogen; Thermo Fisher
Scientific, Inc., Waltham, MA, USA) according to the manufacturer's
protocol. Transfection efficiency was evaluated by the percentage
of green fluorescent protein-positive cells.
RT-qPCR
Total RNA was isolated from lung cancer and healthy
lung tissues using TRIzol reagent (Invitrogen; Thermo Fisher
Scientific, Inc.). cDNA was prepared by reverse transcription of
single-stranded RNA using the High Capacity cDNA Reverse
Transcription kit (Applied Biosystems; Thermo Fisher Scientific,
Inc.), according to the manufacturer's instructions. Briefly, 1 or
2 µg of mRNA, 2 µl of RT buffer, 0.8 µl of dNTP mixture, 2 µl of RT
random primers, 1 µl of Multi-Scribe reverse transcriptase, and 4.2
µl of nuclease-free water were used for each cDNA synthesis. After
the reverse transcription, cDNA was stored at −20°C. Reactions were
incubated in a PCR thermocycler at 25°C for 10 min, 37°C for 120
min, and 85°C for 5 min and then cooled to 4°C. RT-qPCR was carried
out using the SYBR® Premix Ex Taq™ kit
(Takara Bio, Inc., Otsu, Japan), according to the manufacturer's
instructions. The 20 ml reaction mix consisted of 2 ml30-fold
diluted 1st-strand cDNA, 10 ml 2X SYBR® Premix Ex
Taq™, 0.4 ml 10 mM forward and reverse primer, 0.4 ml
50X ROX Reference Dye and 6.8 ml DEPC-treated water. The primer
pairs used in these reactions were as follows: PTTG1forward,
5′-TGATCCTTGACGAGGAGAGAG-3′ and reverse,
5′-GGTGGCAATTCAACATCCAGG-3′; MMP9, forward,
5′-GGGCCGCTCCTACTCTGCCT-3′ and reverse, 5′-TCGAGTCAGCTCGGGTCGGG-3′;
GAPDH, forward, 5′-GAAGGTGAAGGTCGGAGTC-3′ and reverse,
5′-GAAGATGGTGATGGGATTC-3′. Reactions were performed in an ABI7300
Real-Time quantitative instrument (Applied Biosystems; Thermo
Fisher Scientific, Inc.). The thermocycling conditions were as
follows: Initial denaturation at 95°C for 30 sec, followed by 40
cycles of 95°C for 5 sec and 60°C for 31 sec. The expression level
of the internal control gene GAPDH, was used as a housekeeping
gene, and the comparative 2−ΔΔCq method (17) was used to quantify gene expression
levels. All experiments were performed in triplicate.
Western blot analysis
Protein was collected from lung cancer tissues and
normal tissues that were lysed in radioimmunoprecipitation assay
(RIPA) buffer containing protease inhibitors at 4°C for 30 min.
Cell lysates were prepared with a RIPA lysis buffer kit (Santa Cruz
Biotechnology, Inc., Dallas, TX, USA), and the protein
concentrations were quantified using a Bio-Rad protein assay using
the Bradford method (Bio-Rad Laboratories, Inc., Hercules, CA,
USA). Proteins (30 µg per lane) were separated on 8% SDS-PAGE and
transferred to polyvinylidene difluoride membranes (Amersham; GE
Healthcare, Chicago, IL, USA). The membranes were blocked in 5%
non-fat milk overnight at 4°C. Transferred membranes were then
stained with the following primary antibodies: anti-PTTG1 (1:500;
cat. no. 341500; Invitrogen; Thermo Fisher Scientific, Inc.),
anti-MMP9 (1:500; cat. no. ab76003; Abcam, Cambridge, MA, USA) and
anti-GAPDH (1:500; cat. no. ab8245; Santa Cruz Biotechnology, Inc.)
overnight at 4°C. Subsequently, protein bands were detected by
incubation with a horseradish peroxidase-conjugated secondary
antibody (1:1,000; Origene Technologies, Inc., Beijing, China; cat.
no. A50-106P) at room temperature for 1 h. Signals were detected
using an enhanced chemiluminescence kit (Wuhan Boster Biological
Technology Co., Ltd., Wuhan, China; cat. no. orb90504) and exposed
to Kodak X-OMAT film (Kodak, Rochester, NY, USA). Each experiment
was performed at least three times and the results were analyzed
using Alpha View Analysis Tools [AlphaView (SA) software version
3.2.2; Protein Simple, San Jose, CA, USA].
Transwell assay
BEAS-2B cells with pcDNA3.1/V5-His-PTTG1,
pcDNA3.1/V5-His-MMP9 and pcDNA3.1/V5-His empty vectors were
serum-starved overnight and resuspended in serum-free medium. A
total of 300 µl cell suspension was placed in the upper Transwell
insert with Matrigel (BD Biosciences, Franklin Lakes, NJ, USA). The
chambers were placed in 24-well plates and cultured in 700 µl BEGM
medium with 25% fetal bovine serum (Gibco; Thermo Fisher
Scientific, Inc.) to allow the cells to migrate through the porous
membrane for 24 h at 37°C. The cells adhered to the lower surface
were fixed with 100% methanol for 20 min at room temperature and
stained with 5% Giemsa solution (Merck & Co., Inc., Whitehouse
Station, NJ, USA) for 20 min at room temperature. The total number
of cells on the lower surface of the membrane was counted by light
microscopy using five random fields (BX50; Olympus Corporation,
Tokyo, Japan; magnification, ×100).
Cell proliferation assay
Cell proliferation was assessed by a CCK-8 kit
(Wuhan Boster Biological Technology, Ltd., Wuhan, China). Briefly,
the WST-8 was added to the culture medium, and the cultures were
incubated for 1 h at 37°C in 5% CO2. The absorbance was
measured at 450 nm using a Microplate Reader (Bio-Rad Laboratories,
Inc., Hercules, CA, USA).
Colony formation assay
Tumor cells were seeded at a density of 300 cells/ml
on35-mm dishes. The colony formation assay was performed as
previously described (18).
Apoptosis assay
An Annexin V-fluorescein isothiocyanate (FITC)
staining assay (Invitrogen; Thermo Fisher Scientific, Inc.) was
performed according to the protocol of the manufacturer to quantify
cell apoptosis. Briefly, the cells were harvested and stained with
3 µl Annexin V-FITC (25 µg/ml) and 5 µl propidium iodide (50 µg/ml)
for 20 min at 37°C. Then, the cells were washed twice with PBS, and
the fluorescence was analyzed using a FACSCalibur flow cytometry
system (BD Biosciences).
Statistical analysis
The unpaired t-test was used for comparisons between
two groups. A one-way analysis of variance followed by a Tukey's
test was used to compare multiple groups. The software SPSS 13.0
(SPSS, Inc., Chicago, IL, USA) was used to analyze all these data.
*P<0.05, **P<0.01 and ***P<0.001 vs. control. The data
were expressed as mean ± standard error of the mean.
Results
Selection of DEGs
The same data in GSE3268 and GSE19804was combined.
For the combination of the two expression profiles, batch error was
removed and the datasets were standardized. Then, the differential
expression of the genes was analyzed using Limma package. Following
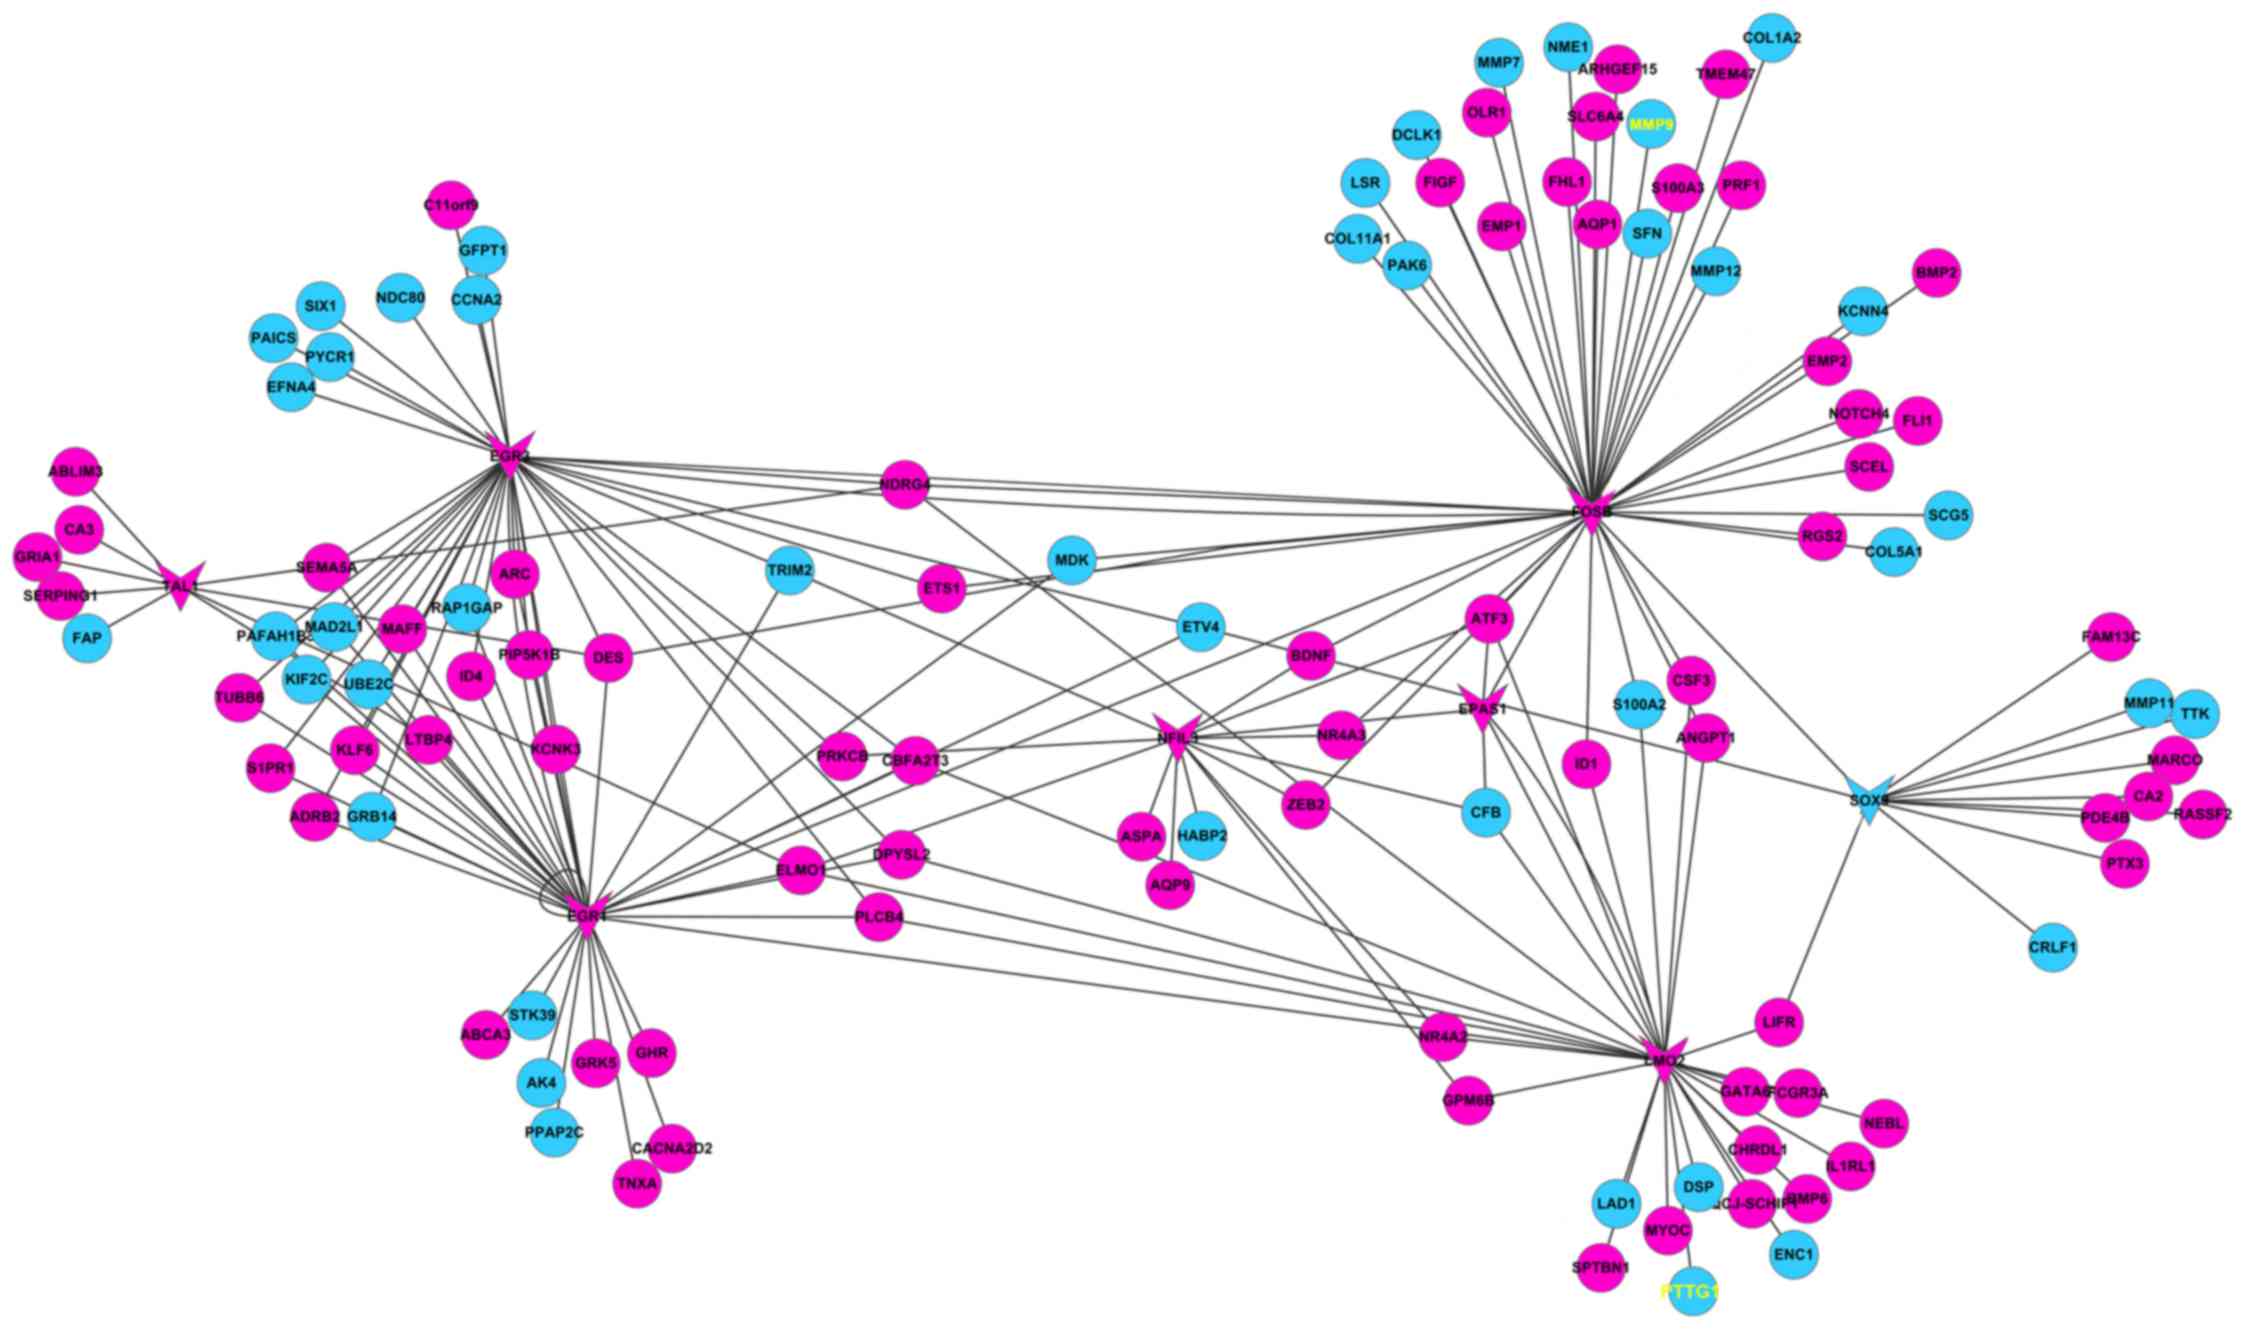
calculation of the data using the standardized approach, a total of
466 difference expression genes were screened, including 310
downregulated genes (Fig. 1, blue
circles) and 156 upregulated genes (Fig.
1, pink circles).
Constructing the protein interaction
networks
Protein interaction networks corresponding with the
DEGs were constructed using the STRING online tools. The results
demonstrated that the degree of certain nodes was markedly higher
compared with the average degree in the networks (Fig. 1). The genes with significantly higher
degrees were PTTG1 and MMP9 (yellow font).
Constructing the transcription factor
regulatory networks
Then, transcription factor regulatory networks were
constructed subsequent to select the transcription factors of the
DEGs (Fig. 2). The results
demonstrated that PTTG1 appeared to be regulated by LMO2, a
molecule associated with cancer cell growth and differentiation
(19,20). In addition, MMP9 was predicted to be
regulated by FBJ murine osteosarcoma viral oncogene homolog B, a
tumorigenesis-associated protein (21,22). Taken
together, PTTG1 and MMP9 appear to be potential key genes in the
onset and development of lung cancer.
PTTG1 and MMP9 are upregulated in lung
cancer tissues
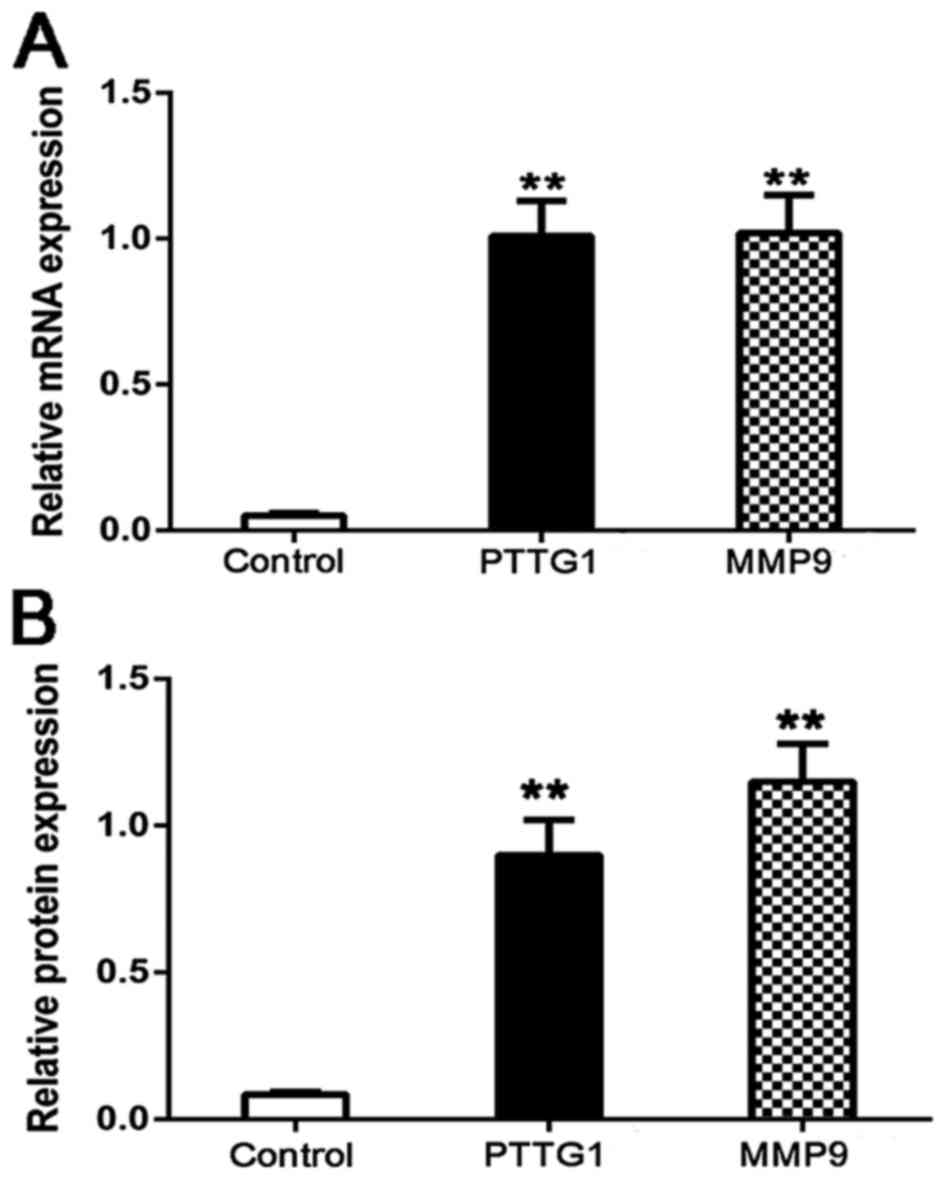
To determine the role of PTTG1 and MMP9 in lung
cancer, firstly, the mRNA and protein expression of PTTG1 and MMP9
in 20 patients with lung cancer and 10 healthy lung tissues were
detected by RT-qPCR and western blot. The results indicated that
the mRNA level expressions of PTTG1 and MMP9 were significantly
upregulated compared with the control (P<0.01; Fig. 3A). Similarly, the protein level
expression of PTTG1 and MMP9 were significantly increased compared
with the control (P<0.01; Fig.
3B). These investigations were consistent with analysis of
networks (Figs. 1 and 2).
PTTG1 and MMP9 facilitate migration
and proliferation, increase colony formation and suppress apoptosis
in BEAS-2B cells
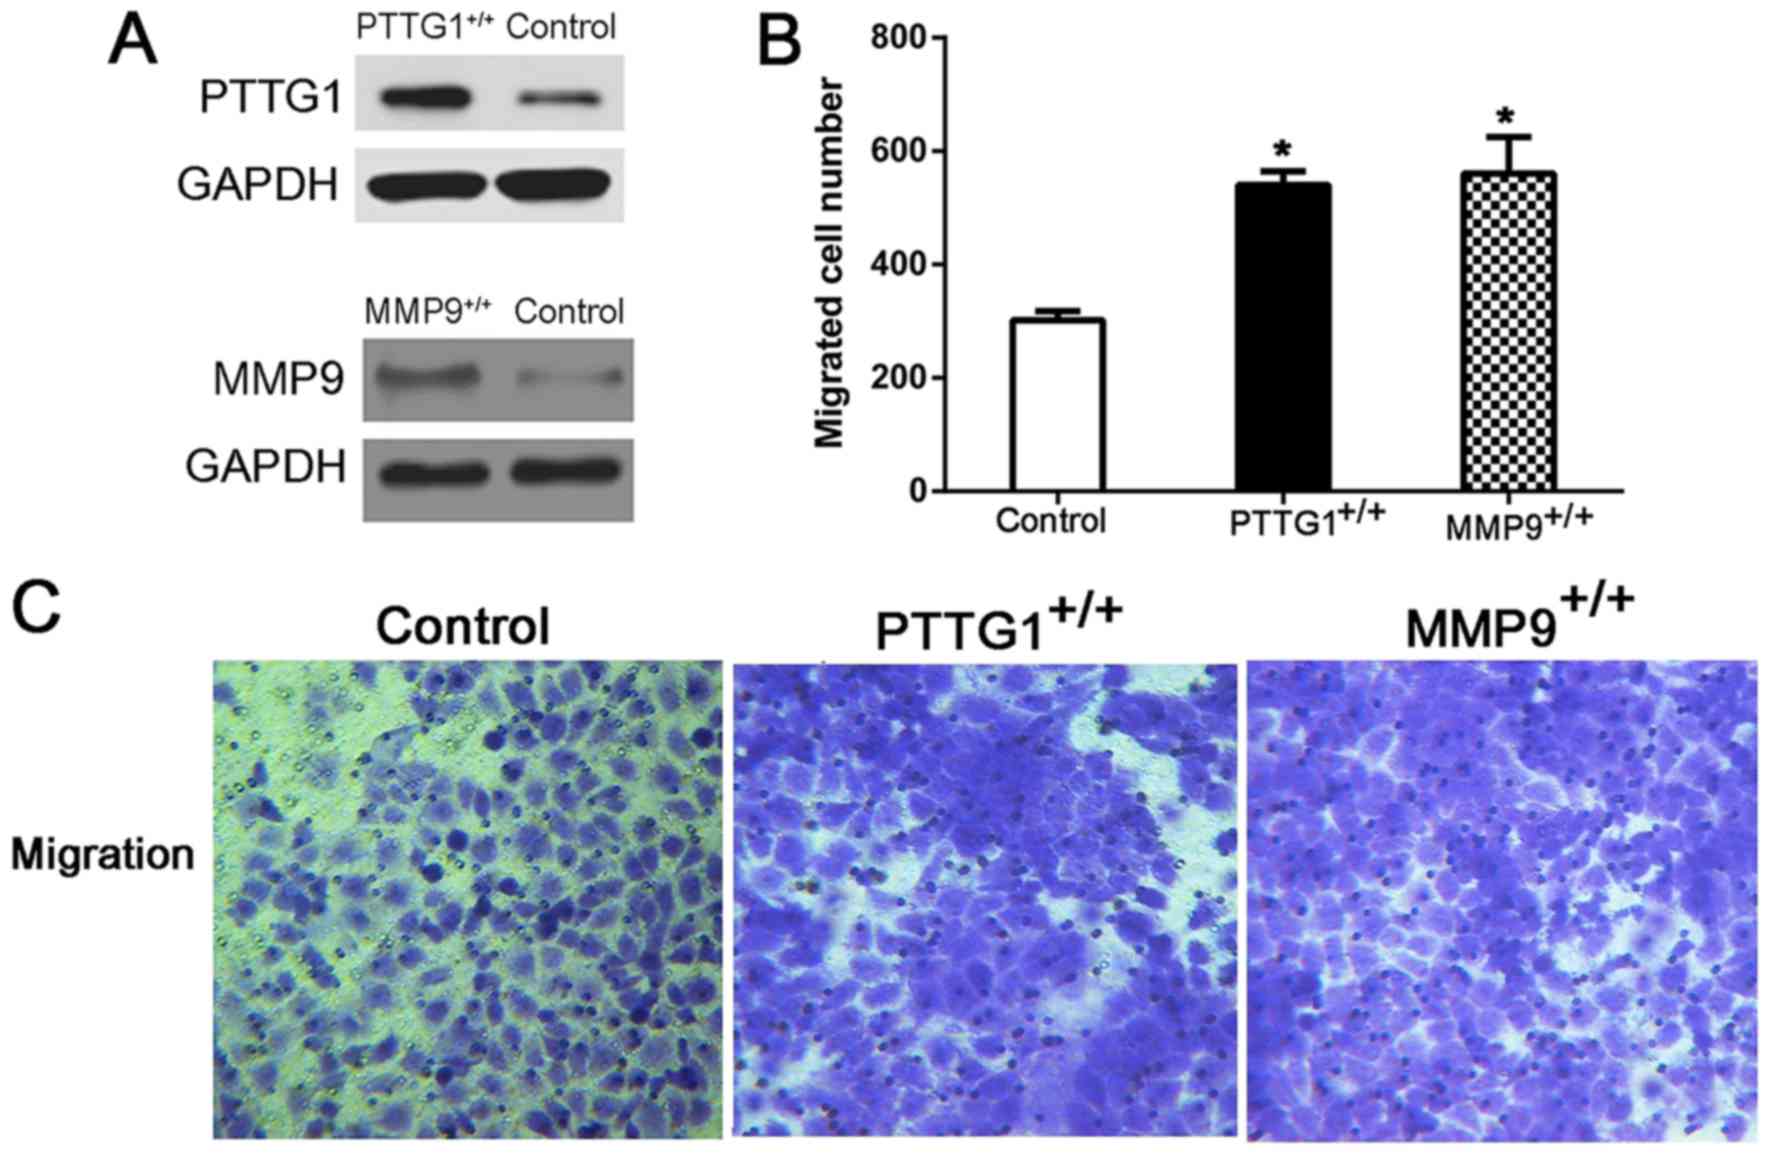
As cancer cell migration, proliferation, colony
formation and apoptosis are closely associated with tumorigenesis
(23), BEAS-2B cells with
pcDNA3.1/V5-His-PTTG1 and pcDNA3.1/V5-His-MMP9 were successful
constructed to explore the role of PTTG1 and MMP9 in lung cancer
tumorigenesis (Fig. 4A). Firstly, the
Transwell assay demonstrated that the overexpression of PTTG1
(PTTG1+/+) or MMP9 (MMP9+/+) significantly
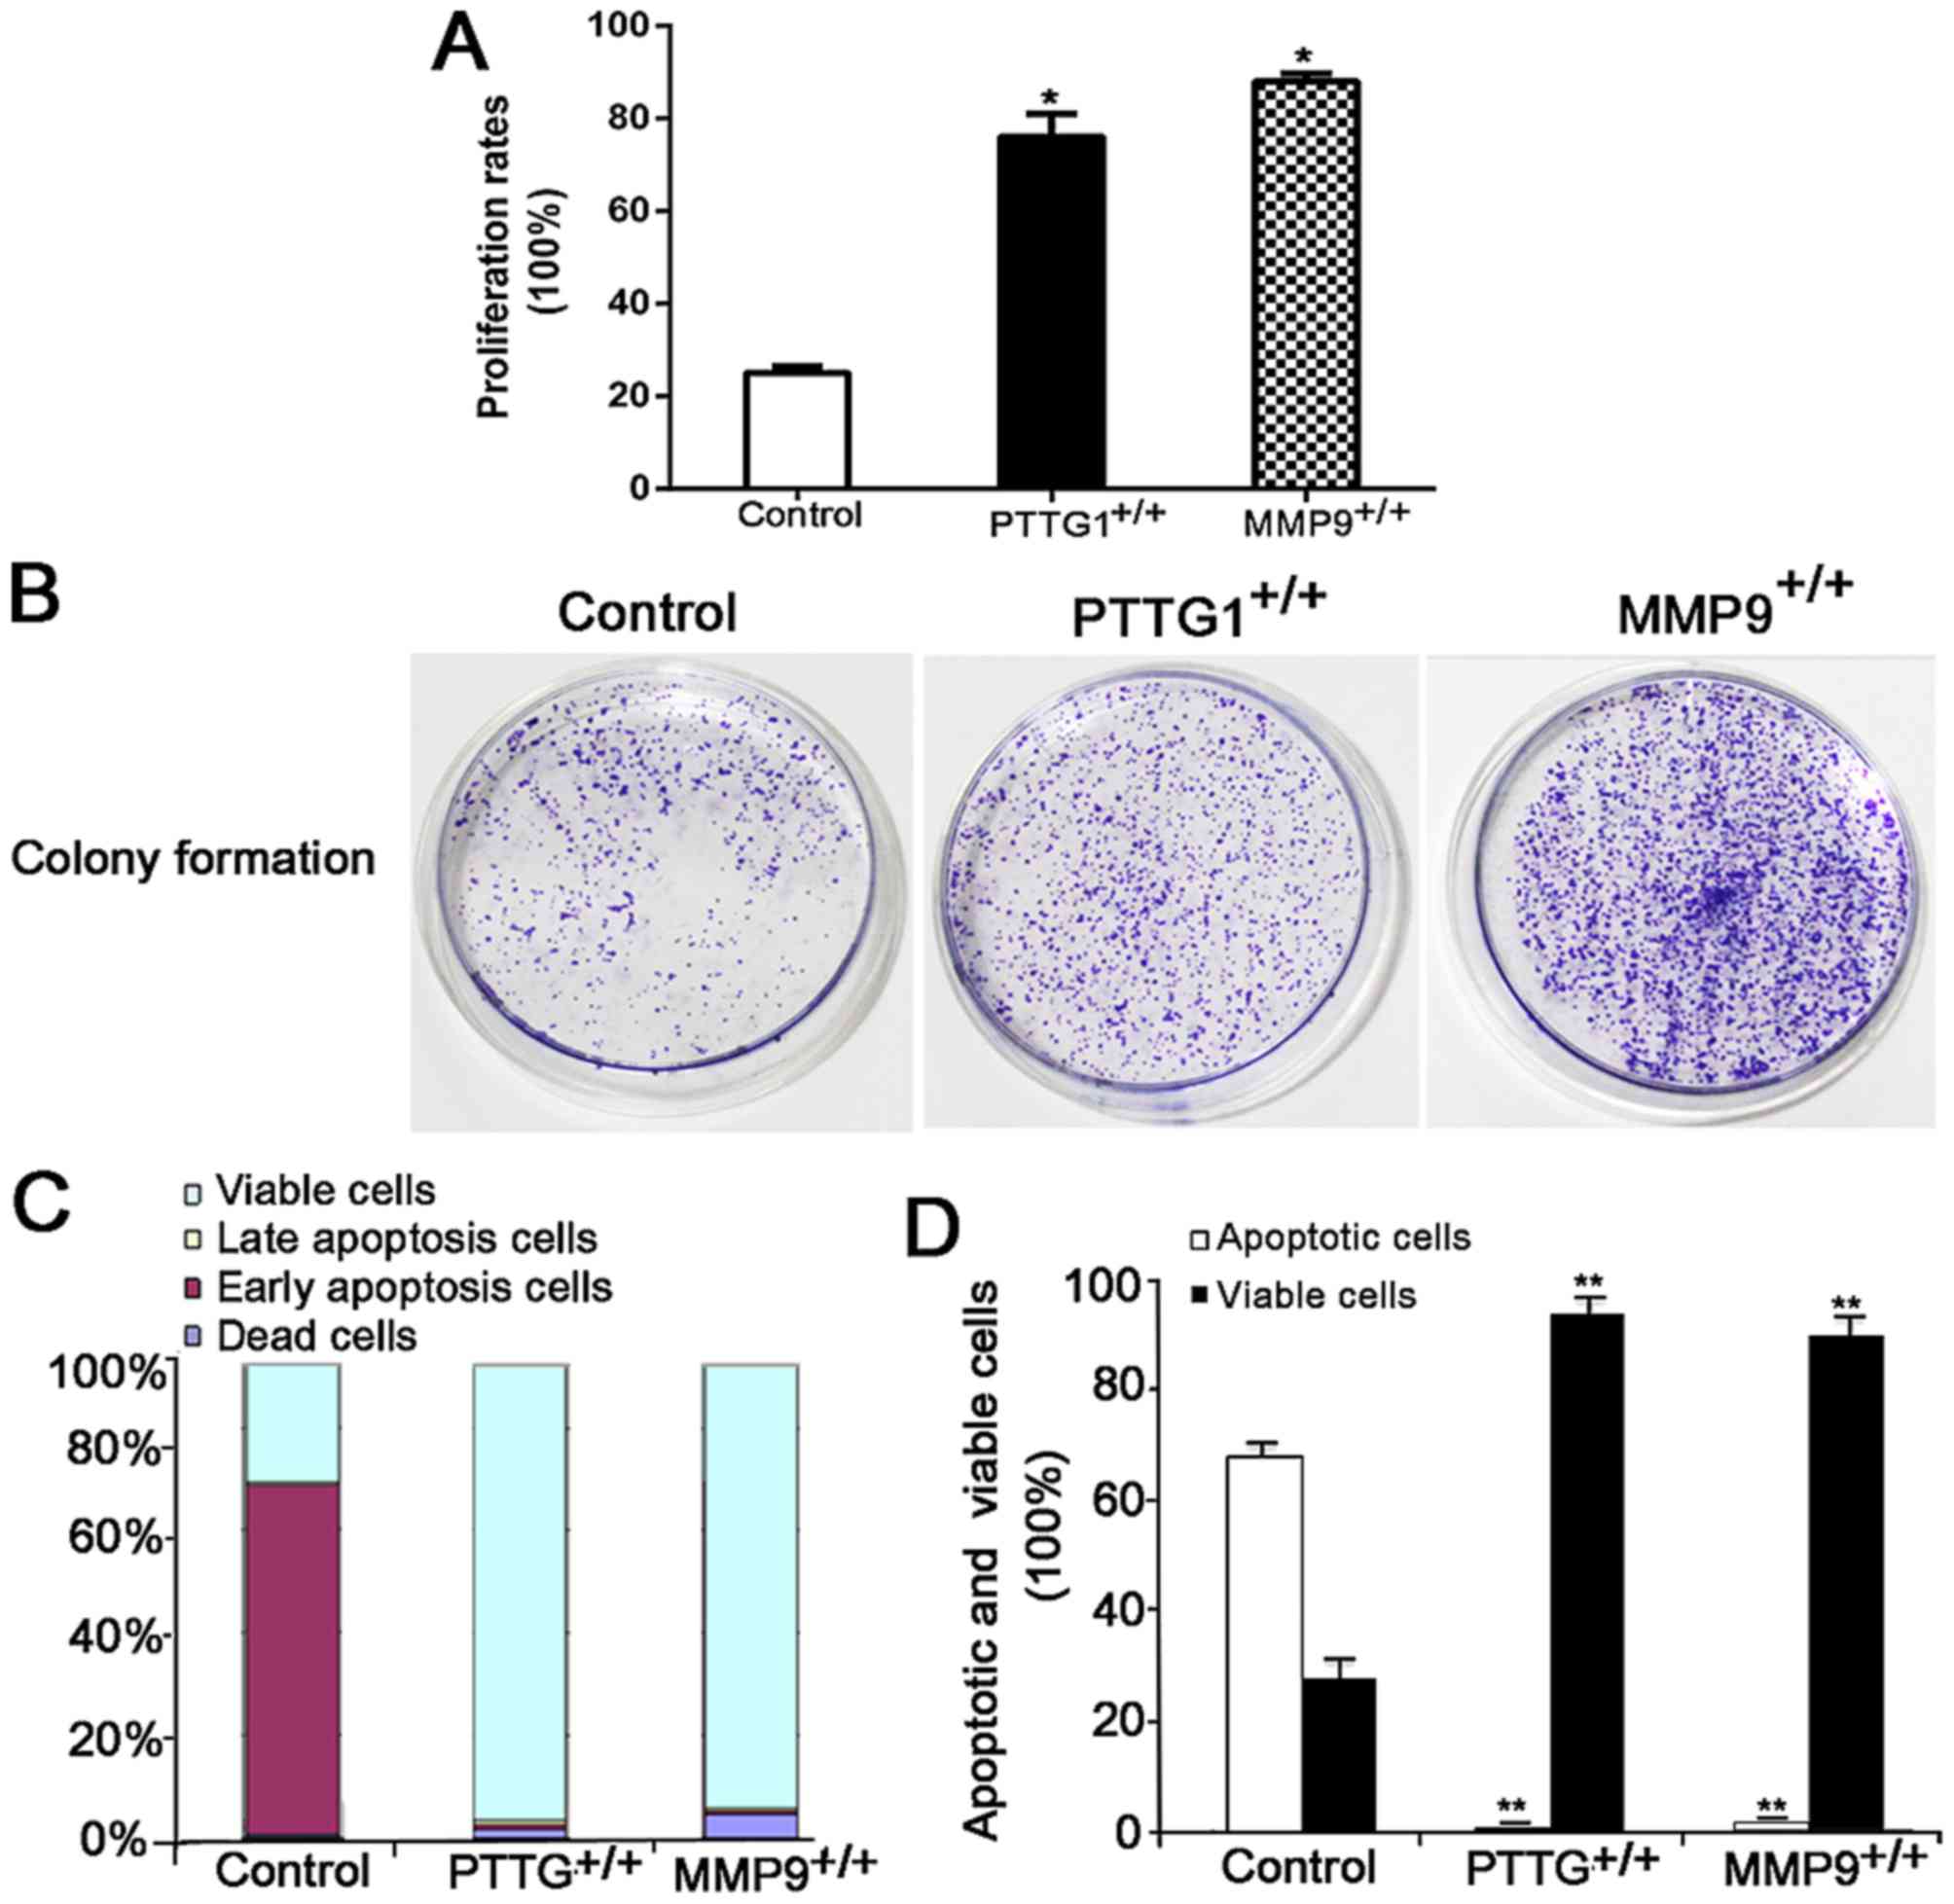
increased the migration of BEAS-2B cells (both P<0.05; Fig. 4B and C). Then, the results of CCK-8
assay indicated that the overexpression of PTTG1 or MMP9
significantly increased the proliferation ability of BEAS-2B cells
(both P<0.05; Fig. 5A). PTTG1 or
MMP9 markedly induced colony formation ability compared with the
control (Fig. 5B). Finally, the
results of apoptosis assay suggested that the overexpression of
PTTG1or MMP9 significantly suppressed the apoptosis of BEAS-2B
cells (Fig. 5C and D). In summary,
PTTG1 and MMP9 may facilitate the migration and proliferation,
induce colony formation and suppress apoptosis of BEAS-2B cells,
suggesting the vital roles of PTTG1 and MMP9 in promoting lung
cancer development.
Discussion
Lung cancer is a common disease with high mortality
in China (1). It is fatal, and
possesses a varied epidemiology on the basis of sex, geographical
regions and age (3). In the present
study, DEGs associated with the biogenesis of lung cancer were
screened. Then, the protein interaction and transcriptional
regulatory networks of lung cancer were analyzed. PTTG1 and MMP9
genes were hypothesized to serve major roles in the development of
lung cancer based on the network analysis. Additional analysis was
performed to improve the understanding of the biological
implications of these two genes, and the results demonstrated that
the tumorigenic roles of PTTG1 and MMP9 were to promote migration
and proliferation, induce colony formation and suppress
apoptosis.
PTTG1 was primarily isolated from rat pituitary
tumor cells (24). Subsequently,
PTTG1, a vertebrate securin, was identified to exert its effects on
cell cycle control, cell replication, organ development,
metabolism, DNA damage/repair, cell transformation and cell
senescence (25,26). Notably, PTTG1 is highly expressed in a
variety of organs, including colon, pituitary, thyroid, breast,
ovary, uterine and esophagus, particularly in the lungs (27–33).
Consistent with the present study, PTTG1 has been indicated to be a
key signature gene associated with tumor metastasis (25,34–36). The
mechanism is complex: PTTG1 exhibits the ability to activate c-Myc
and cyclin D3, increase basic fibroblast growth factor, vascular
endothelial growth factor and matrix metalloproteinase 2 expression
to induce angiogenesis, and also induce interleukin-8 to function
in metastasis (25,34–36). PTTG1
may also interact with transcription factors including tumor
protein 53, transcription factor Sp1 and upstream stimulatory
factor 1, which were reported to be involved in tumorigenesis and
cancer development (34,37,38).
MMP-9 (also known as gelatinase-B), a 92-kDa
gelatinase, catalyzes type IV collagen in the basal membrane and is
considered as a key enzyme (39). It
serves an important role in regulating tumor cell behaviors,
including growth, differentiation, apoptosis, migration, invasion,
tumor angiogenesis, and immune surveillance (40,41). The
expression of MMP-9 was reported to be significantly higher in
non-small cell lung cancer and small cell lung cancer compared with
normal tissues, and also associated with pathological type and
prognosis (42). The underlying
mechanism of the carcinogenic role of MMP-9 is also complex and
requires additional precise investigation (43,44).
Overall, the present study demonstrated that PTTG1
and MMP9 were key signature genes associated with tumorigenesis.
Mechanically, increased PTTG1 or MMP9 may facilitate cell migration
and proliferation, induce colony formation and suppress cell
apoptosis. The present study also suggested that PTTG and MMP9 may
serve as important target genes for the treatment of lung cancer.
The molecular mechanism by which PTTG and MMP9 mediates their
tumorigenic function in this study remain intricate.
References
|
1
|
Zhou LF, Zhang MX, Kong LQ, Lyman GH, Wang
K, Lu W, Feng QM, Wei B and Zhao LP: Costs, trends and related
factors in treating lung cancer patients in 67 hospitals in
Guangxi, China. Cancer Invest. 35:345–357. 2017. View Article : Google Scholar : PubMed/NCBI
|
|
2
|
Siegel R, Ma J, Zou Z and Jemal A: Cancer
statistics, 2014. CA Cancer J Clin. 64:9–29. 2014. View Article : Google Scholar : PubMed/NCBI
|
|
3
|
Sachdeva M, Sachdeva N, Pal M, Gupta N,
Khan IA, Majumdar M and Tiwari A: CRISPR/Cas9: Molecular tool for
gene therapy to target genome and epigenome in the treatment of
lung cancer. Cancer Gene Ther. 22:509–517. 2015. View Article : Google Scholar : PubMed/NCBI
|
|
4
|
Reddy C, Chilla D and Boltax J: Lung
cancer screening: A review of available data and current
guidelines. Hosp Pract (1995). 39:107–112. 2011. View Article : Google Scholar : PubMed/NCBI
|
|
5
|
Liu X, Sempere LF, Guo Y, Korc M,
Kauppinen S, Freemantle SJ and Dmitrovsky E: Involvement of
MicroRNAs in lung cancer biology and therapy. Transl Res.
157:200–208. 2011. View Article : Google Scholar : PubMed/NCBI
|
|
6
|
Bhattacharjee A, Richards WG, Staunton J,
Li C, Monti S, Vasa P, Ladd C, Beheshti J, Bueno R, Gillette M, et
al: Classification of human lung carcinomas by mRNA expression
profiling reveals distinct adenocarcinoma subclasses. Proc Natl
Acad Sci USA. 98:pp. 13790–13795. 2001; View Article : Google Scholar : PubMed/NCBI
|
|
7
|
Beer DG, Kardia SL, Huang CC, Giordano TJ,
Levin AM, Misek DE, Lin L, Chen G, Gharib TG, Thomas DG, et al:
Gene-expression profiles predict survival of patients with lung
adenocarcinoma. Nat Med. 8:816–824. 2002. View Article : Google Scholar : PubMed/NCBI
|
|
8
|
Guo WF, Lin RX, Huang J, Zhou Z, Yang J,
Guo GZ and Wang SQ: Identification of differentially expressed
genes contributing to radioresistance in lung cancer cells using
microarray analysis. Radiat Res. 164:27–35. 2005. View Article : Google Scholar : PubMed/NCBI
|
|
9
|
Tantai JC, Pan XF and Zhao H: Network
analysis of differentially expressed genes reveals key genes in
small cell lung cancer. Eur Rev Med Pharmacol Sci. 19:1364–1372.
2015.PubMed/NCBI
|
|
10
|
Wachi S, Yoneda K and Wu R:
Interactome-transcriptome analysis reveals the high centrality of
genes differentially expressed in lung cancer tissues.
Bioinformatics. 21:4205–4208. 2005. View Article : Google Scholar : PubMed/NCBI
|
|
11
|
Lv M and Wang L: Comprehensive analysis of
genes, pathways, and TFs in nonsmoking Taiwan females with lung
cancer. Exp Lung Res. 41:74–83. 2015. View Article : Google Scholar : PubMed/NCBI
|
|
12
|
Ritchie ME, Phipson B, Wu D, Hu Y, Law CW,
Shi W and Smyth GK: Limma powers differential expression analyses
for RNA-sequencing and microarray studies. Nucleic Acids Res.
43:e472015. View Article : Google Scholar : PubMed/NCBI
|
|
13
|
Hsia CW, Ho MY, Shui HA, Tsai CB and Tseng
MJ: Analysis of dermal papilla cell interactome using STRING
database to profile the ex vivo hair growth inhibition effect of a
vinca alkaloid drug, colchicine. Int J Mol Sci. 16:3579–3598. 2015.
View Article : Google Scholar : PubMed/NCBI
|
|
14
|
Jenjaroenpun P and Kuznetsov VA: TTS
mapping: Integrative WEB tool for analysis of triplex formation
target DNA sequences, G-quadruplets and non-protein coding
regulatory DNA elements in the human genome. BMC Genomics. 10 Suppl
3:S92009. View Article : Google Scholar : PubMed/NCBI
|
|
15
|
Yesner R and Matthews MJ: World health
organization lung cancer classification: pathology of lung cancer.
Chest. 89 Suppl:315S1986. View Article : Google Scholar : PubMed/NCBI
|
|
16
|
Hudy MH, Traves SL, Wiehler S and Proud D:
Cigarette smoke modulates rhinovirus-induced airway epithelial cell
chemokine production. Eur Respir J. 35:1256–1263. 2010. View Article : Google Scholar : PubMed/NCBI
|
|
17
|
Livak KJ and Schmittgen TD: Analysis of
relative gene expression data using real-time quantitative PCR and
the 2(-Delta Delta C(T)) method. Methods. 25:402–408. 2001.
View Article : Google Scholar : PubMed/NCBI
|
|
18
|
Zheng L, Jiang G, Mei H, Pu J, Dong J, Hou
X and Tong Q: Small RNA interference-mediated gene silencing of
heparanase abolishes the invasion, metastasis and angiogenesis of
gastric cancer cells. BMC Cancer. 10:332010. View Article : Google Scholar : PubMed/NCBI
|
|
19
|
McCormack MP, Young LF, Vasudevan S, de
Graaf CA, Codrington R, Rabbitts TH, Jane SM and Curtis DJ: The
Lmo2 oncogene initiates leukemia in mice by inducing thymocyte
self-renewal. Science. 327:879–883. 2010. View Article : Google Scholar : PubMed/NCBI
|
|
20
|
Yamada Y, Pannell R, Forster A and
Rabbitts TH: The LIM-domain protein Lmo2 is a key regulator of
tumour angiogenesis: A new anti-angiogenesis drug target. Oncogene.
21:1309–1315. 2002. View Article : Google Scholar : PubMed/NCBI
|
|
21
|
Han SA, Song JY, Min SY, Park WS, Kim MJ,
Chung JH and Kwon KH: A genetic association analysis of
polymorphisms, rs2282695 and rs12373539, in the FOSB gene and
papillary thyroid cancer. Exp Ther Med. 4:519–523. 2012. View Article : Google Scholar : PubMed/NCBI
|
|
22
|
Shahzad MM, Arevalo JM, Armaiz-Pena GN, Lu
C, Stone RL, Moreno-Smith M, Nishimura M, Lee JW, Jennings NB,
Bottsford-Miller J, et al: Stress effects on FosB- and
interleukin-8 (IL8)-driven ovarian cancer growth and metastasis. J
Biol Chem. 285:35462–35470. 2010. View Article : Google Scholar : PubMed/NCBI
|
|
23
|
Vella LJ: The emerging role of exosomes in
epithelial-mesenchymal-transition in cancer. Front Oncol.
4:3612014. View Article : Google Scholar : PubMed/NCBI
|
|
24
|
Pei L and Melmed S: Isolation and
characterization of a pituitary tumor-transforming gene (PTTG). Mol
Endocrinol. 11:433–441. 1997. View Article : Google Scholar : PubMed/NCBI
|
|
25
|
Smith VE, Franklyn JA and McCabe CJ:
Pituitary tumor-transforming gene and its binding factor in
endocrine cancer. Expert Rev Mol Med. 12:e382010. View Article : Google Scholar : PubMed/NCBI
|
|
26
|
Salehi F, Kovacs K, Scheithauer BW, Lloyd
RV and Cusimano M: Pituitary tumor-transforming gene in endocrine
and other neoplasms: A review and update. Endocr Relat Cancer.
15:721–743. 2008. View Article : Google Scholar : PubMed/NCBI
|
|
27
|
Yasuyuki S, Nobuhiro H, Yoshiyuki K,
Nishiwaki T, Kato J, Shinoda N, Sato A, Kimura M, Koyama H, Toyama
T, et al: Expression of PTTG (pituitary tumor transforming gene) in
esophageal cancer. Jpn J Clin Oncol. 32:233–237. 2002. View Article : Google Scholar : PubMed/NCBI
|
|
28
|
Xin DQ, Zhu XH, Lai YQ, You R, Na YQ, Guo
YL and Mao ZB: Regulation of expression of pituitary tumor
transforming gene 1 (PTTG1) by androgen in prostate cancer. Beijing
Da Xue Xue Bao. 37:638–640. 2005.(In Chinese). PubMed/NCBI
|
|
29
|
Mu YM, Oba K, Yanase T, Ito T, Ashida K,
Goto K, Morinaga H, Ikuyama S, Takayanagi R and Nawata H: Human
pituitary tumor transforming gene (hPTTG) inhibits human lung
cancer A549 cell growth through activation of p21 (WAF1/CIP1).
Endocr J. 50:771–781. 2003. View Article : Google Scholar : PubMed/NCBI
|
|
30
|
Chen CC, Chang TW, Chen FM, Hou MF, Hung
SY, Chong IW, Lee SC, Zhou TH and Lin SR: Combination of multiple
mRNA markers (PTTG1, Survivin, UbcH10 and TK1) in the diagnosis of
Taiwanese patients with breast cancer by membrane array. Oncology.
70:438–446. 2006. View Article : Google Scholar : PubMed/NCBI
|
|
31
|
Kim DS, Franklyn JA, Stratford AL,
Boelaert K, Watkinson JC, Eggo MC and McCabe CJ: Pituitary
tumor-transforming gene regulates multiple downstream angiogenic
genes in thyroid cancer. J Clin Endocrinol Metab. 91:1119–1128.
2006. View Article : Google Scholar : PubMed/NCBI
|
|
32
|
Kim JW, Song JY, Lee JM, Lee JK, Lee NW,
Yeom BW and Lee KW: Expression of pituitary tumor-transforming gene
in endometrial cancer as a prognostic marker. Int J Gynecol Cancer.
18:1352–1359. 2008. View Article : Google Scholar : PubMed/NCBI
|
|
33
|
Yoon CH, Kim MJ, Lee H, Kim RK, Lim EJ,
Yoo KC, Lee GH, Cui YH, Oh YS, Gye MC, et al: PTTG1 oncogene
promotes tumor malignancy via epithelial to mesenchymal transition
and expansion of cancer stem cell population. J Biol Chem.
287:19516–19527. 2012. View Article : Google Scholar : PubMed/NCBI
|
|
34
|
Lewy GD, Ryan GA, Read ML, Fong JC, Poole
V, Seed RI, Sharma N, Smith VE, Kwan PP, Stewart SL, et al:
Regulation of pituitary tumor transforming gene (PTTG) expression
and phosphorylation in thyroid cells. Endocrinology. 154:4408–4422.
2013. View Article : Google Scholar : PubMed/NCBI
|
|
35
|
McCabe CJ, Khaira JS, Boelaert K, Heaney
AP, Tannahill LA, Hussain S, Mitchell R, Olliff J, Sheppard MC,
Franklyn JA and Gittoes NJ: Expression of pituitary tumour
transforming gene (PTTG) and fibroblast growth factor-2 (FGF-2) in
human pituitary adenomas: Relationships to clinical tumour
behaviour. Clin Endocrinol (Oxf). 58:141–150. 2003. View Article : Google Scholar : PubMed/NCBI
|
|
36
|
Malik MT and Kakar SS: Regulation of
angiogenesis and invasion by human Pituitary tumor transforming
gene (PTTG) through increased expression and secretion of matrix
metalloproteinase-2 (MMP-2). Mol Cancer. 5:612006. View Article : Google Scholar : PubMed/NCBI
|
|
37
|
Hamid T and Kakar SS: PTTG/securin
activates expression of p53 and modulates its function. Mol Cancer.
3:182004. View Article : Google Scholar : PubMed/NCBI
|
|
38
|
Cho-Rok J, Yoo J, Jang YJ, Kim S, Chu IS,
Yeom YI, Choi JY and Im DS: Adenovirus-mediated transfer of siRNA
against PTTG1 inhibits liver cancer cell growth in vitro and in
vivo. Hepatology. 43:1042–1052. 2006. View Article : Google Scholar : PubMed/NCBI
|
|
39
|
Chirco R, Liu XW, Jung KK and Kim HR:
Novel functions of TIMPs in cell signaling. Cancer Metastasis Rev.
25:99–113. 2006. View Article : Google Scholar : PubMed/NCBI
|
|
40
|
Sheu BC, Hsu SM, Ho HN, Lien HC, Huang SC
and Lin RH: A novel role of metalloproteinase in cancer-mediated
immunosuppression. Cancer Res. 61:237–242. 2001.PubMed/NCBI
|
|
41
|
Bergers G, Brekken R, Mcmahon G, Vu TH,
Itoh T, Tamaki K, Tanzawa K, Thorpe P, Itohara S, Werb Z and
Hanahan D: Matrix metalloproteinase-9 triggers the angiogenic
switch during carcinogenesis. Nat Cell Biol. 2:737–744. 2000.
View Article : Google Scholar : PubMed/NCBI
|
|
42
|
El-Badrawy MK, Yousef AM, Shaalan D and
Elsamanoudy AZ: Matrix metalloproteinase-9 expression in lung
cancer patients and its relation to serum mmp-9 activity,
pathologic type, and prognosis. J Bronchology Interv Pulmonol.
21:327–334. 2014. View Article : Google Scholar : PubMed/NCBI
|
|
43
|
Cheng X, Yang Y, Fan Z, Yu L, Bai H, Zhou
B, Wu X, Xu H, Fang M, Shen A, et al: MKL1 potentiates lung cancer
cell migration and invasion by epigenetically activating MMP9
transcription. Oncogene. 34:5570–5581. 2015. View Article : Google Scholar : PubMed/NCBI
|
|
44
|
Li L, Tan J, Zhang Y, Han N, Di X, Xiao T,
Cheng S, Gao Y and Liu Y: DLK1 promotes lung cancer cell invasion
through upregulation of MMP9 expression depending on notch
signaling. PLoS One. 9:e915092014. View Article : Google Scholar : PubMed/NCBI
|