Introduction
Bladder cancer is one of the most common types of
cancer worldwide and was the most common urological tumor in China
in 2012 (1). In 2012, of the
individuals with bladder cancer, 90% were diagnosed at >65
years-of-age worldwide (2). This
disease is a common malignancy characterized by a poor clinical
outcome (3); therefore,
investigations into the underlying molecular mechanisms are
urgently required in order to facilitate improvements in early
diagnosis and treatments.
Bladder cancer is considered a genetic disease and
is driven by the multistep accumulation of genetic and epigenetic
factors that usually result in uncontrolled cellular proliferation,
cell cycle deregulation or a decrease in cell death (3). The two different types of genetic
alterations that are observed in bladder cancer are tumor protein
p53 mutations and a number of single-nucleotide and structural
variants, as well as chromosome shattering (4). Di Pierro et al (1) revealed that mutations in FGFR3
and TP53 are usually predictive of bladder malignancy.
Overexpression of PIN2/TRF1-interacting telomerase inhibitor 1 in
urothelial carcinoma of the bladder inhibited cell proliferation by
inhibiting telomerase activity and the p16/cyclin D1 signaling
pathway (5). Furthermore, chromosomal
instability (CIN) characterized by loss or gain of chromosomal
fragments or entire chromosomes is most prevalent in invasive
urothelial cancer, compared with other less malignant papillary
subtypes (6). Checkpoint dysfunction
serves an important role in the development of CIN and is caused by
defects in cell cycle regulation, p53 function and checkpoint
signaling (7). Although certain
studies have reported that gene mutations, telomerase activity and
chromosomal instability are connected with bladder cancer (4–7), the exact
molecular mechanism of bladder cancer remains unclear. A profound
understanding of the molecular mechanism of action may be useful to
provide an improved, more efficient handling of bladder cancer.
In the present study, the raw microarray data
GSE52519 were downloaded to investigate the underlying molecular
mechanisms of bladder cancer. Gene Ontology-Biological Process
(GO-BP) functional analysis, Kyoto Encyclopedia of Genes and
Genomes (KEGG) pathway analysis and Reactome pathway enrichment
analysis were performed for down- and upregulated differentially
expressed genes (DEGs). Subsequently, transcription factors and
genes associated with cancer for DEGs were identified. In addition,
a protein-protein interaction (PPI) network and its core
sub-network were constructed, and KEGG pathway enrichment analysis
of the genes in the identified core PPI sub-network was also
performed.
Materials and methods
Microarray data and data
preprocessing
The raw microarray data GSE52519 were downloaded
from Gene Expression Omnibus (www.ncbi.nlm.nih.gov/geo/query/acc.cgi?acc=GSE52519).
GSE52519 comprises 9 bladder cancer tissue samples obtained during
cystectomy and 3 normal tissue samples derived from post mortem
donors without bladder cancer. The microarray platform of GSE52519
was GPL13497 Illumina HumanWG-6 v3.0 Expression BeadChip (Illumina,
Inc., San Diego, CA, USA).
The gene expression profile was preprocessed using
Limma (version 3.83; linear models for microarray data; www.bioconductor.org/packages/2.8/bioc/html/limma.html)
package in Bioconductor (8) and
Affymetrix annotation files from Brain Array Lab (version 20;
http://brainarray.mbni.med.umich.edu/Brainarray/Database/CustomCDF/CDF_download.asp)
(9). The background correction,
quantile normalization and probe summarization of the microarray
data were performed using the Robust Multi-Array Average algorithm
(10) to obtain the gene expression
matrix.
Identification of DEGs
The normalized data were calculated with the Limma
package (8), and genes with P<0.01
and |log2fold change|≥2 were considered to indicate a
statistically significant difference between the bladder cancer
group and the normal group.
Enrichment analysis of DEGs
The Database for Annotation, Visualization and
Integrated Discovery (DAVID; david.abcc.ncifcrf.gov) is a comprehensive functional
annotation tool (10,11). Based on DAVID online analysis, GO-BP
functional enrichment analysis was performed for DEGs (12); P<0.01 was selected as the threshold
criterion.
KEGG is a knowledge base for systematic analysis of
gene functions, and the PATHWAR database (www.kegg.jp/kegg/pathway.html) is supplemented by the
information of conserved sub-pathways (13). The Reactome database (www.reactome.org) is an open-source open-data resource
of human pathways and reactions (14). Pathway enrichment analysis was
performed for the DEGs using these two databases, with the
threshold of P<0.01.
Identification of transcription
factors and genes associated with cancer from DEGs
Transcription factor analysis using the TRANSFAC
database (www.biobase-international.com/product/transcription-factor-binding-sites#resources)
(15) was performed on DEGs to
determine whether the genes were transcription factors. The DEGs
were also submitted to the Tumor Suppressor Gene database
(bioinfo.mc.vanderbilt.edu/TSGene) (16) and the Tumor-Associated Gene database
(blog.synopse.info/tag/Database) (17) to obtain all known proto-oncogenes and
tumor suppressor genes.
Construction of PPI network and PPI
sub-network analysis
DEGs were submitted to STRING version 9.1 (Search
Tool for the Retrieval of Interacting Genes; string.embl.de) (18) to
search interaction associations of the proteins; the confidence
score >0.9 was used as the threshold criterion. Then,
visualization of the PPI network was performed using Cytoscape
software (cytoscape.org) (19). The HUB nodes with the top 5 degrees in
the PPI network were also obtained.
The PPI sub-network of DEGs was identified by BioNet
(20), and a false discovery rate of
<0.01 was selected as the threshold criterion. The pathway
enrichment analysis of genes in the core PPI sub-network was
performed using the KEGG database, and P<0.01 was selected as
the threshold criterion.
Results
DEG analysis
A total of 779 transcripts and 755 DEGs were
identified in the bladder cancer and the normal group combined,
including 431 downregulated transcripts that corresponded to 420
downregulated DEGs, and 348 upregulated transcripts that
corresponded to 335 upregulated DEGs.
Enrichment analysis of DEGs
The top three enriched GO terms in the BP category
of downregulated DEGs included muscle contraction
(P=3.60×10⁻⁵), involving DEGs such as CRYAB,
TACR2 and MYH3, muscle system process
(P=9.48×10⁻⁵) associated with DEGs such as CRYAB,
TACR2 and MYH3, and actin filament-based process
(P=3.19×10⁻⁴) involving DEGs such as DLC1, MYH3
and CALD1 (Table I). The only
two enriched KEGG pathways of downregulated DEGs included focal
adhesion (P=3.86×10⁻³; e.g., PRKCA, LAMA3 and
ITGA8) and tight junction (P=8.10×10⁻³; e.g.,
PRKCA, GNAI1 and MYH3) (Table II). Additionally, five downregulated
DEGs (TNNT3, DES, MYH3, DMD and TPM2) were
significantly enriched in the Reactome pathway of muscle
contraction (P=2.46×10⁻³; Table III).
 | Table I.Top 10 enriched GO terms in the
Biological Process category for downregulated differentially
expressed genes in bladder cancer. |
Table I.
Top 10 enriched GO terms in the
Biological Process category for downregulated differentially
expressed genes in bladder cancer.
| Term | n | P-value | Example genes |
|---|
| GO: 0006936 ~
muscle contraction | 14 |
3.60×10⁻⁵ | CRYAB, TACR2,
MYH3, CALD1, VIPR1… |
| GO: 0003012 ~
muscle system process | 14 |
9.48×10⁻⁵ | CRYAB, TACR2,
MYH3, CALD1, VIPR1… |
| GO: 0030029 ~ actin
filament-based process | 16 |
3.19×10⁻⁴ | DLC1, MYH3,
CALD1, NF1, FLNA… |
| GO: 0001656 ~
metanephros development | 7 |
3.93×10⁻⁴ | TCF21, BDNF,
ITGA8, BCL2, HOXA11… |
| GO: 0040012 ~
regulation of locomotion | 13 |
1.21×10⁻³ | RTN4, DLC1,
PRKCA, NF1, SMAD3… |
| GO: 0030334 ~
regulation of cell migration | 12 |
1.38×10⁻³ | RTN4, DLC1,
LAMA3, BCL2, NF1… |
| GO: 0030336 ~
negative regulation of cell migration | 7 |
1.59×10⁻³ | DLC1, BCL2, NF1,
ILK, TGFBR3… |
| GO: 0030036 ~ actin
cytoskeleton organization | 14 |
1.62×10⁻³ | DLC1, CALD1,
NF1, FLNA, CORO2B… |
| GO: 0060284 ~
regulation of cell development | 13 |
2.10×10⁻³ | RTN4, NTF3,
HOXA11, NF1, NLGN1… |
| GO: 0045449 ~
regulation of transcription | 79 |
2.24×10⁻³ | ZNF383, LCOR,
MAP3K13, RNF20, KCNH4… |
| Table II.The two enriched Kyoto Encyclopedia
of Genes and Genomes pathways for downregulated differentially
expressed genes in bladder cancer. |
Table II.
The two enriched Kyoto Encyclopedia
of Genes and Genomes pathways for downregulated differentially
expressed genes in bladder cancer.
| Term | n | P-value | Genes |
|---|
| hsa04510: Focal
adhesion | 12 |
3.86×10⁻³ | PRKCA, LAMA3,
ITGA8, BCL2, ILK, LAMC1, LAMB1, FLNC, FLNA, PARVA, VCL,
MYL9 |
| hsa04530: Tight
junction | 9 |
8.10×10⁻³ | PRKCA, GNAI1,
MYH3, CNKSR3, MYH11, MYH14, CLDN11, TJAP1, MYL9 |
| Table III.Enriched Reactome pathways for
downregulated and upregulated differentially expressed genes in
bladder cancer. |
Table III.
Enriched Reactome pathways for
downregulated and upregulated differentially expressed genes in
bladder cancer.
| Term | n | P-value | Example genes |
|---|
| Downregulated |
|
REACT_17044: Muscle
contraction | 5 |
2.46×10⁻³ | TNNT3, DES,
MYH3, DMD, TPM2 |
| Upregulated |
|
REACT_152: Cell cycle,
mitotic | 49 |
3.93×10⁻²² | CDC20, CCNB2,
KIF23, E2F2, AURKA… |
|
REACT_1538: Cell cycle
checkpoints | 17 |
6.55×10⁻⁷ | CDC20, CCNB2,
CHEK1, MCM2, UBE2C… |
|
REACT_7970: Telomere
maintenance | 12 |
1.70×10⁻⁶ | HIST1H2AC,
HIST2H2AA3, HIST1H2BD, H2BFS, RFC4… |
|
REACT_383: DNA
replication | 12 |
3.52×10⁻⁴ | RFC4, POLE2,
PSMC4, RFC2, PSMD10… |
|
REACT_1698: Metabolism of
nucleotides | 9 |
4.04×10⁻³ | TYMS, RRM2,
DTYMK, DCK, CAD… |
The top three enriched GO terms in the BP category
of upregulated genes included cell cycle (P=1.88×10⁻²⁹),
involving DEGs such as AURKA, CCNA2, CCNE1, CDC20 and
CCNB2, M phase (P=1.88×10⁻²⁹) associated with a
number of DEGs, including AURKA, CCNA2, CDC20 and
CCNB2, and cell cycle phase (P=2.89×10⁻²⁸)
associated with DEGs such as AURKA, CCNA2, CCNE1, CDC20 and
CCNB2 (Table IV). A total of
six pathways were significantly enriched for upregulated genes,
including cell cycle (P=6.68×10⁻¹¹; e.g., CCNA2,
CCNE1, CDC20 and CCNB2), oocyte meiosis
(P=1.76×10⁻⁷; e.g., AURKA, CCNE1, CDC20 and
CCNB2), DNA replication (P=3.43×10⁻⁴; e.g.,
RFC4 and POLE2) and p53 signaling pathway
(P=4.28×10⁻⁴; e.g., CCNE1 and CCNB2)
(Table V). The five enriched Reactome
pathways of upregulated genes included cell cycle, mitotic
(P=3.93×10⁻²²; e.g., AURKA, CCNA2, CCNE1, CDC20,
CCNB2, RRM2 and KIF20A), cell cycle checkpoints
(P=6.55×10⁻⁷; e.g., CCNE1, CDC20 and
CCNB2), telomere maintenance (P=1.70×10⁻⁶; e.g.,
HIST1H2AC, HIST2H2AA3 and HIST1H2BD), DNA replication
(P=3.52×10⁻⁴; e.g., RFC4 and POLE2) and
metabolism of nucleotides (P=4.04×10⁻³; e.g.,
TYMS and RRM2) (Table
III).
| Table IV.Top 10 enriched GO terms in
Biological Process category for upregulated differentially
expressed genes in bladder cancer. |
Table IV.
Top 10 enriched GO terms in
Biological Process category for upregulated differentially
expressed genes in bladder cancer.
| Term | n | P-value | Example genes |
|---|
| GO: 0007049 ~ cell
cycle | 76 |
1.88×10⁻²⁹ | CDC20, CCNB2,
KIF23, E2F2, KIFC1… |
| GO: 0000279 ~ M
phase | 52 |
1.88×10⁻²⁹ | CDC20, CCNB2,
KIF23, KIFC1, PRC1… |
| GO: 0022403 ~ cell
cycle phase | 56 |
2.89×10⁻²⁸ | CDC20, CCNB2,
KIF23, KIFC1, PKMYT1… |
| GO: 0022402 ~ cell
cycle process | 63 |
3.37×10⁻²⁷ | CDC20, CCNB2,
KIF23, TTK, AURKA… |
| GO: 0000278 ~
mitotic cell cycle | 51 |
4.83×10⁻²⁶ | CDC20, CCNB2,
KIF23, KIFC1, TTK… |
| GO: 0000280 ~
nuclear division | 40 |
7.79×10⁻²⁵ | CDC20, CCNB2,
KIF23, KIFC1, NEK2… |
| GO: 0007067 ~
mitosis | 40 |
7.79×10⁻²⁵ | CDC20, CCNB2,
KIF23, KIFC1, PKMYT1… |
| GO: 0000087 ~ M
phase of mitotic cell cycle | 40 |
1.56×10⁻²⁴ | CDC20,
CCNB2, KIF23, PKMYT1, AURKA… |
| GO: 0048285 ~
organelle fission | 40 |
3.64×10⁻²⁴ | CDC20, CCNB2,
KIF23, PTTG1, CEP55… |
| GO: 0051301 ~ cell
division | 42 |
6.70×10⁻²² | CDC20, CCNB2,
KIF23, CKS1B, PRC1… |
| Table V.The six enriched Kyoto Encyclopedia
of Genes and Genomes pathways for upregulated differentially
expressed genes in bladder cancer. |
Table V.
The six enriched Kyoto Encyclopedia
of Genes and Genomes pathways for upregulated differentially
expressed genes in bladder cancer.
| Term | n | P-value | Example genes |
|---|
| hsa04110: Cell
cycle | 21 |
6.68×10⁻¹¹ | CDC20, CCNB2,
E2F2, PKMYT1, TTK… |
| hsa04114: Oocyte
meiosis | 16 |
1.76×10⁻⁷ | CDC20, CCNB2,
SGOL1, PKMYT1, AURKA… |
| hsa03030: DNA
replication | 7 |
3.43×10⁻⁴ | RFC4, POLE2,
RFC2, MCM2, FEN1… |
| hsa04115: P53
signaling pathway | 9 |
4.28×10⁻⁴ | CCNB2, CCNE2,
CCNB1, BID, CCNE1… |
| hsa04914:
Progesterone-mediated oocyte maturation | 9 |
2.05×10⁻³ | CCNB2, CCNB1,
MAD2L1, PLK1, BUB1… |
| hsa05322: Systemic
lupus erythematosus | 9 |
4.93×10⁻³ | HIST1H2AC,
HIST2H2AA3, CD86, HIST1H2BD, HIST1H2BK… |
Analysis of transcription factors and
genes associated with cancer
Transcription factor analysis of DEGs revealed that
21 transcription factors (e.g., ARNT, FOXP1 and HEY1)
were significantly downregulated in bladder cancer tissues and 8
transcription factors (e.g., BCL3, EZH2 and FOXM1)
were upregulated (Table VI).
| Table VI.Transcription factors and genes
associated with cancer in the differentially expressed genes in
bladder cancer. |
Table VI.
Transcription factors and genes
associated with cancer in the differentially expressed genes in
bladder cancer.
| Terms | Genes | n |
|---|
| TF genes |
|
Downregulated | ARNT, FOXP1,
HEY1, HOXA11, HOXA3, HOXA9, ISL1, LMO3, MEIS1, NR1H3, NR1H4, NR3C2,
POU3F1, POU3F4, RORB, SMAD3, SP3, TCF21, YAF2, ZNF10,
ZNF174 | 21 |
|
Upregulated | BCL3, EZH2,
FOXM1, IRF1, RELB, TCEB3, TFDP1, XBP1 | 8 |
| Oncogenes |
|
Downregulated | DUSP26,
MEIS1 | 2 |
|
Upregulated | AURKA, BCL3,
CCNA2, CCNE1, CEP55, DCUN1D1, FGFR1OP, HMMR, MAP3K8, MYB, PTTG1,
VEGFA | 12 |
| Tumor
suppressors |
|
Downregulated | ARHGEF12, BLCAP,
CHD5, DLC1, FOXP1, MFHAS1, NDRG4, NF1, PACRG, PEG3, SCARA3, SMAD3,
TGFBR2, TGFBR3, VCL, YAP1, ZDHHC2 | 17 |
|
Upregulated | BLM, CHEK1,
CST6, ERRFI1, IRF1, MT1G, PLEKHG2, RASSF1, SLC9A3R1,
TNFAIP3 | 10 |
Analysis of screening for genes associated with
bladder cancer identified that 2 proto-oncogenes, DUSP26 and
MEIS1, were downregulated and 12 proto-oncogenes (e.g.,
AURKA, CCNA2 and CCNE1) were upregulated.
Furthermore, 17 tumor suppressor genes (e.g., ARHGEF12,
BLCAP and CHD5) were downregulated and 10 tumor
suppressor genes (e.g., BLM, CHEK1 and CST6) were
upregulated (Table VI).
PPI network and PPI sub-network
analysis
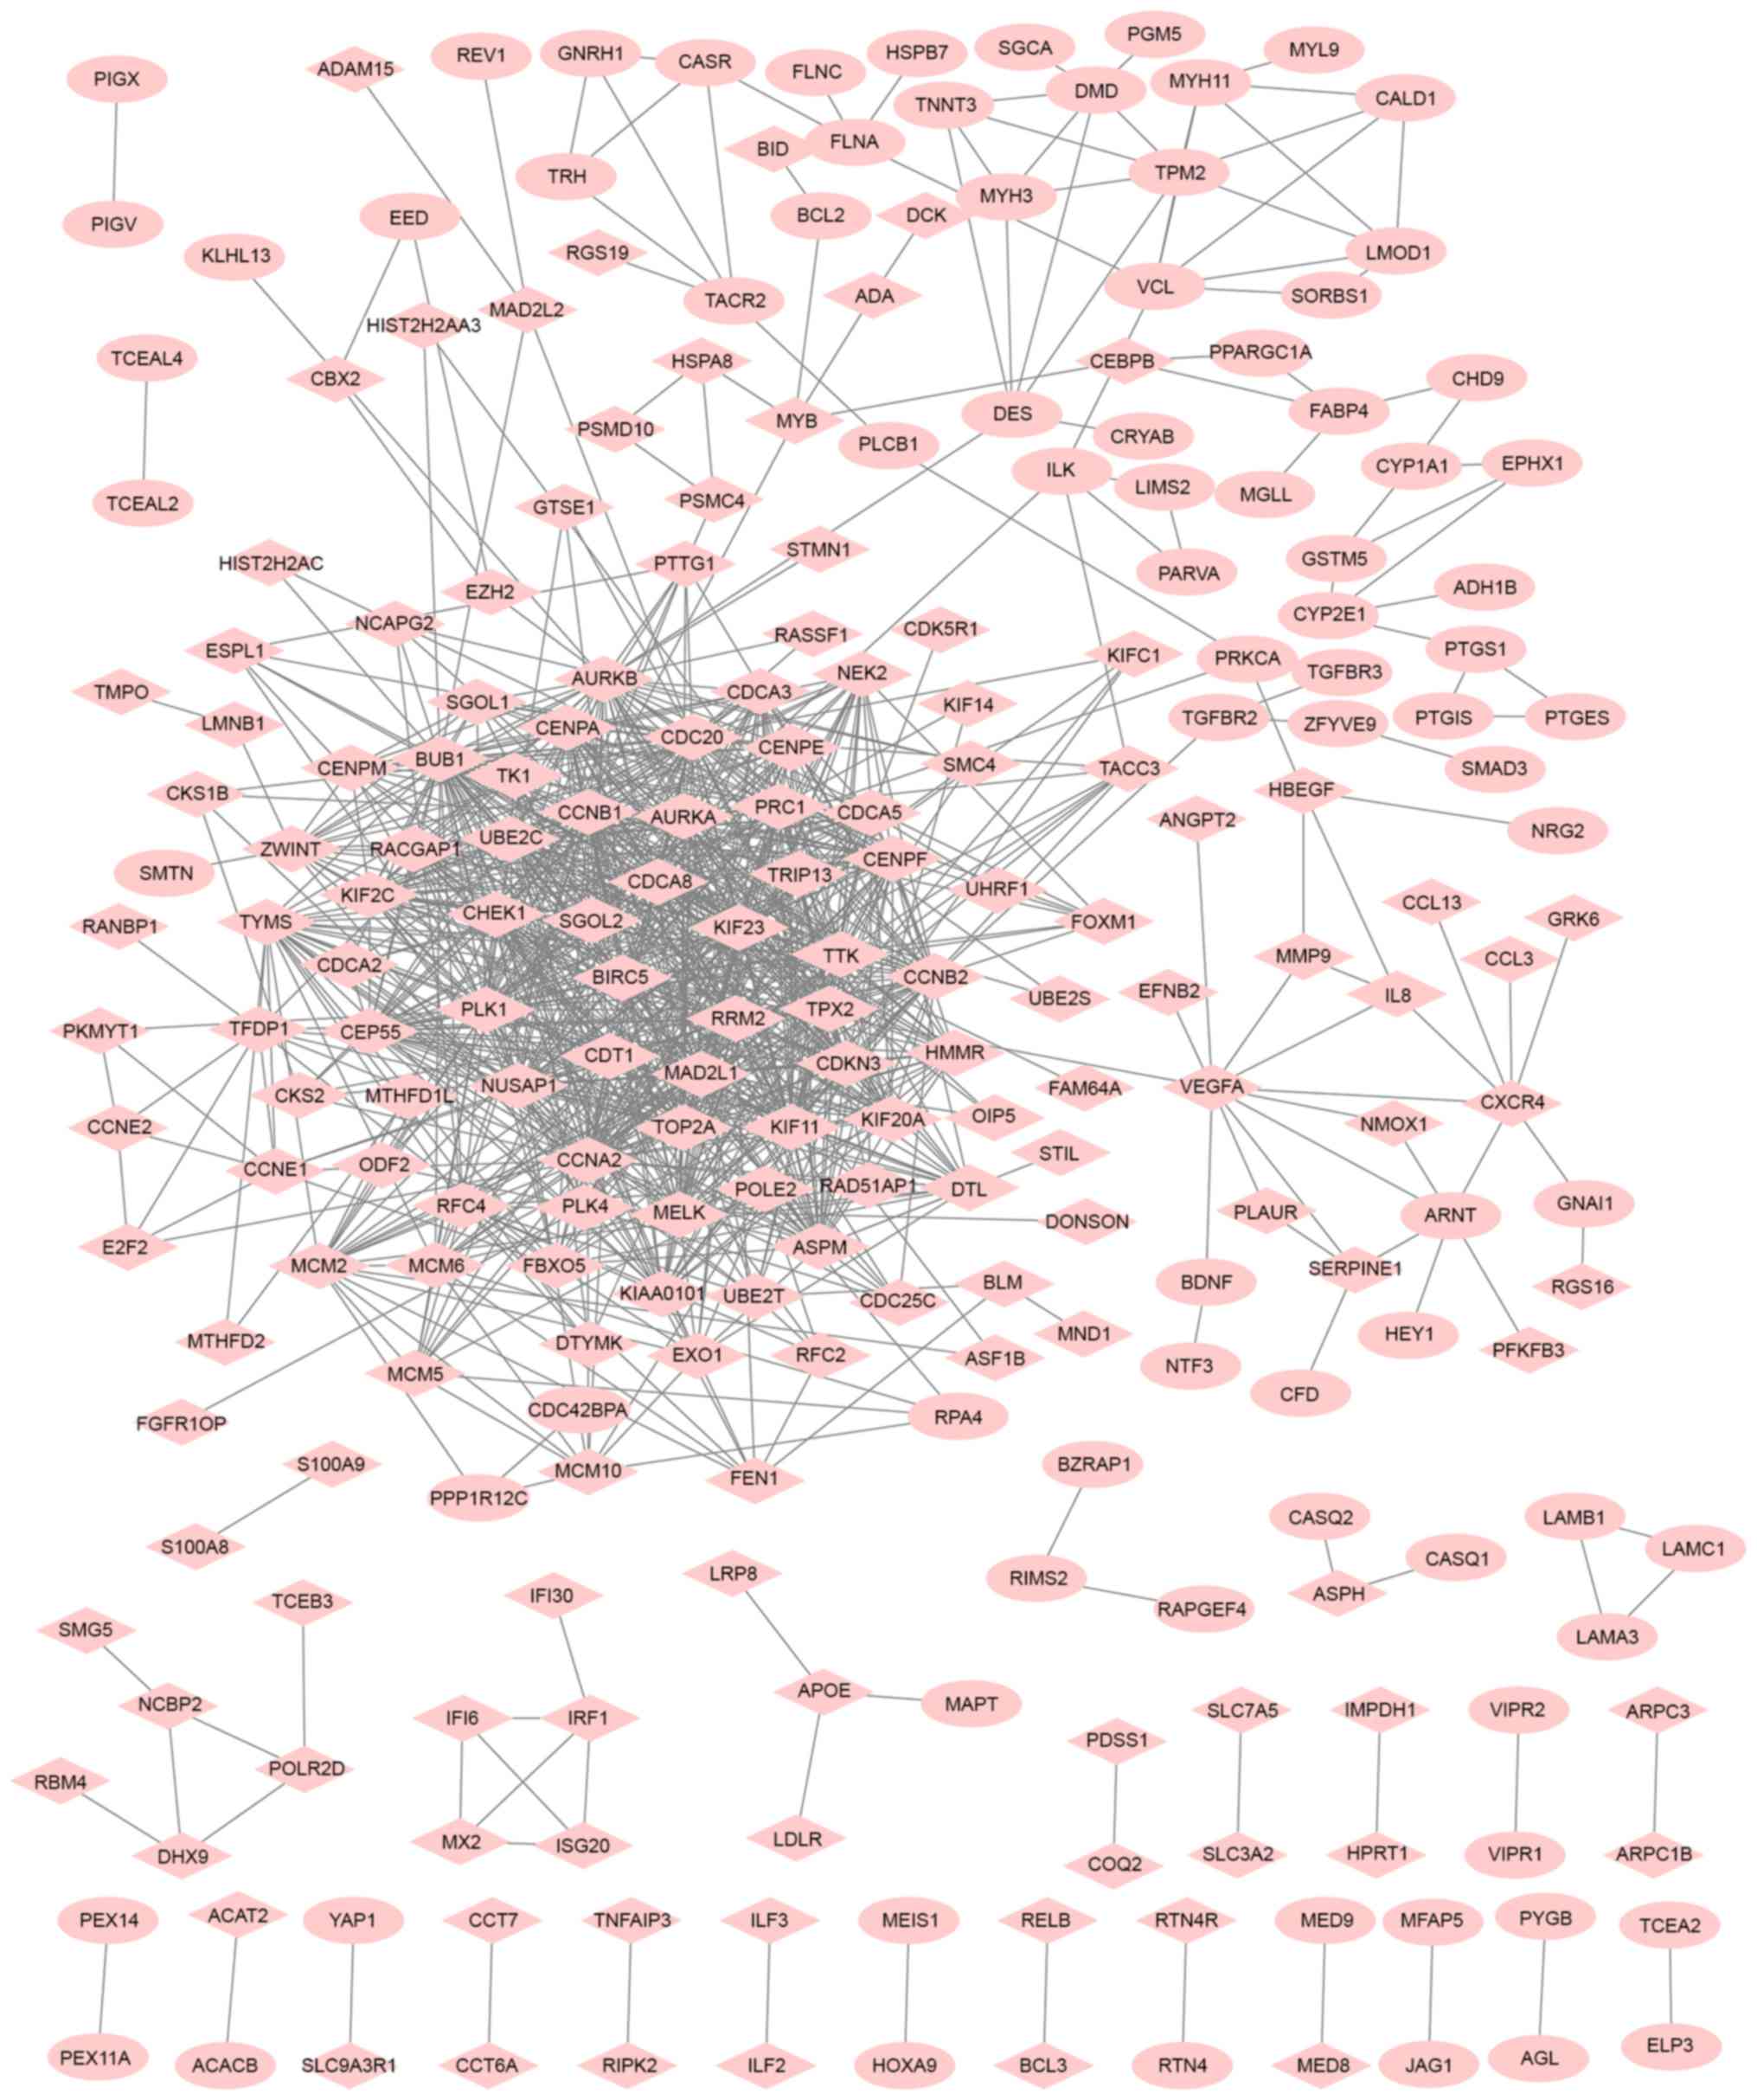
A PPI network of DEGs was constructed (Fig. 1). The top five genes/proteins with the
highest degree in the PPI network were CCNA2, BUB1, CDC20,
CCNB1 and MAD2L1, with degrees of 57, 53, 52, 50 and 44,
respectively.
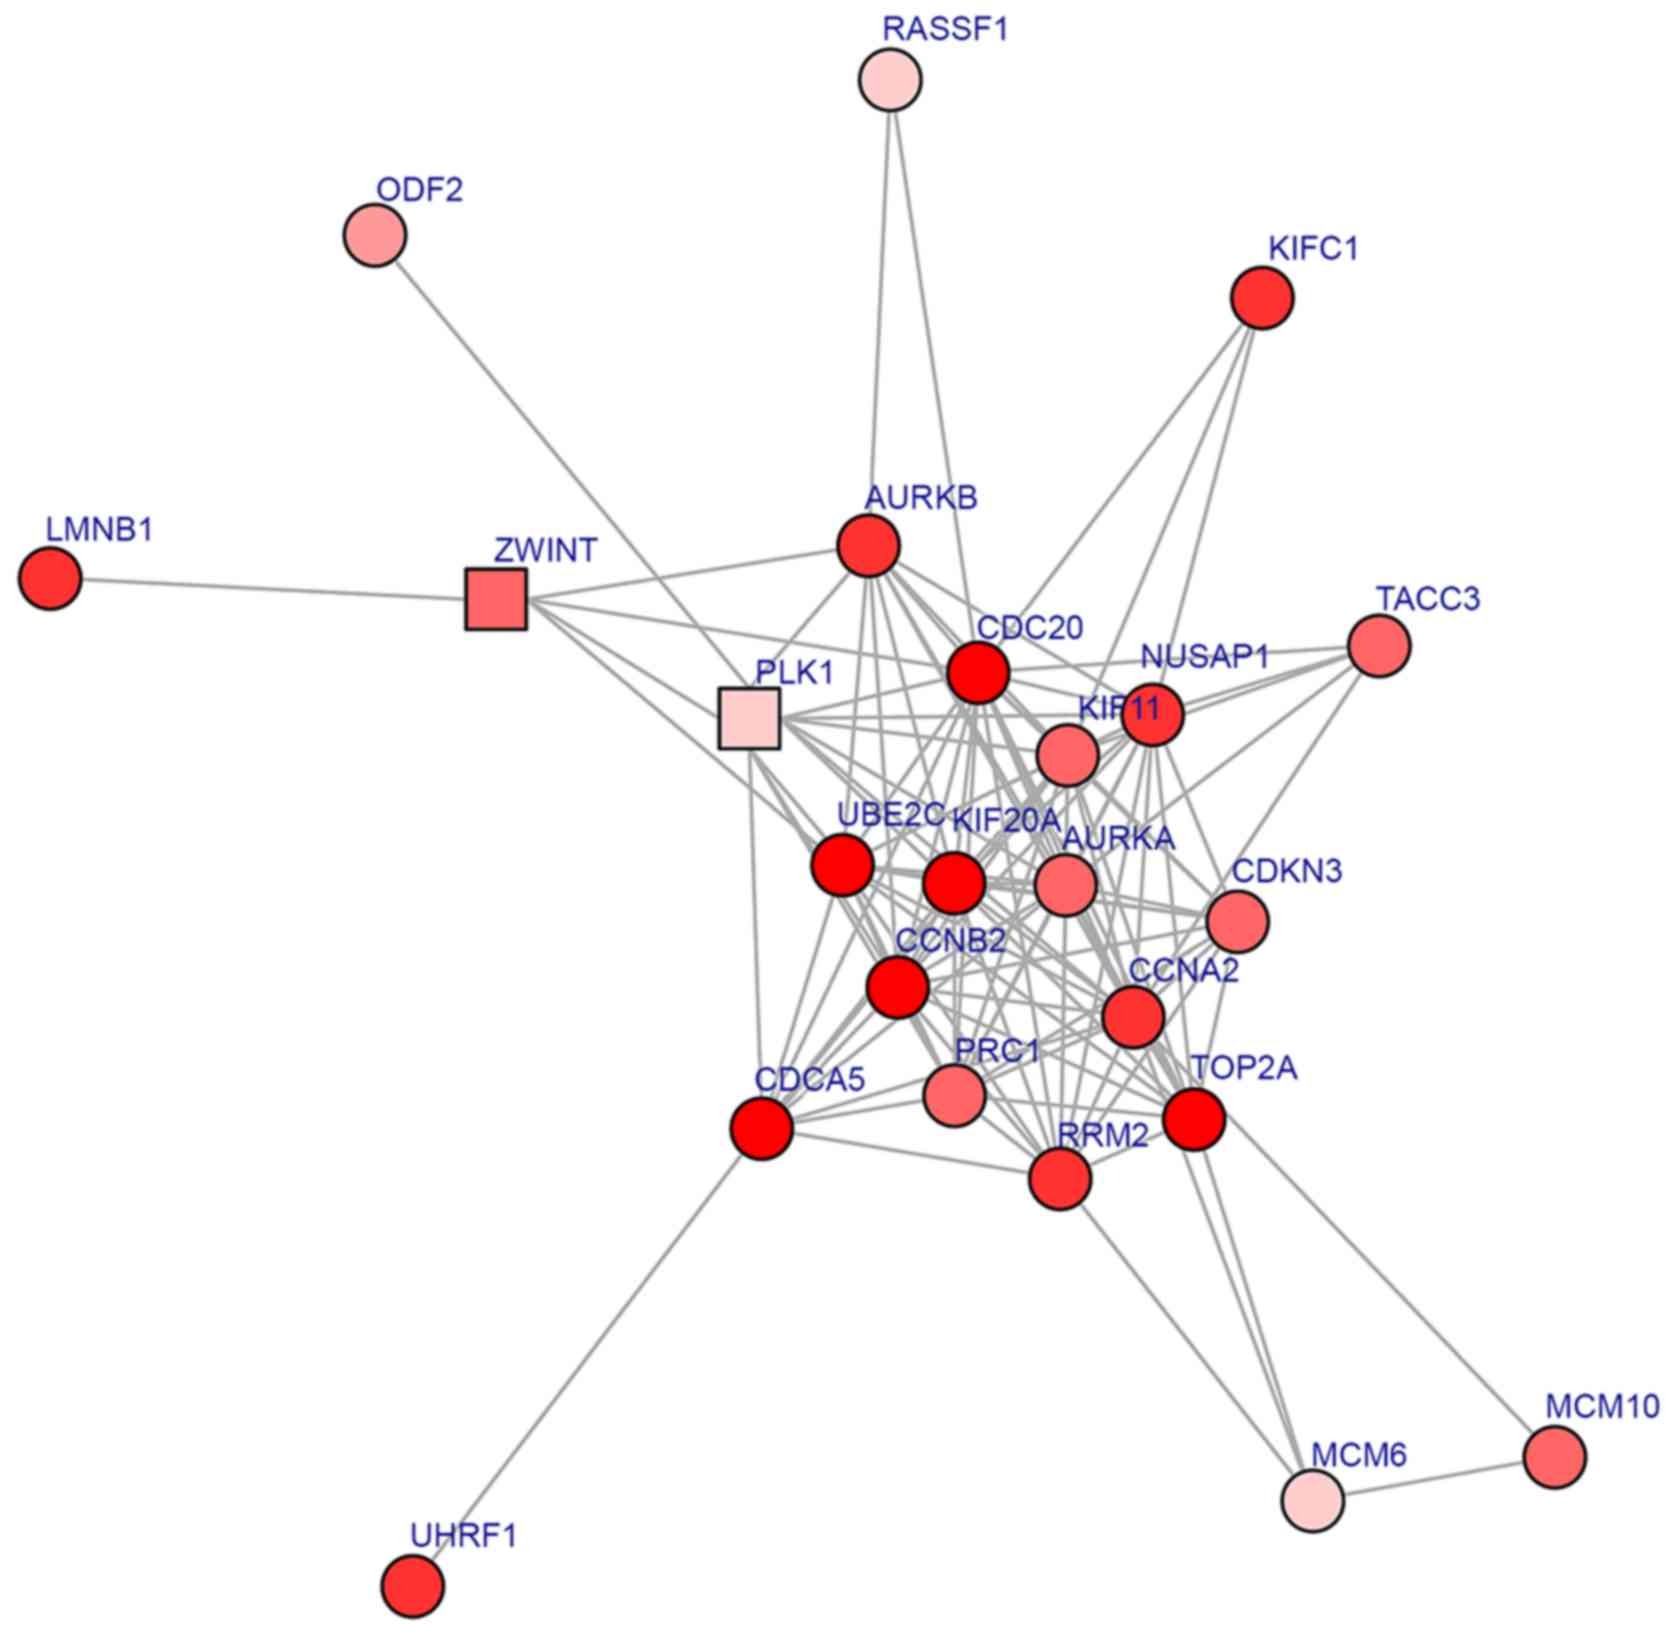
The obtained core sub-network from the PPI network
included 24 DEGs (Fig. 2). The
CDC20 has the highest degree (degree, 18). A number of DEGs
exhibited degrees >10, including CCNA2 (degree, 17),
KIF11 (degree, 16), AURKA (degree, 15), NUSAP1
(degree, 15) and CCNB2 (degree, 14). Furthermore, CDC20,
CCNA2, CCNB2 and AURKA interacted with each other.
KEGG pathway enrichment analysis of the genes in the
core sub-network revealed that DEGs were significantly involved in
cell cycle (P=2.26×10⁻⁵; CCNB2, PLK1, CDC20,
CCNA2 and MCM6), oocyte meiosis (P=5.10×10⁻⁴;
CCNB2, PLK1, CDC20 and AURKA) and
progesterone-mediated oocyte maturation (P=7.41×10⁻³;
CCNB2, PLK1 and CCNA2; Table VII).
| Table VII.Enriched Kyoto Encyclopedia of Genes
and Genomes pathways for differentially expressed genes of
protein-protein interaction sub-network. |
Table VII.
Enriched Kyoto Encyclopedia of Genes
and Genomes pathways for differentially expressed genes of
protein-protein interaction sub-network.
| Term | n | P-value | Genes |
|---|
| hsa04110: Cell
cycle | 5 |
2.26×10⁻⁵ | CCNB2, PLK1,
CDC20, CCNA2, MCM6 |
| hsa04114: Oocyte
meiosis | 4 |
5.10×10⁻⁴ | CCNB2, PLK1,
CDC20, AURKA |
| hsa04914:
Progesterone-mediated oocyte maturation | 3 |
7.41×10⁻³ | CCNB2, PLK1,
CCNA2 |
Discussion
In the present study, gene expression profiling was
used to investigate the molecular mechanisms underlying bladder
cancer. A set of 335 upregulated and 420 downregulated DEGs were
identified between bladder cancer samples and normal controls.
Analysis of the PPI sub-network demonstrated that 24 DEGs were
obtained, and CDC20, CCNA2, CCNB2 and AURKA had
>10 degrees and interacted with each other. The pathway
enrichment analysis revealed that these four genes were enriched in
the cell cycle signaling pathway.
CDC20 serves a key role in the spindle
assembly checkpoint and is necessary for anaphase onset and cell
cycle progression (21). The abnormal
expression of spindle assembly checkpoint proteins during mitosis,
including CDC20, is associated with chromosome aneuploidy,
and results in poor differentiation, tumor aneuploidy and poor
prognosis (22). Kidokoro et
al (23) demonstrated that p53
inhibits tumor cell growth by indirectly regulating the expression
levels of CDC20.
CCNA2 and CCNB2 encode cyclin and
function as regulators of CDKs. In the present study, CCNA2
was identified as an upregulated proto-oncogene. Lu et al
(24) and Lee et al (25) have demonstrated that CCNA2 is
upregulated in bladder cancer. Increased expression of CCNA2
has been associated with poor prognosis for individuals with
bladder cancer (26). Furthermore, in
the present study, the KEGG pathway enrichment analysis identified
that CCNB2 was enriched in the p53 signaling pathway. It has
been demonstrated that the expression level of CCNB2 is
upregulated in bladder tumors during interphase and proteolysis
(24), which is consistent with the
results of the present study. Additionally, deletion of p53 in
bladder epithelium has been demonstrated to lead to invasive cancer
in a novel mouse model (27),
indicating a key role for p53 in bladder cancer. Therefore,
CDC20, CCNA2 and CCNB2 may contribute to the
development of bladder cancer.
AURKA, another upregulated proto-oncogene
identified in the present study, encodes a cell cycle-regulated
kinase (28). A previous study
identified AURKA to be a biomarker for the detection of
bladder cancer, due to AURKA aneuploidy resulting in
chromosomal loss or gain (29).
Genomic instability, which may be caused by checkpoint loss and
perturbation of cell cycle control, results in the development of
bladder cancer (30). A recent study
demonstrated that AURKA is associated with the presence and
grade of urothelial bladder cancer, suggesting a potential role as
a diagnostic and prognostic biomarker (31). Hence, AURKA may serve a key
role during the progression of bladder cancer.
However, the present study has a number of
limitations. For example, the results of the present study were
only predicted by bioinformatical analysis and must be further
confirmed by experimental test. The studies should also be
conducted using a larger sample sizes. These limitations are to be
addressed in a further study.
To conclude, the present study identified 420
downregulated and 335 upregulated DEGs. A number of important DEGs,
including CDC20, CCNA2, CCNB2 and AURKA, may serve
pivotal roles in the development of bladder cancer by regulating
the cell cycle, as well as mutual interactions. These results
provide a theoretical basis for a subsequent experimental study,
and may contribute to an improved understanding of the molecular
mechanisms that underlie bladder cancer.
Glossary
Abbreviations
Abbreviations:
|
CIN
|
chromosomal instability
|
|
GO-BP
|
Gene Ontology-Biological Process
|
|
KEGG
|
Kyoto Encyclopedia of Genes and
Genomes
|
|
DEGs
|
differentially expressed genes
|
|
DAVID
|
Database for Annotation, Visualization
and Integrated Discovery
|
References
|
1
|
Di Pierro GB, Gulia C, Cristini C,
Fraietta G, Marini L, Grande P, Gentile V and Piergentili R:
Bladder cancer: A simple model becomes complex. Curr Genomics.
13:3952012. View Article : Google Scholar : PubMed/NCBI
|
|
2
|
Ye F, Wang L, Castillo-Martin M, McBride
R, Galsky MD, Zhu J, Boffetta P, Zhang DY and Cordon-Cardo C:
Biomarkers for bladder cancer management: Present and future. Am J
Clin Exp Urol. 2:1–14. 2014.PubMed/NCBI
|
|
3
|
Sanchez-Carbayo M, Socci ND, Lozano J,
Saint F and Cordon-Cardo C: Defining molecular profiles of poor
outcome in patients with invasive bladder cancer using
oligonucleotide microarrays. J Clin Oncol. 24:778–789. 2006.
View Article : Google Scholar : PubMed/NCBI
|
|
4
|
Morrison CD, Liu P, Woloszynska-Read A,
Zhang J, Luo W, Qin M, Bshara W, Conroy JM, Sabatini L, Vedell P,
et al: Whole-genome sequencing identifies genomic heterogeneity at
a nucleotide and chromosomal level in bladder cancer. Proc Natl
Acad Sci USA. 111:pp. E672–E681. 2014; View Article : Google Scholar : PubMed/NCBI
|
|
5
|
Liu JY, Qian D, He LR, Li YH, Liao YJ, Mai
SJ, Tian XP, Liu YH, Zhang JX, Kung HF, et al: PinX1 suppresses
bladder urothelial carcinoma cell proliferation via the inhibition
of telomerase activity and p16/cyclin D1 pathway. Mol Cancer.
12:1482013. View Article : Google Scholar : PubMed/NCBI
|
|
6
|
Florl AR and Schulz WA: Chromosomal
instability in bladder cancer. Arch Toxicol. 82:173–182. 2008.
View Article : Google Scholar : PubMed/NCBI
|
|
7
|
Zieger K, Wiuf C, Jensen KM, Ørntoft TF
and Dyrskjøt L: Chromosomal imbalance in the progression of
high-risk non-muscle invasive bladder cancer. BMC Cancer.
9:1492009. View Article : Google Scholar : PubMed/NCBI
|
|
8
|
Diboun I, Wernisch L, Orengo CA and
Koltzenburg M: Microarray analysis after RNA amplification can
detect pronounced differences in gene expression using limma. BMC
Genomics. 7:2522006. View Article : Google Scholar : PubMed/NCBI
|
|
9
|
Dai M, Wang P, Boyd AD, Kostov G, Athey B,
Jones EG, Bunney WE, Myers RM, Speed TP, Akil H, et al: Evolving
gene/transcript definitions significantly alter the interpretation
of GeneChip data. Nucleic Acids Res. 33:e1752005. View Article : Google Scholar : PubMed/NCBI
|
|
10
|
da W Huang, Sherman BT and Lempicki RA:
Systematic and integrative analysis of large gene lists using DAVID
bioinformatics resources. Nat Protoc. 4:44–57. 2009.PubMed/NCBI
|
|
11
|
da W Huang, Sherman BT and Lempicki RA:
Bioinformatics enrichment tools: Paths toward the comprehensive
functional analysis of large gene lists. Nucleic Acids Res.
37:1–13. 2009. View Article : Google Scholar : PubMed/NCBI
|
|
12
|
Ashburner M, Ball CA, Blake JA, Botstein
D, Butler H, Cherry JM, Davis AP, Dolinski K, Dwight SS, Eppig JT,
et al: Gene ontology: Tool for the unification of biology. The gene
ontology consortium. Nat Genet. 25:25–29. 2000. View Article : Google Scholar : PubMed/NCBI
|
|
13
|
Kanehisa M and Goto S: KEGG: Kyoto
encyclopedia of genes and genomes. Nucleic Acids Res. 28:27–30.
2000. View Article : Google Scholar : PubMed/NCBI
|
|
14
|
Croft D, Mundo AF, Haw R, Milacic M,
Weiser J, Wu G, Caudy M, Garapati P, Gillespie M, Kamdar MR, et al:
The Reactome pathway knowledgebase. Nucleic Acids Res. 42(Database
Issue): D472–D477. 2014. View Article : Google Scholar : PubMed/NCBI
|
|
15
|
Matys V, Fricke E, Geffers R, Gößling E,
Haubrock M, Hehl R, Hornischer K, Karas D, Kel AE, Kel-Margoulis
OV, et al: TRANSFAC: Transcriptional regulation, from patterns to
profiles. Nucleic Acids Res. 31:374–378. 2003. View Article : Google Scholar : PubMed/NCBI
|
|
16
|
Zhao M, Sun J and Zhao Z: TSGene: A web
resource for tumor suppressor genes. Nucleic Acids Res. 41(Database
Issue): D970–D976. 2013. View Article : Google Scholar : PubMed/NCBI
|
|
17
|
Chen JS, Hung WS, Chan HH, Tsai SJ and Sun
HS: In silico identification of oncogenic potential of fyn-related
kinase in hepatocellular carcinoma. Bioinformatics. 29:420–427.
2013. View Article : Google Scholar : PubMed/NCBI
|
|
18
|
Franceschini A, Szklarczyk D, Frankild S,
Kuhn M, Simonovic M, Roth A, Lin J, Minguez P, Bork P, von Mering C
and Jensen LJ: STRING v9. 1: Protein-protein interaction networks,
with increased coverage and integration. Nucleic Acids Res.
41(Database Issue): D808–D815. 2013.PubMed/NCBI
|
|
19
|
Saito R, Smoot ME, Ono K, Ruscheinski J,
Wang PL, Lotia S, Pico AR, Bader GD and Ideker T: A travel guide to
Cytoscape plugins. Nat Methods. 9:1069–1076. 2012. View Article : Google Scholar : PubMed/NCBI
|
|
20
|
Beisser D, Klau GW, Dandekar T, Müller T
and Dittrich MT: BioNet: An R-Package for the functional analysis
of biological networks. Bioinformatics. 26:1129–1130. 2010.
View Article : Google Scholar : PubMed/NCBI
|
|
21
|
Wang Y, Ji P, Liu J, Broaddus RR, Xue F
and Zhang W: Centrosome-associated regulators of the G2/M
checkpoint as targets for cancer therapy. Mol Cancer. 8:82009.
View Article : Google Scholar : PubMed/NCBI
|
|
22
|
Choi JW, Kim Y, Lee JH and Kim YS: High
expression of spindle assembly checkpoint proteins CDC20 and MAD2
is associated with poor prognosis in urothelial bladder cancer.
Virchows Arch. 463:681–687. 2013. View Article : Google Scholar : PubMed/NCBI
|
|
23
|
Kidokoro T, Tanikawa C, Furukawa Y,
Katagiri T, Nakamura Y and Matsuda K: CDC20, a potential cancer
therapeutic target, is negatively regulated by p53. Oncogene.
27:1562–1571. 2008. View Article : Google Scholar : PubMed/NCBI
|
|
24
|
Lu Y, Liu P, Wen W, Grubbs CJ, Townsend
RR, Malone JP, Lubet RA and You M: Cross-species comparison of
orthologous gene expression in human bladder cancer and
carcinogen-induced rodent models. Am J Transl Res. 3:8–27.
2010.PubMed/NCBI
|
|
25
|
Lee SJ, Lee EJ, Kim SK, Jeong P, Cho YH,
Yun SJ, Kim S, Kim GY, Choi YH, Cha EJ, et al: Identification of
pro-inflammatory cytokines associated with muscle invasive bladder
cancer; the roles of IL-5, IL-20, and IL-28A. PLoS One.
7:e402672012. View Article : Google Scholar : PubMed/NCBI
|
|
26
|
Blaveri E, Simko JP, Korkola JE, Brewer
JL, Baehner F, Mehta K, Devries S, Koppie T, Pejavar S, Carroll P
and Waldman FM: Bladder cancer outcome and subtype classification
by gene expression. Clin Cancer Res. 11:4044–4055. 2005. View Article : Google Scholar : PubMed/NCBI
|
|
27
|
Puzio-Kuter AM, Castillo-Martin M, Kinkade
CW, Wang X, Shen TH, Matos T, Shen MM, Cordon-Cardo C and
Abate-Shen C: Inactivation of p53 and Pten promotes invasive
bladder cancer. Genes Dev. 23:675–680. 2009. View Article : Google Scholar : PubMed/NCBI
|
|
28
|
Medina-Aguilar R, Marchat LA, Ocampo E
Arechaga, Gariglio P, García Mena J, Sepúlveda N Villegas, Martínez
Castillo M and López-Camarillo C: Resveratrol inhibits cell cycle
progression by targeting Aurora kinase A and Polo-like kinase 1 in
breast cancer cells. Oncol Rep. 35:3696–3704. 2016. View Article : Google Scholar : PubMed/NCBI
|
|
29
|
Park HS, Park WS, Bondaruk J, Tanaka N,
Katayama H, Lee S, Spiess PE, Steinberg JR, Wang Z, Katz RL, et al:
Quantitation of Aurora kinase A gene copy number in urine sediments
and bladder cancer detection. J Natl Cancer Inst. 100:1401–1411.
2008. View Article : Google Scholar : PubMed/NCBI
|
|
30
|
Wu X, Gu J, Grossman HB, Amos CI, Etzel C,
Huang M, Zhang Q, Millikan RE, Lerner S, Dinney CP and Spitz MR:
Bladder cancer predisposition: A multigenic approach to DNA-repair
and cell-cycle-control genes. Am J Hum Genet. 78:464–479. 2006.
View Article : Google Scholar : PubMed/NCBI
|
|
31
|
de Martino M, Shariat SF, Hofbauer SL,
Lucca I, Taus C, Wiener HG, Haitel A, Susani M and Klatte T: Aurora
a kinase as a diagnostic urinary marker for urothelial bladder
cancer. World J Urol. 33:105–110. 2015. View Article : Google Scholar : PubMed/NCBI
|