Introduction
Glioma is the most common primary malignant tumor of
the central nervous system (1). In
the past four decades, certain notable improvements have been made
in conventional therapies for glioma. Nevertheless, the prognosis
of the majority of glioma patients remains poor (1). At present, in addition to the
histological tumor type and World Health Organization (WHO)
malignancy grade (2), increasing
numbers of molecular markers, such as IDH mutations and
MGMT promoter methylation, have been identified as
predictors of prognosis and indicators for the selection of
therapeutic strategy for glioma patients (3). However, novel molecular markers are
still required as a great deal of heterogeneity in glioma remains
unexplained (4).
Mechanistic target of rapamycin (mTOR) is a
serine/threonine protein kinase belonging to a family of
phosphatidylinositol kinase-associated kinases, which has emerged
as a central modulator of cell proliferation, apoptosis and
metabolism (5,6). The dysregulation of multiple pathways
signaled through mTOR has been reported in several types of cancer,
including glioma (5,7). Additionally, it has been identified that
persistent activation of the PI3K/AKT/mTOR pathway promotes
malignant glioma progression in genetically modified mouse models
(8). Consistently, increased
PI3K/AKT/mTOR signaling is also associated with increased
invasiveness of glioma (9).
Expression quantitative trait loci (eQTLs) are
genomic variations that are associated with the expression levels
of genes. Recently, several studies on genome-wide mapping of eQTLs
have been conducted in multiple tissue types, including brain,
liver and lymphoblastoid tissue (10–12).
Furthermore, it has been demonstrated that eQTLs are likely to be
associated with complex diseases (13,14).
Therefore, we hypothesized that the eQTLs that regulate the
expression level of MTOR may be associated with the
progression of glioma.
In the present study, the associations between the
eQTLs of MTOR and the progression-free survival (PFS) of
glioma patients were evaluated to test this hypothesis. The data
demonstrate that one eQTL of MTOR, rs4845964, is associated
with the progression of glioma in a dominant manner. Similar trends
were identified in all subgroups by stratified analyses.
Materials and methods
Study subjects
The present study included 138 glioma patients whose
sources and characteristics were described in our previous study
(15). Briefly, all patients with
histopathologically confirmed glioma were unrelated ethnic Han
Chinese individuals recruited between January 2010 and July 2014 at
the First Affiliated Hospital, Fujian Medical University (Fuzhou,
China; n=122) and the First Affiliated Hospital, College of
Medicine, Zhejiang University (Hangzhou, China; n=16) without sex,
age or WHO grade restriction. The pathological diagnosis of each
patient was confirmed by at least two local pathologists according
to the WHO classification (2).
Clinical and pathological information was obtained from patients'
medical records. PFS time was defined as the period from the date
of treatment to the date of progressive disease or mortality. The
PFS times of patients without progression or who were lost to
follow-up were censored at the time of the last adequate tumor
evaluation. The last date of follow-up was 28th July, 2015.
Informed consent was obtained from each patient at recruitment. The
Institutional Review Board of the First Affiliated Hospital, Fujian
Medical University, approved this study.
Selection of candidate eQTLs
Candidate eQTLs of MTOR were selected from
the Genotype-Tissue Expression (GTEx) eQTL Browser (http://www.ncbi.nlm.nih.gov/projects/gap/eqtl/index.cgi)
(16). The gene symbol ‘MTOR’
was used as search term, and a P-value cutoff of
1.00×10⁻² was applied to identify specific eQTLs
overlooked by previous eQTL studies. As numerous eQTLs are shared
between different tissues (17), an
analysis of all studies included in the database was conducted.
Subsequently, all eQTLs of MTOR from the database were
assessed for linkage disequilibrium (LD) status by computing their
pairwise correlation coefficients (r) relative to each other using
HapMap CHB data. Tag-eQTLs were only genotyped when the
r2 value was >0.8. Haploview v4.2 software
(Broad Institute, Cambridge, MA, USA) was used to assess the LD
status and generated LD structure.
Genotype analysis
Genomic DNA was isolated from the peripheral blood
lymphocytes using a commercial Tiangen TIANamp Genomic DNA kit
(Tiangen Biotech Co., Ltd., Beijing, China). A Sequenom MassARRAY
iPLEX platform (Sequenom Inc., San Diego, CA, USA) was used to
genotype the candidate eQTLs of MTOR. Primers for genotyping
are shown in Table I. Several
measures were implemented for genotyping quality control: i)
Positive and negative (no DNA) samples were included in every assay
plate; and ii) a 5% random sample was tested twice, and the
reproducibility was 100%.
 | Table I.Information on primers used for
Sequenom MassARRAY iPLEX assays. |
Table I.
Information on primers used for
Sequenom MassARRAY iPLEX assays.
| eQTL | Primer | Sequence (5′-3′) |
|---|
| rs4845964 | 2nd-PCR Primer |
ACGTTGGATGATGCATACAAGGTGAGGTGG |
|
| 1st-PCR Primer |
ACGTTGGATGAAGTCAGGACAACACCTCCC |
|
| Extension Primer |
GCGAGATTATTCTCTTTATTCT |
| rs6668659 | 2nd-PCR Primer |
ACGTTGGATGGTGTCTCTCCCATAGTAAGC |
|
| 1st-PCR Primer |
ACGTTGGATGCACTTAGAGTTGGATGGTGG |
|
| Extension Primer | GTAAGCCCTCAGCAAA |
| rs1061622 | 2nd-PCR Primer |
ACGTTGGATGGGTAAGTGTACTGCCCCTG |
|
| 1st-PCR Primer |
ACGTTGGATGTGTAACGTGGTGGCCATCC |
|
| Extension
Primer |
TACGTGCAGACTGCATCC |
| rs527676 | 2nd-PCR Primer |
ACGTTGGATGAGAGGCTCCTGAGGAGTAGA |
|
| 1st-PCR Primer |
ACGTTGGATGCAGGTGAGAGTGCCCATATC |
|
| Extension
Primer |
GCCGGAGGAGTAGACTCAGGGAGC |
| rs1801131 | 2nd-PCR Primer |
ACGTTGGATGCCGAGAGGTAAAGAACGAAG |
|
| 1st-PCR Primer |
ACGTTGGATGAGAGCAAGTCCCCCAAGGAG |
|
| Extension
Primer |
GGACCGAAGACTTCAAAGACACTT |
| rs198388 | 2nd-PCR Primer |
ACGTTGGATGTTTCTCCCAAGTGCCTCAAG |
|
| 1st-PCR Primer |
ACGTTGGATGAGGTAGCAGGCTTTCTTTTC |
|
| Extension
Primer |
CCCTCAAGTGCTTGAGATATT |
Statistical analysis
The associations between the candidate tag-eQTLs of
MTOR and the PFS of glioma patients were estimated using the
Kaplan-Meier method, and log-rank test was used to determine the
P-values. Dominant, recessive, and additive models were used to
calculate the P-values for each candidate tag-eQTL of MTOR.
The lowest P-values from the three models were used to evaluate the
statistical significance of the associations. A multivariate Cox
model with adjustment for sex, age, and WHO grade was used to
analyze the tag-eQTLs of MTOR that were significantly
associated with glioma PFS, and hazard ratios (HRs) and their 95%
CIs were calculated for each genotype at this eQTL. Statistical
analyses were implemented in SPSS (version 13.0; SPSS Inc.,
Chicago, IL, USA). P<0.05 was considered to indicate a
statistically significant difference, and all statistical tests
were two-sided.
Results
Characteristics of the study
subjects
The clinical characteristics of the 138 glioma
patients are presented in Table II.
The total cohort consisted of 90 (65.2%) males and 48 (34.8%)
females. In total, 86 (62.3%) patients were aged >40 years and
52 (37.7%) were aged ≤40 years. Among the 124 (89.9%) patients for
whom detailed tumor WHO classification data were available, 7
(5.1%) were WHO grade I, 45 (32.6%) were WHO grade II, 29 (21.0%)
were WHO grade III, and 43 (31.2%) were WHO grade IV. All patients
underwent maximal safe resection or subtotal resection, while 95
(68.8%) and 106 (76.8%) patients also received radiotherapy and
alkylate-based chemotherapy, respectively.
| Table II.Clinical characteristics of glioma
patients (n=138). |
Table II.
Clinical characteristics of glioma
patients (n=138).
|
| Patients |
|---|
|
|
|
|---|
| Variable | No. | (%) |
|---|
| Sex |
|
|
|
Male | 90 | (65.2) |
|
Female | 48 | (34.8) |
| Age (years) |
|
|
|
≤40 | 52 | (37.7) |
|
>40 | 86 | (62.3) |
| WHO grade |
|
|
| I |
7 | (5.1) |
| II | 45 | (32.6) |
|
III | 29 | (21.0) |
| IV | 43 | (31.2) |
|
Unknown | 14 | (10.1) |
| Surgery | 138 | (100.0) |
|
Radiotherapy | 95 | (68.8) |
|
Chemotherapy | 106 | (76.8) |
Candidate eQTLs
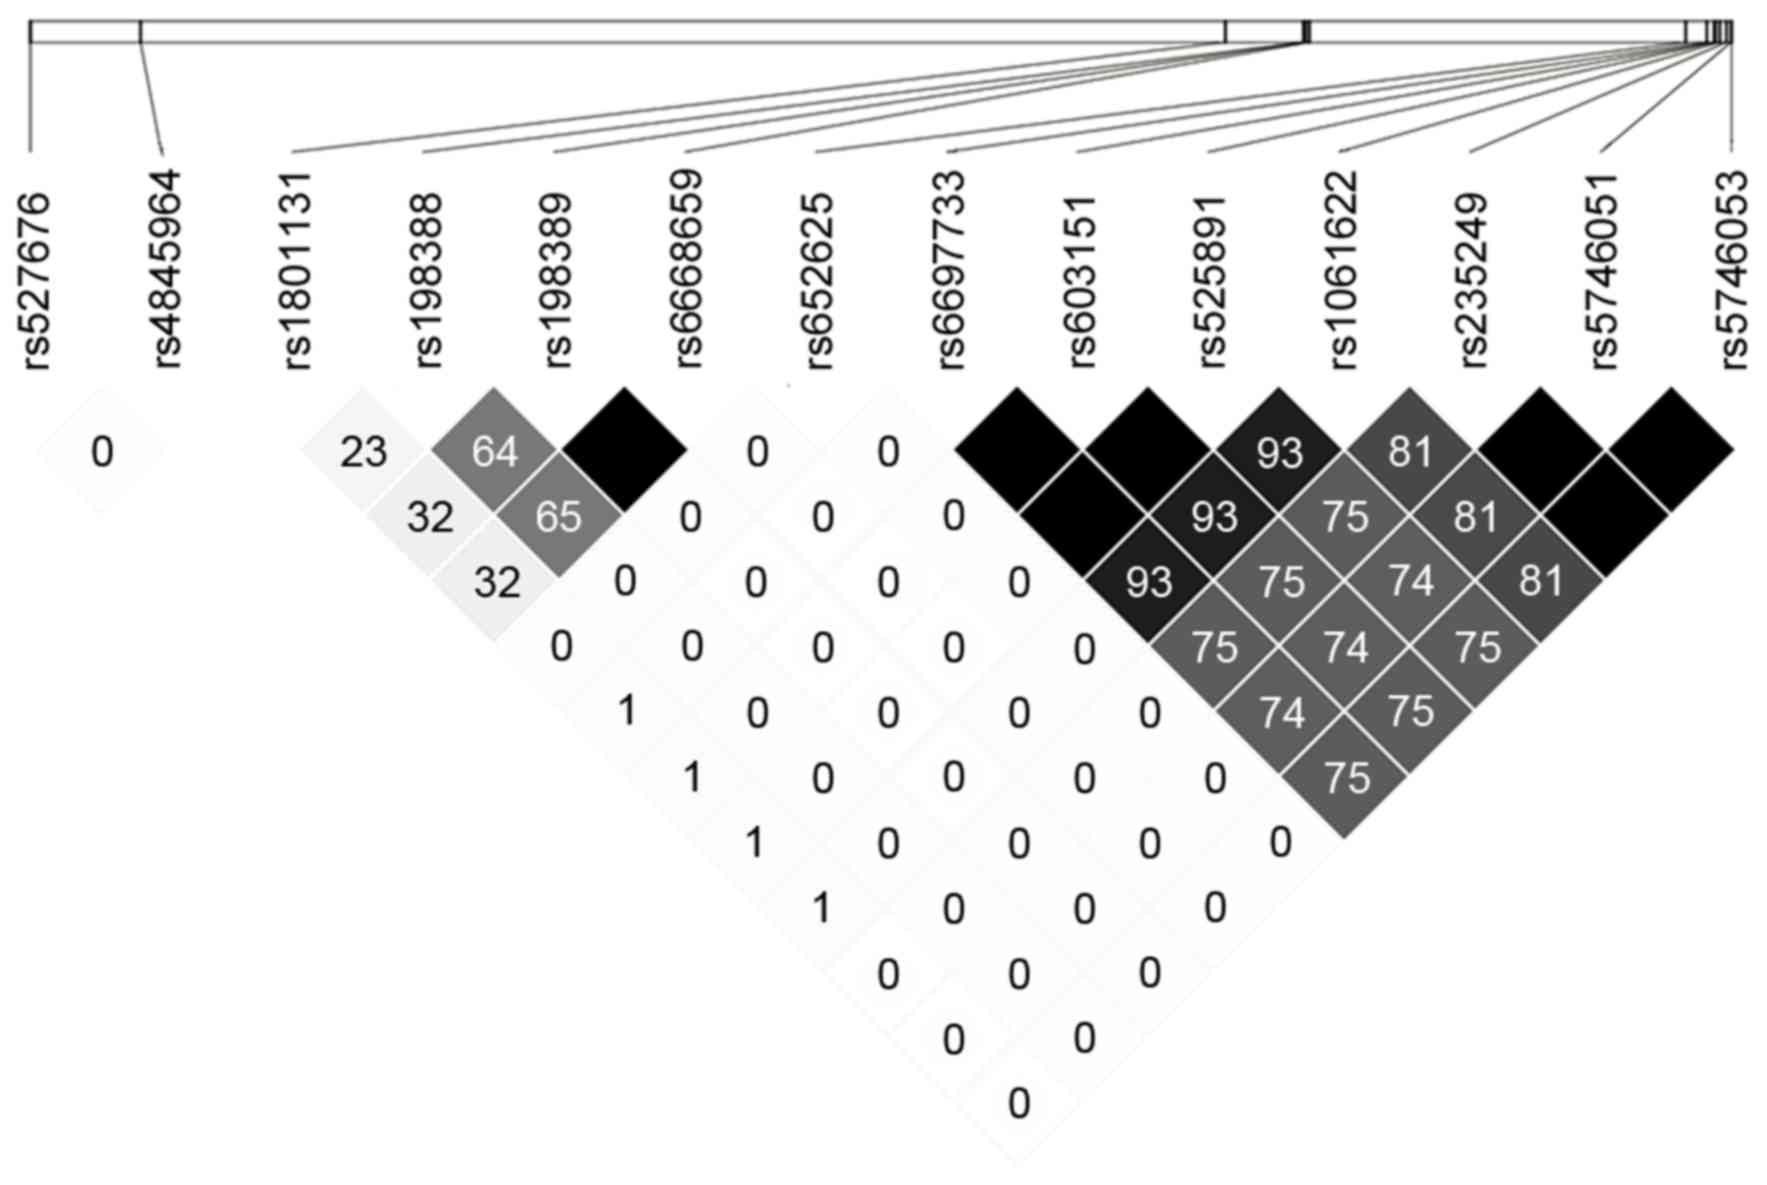
As shown in Table
III, 21 candidate eQTLs of MTOR were displayed in the
GTEx eQTL Browser based on the aforementioned search terms.
Initially, 7 overlapping eQTLs were excluded, and r-values were
then computed for the remaining 14 candidate eQTLs to assess the LD
status. The LD structure between the remaining 14 candidate eQTLs
of MTOR is shown in Fig. 1.
After excluding rs652625, whose minor allele frequency is <0.05
in the Chinese population, 6 tag-eQTLs (rs4845964, rs6668659,
rs1061622, rs527676, rs1801131 and rs198388) remained and were
selected for genotyping.
| Table III.eQTLs of MTOR displayed in
GTEx eQTL Browser. |
Table III.
eQTLs of MTOR displayed in
GTEx eQTL Browser.
| MTOR
eQTL | eQTL position | P-value |
|---|
| rs198389 | Chr 1:
11919270 |
1.3407×10⁻⁵ |
| rs235249 | Chr 1:
12258230 |
2.2680×10⁻⁵ |
| rs603151 | Chr 1:
12248290 |
2.3412×10⁻⁵ |
| rs6668659 | Chr 1:
11922297 |
2.8550×10⁻⁵ |
| rs652625 | Chr 1:
12225350 |
3.9440×10⁻⁵ |
| rs1061622 | Chr 1:
12252954 |
4.1319×10⁻⁵ |
| rs525891 | Chr 1:
12249642 |
4.1319×10⁻⁵ |
| rs6668659 | Chr 1:
11922297 |
5.0206×10⁻⁵ |
| rs603151 | Chr 1:
12248290 |
6.3759×10⁻⁵ |
| rs527676 | Chr 1:
10891776 |
6.4493×10⁻⁵ |
| rs6668659 | Chr 1:
11922297 |
6.5262×10⁻⁵ |
| rs5746053 | Chr 1:
12262297 |
7.2931×10⁻⁵ |
| rs5746053 | Chr 1:
12262297 |
7.6596×10⁻⁵ |
| rs6697733 | Chr 1:
12242457 |
9.0416×10⁻⁵ |
| rs4845964 | Chr 1:
10980543 |
9.5734×10⁻⁵ |
| rs5746051 | Chr 1:
12261971 | 0.0001 |
| rs5746051 | Chr 1:
12261971 | 0.0001 |
| rs6697733 | Chr 1:
12242457 | 0.0001 |
| rs1801131 | Chr 1:
11854475 | 0.0001 |
| rs198388 | Chr 1:
11917339 | 0.0001 |
| rs198389 | Chr 1:
11919270 | 0.0001 |
Association between the candidate
eQTLs and glioma PFS
The associations between the 6 tag-eQTLs of
MTOR and the PFS of glioma patients are presented in
Table IV. Dominant, recessive and
additive models were used to investigate these associations. Only
rs4845964 was found to be significantly associated, based on the
dominant model, with the PFS of glioma patients (P=0.0376). The
survival curve for rs4845964 based on the dominant model is shown
in Fig. 2. No significant association
was identified between the other 5 tag-eQTLs of MTOR and the
PFS of glioma patients. As shown in Table
V, the median PFS time for the patients with the rs4845964 GG
genotype was not reached, while the median PFS times were 21 months
for patients with the AG genotype and 34 months for those with the
AA genotype. Multivariate Cox model analysis demonstrated that the
adjusted HRs for the patients with the rs4845964 AG genotype or AA
genotype were 2.82 (95% CI, 1.27–6.27; P=0.0111) and 2.79 (95% CI,
1.10–7.07; P=0.0312), respectively, vs. those with the GG genotype.
Due to the nature of action of rs4845964, the HR and 95% CI for
rs4845964 were also calculated using a dominant model. Patients
with the rs4845964 AG or AA genotype had an increased risk of
progression (HR, 2.70; 95% CI, 1.25–5.82; P=0.0114) compared with
those with the GG genotype.
| Table IV.Six tag-eQTLs of MTOR and
their associations with the progression of glioma. |
Table IV.
Six tag-eQTLs of MTOR and
their associations with the progression of glioma.
|
|
|
Genotypea (138 patients) |
|
|
|---|
|
|
|
|
|
|
|---|
| MTOR
eQTL | eQTL location | Common | Heterozygous | Rare | Modelb |
P-valuec |
|---|
| rs4845964 | Downstream | 28 | 68 | 36 | Recessive | 0.8931 |
|
|
|
|
|
| Dominant |
0.0376d |
|
|
|
|
|
| Additive | 0.0656 |
| rs6668659 | Upstream | 90 | 40 | 3 | Recessive | 0.3899 |
|
|
|
|
|
| Dominant | 0.2215 |
|
|
|
|
|
| Additive | 0.4217 |
| rs1061622 | Upstream | 94 | 28 | 10 | Recessive | 0.4452 |
|
|
|
|
|
| Dominant | 0.8637 |
|
|
|
|
|
| Additive | 0.7391 |
| rs527676 | Downstream | 111 | 23 | 0 | Recessive | NC |
|
|
|
|
|
| Dominant | 0.1511 |
|
|
|
|
|
| Additive | 0.1511 |
| rs1801131 | Upstream | 76 | 51 | 5 | Recessive | 0.9649 |
|
|
|
|
|
| Dominant | 0.9519 |
|
|
|
|
|
| Additive | 0.9978 |
| rs198388 | Upstream | 90 | 42 | 2 | Recessive | 0.1912 |
|
|
|
|
|
| Dominant | 0.2540 |
|
|
|
|
|
| Additive | 0.2926 |
| Table V.HRs of rs4845964 genotypes for the
progression of glioma. |
Table V.
HRs of rs4845964 genotypes for the
progression of glioma.
|
| Patients
(n=132) |
|
|
|
|---|
| Genotype | No. | (%) | Median PFS time
(months) | HRa (95% CI) | P-value |
|---|
| GG | 28 | (21.2) | Not reached | 1.00
(Reference) | – |
| AG | 68 | (51.5) | 21 | 2.82
(1.27–6.27) | 0.0111 |
| AA | 36 | (27.3) | 34 | 2.79
(1.10–7.07) | 0.0312 |
| AG+AA | 104 | (78.8) | 22 | 2.70
(1.25–5.82) | 0.0114 |
Stratified analyses
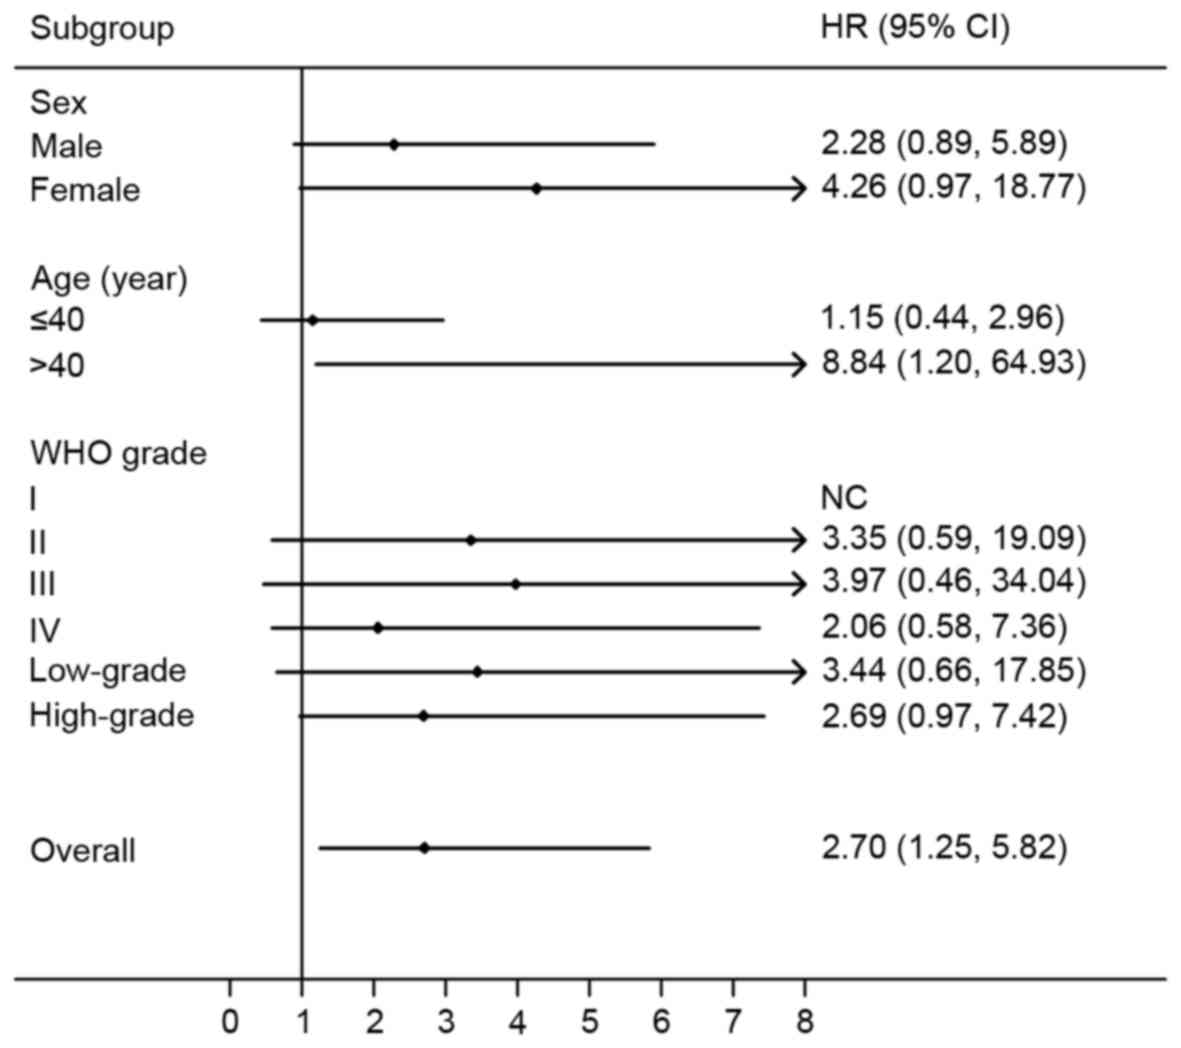
A dominant model was then used to perform stratified
analyses for rs4845964 by sex, age and WHO grade (Fig. 3). A significantly increased risk of
progression was identified in patients aged >40 years (HR, 8.84;
95% CI, 1.20–64.93; P=0.0322). There was no significant association
between rs4845964 and the PFS of glioma patients in the other
subgroups. However it was notably identified that, in all
subgroups, patients with an rs4845964 AG or AA genotype were more
likely to have a shorter PFS time. Particularly in female patients
and those with high-grade glioma, there were non-significant trends
toward worse PFS for patients with the rs4845964 AG or AA genotype.
In the stratified analysis by sex, the HR for the AG/AA vs. GG
genotype in male patients was 2.28 (95% CI, 0.89–5.89; P=0.0875),
while it was 4.26 (95% CI, 0.97–18.77; P=0.0552) for females. The
HR for the AG/AA vs. GG genotype was 1.15 (95% CI, 0.44–2.96;
P=0.7765) for patients aged ≤40 years. Furthermore, in the
stratified analysis by WHO grade, the HRs for the AG/AA vs. GG
genotype were 3.35 (95% CI, 0.59–19.09; P=0.1728) for WHO grade II
glioma, 3.97 (95% CI, 0.46–34.04; P=0.2086) for WHO grade III
glioma, and 2.06 (95% CI, 0.58–7.36; P=0.2643) for WHO grade IV
glioma. Similar results were revealed when glioma was categorized
as low-grade glioma (WHO grade I and II) and high-grade glioma (WHO
grade III and IV); deteriorative PFS times for patients with the
rs4845964 AG or AA genotypes was found in the low-grade glioma (HR,
3.44; 95% CI, 0.66–17.85; P=0.1423) and high-grade glioma (HR,
2.69; 95% CI, 0.97–7.42; P=0.0564) subgroups.
Discussion
The aim of the present study was to elucidate novel
molecular markers to improve the classification and prognosis
evaluation of glioma patients using an eQTL-based strategy. Based
on the analysis of 138 glioma patients, one eQTL of MTOR
(rs4845964) was found to be significantly associated with
progression of glioma. Stratified analyses revealed that the
associations between rs4845964 genotypes and the PFS of glioma
patients were similar in all subgroups. To the best of our
knowledge, this is the first report evaluating the association
between eQTLs of MTOR and progression of glioma.
Currently, the WHO malignancy grade of glioma
remains a cornerstone for the selection of therapeutic strategy,
and the treatments applied to the patients with the same WHO grade
are uniform (18). However, patients
with the same WHO grade often have different clinical courses,
which may be partly explained by diverse genetic backgrounds and
genomic alterations (19–21). In the past two decades, the
advancements in novel molecular markers have markedly improved
personalized therapies for glioma (3). Nevertheless, there remains a great deal
of heterogeneity not yet explained in glioma. In the present study,
an eQTL of MTOR was identified as a novel prognostic
predictor of glioma, which further demonstrated the value of
genetic variation in glioma classification.
As a pivotal component of multiple pathways, mTOR
contributes important functions in several cellular processes,
including, cell proliferation and apoptosis (5,6).
Accumulating evidence demonstrates that mTOR activity is associated
with the progression and survival of glioma cells in vitro
and in vivo (8,9,22). On the
basis of an analysis of glioma tissues, it has been demonstrated
that higher expression of phosphorylated mTOR is associated with a
less favorable clinical outcome in patients with glioblastoma
(23). Additionally, multiple studies
have revealed that mTOR inhibition can reverse chemoresistance to
temozolomide and enhance the radiosensitivity of glioma (24–27). Thus,
it is biologically plausible that genetic variations affecting the
expression level of MTOR may be associated with the clinical
outcomes of glioma. Additionally, similar trends of association
between rs4845964 and the progression of glioma were found in all
subgroups by stratified analyses. These results suggest that the
eQTL of MTOR identified in the current study may be a
valuable indicator of the progression of glioma, regardless of sex,
age and WHO grade.
In the present study, one eQTL of MTOR that
is significantly associated with the progression of glioma was
identified from six tag-eQTLs. The candidate eQTLs of MTOR
evaluated in this study were all extracted from an eQTL study
performed on lymphoblastoid cell lines from a Caucasian population
(12). Increasingly, evidence has
demonstrated that eQTLs have significant tissue specificity
(28–30). A study comparing eQTLs derived from
blood and brain also identified that, while many eQTLs are shared,
a number of tissue-specific eQTLs exist (17). These results may partly explain why
the other 5 tag-eQTLs of MTOR were not revealed to be
associated with progression of glioma. In contrast, it has been
revealed that eQTLs identified from blood can also help to explain
brain related phenotypes (17). This
result is comparable with our finding that a proportion of
MTOR eQTLs identified from lymphoblastoid cell lines are
associated with the progression of glioma. In order to identify
true eQTLs of MTOR with moderate P-values, which have been
previously overlooked by eQTL studies due to the use of a stringent
P-value threshold, a higher P-value cutoff for candidate eQTLs
selection was used in the current study. Therefore, false-positive
eQTLs of MTOR were unavoidable in candidate eQTL selection,
which is another possible reason for the failure of the other 5
tag-eQTLs of MTOR. In addition, the interethnic differences
in genetic background between Chinese and Caucasian individuals may
constitute another potential reason.
To conclude, to the best of our knowledge, this
study has demonstrated for the first time a significant association
between an eQTL of MTOR and the progression of glioma in a
Chinese population. Similar trends of association were found in all
subgroups by stratified analyses. These findings may advance our
understanding of glioma progression and improve the prognostic
evaluation of glioma.
Acknowledgements
This study was supported by the National Natural
Science Foundation of China (grant no. 81301772), and the Natural
Science Foundation of Fujian Province, China (grant no.
2014J05087).
References
|
1
|
Schwartzbaum JA, Fisher JL, Aldape KD and
Wrensch M: Epidemiology and molecular pathology of glioma. Nat Clin
Pract Neurol. 2:494–503. 2006. View Article : Google Scholar : PubMed/NCBI
|
|
2
|
Louis DN, Ohgaki H, Wiestler OD, Cavenee
WK, Burger PC, Jouvet A, Scheithauer BW and Kleihues P: The 2007
WHO classification of tumours of the central nervous system. Acta
Neuropathol. 114:97–109. 2007. View Article : Google Scholar : PubMed/NCBI
|
|
3
|
Siegal T: Clinical impact of molecular
biomarkers in gliomas. J Clin Neurosci. 22:437–444. 2015.
View Article : Google Scholar : PubMed/NCBI
|
|
4
|
Parker NR, Khong P, Parkinson JF, Howell
VM and Wheeler HR: Molecular heterogeneity in glioblastoma:
Potential clinical implications. Front Oncol. 5:552015. View Article : Google Scholar : PubMed/NCBI
|
|
5
|
Laplante M and Sabatini DM: mTOR signaling
in growth control and disease. Cell. 149:274–293. 2012. View Article : Google Scholar : PubMed/NCBI
|
|
6
|
Wullschleger S, Loewith R and Hall MN: TOR
signaling in growth and metabolism. Cell. 124:471–484. 2006.
View Article : Google Scholar : PubMed/NCBI
|
|
7
|
Parsons DW, Jones S, Zhang X, Lin JC,
Leary RJ, Angenendt P, Mankoo P, Carter H, Siu IM, Gallia GL, et
al: An integrated genomic analysis of human glioblastoma
multiforme. Science. 321:1807–1812. 2008. View Article : Google Scholar : PubMed/NCBI
|
|
8
|
Cheng CK, Fan QW and Weiss WA: PI3K
signaling in glioma-animal models and therapeutic challenges. Brain
Pathol. 19:112–120. 2009. View Article : Google Scholar : PubMed/NCBI
|
|
9
|
Kubiatowski T, Jang T, Lachyankar MB,
Salmonsen R, Nabi RR, Quesenberry PJ, Litofsky NS, Ross AH and
Recht LD: Association of increased phosphatidylinositol 3-kinase
signaling with increased invasiveness and gelatinase activity in
malignant gliomas. J Neurosurg. 95:480–488. 2001. View Article : Google Scholar : PubMed/NCBI
|
|
10
|
Gibbs JR, van der Brug MP, Hernandez DG,
Traynor BJ, Nalls MA, Lai SL, Arepalli S, Dillman A, Rafferty IP,
Troncoso J, et al: Abundant quantitative trait loci exist for DNA
methylation and gene expression in human brain. PLoS Genet.
6:e10009522010. View Article : Google Scholar : PubMed/NCBI
|
|
11
|
Schadt EE, Molony C, Chudin E, Hao K, Yang
X, Lum PY, Kasarskis A, Zhang B, Wang S, Suver C, et al: Mapping
the genetic architecture of gene expression in human liver. PLoS
Biol. 6:e1072008. View Article : Google Scholar : PubMed/NCBI
|
|
12
|
Montgomery SB, Sammeth M,
Gutierrez-Arcelus M, Lach RP, Ingle C, Nisbett J, Guigo R and
Dermitzakis ET: Transcriptome genetics using second generation
sequencing in a Caucasian population. Nature. 464:773–777. 2010.
View Article : Google Scholar : PubMed/NCBI
|
|
13
|
Nicolae DL, Gamazon E, Zhang W, Duan S,
Dolan ME and Cox NJ: Trait-associated SNPs are more likely to be
eQTLs: Annotation to enhance discovery from GWAS. PLoS Genet.
6:e10008882010. View Article : Google Scholar : PubMed/NCBI
|
|
14
|
Hulur I, Gamazon ER, Skol AD, Xicola RM,
Llor X, Onel K, Ellis NA and Kupfer SS: Enrichment of inflammatory
bowel disease and colorectal cancer risk variants in colon
expression quantitative trait loci. BMC Genomics. 16:1382015.
View Article : Google Scholar : PubMed/NCBI
|
|
15
|
Huang L, Xu W, Yan D, Dai L and Shi X:
Identification of expression quantitative trait loci of RPTOR for
susceptibility to glioma. Tumour Biol. 37:2305–2311. 2016.
View Article : Google Scholar : PubMed/NCBI
|
|
16
|
GTEx Consortium, . The genotype-tissue
expression (GTEx) project. Nat Genet. 45:580–585. 2013. View Article : Google Scholar : PubMed/NCBI
|
|
17
|
Hernandez DG, Nalls MA, Moore M, Chong S,
Dillman A, Trabzuni D, Gibbs JR, Ryten M, Arepalli S, Weale ME, et
al: Integration of GWAS SNPs and tissue specific expression
profiling reveal discrete eQTLs for human traits in blood and
brain. Neurobiol Dis. 47:20–28. 2012. View Article : Google Scholar : PubMed/NCBI
|
|
18
|
Vigneswaran K, Neill S and Hadjipanayis
CG: Beyond the World Health Organization grading of infiltrating
gliomas: Advances in the molecular genetics of glioma
classification. Ann Transl Med. 3:952015.PubMed/NCBI
|
|
19
|
Fogli A, Chautard E, Vaurs-Barrière C,
Pereira B, Müller-Barthélémy M, Court F, Biau J, Pinto AA, Kémény
JL, Khalil T, et al: The tumoral A genotype of the MGMT rs34180180
single-nucleotide polymorphism in aggressive gliomas is associated
with shorter patients' survival. Carcinogenesis. 37:169–176. 2016.
View Article : Google Scholar : PubMed/NCBI
|
|
20
|
de Castro J Vieira, Goncalves CS, Costa S,
Linhares P, Vaz R, Nabiço R, Amorim J, Viana-Pereira M, Reis RM and
Costa BM: Impact of TGF-β1-509C/T and 869T/C polymorphisms on
glioma risk and patient prognosis. Tumour Biol. 36:6525–6532. 2015.
View Article : Google Scholar : PubMed/NCBI
|
|
21
|
Hegi ME, Diserens AC, Gorlia T, Hamou MF,
de Tribolet N, Weller M, Kros JM, Hainfellner JA, Mason W, Mariani
L, et al: MGMT gene silencing and benefit from temozolomide in
glioblastoma. N Engl J Med. 352:997–1003. 2005. View Article : Google Scholar : PubMed/NCBI
|
|
22
|
Hu X, Pandolfi PP, Li Y, Koutcher JA,
Rosenblum M and Holland EC: mTOR promotes survival and astrocytic
characteristics induced by Pten/AKT signaling in glioblastoma.
Neoplasia. 7:356–368. 2005. View Article : Google Scholar : PubMed/NCBI
|
|
23
|
Pelloski CE, Lin E, Zhang L, Yung WK,
Colman H, Liu JL, Woo SY, Heimberger AB, Suki D, Prados M, et al:
Prognostic associations of activated mitogen-activated protein
kinase and Akt pathways in glioblastoma. Clin Cancer Res.
12:3935–3941. 2006. View Article : Google Scholar : PubMed/NCBI
|
|
24
|
Garros-Regulez L, Aldaz P, Arrizabalaga O,
Moncho-Amor V, Carrasco-Garcia E, Manterola L, Moreno-Cugnon L,
Barrena C, Villanua J, Ruiz I, et al: mTOR inhibition decreases
SOX2-SOX9 mediated glioma stem cell activity and temozolomide
resistance. Expert Opin Ther Targets. 20:393–405. 2016. View Article : Google Scholar : PubMed/NCBI
|
|
25
|
Wang WJ, Long LM, Yang N, Zhang QQ, Ji WJ,
Zhao JH, Qin ZH, Wang Z, Chen G and Liang ZQ: NVP-BEZ235, a novel
dual PI3K/mTOR inhibitor, enhances the radiosensitivity of human
glioma stem cells in vitro. Acta Pharmacol Sin. 34:681–690. 2013.
View Article : Google Scholar : PubMed/NCBI
|
|
26
|
Kahn J, Hayman TJ, Jamal M, Rath BH, Kramp
T, Camphausen K and Tofilon PJ: The mTORC1/mTORC2 inhibitor AZD2014
enhances the radiosensitivity of glioblastoma stem-like cells.
Neuro Oncol. 16:29–37. 2014. View Article : Google Scholar : PubMed/NCBI
|
|
27
|
Yu Z, Xie G, Zhou G, Cheng Y, Zhang G, Yao
G, Chen Y, Li Y and Zhao G: NVP-BEZ235, a novel dual PI3K-mTOR
inhibitor displays anti-glioma activity and reduces chemoresistance
to temozolomide in human glioma cells. Cancer Lett. 367:58–68.
2015. View Article : Google Scholar : PubMed/NCBI
|
|
28
|
Nica AC and Dermitzakis ET: Expression
quantitative trait loci: Present and future. Philos Trans R Soc
Lond B Biol Sci. 368:201203622013. View Article : Google Scholar : PubMed/NCBI
|
|
29
|
Grundberg E, Small KS, Hedman AK, Nica AC,
Buil A, Keildson S, Bell JT, Yang TP, Meduri E, Barrett A, et al:
Mapping cis- and trans-regulatory effects across multiple tissues
in twins. Nat Genet. 44:1084–1089. 2012. View Article : Google Scholar : PubMed/NCBI
|
|
30
|
Petretto E, Mangion J, Dickens NJ, Cook
SA, Kumaran MK, Lu H, Fischer J, Maatz H, Kren V, Pravenec M, et
al: Heritability and tissue specificity of expression quantitative
trait loci. PLoS Genet. 2:e1722006. View Article : Google Scholar : PubMed/NCBI
|