Introduction
Lung cancer, predominantly non-small cell lung
cancer (NSCLC), is the most commonly diagnosed malignancy and is a
leading cause of cancer-related deaths worldwide (1,2). Diagnosis
often occurs in late-stage disease, when most patients have missed
the optimal window for surgery, so prognosis is usually poor.
However, genomic profiling of tumor tissues can identify biomarkers
for early diagnosis of NSCLC and its therapy. Early-diagnosed
patients have considerably favorable prognosis, although divergence
still exists among patients with similar clinical characteristics
(3). This phenomenon indicates the
importance of improved understanding of genetic and molecular
heterogeneity among these patients.
Intratumor heterogeneity has been shown using
somatic mutations and DNA copy number alterations among several
cancers, including lung cancer (4,5), and is
associated with worse clinical outcomes (6–10). Several
methods have been proposed to explore tumor heterogeneity (11–14).
However, most previous investigations are small-scale studies or
single cell analyses, which are difficult to extend to large
populations. Recently, a study has proposed a new method,
mutant-allele tumor heterogeneity (MATH), that has been
successfully applied in head and neck squamous cell carcinoma
(HNSC) populations to differentiate patient prognosis (15–18).
However, MATH is not generalizable to lung cancer using data from
The Cancer Genome Atlas (TCGA), potentially due to different
distribution patterns of mutational fractions they cannot fully
reflect in lung cancer populations.
Therefore, we propose a measurement to describe
mutant-allele fraction (MAF) heterogeneity that was evaluated based
on whole exome sequencing of tumor and matched normal DNA (19) in lung cancer populations from TCGA
(20). The proposed statistic
successfully measures tumor heterogeneity and appears to be a novel
prognostic biomarker for NSCLC.
Materials and methods
Study population
Clinical and tumor characteristic information and
tumor-specific somatic mutation data of lung cancer were obtained
from TCGA on June 23, 2016 including lung adenocarcinomas (LUAD)
and squamous cell carcinomas (LUSC). Somatic mutations were
identified from whole exome sequencing data by the TCGA Broad
Institute Team, and followed by standard quality control processed
(21–23) and VarScan algorithm (24). Patients with missing follow-up
information were excluded. Total TCGA data included 939 NSCLC cases
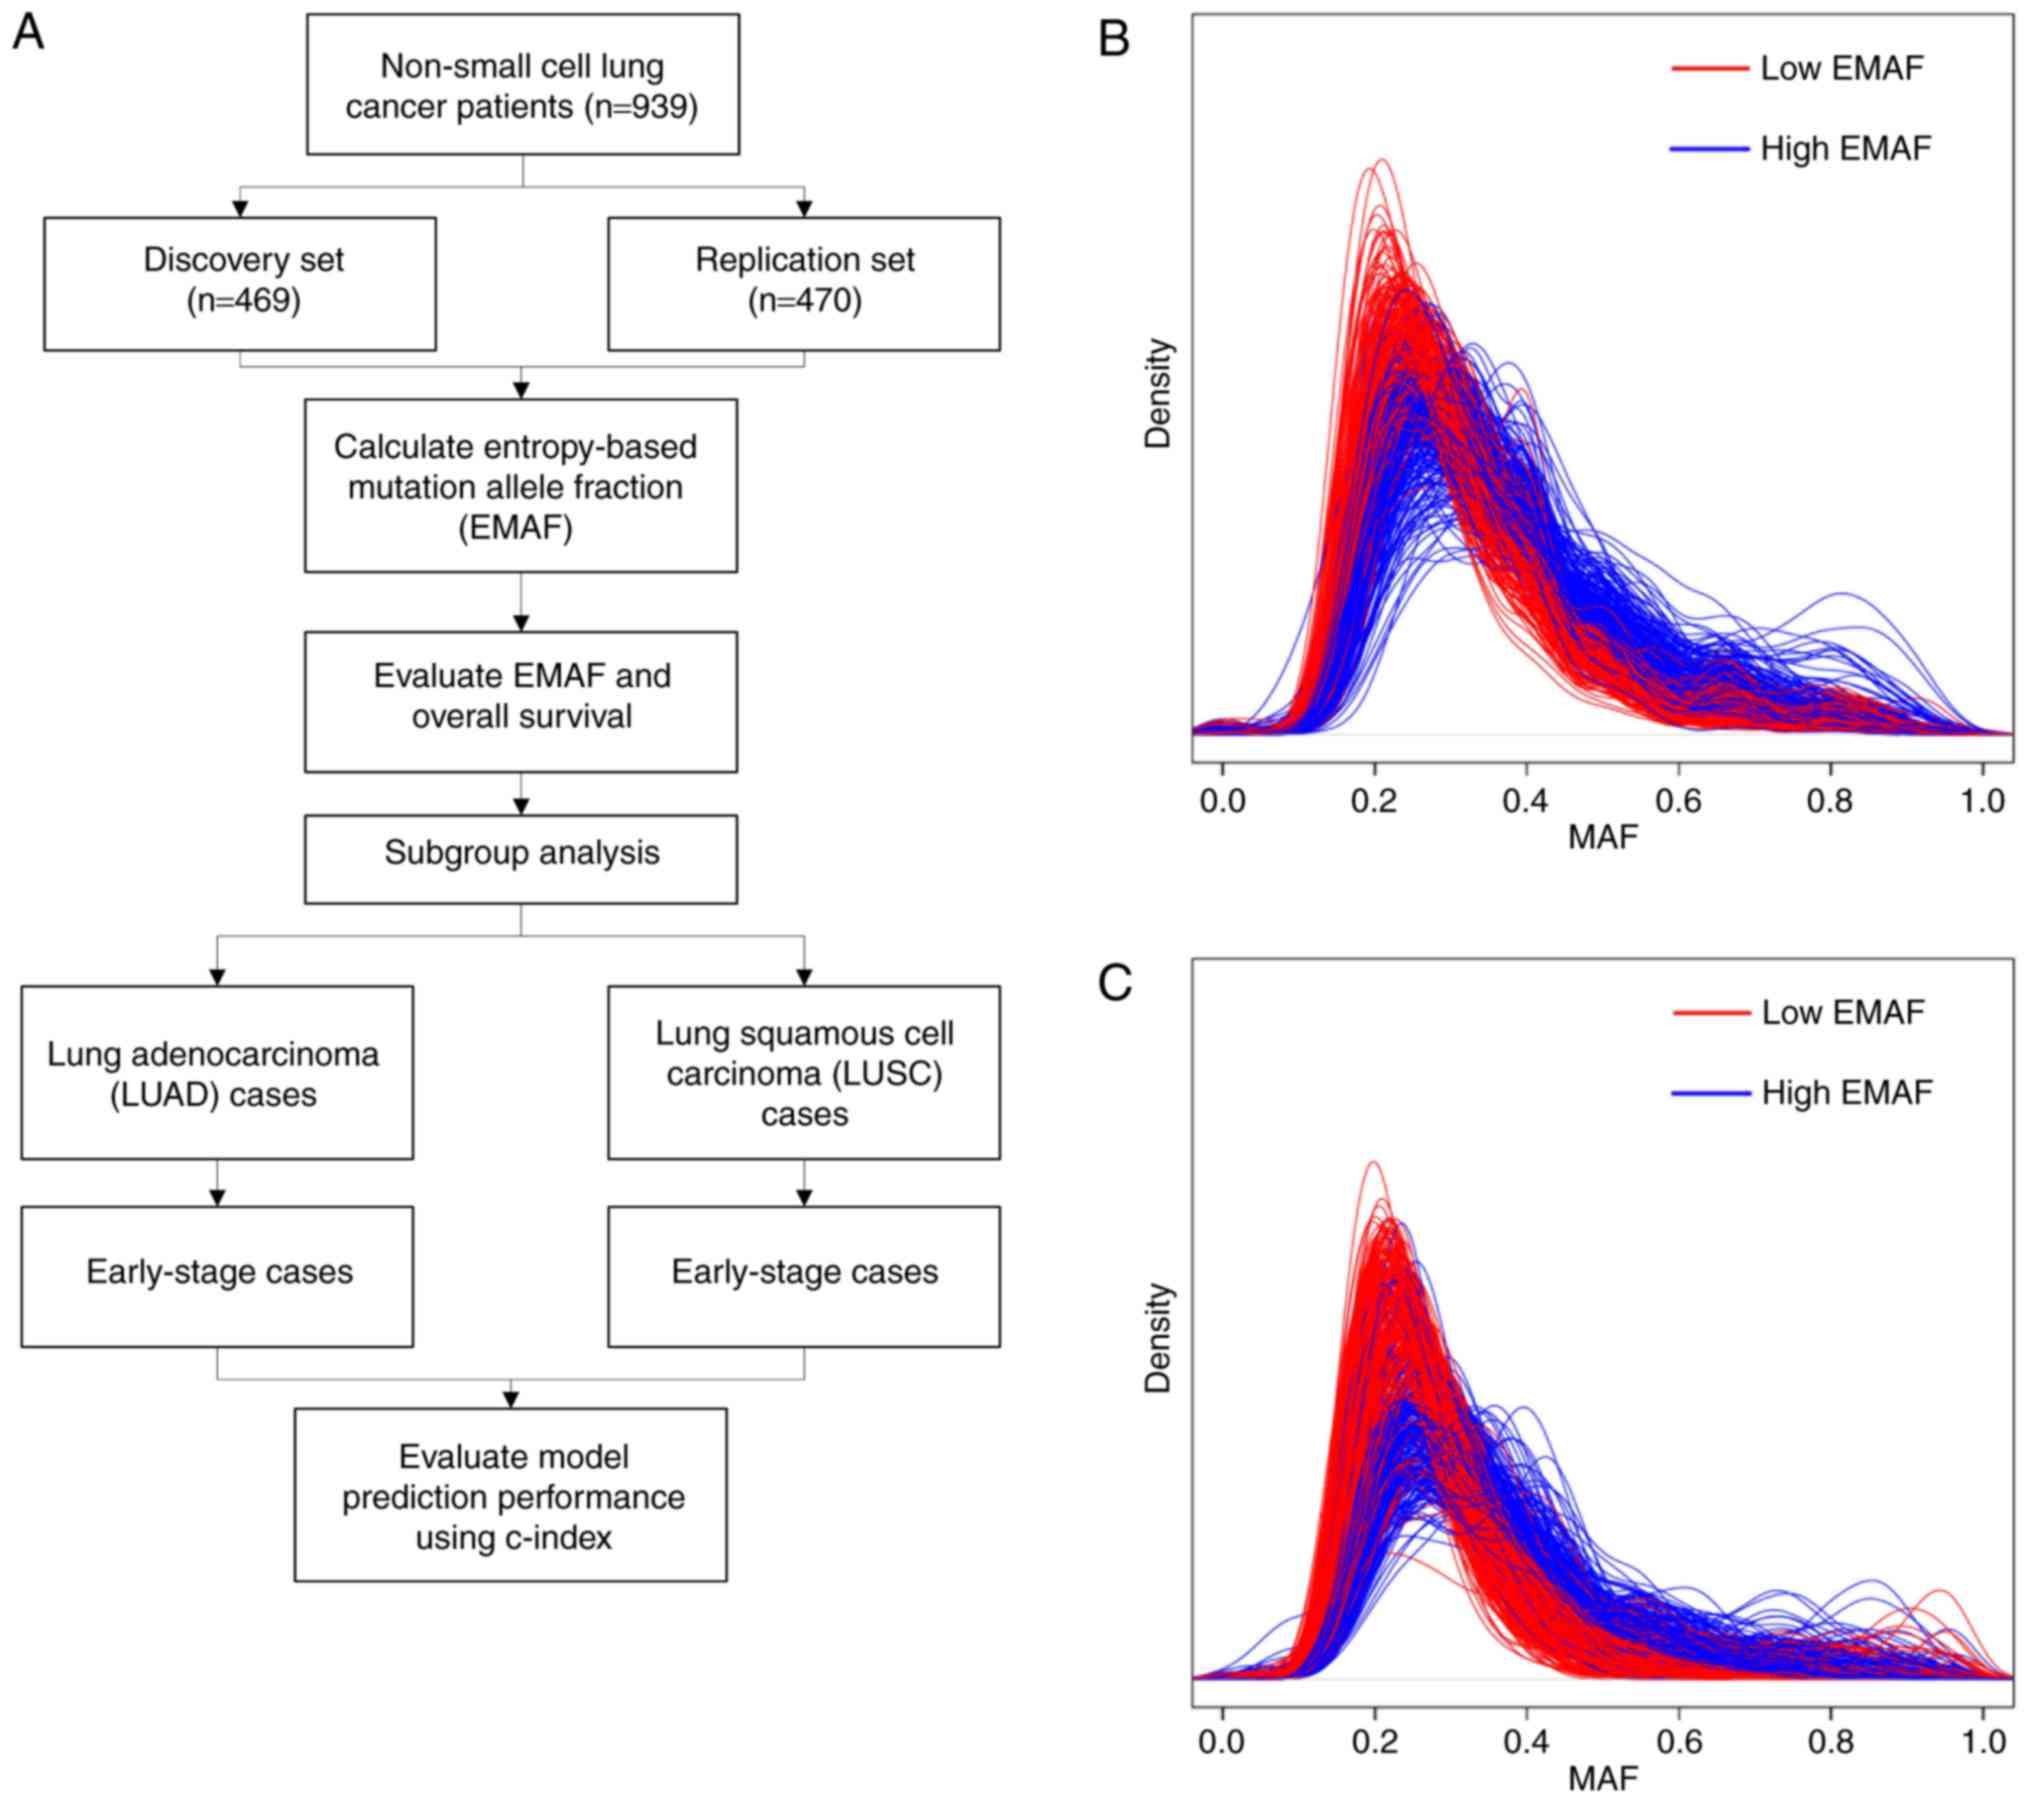
with both clinical information and mutation data. We randomly
divided them into two datasets equally: Discovery set and
replication set.
MAF
To identify genomic loci that had tumor-specific
mutations based on tumor-normal pairs, the number of mutant reads
and reference allele reads at each mutant locus was obtained from
whole exome sequencing data of tumor and adjacent normal tissues.
MAF, also called variant allele frequency (VAF), was calculated
as:
MAF=mutant readsmutant reads+reference
reads
As reported previously, MAF was influenced by
presence of sub-clonal mutations and copy number alterations, which
are higher when a locus is mutated earlier in a clonal evolution or
undergoes allele-specific amplification (17). The patients usually had a number of
mutant loci, leading to different MAF values (most of them were
hundreds) within each patient. As well, the distribution of MAF
values within each patient was unique and differed from the
others.
Further, we referred the theory of information
entropy to describe MAF heterogeneity from the MAF values. Entropy
measures a quantity of uncertainty (25), and is originally defined by a discrete
random variable (26):
H(x)=∑piIi=–∑pilogpi
In case of continuous MAF, the value was categorized
into bins by length ∆ (∆→0). Thus, the entropy for a continuous
variable was:
HC(x)=–∑Δf(xi)logf(xi)=–∫f(x)logf(x)dx
Where f(x) is the probability density
function of x. We named it entropy-based MAF (EMAF).
To estimate it, we smoothed MAF distribution by
kernel function θ (27), which
measures ‘similarity’ between pairs of samples Xn and
Xn. Kernel density estimation is of the form:
pr(xn)=1N∑i=1nΘ|(xn–xn′|–r)
Where θ is the default step kernel [θ (x>0)=0, θ
(x≤0)=1], |xn-xn'| represents distance
between paired samples, and r is kernel width.
MATH method
MATH is a simple method that calculates the variance
of MAF values. In MATH, the median absolute deviation (MAD) of MAF
values was calculated first: MAD = (|xi
-median(x)|). MATH was calculated as 100xMAD/median.
Further, calculation of MAD followed with values scaled by a
constant factor (1.4826) so that the expected MAD of a sample from
a normal distribution equals the standard deviation (15).
Statistical analysis
Continuous variables were described as mean ± SD and
compared by student's t-test, while categorized variables were
summarized by frequency (n) and compared by Fisher's exact test.
General linear model was used to compare EMAFs with other
characteristics. Associations between EMAF and overall survival
were evaluated by Cox proportional hazard models with adjustment
for common clinical variables (age, gender, smoking status,
clinical stage, T classification, N classification and histology
type). Survival curves were drawn with the Kaplan-Meier method and
were compared among subgroups using log-rank tests. C-index was
used for evaluating overall adequacy of risk prediction procedures
with censored survival data (28).
Statistical analyses were performed using R v.3.2.2
(The R Foundation). P-values were two-sided and P<0.05 was
considered to indicate a statistically significant difference.
Results
Demographic and clinical
characteristics
The 939 lung cancer cases were equally divided into
the discovery set and replication set (Table I). The discovery set (n=469) had an
average age of 65.82±9.72 years, ranging from 33–86 years, and 111
(23.0%) individuals were followed until death. Of them, 80.4% had
early stage disease (stage I–II). Among the 470 cases in the
replication set, they had an average age of 66.29±9.06 years,
ranging from 38–90 years, and 127 (27.0%) individuals were followed
until death. 81.0% had early stage disease in the replication set.
The comparisons of baseline information in the two sets were all
non-significant (P>0.05).
 | Table I.Demographic and clinical
characteristics of lung cancer patients in The Cancer Genome
Atlas. |
Table I.
Demographic and clinical
characteristics of lung cancer patients in The Cancer Genome
Atlas.
| Characteristic | Discovery set
(n=469) | Replication set
(n=470) | P-value |
|---|
| Median survival
time (months) | 45.30 | 41.33 | 0.326 |
| Censored rate
(%) | 76.33 | 72.97 | 0.260 |
| Age (year) | 65.82±9.72 | 66.29±9.06 | 0.443 |
| Gender |
|
|
|
|
Male | 268 | 295 | 0.083 |
|
Female | 201 | 175 |
|
| Race |
|
| 0.851 |
|
White | 370 | 348 |
|
|
American Indian/Alaska
native | 1 | 0 |
|
|
Asian | 8 | 8 |
|
|
Black/African American | 28 | 31 |
|
|
Missing | 62 | 83 |
|
| Tobacco
history |
|
| 0.776 |
| Never
smoke/quit >15 y | 142 | 146 |
|
| Current
smoker/quit <15 y | 310 | 318 |
|
|
Missing | 17 | 16 |
|
| Histology type |
|
| 0.896 |
|
Adenocarcinoma | 231 | 229 |
|
|
Squamous cell carcinoma | 238 | 241 |
|
| T
classification |
|
| 0.657 |
| T1 | 140 | 123 |
|
| T2 | 251 | 273 |
|
| T3 | 54 | 53 |
|
| T4 | 22 | 20 |
|
| Missing
or not available | 2 | 1 |
|
| N
classification |
|
| 0.148 |
| N0 | 309 | 290 |
|
| N1 | 108 | 102 |
|
| N2 | 44 | 61 |
|
| N3 | 2 | 5 |
|
| Missing
or not available | 6 | 12 |
|
| M
classification |
|
| 0.903 |
| M0 | 350 | 349 |
|
| M1 | 16 | 14 |
|
| Missing
or not available | 103 | 107 |
|
| Clinical stage |
|
| 0.826 |
| I | 243 | 236 |
|
| II | 134 | 130 |
|
|
III | 74 | 84 |
|
| IV | 18 | 20 |
|
MATH in NSCLC cases
We applied MATH method to NSCLC cases to determine
if the method was applicable to cancers beyond HNSC. Using
multivariable Cox regression model adjusted for age, gender,
smoking status, histology type and clinical stage, MATH showed
non-significant associations with survival for either discovery set
(HR=1.17; 95% CI: 0.80–1.72; P=0.409) or replication set (HR=0.85;
95% CI: 0.51–1.40; P=0.533) cases. The results may reveal MATH is
not generalizable in lung cancer.
MAF and EMAF profiles
We categorized the EMAF values into high- and
low-EMAF group by the median value within each dataset. Kernel
smoothed distributions of MAF values of discovery and replication
cases were shown in Fig. 1B and C.
The distributions of cases with lower EMAF scores tended to have a
smaller uncertainty. In the discovery set, EMAF ranged from 1.87 to
3.02, with a mean of 2.77 and a median of 2.79. The relation
between EMAF and clinical stage was not statistically significant
(β=−0.003, P=0.248). In the replication set, EMAF ranged from 1.94
to 3.02, with a mean of 2.78 and a median of 2.81. EMAF also showed
no relationship with the clinical stage (β=0.001, P=0.859). This
might indicate that EMAF was independent from clinical stage.
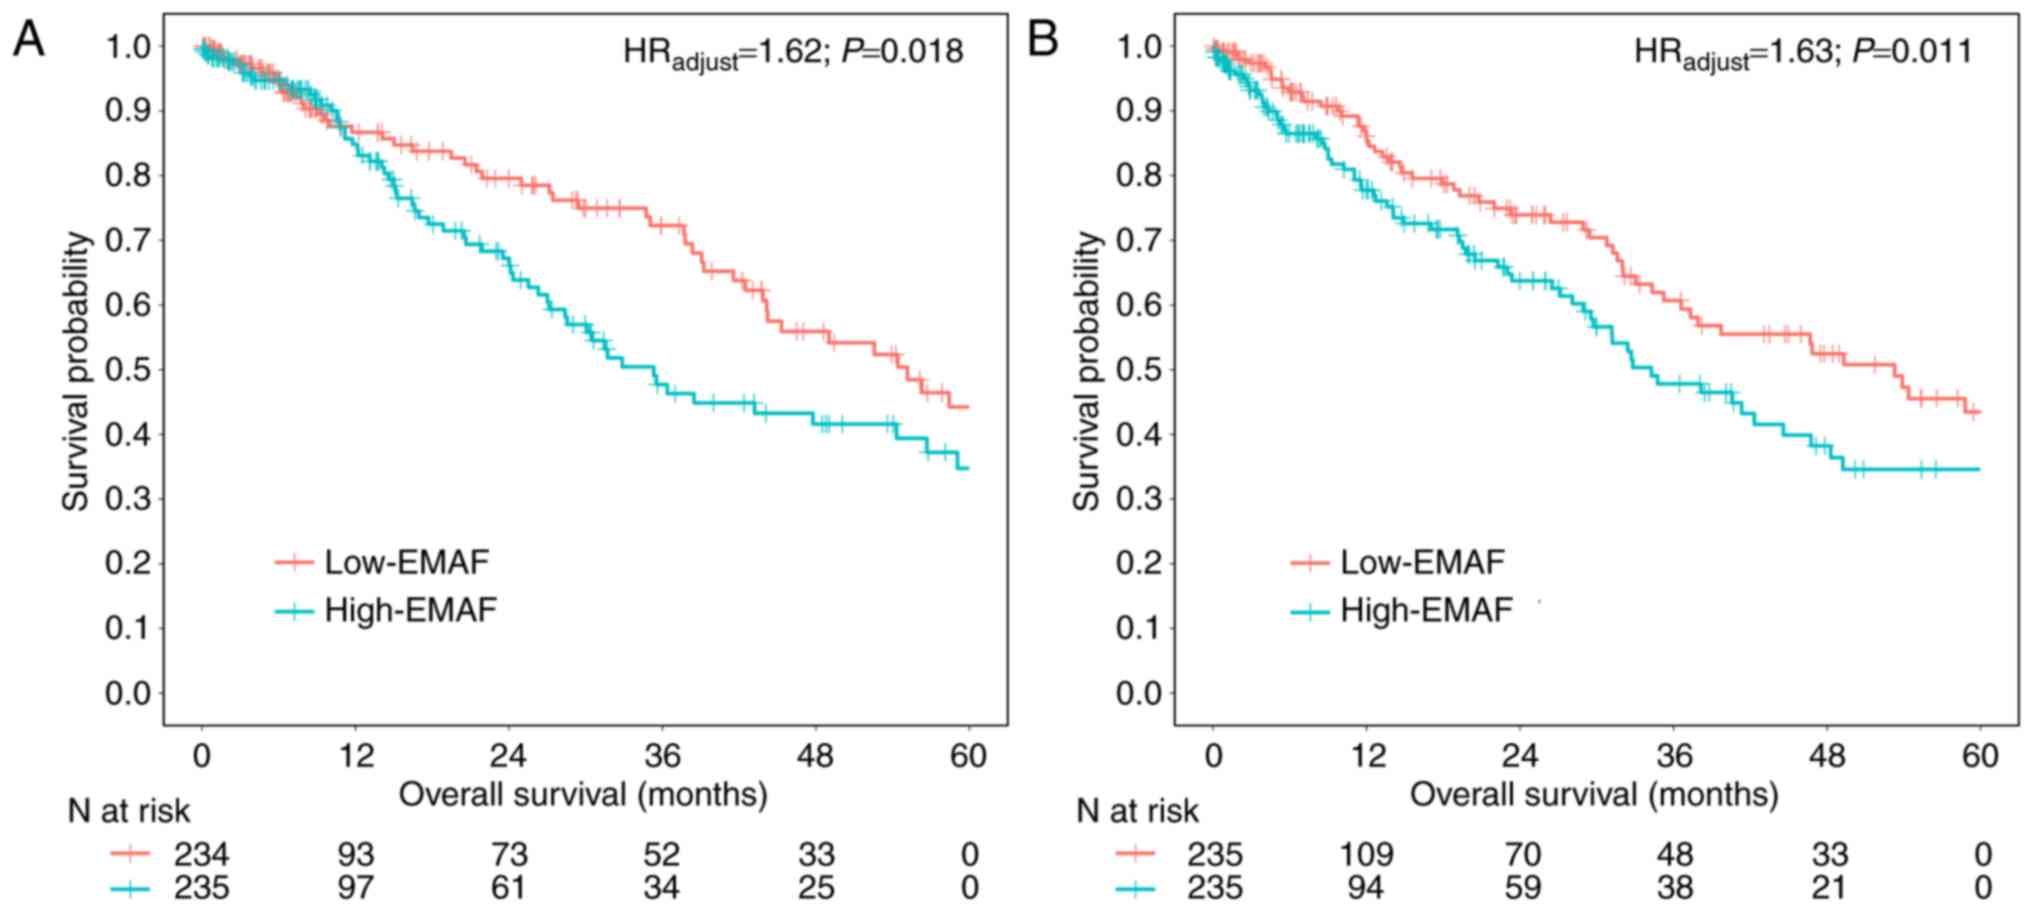
EMAF and clinical outcome
Univariate Cox regression showed a 1.50 times higher
risk of death for the high-EMAF group compared to the low-EMAF
group in the discovery set (HRunadjust=1.50; 95% CI:
1.03–2.18; P=0.035), and a 1.47 times in the replication set
(HRunadjust=1.47; 95% CI: 1.04–2.09; P=0.031). Results
retained statistical significance with further adjustment for
covariates, including age, gender, smoking status, clinical stage,
T classification, N classification and histology type for the
discovery set (HRadjust=1.62; 95% CI: 1.08–2.41;
P=0.018) (Fig. 2A) and replication
set (HRadjust=1.63; 95% CI: 1.11–2.37; P=0.011)
(Fig. 2B). We did find a relationship
between MAF heterogeneity and clinical outcome (overall survival)
(Table II).
| Table II.Cox regression analysis of clinical
characteristics and EMAF. |
Table II.
Cox regression analysis of clinical
characteristics and EMAF.
|
| Discovery set
(n=469) | Replication set
(n=470) |
|---|
|
|
|
|
|---|
|
| Univariable | Multivariable | Univariable | Multivariable |
|---|
|
|
|
|
|
|
|---|
|
Characteristics | HR (95% CI) | P-value | HR (95% CI) | P-value | HR (95% CI) | P-value | HR (95% CI) | P-value |
|---|
| High EMAF | 1.50
(1.03–2.18) | 0.035 | 1.62
(1.08–2.41) | 0.018 | 1.47
(1.04–2.09) | 0.031 | 1.63
(1.11–2.37) | 0.011 |
| Age (per year) | 0.99
(0.97–1.01) | 0.708 | 1.00
(0.98–1.03) | 0.660 | 1.01
(0.99–1.04) | 0.065 | 1.02
(1.00–1.04) | 0.034 |
| Gender
(Female) | 1.01
(0.69–1.47) | 0.951 | 0.93
(0.62–1.39) | 0.726 | 0.92
(0.64–1.33) | 0.681 | 0.96
(0.64–1.46) | 0.878 |
| Clinical Stage (per
stage) | 1.55
(1.28–1.89) | <0.001 | 1.34
(0.98–1.84) | 0.064 | 1.36
(1.15–1.62) | <0.001 | 0.98
(0.71–1.37) | 0.951 |
| Smoking status
(Current smoker/quit <15 y) | 0.79
(0.65–0.96) | 0.021 | 0.82
(0.67–1.00) | 0.058 | 1.04
(0.87–1.24) | 0.615 | 0.96
(0.79–1.16) | 0.681 |
| T classification
(per stage) | 1.34
(1.07–1.68) | 0.009 | 1.05
(0.80–1.39) | 0.702 | 1.56
(1.24–1.95) | <0.001 | 1.54
(1.15–2.06) | 0.003 |
| N classification
(per stage) | 1.49
(1.18–1.87) | <0.001 | 1.16
(0.84–1.59) | 0.368 | 1.43
(1.16–1.77) | <0.001 | 1.35
(0.97–1.90) | 0.074 |
| Histology type
(LUSC) | 0.75
(0.52–1.09) | 0.143 | 0.75
(0.50–1.13) | 0.179 | 1.14
(0.80–1.63) | 0.452 | 1.10
(0.72–1.69) | 0.637 |
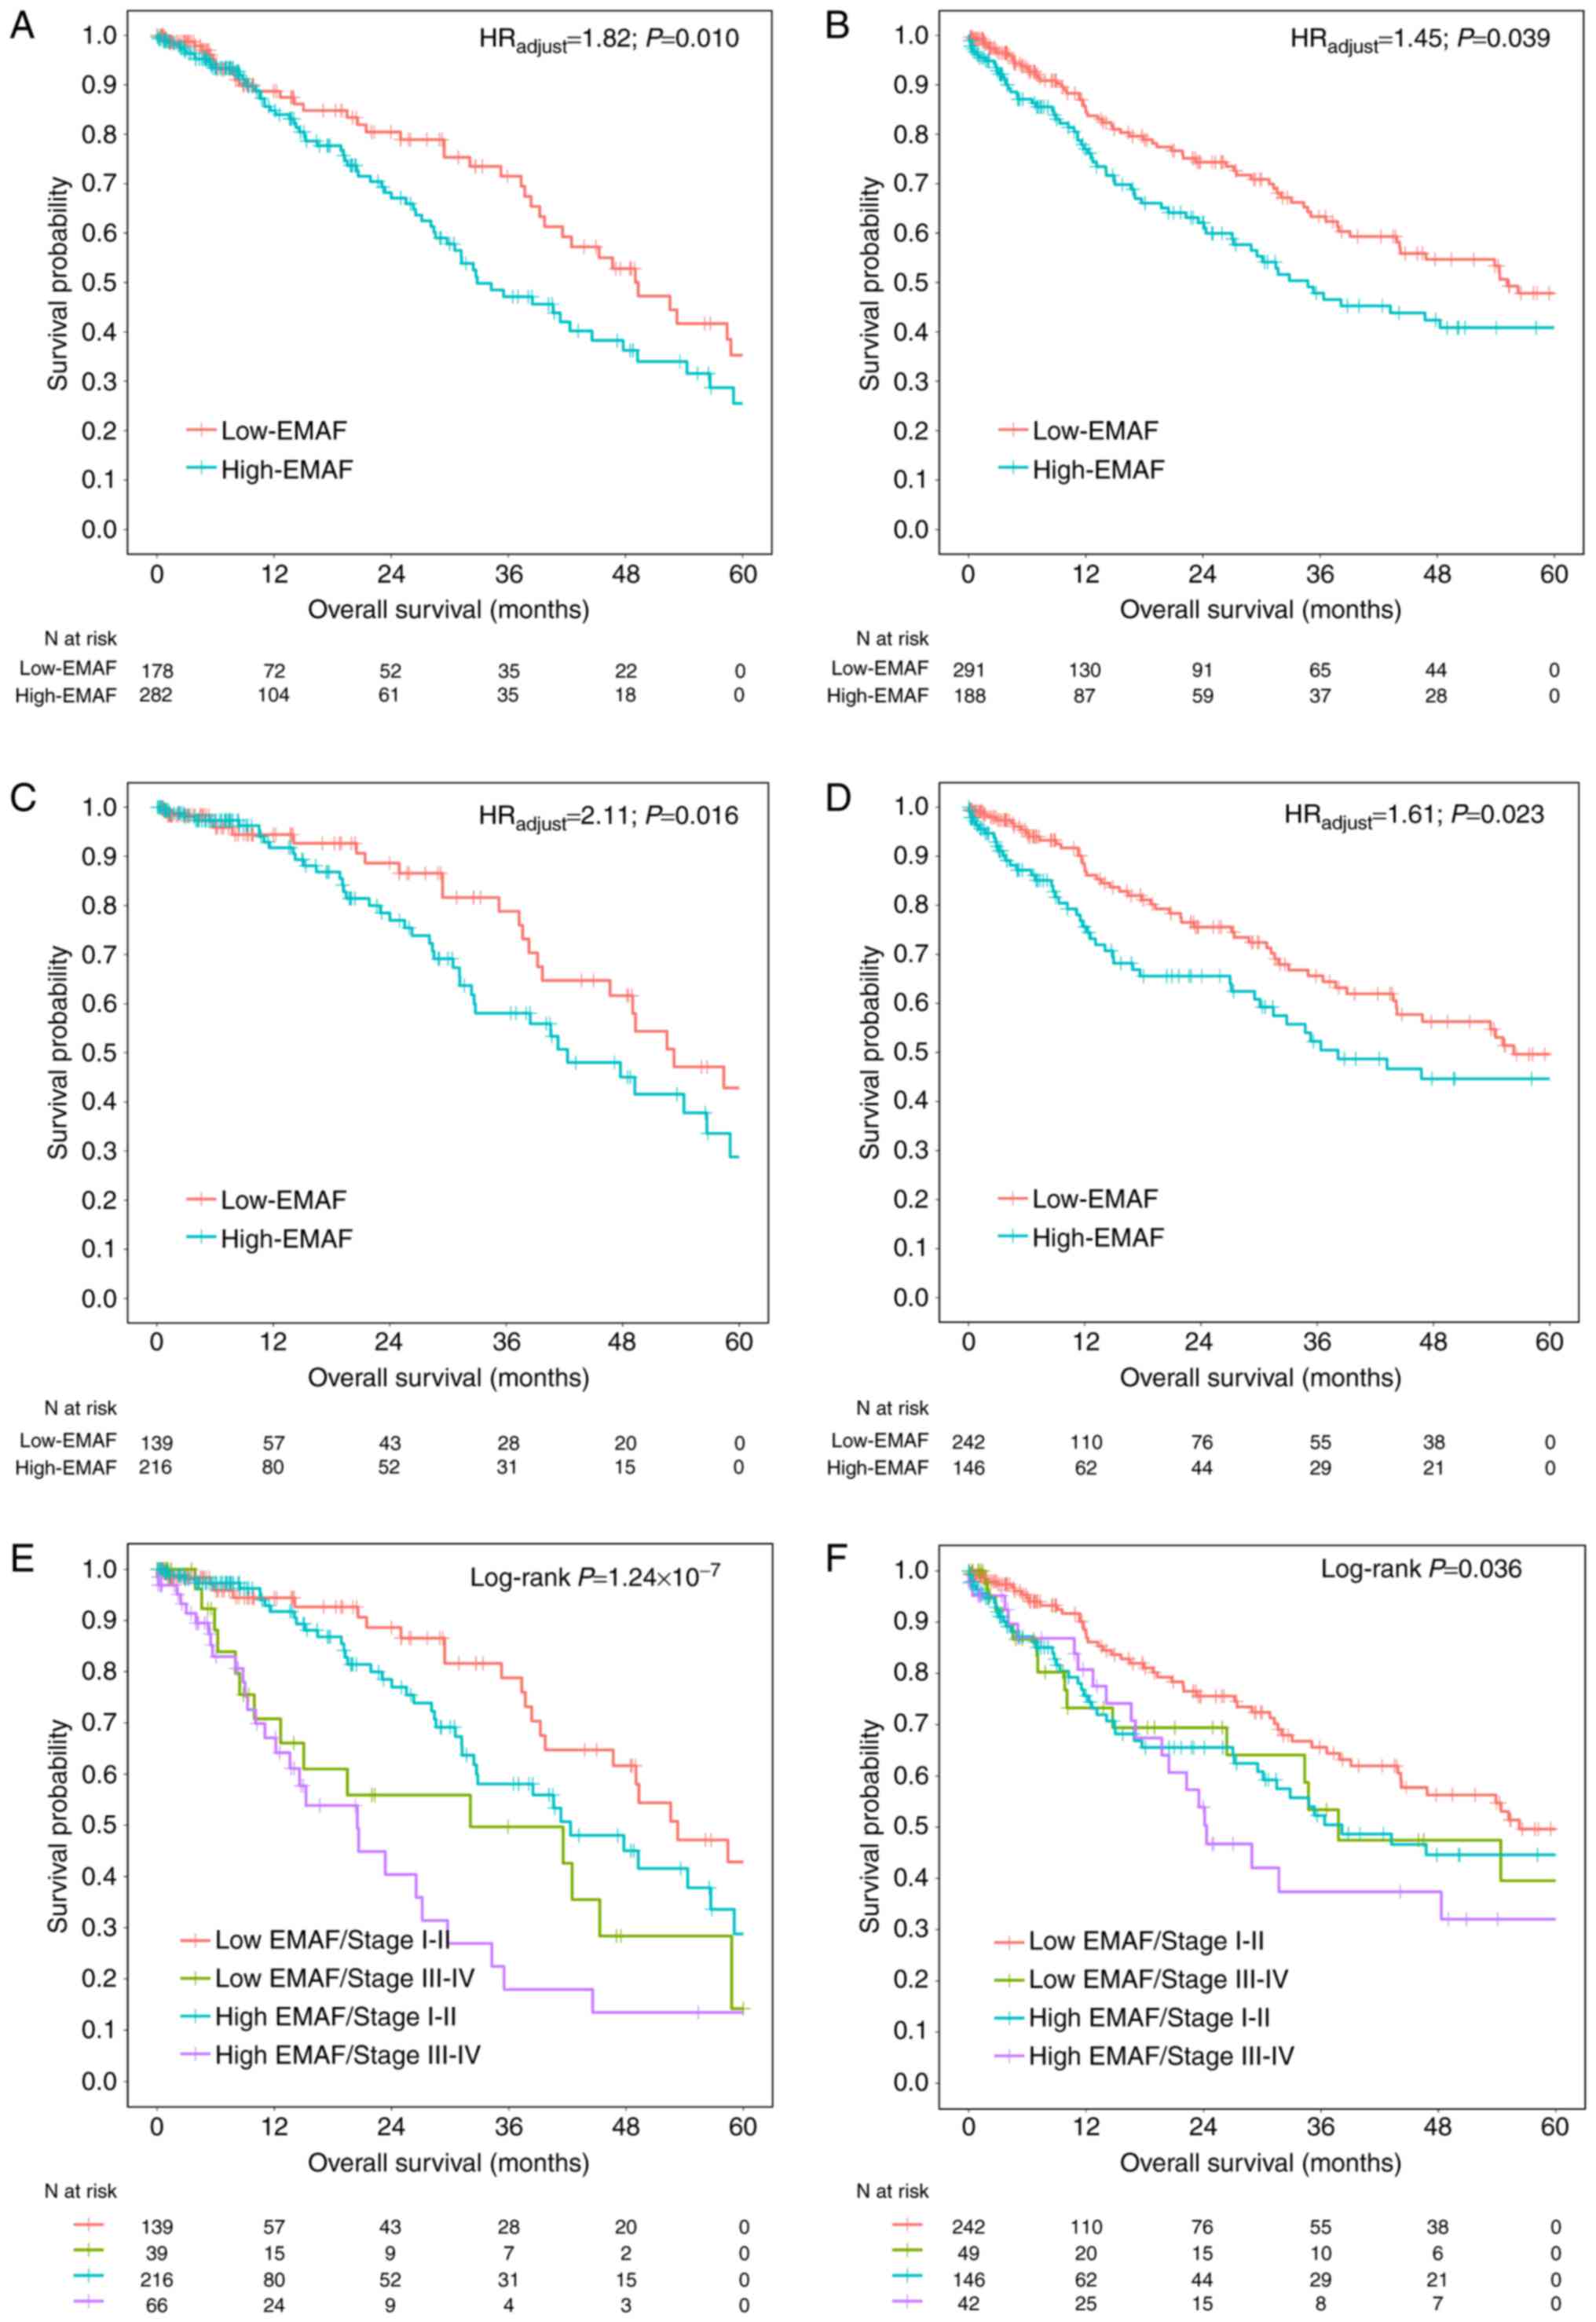
Subgroup analysis with histology type
and clinical stage
Further, we explored the relationship between EMAF
and survival with different histology type. After adjustment for
age, gender, smoking status, clinical stage, T classification, N
classification, EMAF showed significance in both LUAD (HR=1.82; 95%
CI: 1.15–2.87; P=0.010) and LUSC (HR=1.45; 95% CI: 1.02–2.05;
P=0.039) cases (Fig. 3A and B).
A biomarker for early-stage lung cancer is more
important and urgent. Subgroup analysis among 355 early-stage
(stage I–II) LUAD cases showed consistent results (HR=2.11; 95% CI:
1.15–3.90; P=0.016) (Fig. 3C), as
well as positive results among 388 early-stage LUSC patients
(HR=1.61; 95% CI: 1.06–2.43; P=0.023) (Fig. 3D). Besides, subgroup analyses by
clinical stage (Fig. 3E and F) showed
consistently significant results for LUAD (P=1.24×10⁻⁷)
and LUSC (P=0.036).
Predict performance of EMAF on 3-year
overall survival
Furthermore, the index of concordance (c-index) was
used to evaluate the predict performance of EMAF on 3-year overall
survival (Table III). Among LUAD
cases, the c-index was 0.70 for clinical characteristics including
age, gender, smoking status, TNM stage, T classification, and N
classification, and was increased to 0.76 by adding on EMAF.
Similarly, the c-index for LUSC cases was also improved from 0.58
(for clinical characteristics only) to 0.63 (by adding on EMAF
score). Results were consistent among early-stage patients (LUAD:
0.65 to 0.73; LUSC: 0.58 to 0.64). Thus, EMAF appears to improve
performance of prognostic prediction beyond clinical
information.
| Table III.Performances of prognostic prediction
on 3-year overall survival. |
Table III.
Performances of prognostic prediction
on 3-year overall survival.
|
| Death rate,
%(n/N) | Prognostic
prediction performance, c-index (95%CI) |
|---|
|
|
|
|
|---|
| Study
population | Low-EMAF group | High-EMAF
group | EMAF only | Clinical
characteristics onlya | Both |
|---|
| LUAD | 20.6 (46/223) | 25.3 (60/237) | 0.60
(0.53,0.66) | 0.70
(0.63,0.78) | 0.76
(0.68,0.83) |
| Early-stage | 17.0 (33/193) | 22.2 (36/162) | 0.60
(0.51,0.68) | 0.65
(0.55,0.75) | 0.73
(0.63,0.83) |
| LUSC | 22.2 (57/257) | 33.8 (75/222) | 0.58
(0.53,0.63) | 0.58
(0.53,0.64) | 0.63
(0.57,0.68) |
| Early-stage | 20.7 (45/217) | 30.4 (52/171) | 0.60
(0.54,0.66) | 0.58
(0.51,0.65) | 0.64
(0.57,0.71) |
Discussion
In this study, based on the theory that high genetic
heterogeneity is associated with worse overall survival, we propose
an information entropy-based score, EMAF, to evaluate the
uncertainty of individual genome-wide mutational distribution
patterns of tumor DNA, also described as MAF heterogeneity. Lung
cancer patients with higher EMAF scores tend to have higher
uncertainty of MAF distribution. Moreover, our study found that
high EMAF scores correlate with poor clinical outcomes among NSCLC
cases. Our hypothesis is that high EMAF indicates an early start
and a high percentage of sub-clonal mutations, which make the tumor
more aggressive (29) as well as
representing a more disordered regulation mechanism. Both of them
may have an adverse effect on the tumor progression and clinical
outcome.
Mroz et al (17) reported a MATH score by MAD/median of
mutation allele fraction distribution to describe the intratumor
heterogeneity in HNSC data from TCGA. However, our results show
that MATH scores failed to be applied in NSCLC data. A potential
explanation may be that MATH used incomplete information of the
complicated NSCLC MAF distribution, while EMAF scores proposed in
this study consider overall MAF distribution comprehensively by
information entropy and integral process.
EMAF appears to distinguish adequately NSCLC patient
prognosis, and retains significant among early-stage patients.
Besides, clinical information especially clinical stage is regarded
as an efficient and common predictive factor to clinical outcome
(30–32). Notably, EMAF provides additional
distinguishing capability to survival in addition to clinical
information. Thus, the combination of EMAF and clinical information
could significantly improve the predictive performance for 3-year
overall survival. Early-stage lung cancer patients are expected to
have favorable clinical prognosis, although they actually have
diverse survival outcomes (33),
which may be due to timing for treatment after surgery (34). EMAF appears to identify a subset of
early-stage patients with relatively poor prognosis, which may
indicate an alternative preoperative chemotherapy or radiation
strategy followed by surgery.
EMAF is based on next generation sequencing which
will have a wide range of applications in the future. In addition,
it is a quantitative measure as long as tumor and matched normal
somatic mutations can be sequenced. Cancer consists of a quite
large complex regulatory network, unlike some methods that need to
select biological markers as the first step, EMAF is based on
overall distribution of each person and is not restricted by a
single locus. Further, due to the use of the kernel function
estimation method, EMAF also is not restricted by distribution type
and thus has wide applicability. Although information entropy with
a continuous version cannot be used as a measure of amount of
information, it can be used as a relative measure of uncertainty.
We defined EMAF as continuous entropy of the patients, and it was
based on distribution of MAF values that considered the uncertainty
and ‘impurity’ of those values at the same time.
We acknowledge some limitations in this study. NSCLC
is so complicated that could be affected by somatic mutation
explored in this study as well as some other factors such as
performance status, chemotherapy after surgery or relapse, which
might cause bias. Besides, EMAF is limited by very small number of
MAF values, which preclude determining an authentic distribution by
kernel density estimation. In this study, one LUAD case was
excluded due to the presence of only 2 mutant loci and EMAF was
incalculable. Besides, EMAF is generated from sequencing data and
influenced by sequencing depth. A low sequencing depth may result
in an inaccurate MAF. Further, MAF heterogeneity is evaluated based
on the whole genomic mutations, while in which probably only a
small fraction relates to diseases. In addition, mutations in
non-coding regions are gradually being cognized which warrant
investigation in future (35–38).
In conclusion, the proposed entropy-based EMAF score
can quantify MAF heterogeneity in NSCLC cases and is therefore
suggested as a prognostic biomarker. In addition, EMAF
differentiates a subgroup of early stage patents with an
unfavorable prognosis, potentially providing clinical support for
therapeutic decision-making.
Acknowledgements
The present study was partially supported by the
National Natural Science Foundation of China (Nos. 81402764 to
Y.W., 81373102 to Y.Z, 81402763 to R.Z., and 81473070 and 81530088
to F.C.) and the Natural Science Foundation of Jiangsu, China (No.
BK20140907 to Y.W.). Y.W. was also partially supported by the
Outstanding Young Teachers Training Program of Nanjing Medical
University, and A Project Funded by the Priority Academic Program
Development of Jiangsu Higher Education Institutions. Sponsors had
no role in study design, data collection and analysis, decision to
publish, or preparation of the manuscript. We thank the patients
and investigators who participated in TCGA for providing the
data.
Glossary
Abbreviations
Abbreviations:
|
EMAF
|
entropy-based mutation allele
fraction
|
|
HR
|
hazard ratio
|
|
HNSC
|
head and neck squamous cell
carcinoma
|
|
LUAD
|
lung adenocarcinoma
|
|
LUSC
|
lung squamous cell carcinoma
|
|
MAF
|
mutant-allele fraction
|
|
MATH
|
mutant-allele tumor heterogeneity
|
|
NSCLC
|
non-small cell lung cancer
|
|
TCGA
|
The Cancer Genome Atlas
|
|
VAF
|
variant allele frequency
|
References
|
1
|
Ma H, Shu Y, Pan S, Chen J, Dai J, Jin G,
Hu Z and Shen H: Polymorphisms of key chemokine genes and survival
of non-small cell lung cancer in Chinese. Lung Cancer. 74:164–169.
2011. View Article : Google Scholar : PubMed/NCBI
|
|
2
|
Devarakonda S, Morgensztern D and Govindan
R: Genomic alterations in lung adenocarcinoma. Lancet Oncol.
16:e342–e351. 2015. View Article : Google Scholar : PubMed/NCBI
|
|
3
|
Hirsch FR, Scagliotti GV, Mulshine JL,
Kwon R, Curran WJ Jr, Wu YL and Paz-Ares L: Lung cancer: Current
therapies and new targeted treatments. Lancet. 389:299–311. 2017.
View Article : Google Scholar : PubMed/NCBI
|
|
4
|
de Bruin EC, McGranahan N, Mitter R, Salm
M, Wedge DC, Yates L, Jamal-Hanjani M, Shafi S, Murugaesu N, Rowan
AJ, et al: Spatial and temporal diversity in genomic instability
processes defines lung cancer evolution. Science. 346:251–256.
2014. View Article : Google Scholar : PubMed/NCBI
|
|
5
|
Zhang J, Fujimoto J, Zhang J, Wedge DC,
Song X, Zhang J, Seth S, Chow CW, Cao Y, Gumbs C, et al: Intratumor
heterogeneity in localized lung adenocarcinomas delineated by
multiregion sequencing. Science. 346:256–259. 2014. View Article : Google Scholar : PubMed/NCBI
|
|
6
|
Håkansson L and Tropé C: On the presence
within tumours of clones that differ in sensitivity to cytostatic
drugs. Acta Pathol Microbiol Scand A. 82:35–40. 1974.PubMed/NCBI
|
|
7
|
Nowell PC: The clonal evolution of tumor
cell populations. Science. 194:23–28. 1976. View Article : Google Scholar : PubMed/NCBI
|
|
8
|
Fidler IJ and Kripke ML: Metastasis
results from preexisting variant cells within a malignant tumor.
Science. 197:893–895. 1977. View Article : Google Scholar : PubMed/NCBI
|
|
9
|
Dexter DL, Kowalski HM, Blazar BA, Fligiel
Z, Vogel R and Heppner GH: Heterogeneity of tumor cells from a
single mouse mammary tumor. Cancer Res. 38:3174–3181.
1978.PubMed/NCBI
|
|
10
|
Heppner GH: Tumor heterogeneity. Cancer
Res. 44:2259–2265. 1984.PubMed/NCBI
|
|
11
|
Cooke SL, Temple J, Macarthur S, Zahra MA,
Tan LT, Crawford RA, Ng CK, Jimenez-Linan M, Sala E and Brenton JD:
Intra-tumour genetic heterogeneity and poor chemoradiotherapy
response in cervical cancer. Br J Cancer. 104:361–368. 2011.
View Article : Google Scholar : PubMed/NCBI
|
|
12
|
Navin N, Kendall J, Troge J, Andrews P,
Rodgers L, McIndoo J, Cook K, Stepansky A, Levy D, Esposito D, et
al: Tumourevolution inferred by single-cell sequencing. Nature.
472:90–94. 2011. View Article : Google Scholar : PubMed/NCBI
|
|
13
|
Gerlinger M, Rowan AJ, Horswell S, Math M,
Larkin J, Endesfelder D, Gronroos E, Martinez P, Matthews N,
Stewart A, et al: Intratumor heterogeneity and branched evolution
revealed by multiregion sequencing. N Engl J Med. 366:883–892.
2012. View Article : Google Scholar : PubMed/NCBI
|
|
14
|
Patel AP, Tirosh I, Trombetta JJ, Shalek
AK, Gillespie SM, Wakimoto H, Cahill DP, Nahed BV, Curry WT,
Martuza RL, et al: Single-cell RNA-seq highlights intratumoral
heterogeneity in primary glioblastoma. Science. 344:1396–1401.
2014. View Article : Google Scholar : PubMed/NCBI
|
|
15
|
Mroz EA and Rocco JW: MATH, a novel
measure of intratumor genetic heterogeneity, is high in
poor-outcome classes of head and neck squamous cell carcinoma. Oral
Oncol. 49:211–215. 2013. View Article : Google Scholar : PubMed/NCBI
|
|
16
|
Mroz EA, Tward AD, Pickering CR, Myers JN,
Ferris RL and Rocco JW: High intratumor genetic heterogeneity is
related to worse outcome in patients with head and neck squamous
cell carcinoma. Cancer. 119:3034–3042. 2013. View Article : Google Scholar : PubMed/NCBI
|
|
17
|
Mroz EA, Tward AD, Hammon RJ, Ren Y and
Rocco JW: Intra-tumor genetic heterogeneity and mortality in head
and neck cancer: Analysis of data from the cancer genome atlas.
PLoS Med. 12:e10017862015. View Article : Google Scholar : PubMed/NCBI
|
|
18
|
Rocco JW: Mutant allele tumor
heterogeneity (MATH) and head and neck squamous cell carcinoma.
Head Neck Pathol. 9:1–5. 2015. View Article : Google Scholar : PubMed/NCBI
|
|
19
|
Ostrer H: Changing the game with whole
exome sequencing. Clin Genet. 80:101–103. 2011. View Article : Google Scholar : PubMed/NCBI
|
|
20
|
Cancer Genome Atlas Research Network, .
Comprehensive molecular profiling of lung adenocarcinoma. Nature.
511:543–550. 2014. View Article : Google Scholar : PubMed/NCBI
|
|
21
|
Chapman MA, Lawrence MS, Keats JJ,
Cibulskis K, Sougnez C, Schinzel AC, Harview CL, Brunet JP, Ahmann
GJ, Adli M, et al: Initial genome sequencing and analysis of
multiple myeloma. Nature. 471:467–472. 2011. View Article : Google Scholar : PubMed/NCBI
|
|
22
|
Broad Institute TCGA Genome Data Analysis
Center, . Analysis Overview for Lung Adenocarcinoma (Primary solid
tumor cohort). 28–January. 2016Broad Institute of MIT and Harvard;
https://doi.org/10.7908/c18g8k472016
|
|
23
|
Cheng PF, Dummer R and Levesque MP: Data
mining The cancer genome atlas in the era of precision cancer
medicine. Swiss Med Wkly. 145:w141832015.PubMed/NCBI
|
|
24
|
Koboldt DC, Chen K, Wylie T, Larson DE,
McLellan MD, Mardis ER, Weinstock GM, Wilson RK and Ding L:
VarScan: Variant detection in massively parallel sequencing of
individual and pooled samples. Bioinformatics. 25:2283–2285. 2009.
View Article : Google Scholar : PubMed/NCBI
|
|
25
|
Yee J, Kwon MS, Park T and Park M: A
modified entropy-based approach for identifying gene-gene
interactions in case-control study. PLoS One. 8:e693212013.
View Article : Google Scholar : PubMed/NCBI
|
|
26
|
Shannon CE: The mathematical theory of
communication. 1963. MD Comput. 14:306–317. 1997.PubMed/NCBI
|
|
27
|
Schreiber T: Measuring information
transfer. Phys Rev Lett. 85:461–464. 2000. View Article : Google Scholar : PubMed/NCBI
|
|
28
|
Uno H, Cai T, Pencina MJ, D'Agostino RB
and Wei LJ: On the C-statistics for evaluating overall adequacy of
risk prediction procedures with censored survival data. Stat Med.
30:1105–1117. 2011.PubMed/NCBI
|
|
29
|
Landau DA, Carter SL, Stojanov P, McKenna
A, Stevenson K, Lawrence MS, Sougnez C, Stewart C, Sivachenko A,
Wang L, et al: Evolution and impact of subclonal mutations in
chronic lymphocytic leukemia. Cell. 152:714–726. 2013. View Article : Google Scholar : PubMed/NCBI
|
|
30
|
Marquette D, Pichon E, Deschasse G,
Lemaire B, Lemarie E, Diot P and Marchand-Adam S: Lung cancer in
adults: Better prognosis of patients aged 45 and under related to
good condition and lower TNM stage (a comparative and retrospective
study). Presse Med. 41:e250–e256. 2012.(In French). View Article : Google Scholar : PubMed/NCBI
|
|
31
|
Liu M, Pan H, Zhang F, Zhang Y, Zhang Y,
Xia H, Zhu J, Fu W and Zhang X: Identification of TNM
stage-specific genes in lung adenocarcinoma by genome-wide
expression profiling. Oncol Lett. 6:763–768. 2013.PubMed/NCBI
|
|
32
|
Liu Y, Wang L, Lin XY, Wang J, Yu JH, Miao
Y and Wang EH: The transcription factor DEC1
(BHLHE40/STRA13/SHARP-2) is negatively associated with TNM stage in
non-small-cell lung cancer and inhibits the proliferation through
cyclin D1 in A549 and BE1 cells. Tumour Biol. 34:1641–1650. 2013.
View Article : Google Scholar : PubMed/NCBI
|
|
33
|
Yu KH, Zhang C, Berry GJ, Altman RB, Ré C,
Rubin DL and Snyder M: Predicting non-small cell lung cancer
prognosis by fully automated microscopic pathology image features.
Nat Commun. 7:124742016. View Article : Google Scholar : PubMed/NCBI
|
|
34
|
Erb CT, Su KW, Soulos PR, Tanoue LT and
Gross CP: Surveillance practice patterns after curative intent
therapy for stage I non-small-cell lung cancer in the medicare
population. Lung Cancer. 99:200–207. 2016. View Article : Google Scholar : PubMed/NCBI
|
|
35
|
Zhao T, Xu J, Liu L, Bai J, Xu C, Xiao Y,
Li X and Zhang L: Identification of cancer-related lncRNAs through
integrating genome, regulome and transcriptome features.
MolBiosyst. 11:126–136. 2015.
|
|
36
|
Koch L: Cancer genomics: Non-coding
mutations in the driver seat. Nat Rev Genet. 15:574–575. 2014.
View Article : Google Scholar : PubMed/NCBI
|
|
37
|
Piraino SW and Furney SJ: Beyond the
exome: The role of non-coding somatic mutations in cancer. Ann
Oncol. 27:240–248. 2016. View Article : Google Scholar : PubMed/NCBI
|
|
38
|
Tavare S: Data integration in cancer
genomics: Non-coding mutations. Genet Epidemiology. 585:2015.
|