Introduction
Gastric cancer (GC) is a malignant tumor of the
gastrointestinal tract that is common worldwide (1). Although the incidence of GC has
decreased since the 1990s in the majority of developed countries,
outcomes in patients with advanced GC remain poor, and the 5-year
survival rate ranges between 4 and 20% for patients with surgically
resected tumors (2). Invasion and
metastasis of GC are the two main reasons for its poor prognosis.
Forkhead box protein 3 (FOXP3) is a transcription factor that is
necessary for the induction of the immunosuppressive functions in
regulatory T cells (3). Previous
studies reported the expression of FOXP3 has been observed in a
number of types of tumor cell (4,5). The
expression of FOXP3 in different tumor cells may drive different
functions. In a previous study, high FOXP3 expression in GC cells
was found to predict longer survival times (6). FOXP3 was also observed to inhibit
proliferation and induce apoptosis in GC cells by activating the
apoptotic signaling pathway (7).
FOXP3 is reported to negatively regulate nuclear factor
κ-light-chain-enhancer of activated B cells (NF-κB) and thus has a
tumor suppressor role in GC (8).
However, the mechanisms by which FOXP3 acts as a tumor suppressor
remain largely unknown.
GC is a polygenic disease linked with the
transcription and expression of multiple oncogenes and tumor
suppressor genes, which finally express in the form of protein.
Label-free quantitative proteomic analysis is a newly emerged,
efficient, powerful and cost-effective approach for comparing
various proteins from different samples (9). Label-free proteomic analysis can screen
differential protein expression with a high efficiency (10). In the present study, cells were
digested by the filter-aided sample preparation (FASP) procedure,
to obtain purer peptides and higher image quality.
FOXP3-overexpressing AGS cells were used as the experimental group
and empty vector-transfected AGS cells as the control group. A
total of 3,313 protein groups were quantified under highly rigorous
criteria with a false discovery rate of <1% for peptide and
protein groups. Of these proteins, 276 exhibited differences in
expression that were statistically significant between
FOXP3-overexpressing and control cells.
In the present study, label-free proteomic analysis
was performed to investigate the molecules through which FOXP3
mediates its anticancer role and to obtain a better understanding
of its mechanism of action in GC.
Materials and methods
Cell lines, reagents
Human GC cells AGS were purchased from the Chinese
Academy of Science (Shanghai, China). The AGS cells were cultivated
in RPMI 1640 medium (Hyclone; GE Healthcare Life Sciences, Logan,
UT, USA) containing 10% fetal bovine serum (Invitrogen; Thermo
Fisher Scientific, Inc., Waltham, MA, USA) at 37°C in 5%
CO2.
Transfection
The lentivirus of FOXP3 overexpression and its
vehicle were purchased from Genepharma (Shanghai GenePharma Co.,
Ltd., Shanghai, China). The AGS cells were grown to 70–80%
confluence in six well plates. The AGS cells were infected with a
multiplicity of infection (MOI) of 50 to generate
FOXP3-overexpression (referred to as AF). Cells infected with an
empty vector served as control cells (referred to as ANC). A total
of 2.5 µg/ml puromycin was added to AF cells 48 h after
transfection to select cells stably expressing FOXP3. Subsequent
experiments were conducted immediately following the selection.
Protein preparation and label-free
proteomic analysis
Cells were digested using the FASP procedure, as
described previously (11). Briefly,
107 AGS cells were washed with phosphate buffered saline
(PBS) three times to remove, then lysed using SDT buffer
(containing 4% SDS (m/w), 100 mM DTT and 100 mM Tris, pH 7.6). The
lysate was incubated at 95°C for 5 min and then centrifuged at
15,000 × g for 10 min at 4°C, and the supernatant was used for
proteomics sample preparation. Label-free proteomic analysis was
performed as previously described (9). The reverse phase high-performance liquid
chromatography (HPLC) separation was achieved using the
EASY-nLC1000 HPLC system (Thermo Fisher Scientific, Inc.) using a
self-packed column (75 µm ×150 mm; 3 µm ReproSil-Pur C18 beads, 120
A°; Dr. Maisch HPLC GmbH, Ammerbuch, Germany) at a flow rate of 300
nl/min using 240 min gradients. The full mass was scanned in the
Orbitrap analyzer with R=70,000 (defined at m/z 200), and the
subsequent MS/MS analyses were performed with R=17,500. Proteins
were identified by searching the MS and MS/MS data for the peptides
against a decoy version of the International Protein Index human or
rat database (version 3.87, 91464 protein sequences; European
Bioinformatics Institute, Hinxton, Cambridge, UK). Trypsin/P was
selected as the digestive enzyme with two potential missed
cleavages. Protein abundance was calculated according to the
normalized spectral protein intensity (LFQ intensity).
Reverse transcription-quantitative
polymerase chain reaction (RT-qPCR)
Total RNA was isolated using commercial RNA
isolation kit (Takara Biotechnology Co., Ltd., Dalian, China)
according to the manufacturer's protocol, and 2 µg RNA was reverse
transcribed to cDNA using oligodT primers with the Primer Script™
RT Reagent (Takara Biotechnology Co., Ltd.). The target genes
FOXP3, catenin β1 (CTNNB1), E-cadherin, N-cadherin, and vimentin,
and the internal control gene GAPDH were then amplified by qPCR.
The RT-qPCR was performed in a total volume of 10 µl, with 2X
SYBR® Green Mix (Takara Biotechnology Co., Ltd.) in the
ABI PRISM 7500 system (PerkinElmer, Inc., Waltham, MA, USA). All
samples were run in triplicate. The amplification reaction was
initiated by denaturing DNA at 95°C for 5 min, followed by 40
cycles of template denaturing at 94°C for 1 min, primer annealing
at 60°C for 1 min, and primer extension at 72°C for 1 min. The
comparative Cq method (2−ΔΔCq method) was used for
RT-qPCR data analysis (12).
The primers used were as follows: FOXP3 forward,
5′-AAGCAGCACTACATTGACCTGAAA-3′ and reverse,
5′-GGTCTCCCCAAGCATCACTC-3′; CTNNB1 forward,
5′-TGGTGACAGGGAAGACATCA-3′ and reverse, 5′-CCATAGTGAAGGCGAACTGC-3′;
E-cadherin forward, 5′-GGTCTCTCTCACCACCTCCA-3′ and reverse,
5′-CCTCGGACACTTCCACTCTC-3′; N-cadherin forward,
5′-CGTGAAGGTTTGCCAGTGT-3′ and reverse, 5′-CAGCACAAGGATAAGCAGGA-3′;
vimentin forward, 5′-GTACCGGAGACAGGTGCAGT-3′ and reverse,
5′-AACGGCAAAGTTCTCTTCCA-3′; and GAPDH forward,
5′-GCACCGTCAAGGCTGAGAAC-3′ and reverse,
5′-TGGTGAAGACGCCAGTGGA-3′.
Western blot analysis
Cells were collected and proteins were extracted
with radioimmunoprecipitation assay lysis buffer (Nanjing KeyGen
Biotech Co., Ltd., Nanjing, China). The protein concentration was
determined by the BCA protein assay (Shanghai Yeasen Biotech Co.,
Ltd., Shanghai, China). Protein samples (40 µg per lane) were
separated by 10% SDS-PAGE and then electro-transferred onto
nitrocellulose membranes for 90 min. The membranes were blocked for
1 h with 5% skimmed milk at room temperature and incubated with
primary antibodies overnight at 4°C, followed by incubation with
secondary antibodies. Primary antibodies used were as follows:
Specific to FOXP3 (cat no. 236A/E7; 1:500; anti-mouse; Abcam,
Cambridge, MA, USA), CTNNB1 (cat no. 8480; 1:1,000; anti-rabbit),
E-cadherin (cat no. 3195; 1:1,000; anti-rabbit), N-cadherin (cat
no. 13116; 1:1,000; anti-rabbit), Vimentin (cat no. 5741; 1:1,000;
anti-rabbit), GSK3β (cat no. 12456; 1:1,000; anti-rabbit) and GAPDH
(cat no. 2118; 1:5,000; anti-mouse) (all purchased from Cell
Signaling Technology, Inc., Danvers, MA, USA). Secondary antibodies
used were horseradish peroxidase-conjugated anti-rabbit/mouse
immunoglobulin G (cat no. 111-035-003/115-035-003; 1:5,000; Jackson
Laboratory, Bar Harbor, ME, USA). The reactions were visualized
using enhanced chemiluminescence kit (Merck KGaA, Darmstadt,
Germany) and a gel imaging system.
Chromatin immunoprecipitation followed
by PCR (ChIP-PCR)
ChIP was performed in native conditions. In brief,
cells at a concentration of 2×10⁶/ml were treated with
1% formaldehyde for 10 min at room temperature. Glycine (1.25 M)
was then added and the samples were incubated for 5 min at room
temperature. The cells were washed twice with cold PBS and
pelleted. Each pellet was resuspended in 1 ml of lysis buffer (50
mM Tris, pH 7.4, 150 mM NaCl, 1 mM EDTA, 0.1% SDS, 1% NP-40, 0.5%
sodium deoxycholate, 0.5 mM DTT and 1 mM phenylmethylsulfonyl
fluoride/cocktail), incubated on ice with vortexing for 10 min, and
the lysate was obtained by centrifugation at 4°C with 13,000 × g
for 10 min. The majority of the DNA fragments were sheared by
sonication on ice to a length of 200–500 bp. Antibodies specific to
FOXP3 (cat no. ab2481, 1:50, Abcam), RNA pol2 (cat no. sc-899,
1:100, Santa Cruz Biotechnology, Inc., Dallas, TX, USA) and protein
G beads were added and samples were incubated for 4 h at 4°C. The
samples were washed once in a low-salt wash buffer (20 mM Tris-HCl,
pH 8.0150 mM NaCl, 0.1% SDS, 1% Triton X-100, 2 mM EDTA), once in a
high-salt wash buffer (20 mM Tris-HCl, pH 8.0, 500 mM NaCl, 0.1%
SDS, 1% Triton X-100, 2 mM EDTA), once in a LiCl wash buffer (0.25
M LiCl, 1% NP-40, 1% sodium deoxycholate, 1 mM EDTA, 10 mM
Tris-HCl, pH 8.0) and once in a TE buffer (10 mM Tris-HCl, pH 8.0,
1 mM EDTA). The beads were then resuspended in lysis buffer and
treated with proteinase K at 45°C for 45 min. Co-precipitated DNAs
were purified with phenol-chloroform to eliminate SDS sediment. The
effectiveness of CHIP was detected using PCR. The PCR was performed
to verify whether these DNA fragments were between 200–500 bp using
the 2X Hieff™ HotStart PCR Master Mix (Yeasen Biotechnology Co.,
Ltd., Shanghai, China) with DNA ladder (cat no. D0107, Beyotime
Institute of Biotechnology, Haimen, China) as the marker. The
sequences of primers were: FOXP3 forward,
5′-AAGCAGCACTACATTGACCTGAAA-3′; FOXP3 reverse,
5′-GGTCTCCCCAAGCATCACTC-3′; GAPDH forward,
5′-ATGGGGCGCACGGCGGGAATG-3′; GAPDH reverse
5′-CTCCTTGGGCGCTTCGGCC-3′. The thermocycling conditions were 35
cycles of 95°C for 30 sec for denaturation, 55°C for 30 sec for
annealing and 72°C for 30 sec for elongation. PCR products were
loaded onto a 1% agarose gel, and the bands were visualized using
the Molecular Imager Gel Doc XR system (Bio-Rad Laboratories, Inc.,
Hercules, CA, USA).
Statistical analysis
All data were analyzed using the SPSS 20.0
statistical program (IBM Corp., Armonk, NY, USA). Values are
expressed as fold change or mean ± standard error of the mean.
Unpaired Student's t-tests were used for comparisons between two
means. P<0.05 was considered to indicate statistical
significance.
Results
Label-free quantitative proteomic
analysis of AF and ANC cells
In an attempt to identify changes in proteins, the
differential protein expression between the AF and the ANC cells
was monitored. To ensure the reproducibility of the results, five
biological replicates were performed for proteomic analysis. The
high homogeneity of AF and ANC resulted in highly accurate liquid
chromatography with tandem mass spectroscopy identification
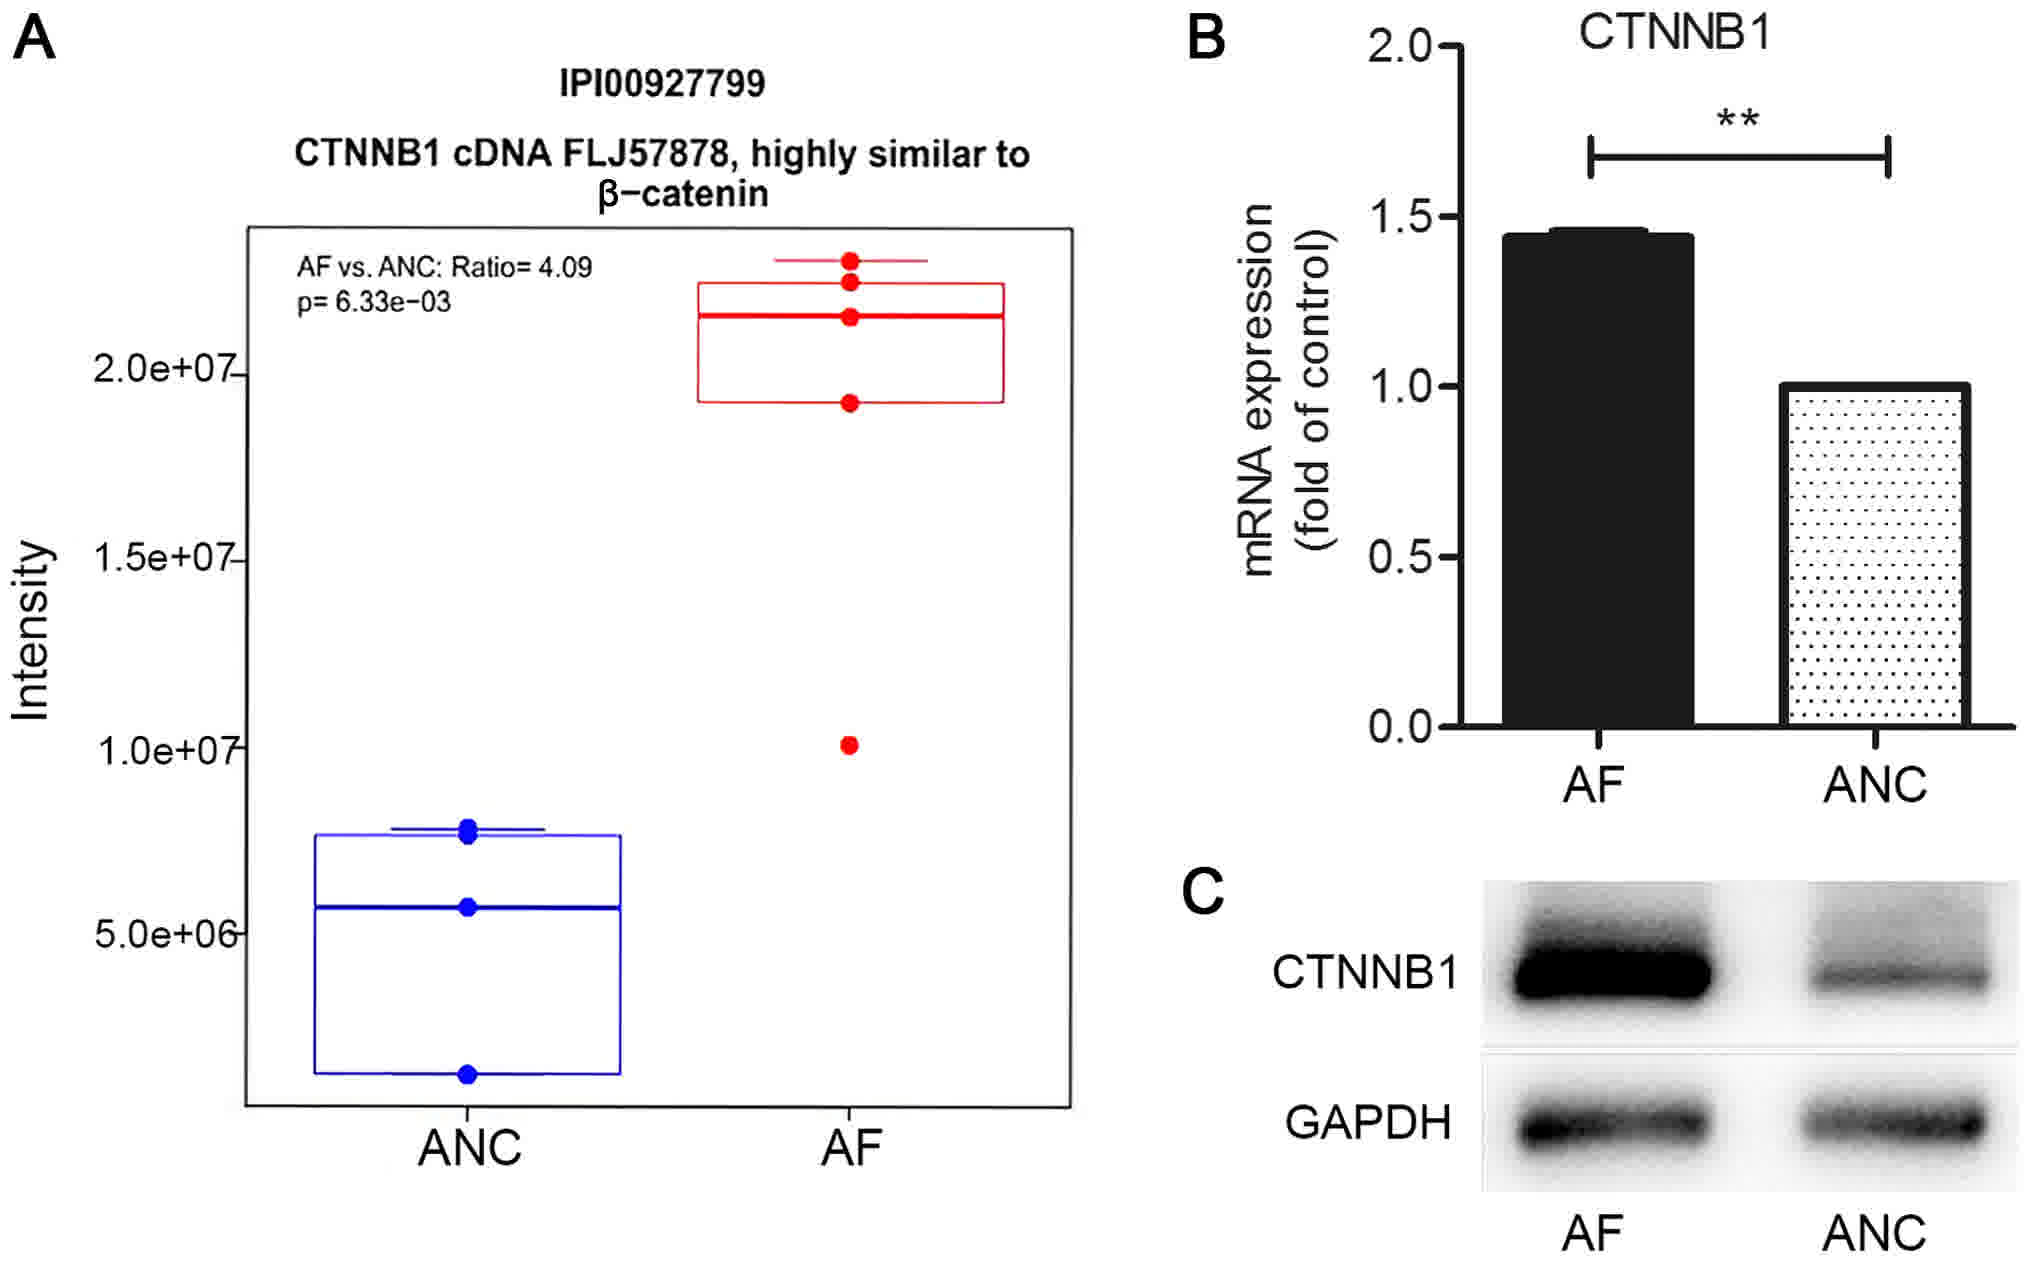
results. Of a total of 3,313 proteins, the expression of 276
differed significantly (P<0.05, using a log2
fold-change >2 as the cut-off). The expression of CTNNB1 in AF
cells was 4.09-fold higher than that in the control cells (Fig. 1A). The level of mRNA expression of
CTNNB1 in AF and ANC was verified by RT-qPCR (Fig. 1B). The level of expression of the
protein was determined by western blot analysis (Fig. 1C).
Expression of epithelial-mesenchymal
transition (EMT)-associated proteins does not differ significantly
between AF and ANC
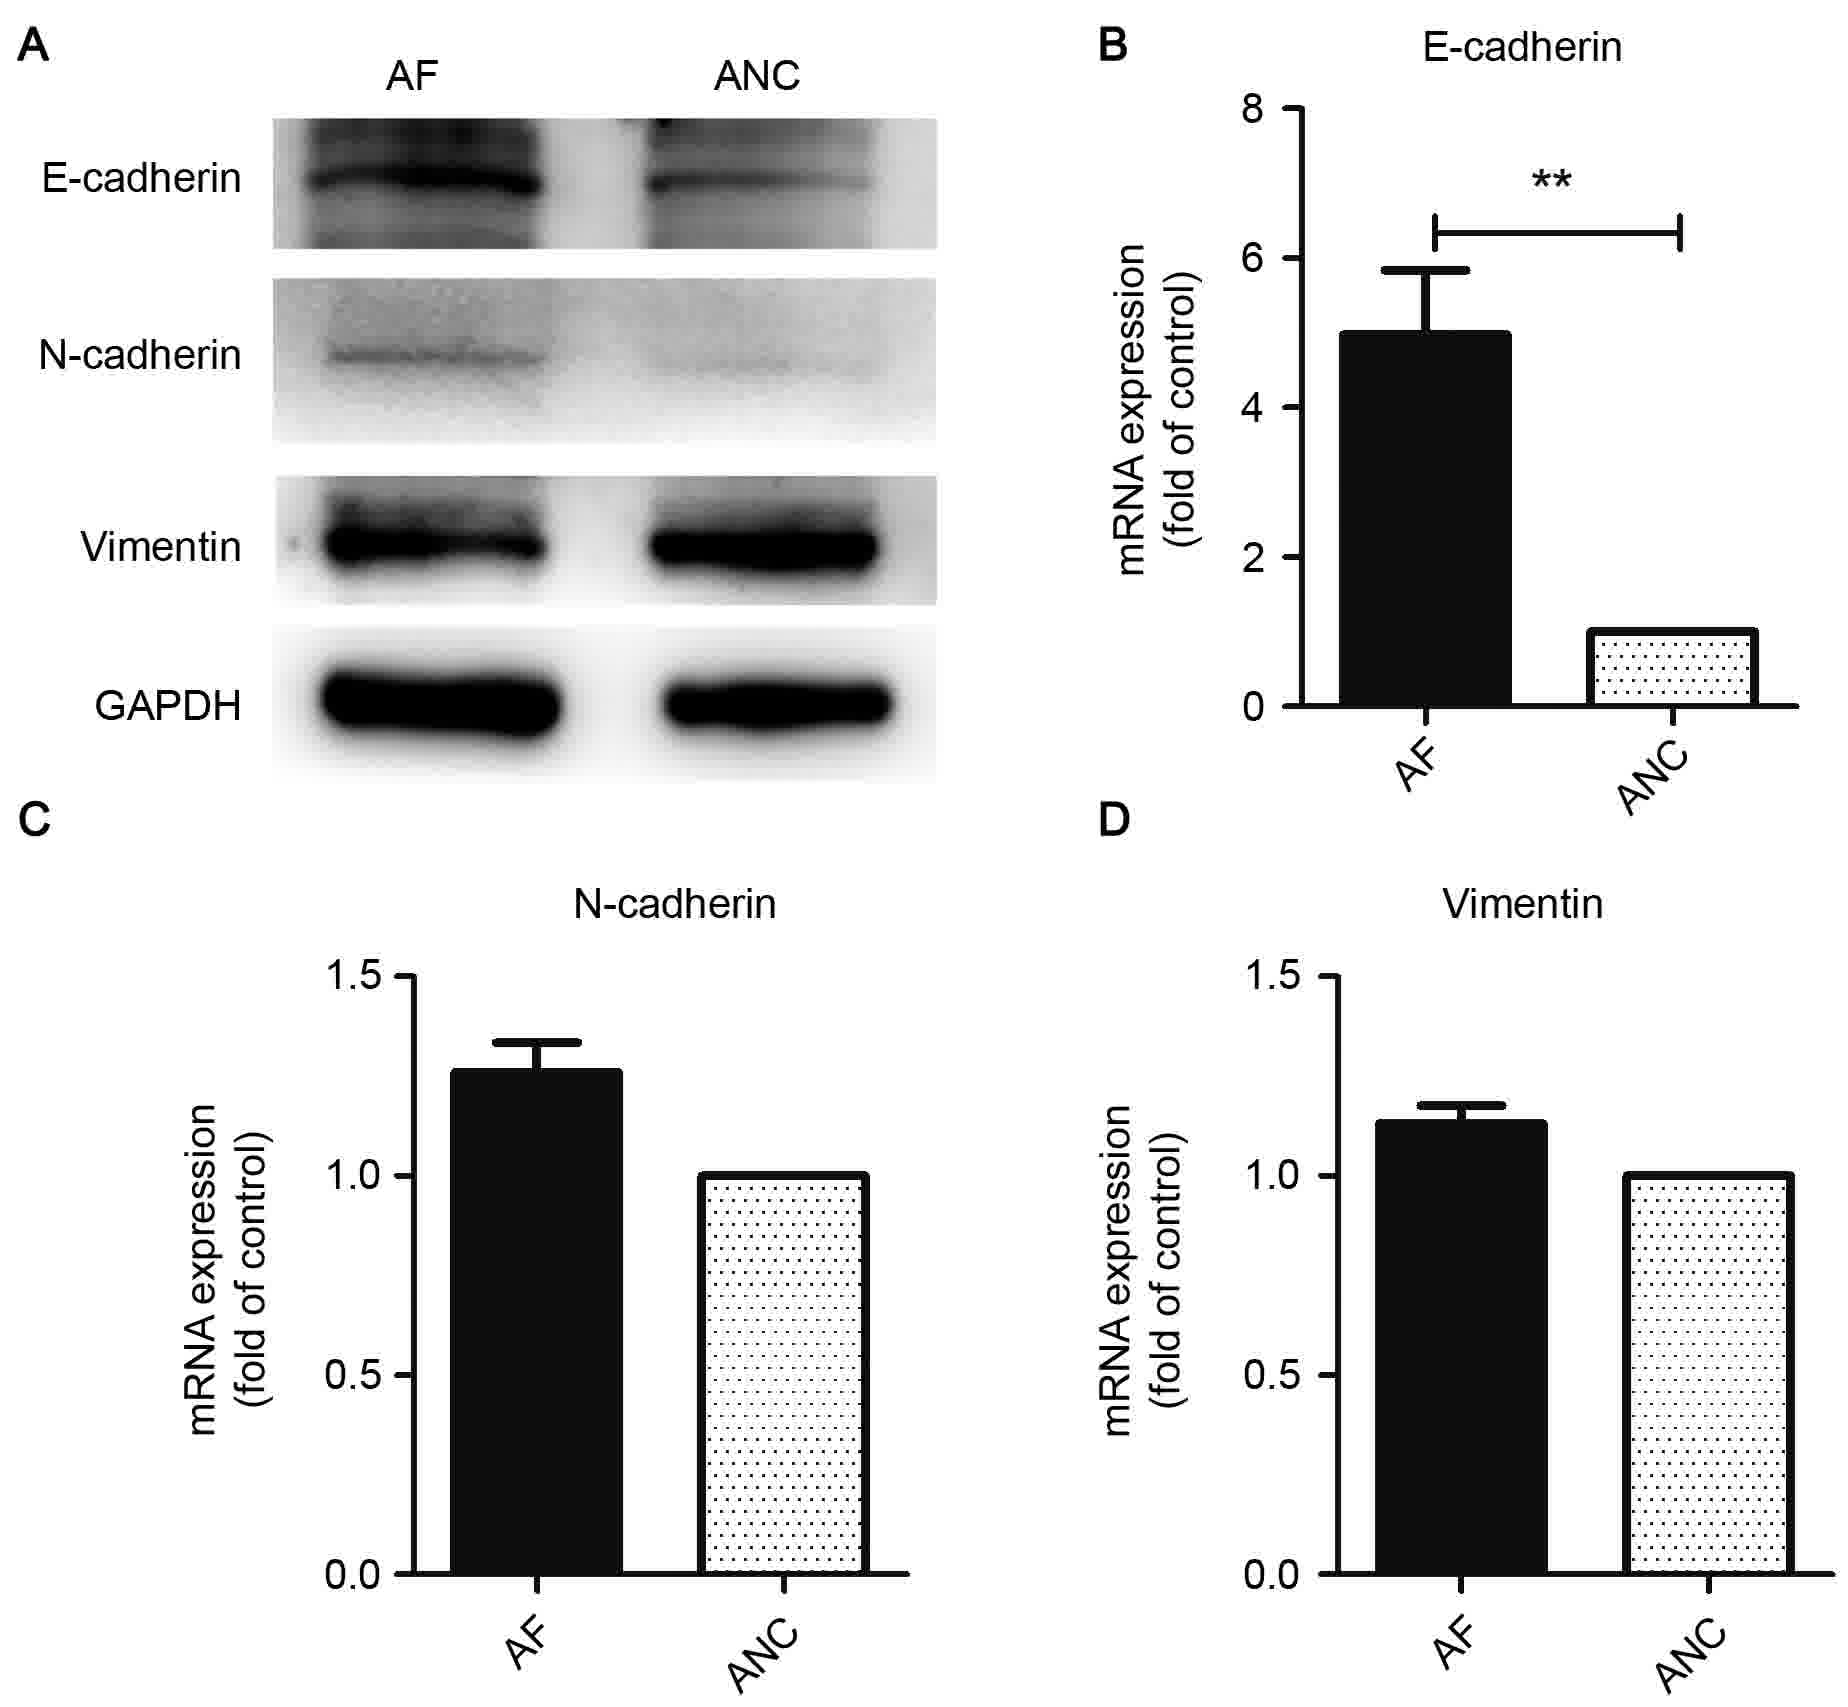
The results of RT-qPCR and western blot analysis
indicated that levels of the epithelial phenotype protein
E-cadherin and CTNNB1 were significantly elevated in AF, but those
of the mesenchymal phenotype proteins vimentin and N-cadherin were
not (Fig. 2).
Glycogen synthase kinase 3-β (GSK3β)
is upregulated in AF cells
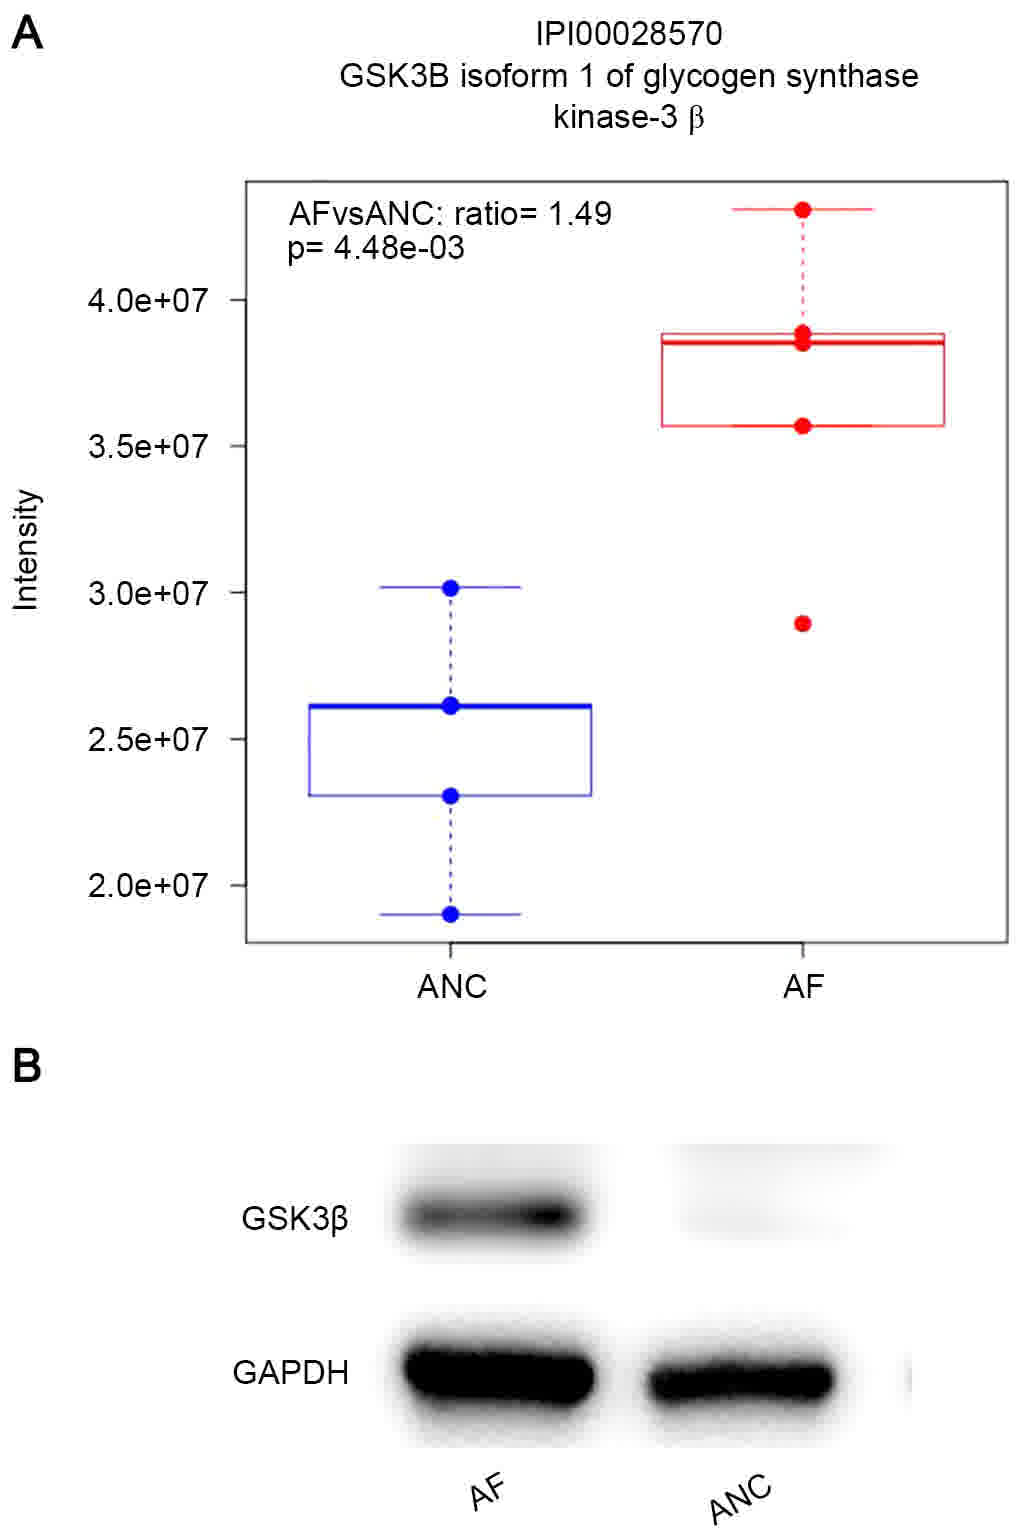
GSK3β is a key member of the destruction complex
that can degrade the CTNNB1 in cytoplasm rapidly (13). Cytoplasmic levels of CTNNB1 are
tightly controlled by GSK3β and the degradation of CTNNB1 in
cytoplasm could inhibit the Wnt pathway (13). The expression of GSK3β in AF cells was
found to be 1.49-fold higher than in the control cells. (Fig. 3A) The level of the protein was
determined by western blot analysis (Fig.
3B).
FOXP3 interacts with CTNNB1 in AGS
cells
The observation that the protein level of CTNNB1 was
affected by FOXP3 has been supported by label-free proteomic
analysis, and indicates that FOXP3 may modulate the former to a
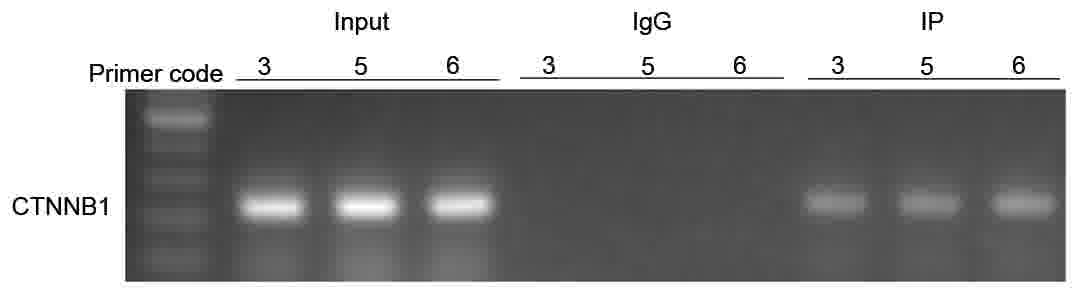
certain degree. To investigate whether FOXP3 affected CTNNB1 by
binding to it, a ChIP-PCR assay was performed. ChIP-PCR assays
revealed that FOXP3 could bind directly to the promoter region of
CTNNB1 in AGS cells (Fig. 4). There
were three regions to which FOXP3 could bind. The specific FOXP3
binding positions were located between −1,502 and −1,251 bp, −1,002
and −751 bp, and −751 and 500 bp, starting from the transcription
site of the CTNNB1 gene promoter. Data from ChIP-PCR indicated that
FOXP3 could control CTNNB1 directly, and thus affect the downstream
pathways.
Discussion
In summary, the results of the present study
revealed a novel function of FOXP3, acting as a tumor suppressor
through interaction with CTNNB1. In a previous study,
FOXP3-positive staining was found to associate with a favorable
prognosis in patients with GC, and that upregulation of the FOXP3
gene inhibits GC cell growth in vitro and in vivo
(6). Several mechanisms, including
the activation of the apoptotic signaling pathway and inhibition of
NF-κB activity, have been implicated in the anticancer activity of
FOXP3 in GC (7,8).
Label-free quantitative proteomic analysis
identified CTNNB1 as a novel FOXP3-interacting partner. Consistent
with former results, the epithelial phenotype E-cadherin and CTNNB1
were upregulated in FOXP3-overexpressing AGS cells. EMT occurs due
to the induction of transcription factors, which alter gene
expression to promote the loss of cell-cell adhesion, leading to a
shift in cytoskeletal dynamics and a change from epithelial
morphology and physiology to the mesenchymal phenotype (14). Cells lose their epithelial
characteristics, instead gaining an invasive and migratory
mesenchymal phenotype, allowing these cells to leave the tissue
parenchyma and enter the systemic circulation during cancer
metastasis. One hallmark of EMT is the dissociation of the
E-cadherin-CTNNB1-α-catenin complex from the membrane (15). Thus, the loss of expression of
E-cadherin is always accompanied by the loss of expression of
CTNNB1 at the membrane. The mesenchymal phenotype indicators
vimentin and N-cadherin are always upregulated in EMT.
Given that the role of FOXP3 in EMT has not been
investigated previously, the present study measured the mRNA and
protein levels of mesenchymal phenotype indicators vimentin and
N-cadherin to determine whether FOXP3 could inhibit EMT. However,
the results observed were not expected. Vimentin and N-cadherin
were not downregulated in FOXP3-overexpressing cells, indicating
that FOXP3 does not mediate its anticancer effect through a
mesenchymal-to-epithelial transition. However, using ChIP-PCR, it
was identified that FOXP3 could bind directly to the promoter
region of CTNNB1. There are three binding domains, located between
−1,502 and −1,251 bp, −1,002 and −751 bp, and −751 and −500 bp.
These results indicate that FOXP3 upregulates the expression of
CTNNB1 in AGS cells.
CTNNB1, commonly known as β-catenin, was first
identified as an adhesion molecule by Imhof et al (16) in the 1980s. Interest in this molecule
increased when it was identified that CTNNB1 is important in the
initiation and metastasis of cancer (17). CTNNB1 is a dual-function protein: When
there is no Wnt signaling, CTNNB1 dynamically links E-cadherin and
α-catenin at the plasma membrane (18). Adhesion to the basement membrane and
to adjacent cells is critical for maintaining the epithelial
phenotype (19). In the absence of
Wnt signaling, CTNNB1 is rapidly degraded by a destruction complex
consisting of adenoma polyposis coli, axin, casein kinase and GSK3β
(13). Thus, the concentration of
CTNNB1 is maintained at the appropriate level in the cytoplasm. By
contrast, in the Wnt signaling pathway the GSK3β-dependent
phosphorylation of CTNNB1 is inhibited; this results in an
accumulation of CTNNB1 in the nucleus, where it functions as a
transcriptional activator in conjunction with lymphoid enhancer
factor/T-cell factor DNA binding proteins and induces EMT (20,21). The
signaling function of CTNNB1 is regulated principally through the
alteration of its stability in the cytoplasm.
The present label-free quantitative proteomic
analysis also identified GSK3β as a significantly altered protein
in AF cells. The expression of GSK3β was 1.49-fold higher in AF
than in APC cells. Since GSK3β could catalyze the phosphorylation
of serine or threonine residues on CTNNB1 substrates, the
upregulation of GSK3β may promote the degradation of CTNNB1 in the
cytoplasm and inhibit the Wnt pathway (18), which, together with the increase in
CTNNB1 expression on the membrane, could strengthen the
E-cadherin-CTNNB1 complex, making it difficult for the GC cells to
move.
In summary, proteomic analysis revealed that CTNNB1
levels were significantly upregulated in FOXP3-overexpressing AGS
cells. ChIP-PCR revealed that FOXP3 could bind directly to the
promoter region of CTNNB1, which means that FOXP3 could directly
regulate CTNNB1. These results provide novel information concerning
the anticancer mechanism of FOXP3. Further research is required to
investigate the possible pathways in which CTNNB1 is involved with
FOXP3.
Acknowledgements
The authors would like to thank the Key Laboratory
of Zhongshan Hospital of Fudan University (Shanghai, China) for the
support of cellular experiments, and the Institutional Technology
Service Center of Shanghai Institute of Materia Medica (Shanghai,
China) for the support of the proteomic experiments.
Funding
The present study was supported by the Natural
Science Foundation of Shanghai (no. 14ZR1406600) and the Natural
Science Foundation for Young Scholars of China (no. 81502005).
Availability of data and materials
The datasets used and/or analyzed during the current
study are available from the corresponding author on reasonable
request.
Authors' contributions
All authors contributed to the conception, design
and completion of the present study. DYP and XQZ contributed
equally to study design, experimental work and manuscript
preparation. GFM designed the study, JG and HZ performed the
proteomic experiments, QM and NL analyzed the data and LLX and SYC
contributed to refining the study design.
Ethics approval and consent to publish
No human participants, human data or human tissue
were involved in the present study.
Consent for publication
Not applicable.
Competing interests
The authors declare that they have no competing
interests.
References
|
1
|
Siegel RL, Miller KD and Jemal A: Cancer
statistics, 2015. CA Cancer J Clin. 65:5–29. 2015. View Article : Google Scholar : PubMed/NCBI
|
|
2
|
Washington K: 7th edition of the AJCC
cancer staging manual: Stomach. Ann Surg Oncol. 17:3077–3079. 2010.
View Article : Google Scholar : PubMed/NCBI
|
|
3
|
Hori S and Sakaguchi S: Foxp3: A critical
regulator of the development and function of regulatory T cells.
Microbes Infect. 6:745–751. 2004. View Article : Google Scholar : PubMed/NCBI
|
|
4
|
Karanikas V, Speletas M, Zamanakou M,
Kalala F, Loules G, Kerenidi T, Barda AK, Gourgoulianis KI and
Germenis AE: Foxp3 expression in human cancer cells. J Transl Med.
6:192008. View Article : Google Scholar : PubMed/NCBI
|
|
5
|
Matsuura K, Yamaguchi Y, Osaki A, Ohara M,
Okita R, Emi A, Murakami S and Arihiro K: FOXP3 expression of
micrometastasis-positive sentinel nodes in breast cancer patients.
Oncol Rep. 22:1181–1187. 2009. View Article : Google Scholar : PubMed/NCBI
|
|
6
|
Ma GF, Miao Q, Liu YM, Gao H, Lian JJ,
Wang YN, Zeng XQ, Luo TC, Ma LL, Shen ZB, et al: High FoxP3
expression in tumour cells predicts better survival in gastric
cancer and its role in tumour microenvironment. Br J Cancer.
110:1552–1560. 2014. View Article : Google Scholar : PubMed/NCBI
|
|
7
|
Ma GF, Chen SY, Sun ZR, Miao Q, Liu YM,
Zeng XQ, Luo TC, Ma LL, Lian JJ and Song DL: FoxP3 inhibits
proliferation and induces apoptosis of gastric cancer cells by
activating the apoptotic signaling pathway. Biochem Biophys Res
Commun. 430:804–809. 2013. View Article : Google Scholar : PubMed/NCBI
|
|
8
|
Hao Q, Zhang C, Gao Y, Wang S, Li J, Li M,
Xue X, Li W, Zhang W and Zhang Y: FOXP3 inhibits NF-κB activity and
hence COX2 expression in gastric cancer cells. Cell Signal.
26:564–569. 2014. View Article : Google Scholar : PubMed/NCBI
|
|
9
|
Chen Q, Zhang A, Yu F, Gao J, Liu Y, Yu C,
Zhou H and Xu C: Label-free proteomics uncovers energy metabolism
and focal adhesion regulations responsive for endometrium
receptivity. J Proteome Res. 14:1831–1842. 2015. View Article : Google Scholar : PubMed/NCBI
|
|
10
|
Soderblom EJ, Philipp M, Thompson JW,
Caron MG and Moseley MA: Quantitative label-free phosphoproteomics
strategy for multifaceted experimental designs. Anal Chem.
83:3758–3764. 2011. View Article : Google Scholar : PubMed/NCBI
|
|
11
|
Wiśniewski JR, Nagaraj N, Zougman A, Gnad
F and Mann M: Brain phosphoproteome obtained by a FASP-based method
reveals plasma membrane protein topology. J Proteome Res.
9:3280–3289. 2010. View Article : Google Scholar : PubMed/NCBI
|
|
12
|
Livak KJ and Schmittgen TD: Analysis of
relative gene expression data using real-time quantitative PCR and
the 2(-Delta Delta C(T)) method. Methods. 25:402–408. 2001.
View Article : Google Scholar : PubMed/NCBI
|
|
13
|
Liu C, Li Y, Semenov M, Han C, Baeg GH,
Tan Y, Zhang Z, Lin X and He X: Control of beta-catenin
phosphorylation/degradation by a dual-kinase mechanism. Cell.
108:837–847. 2002. View Article : Google Scholar : PubMed/NCBI
|
|
14
|
Gonzalez DM and Medici D: Signaling
mechanisms of the epithelial-mesenchymal transition. Sci Signal.
7:re82014. View Article : Google Scholar : PubMed/NCBI
|
|
15
|
Kalluri R and Weinberg RA: The basics of
epithelial-mesenchymal transition. J Clin Invest. 119:1420–1428.
2009. View
Article : Google Scholar : PubMed/NCBI
|
|
16
|
Imhof BA, Vollmers HP, Goodman SL and
Birchmeier W: Cell-cell interaction and polarity of epithelial
cells: Specific perturbation using a monoclonal antibody. Cell.
35:667–675. 1983. View Article : Google Scholar : PubMed/NCBI
|
|
17
|
Polakis P: Wnt signaling and cancer. Genes
Dev. 14:1837–1851. 2000.PubMed/NCBI
|
|
18
|
Yamada S, Pokutta S, Drees F, Weis WI and
Nelson WJ: Deconstructing the cadherin-catenin-actin complex. Cell.
123:889–901. 2005. View Article : Google Scholar : PubMed/NCBI
|
|
19
|
Nawshad A, Lagamba D, Polad A and Hay ED:
Transforming growth factor-beta signaling during
epithelial-mesenchymal transformation: Implications for
embryogenesis and tumor metastasis. Cells Tissues Organs.
179:11–23. 2005. View Article : Google Scholar : PubMed/NCBI
|
|
20
|
Kemler R, Hierholzer A, Kanzler B, Kuppig
S, Hansen K, Taketo MM, de Vries WN, Knowles BB and Solter D:
Stabilization of beta-catenin in the mouse zygote leads to
premature epithelial-mesenchymal transition in the epiblast.
Development. 131:5817–5824. 2004. View Article : Google Scholar : PubMed/NCBI
|
|
21
|
MacDonald BT, Tamai K and He X:
Wnt/beta-catenin signaling: Components, mechanisms, and diseases.
Dev Cell. 17:9–26. 2009. View Article : Google Scholar : PubMed/NCBI
|