Introduction
Diffuse large B-cell lymphoma (DLBCL) is a subtype
of non-Hodgkin lymphoma (NHL) with high incidence rate. It accounts
for 30% of all malignant tumors of lymphoid tissues (1,2). DLBCL is
a moderately to highly malignant lymphoma, characterized by
clinical heterogeneity with a high proliferation and strong
metastasis. It has significant differences in immunophenotype,
morphology and molecular genetics (3). As a solid tumor of the immune system
(4,5),
the lesion sites of DLBCL are mainly in the lymph nodes, spleen,
thymus, other lymphoid organs and extranodal lymphoid tissues
(6,7).
The universally acknowledged clinical treatment means of DLBCL is
the combined medication of rituximab and anthracycline drugs, with
a successful treatment rate of 60–70% (8). Nevertheless, due to the large individual
difference in DLBCL, some patients still have no response to the
rituximab-based treatment or metastasis occurs early with a poor
prognosis.
Important roles for miRs, including miR23a, have
been demonstrated in earlier studies on multiple types of cancer
(8,9).
These reports suggest the role of miR23a in tumor progression by
modulating mechanisms of differentiation, proliferation, invasion
and metastasis (10) Another study
reported that the expression of the micro-ribonucleic acid-23a
(miR-23a) is altered in various types of cancer with diverse
effects (11). These effects mainly
included the orchestration of target genes important for increasing
proliferation, cell differentiation and growth (12). Furthermore, miR-23a has been reported
to be associated with DLBCL (13). On
the other hand, metastasis suppressor 1 (MTSS1) is a known
cytoskeletal-associated protein, and its role has been confirmed in
certain types of cancer (14). It is
a novel potential metastasis suppressor gene, which is also known
as missing-in-metastasis (MIM). Moreover, patients diagnosed
with high levels of MTSS1 transcripts had a favourable
prognosis over those with reduced or lack of expression thereof
(14). MTSS1 has been confirmed as a
target of miR-23a in colorectal cancer, and the inhibition of MTSS1
by miR-23 results in cancer metastasis (15).
Thus, the present study investigated the expression
of miR-23a and MTSS1 during DLBCL. Their effects on
clinicopathological parameters of DLBCL patients were also
explored. Moreover, we studied the correlation between their
expression and their association with clinicopathological
parameters of DLBCL. Therefore, DLBCL OCI-LY10 cells were cultured
in vitro, and the relationship between miR-23a and MTSS1
expression was investigated. The study of the relationship between
these parameters is crucial, as it will allow an efficient
prognosis of DLBCL patients in near future.
Materials and methods
Materials
DLBCL OCI-LY10 cells (Shanghai Cell Bank, Chinese
Academy of Sciences, Shanghai, China); Dulbecco's modified Eagle's
medium (DMEM), fetal bovine serum (FBS), and Lipofectamine™ 2000
(Invitrogen: Thermo Fisher Scientific, Inc., Carlsbad, CA, USA);
miR-23a antisense oligonucleotide (miR-23a ASO) (Beijing Sunbiotech
Co., Ltd., Beijing, China); Transwell chamber (Corning, Inc.,
Corning, NY, USA); rabbit anti-human miR-23a and MTSS1 antibodies
(Santa Cruz Biotechnology, Inc., Dallas, TX, USA); bicinchoninic
acid (BCA) protein quantification kit and cell lysis buffer
(Beyotime Institute of Biotechnology, Nantong, China), and
immunohistochemical staining kit SP-9001 (Beijing Zhongshan Golden
Bridge Biotechnology Co., Ltd., Beijing, China) were used in this
study.
In this clinical study, 70 patients confirmed
clinically and pathologically as DLBCL, and who were admitted to
Xijing Hospital (Xi'an, China) from May 2012 to May 2015 were
selected as the subjects of the study. The patients were aged 29–77
years with a median age of 59 years. In addition, 30 tissue
specimens of patients pathologically diagnosed as reactive lymphoid
hyperplasia in the same period were selected as the controls; the
patients were aged 25–74 years with a median age of 57 years. There
were no differences in age between the two groups. The
clinicopathological data of patients were collected. The Clinical
Ethics Committee of Xijing Hospital (Xi'an, China) approved this
study, and patients or their families signed the informed
consent.
Detection of miR-23a mRNA expression
via reverse transcription-quantitative polymerase chain reaction
(RT-qPCR)
The total RNA was extracted from the tumor tissues
of lymphoma patients and reactive hyperplasia tissues using the
TRIzol kit, and the qualified total RNA was selected for the
reverse transcription according to the instructions of reverse
transcription kit. The specific reaction conditions are as follows:
Incubation at 42°C for 15 min and then at 95°C for 3 min. The total
RNA was cooled on ice and stored at −80°C for subsequent
experiments. The routine amplification was performed according to
the primer sequences in Table I. With
β-catenin as the internal control gene, Cq values were the output
of the instrument. The relative expression level of miR-23a mRNA
was calculated using the 2−ΔΔCq method.
 | Table I.RT-PCR primer sequences. |
Table I.
RT-PCR primer sequences.
| Gene | Primer sequence |
|---|
| U6 | F
5′-GCTTCGGCAGCACATATACTAAAAT-3′ |
|
| R
5′-CGCTTCACGAATTTGCGTGTCAT-3′ |
| miR-23a | F
5′-ATCACATTGCCAGGGATTTCC-3′ |
|
| R
5′-CCAGTGCAGGGTCCGAGGT-3′ |
Detection of the expression of MTSS1
protein in pathological tissues via immunohistochemistry. After
surgical resection, tumor tissues were fixed with formaldehyde,
followed by conventional paraffin embedding and tissue cutting
Immunohistochemical staining was conducted according
to the instructions of the SP-9001 kit, followed by dewaxing and
hydration of paraffin sections. After the sections were treated
with 3% H2O2 for 10 min to inactivate the
endogenous peroxidase, they were placed in citric acid buffer for
antigen retrieval using the microwave oven, and added with mouse
anti-human MTSS1 monoclonal antibody (1:100; cat. no. sc-101204;
Santa Cruz Biotechnology, Inc.). Phosphate-buffered saline (PBS)
replaced the primary antibody as the negative control at 4°C
overnight. Sections were washed with PBS and added with
biotin-labeled goat anti-mouse secondary polyclonal antibody
(1:500, cat. no. sc-2039; Santa Cruz Biotechnology, Inc.) for
incubation for 15 min, followed by washing with PBS, color
development via diaminobenzidine (DAB) in the dark, hematoxylin
re-staining and sealing via neutral gum.
Optical microscope (×400) was used for evaluation of
MTSS1 staining and six visual fields were randomly selected. The
score was based on the percentage of positive cells and the
staining depth; positive cells >75%: 4 points; 51–75%: 3 points;
11–50%: 2 points; ≤10%: 1 point; no positive cells: 0 point. Then
according to the staining depth, dark brown: 3 points; brown
yellow: 2 points; faint yellow: 1 point; no color: 0 point. Both
results were multiplied. A product of >3 points was considered
positive expression, while ≤2 points was negative expression. The
scores were statistically analyzed using SPSS 19.0 (SPSS, Inc.,
Chicago, IL, USA).
Expression of miR-23a and MTSS1 in
DLBCL tissues and their correlation with pathological
parameters
According to the expression levels of miR-23a and
MTSS1 in DLBCL tissues, 70 cases of DLBCL tissues were divided into
high- and low-expression miR-23a groups and positive- and
negative-expression MTSS1 groups. According to the clinical data of
patients, the relationship of miR-23a and MTSS1 expression with the
pathological parameters of patients was analyzed using the
Chi-square test.
OCI-LY10 cell culture and miR-23a ASO
transfection
DLBCL OCI-LY10 cells were cultured in DMEM culture
solution containing 10% FBS in an incubator with 5% CO2
at 37°C. After the cells were fully grown, they were digested and
collected for subsequent experiments.
In the experiment, cells were divided into the
negative control group [control small interfering RNA (siRNA)] and
ASO group (miR-23a ASO). The cells in logarithmic growth phase were
collected and inoculated into a sterile 6-well plate
(4×10⁵/well) for incubation in an incubator with 5%
CO2 at 37°C. After 24 h, according to instructions of
the Lipofectamine™ 2000 kit, 500 µl transfection complex containing
miR-23a ASO/Ctrl siRNA and 1,500 µl serum-free DMEM culture
solution were added into each well. Each group was placed in an
incubator with 5% CO2 at 37°C for 48 h. The cells were
then digested and collected for subsequent experiments.
Verification of interference effect of
miR-23a siRNA on mRNA via RT-qPCR
After cell transfection according to the steps
followed in ‘OCI-LY10 cell culture and miR-23a ASO transfection’,
the mRNA expression after interference with control siRNA and
miR-23a ASO was detected based on the steps in ‘Detection of
expression of MTSS1 protein in pathological tissues via
immunohistochemistry’.
Detection of MTSS1 protein expression
via western blot analysis
After transfection, the DLBCL OCI-LY10 cells were
resuspended using the cell lysis buffer, and cleaved on ice for 30
min, followed by centrifugation at 10,680 × g at 4°C for 15 min.
The supernatant was carefully absorbed as the total protein. After
protein quantification using the BAC protein quantification kit,
the loading buffer was added, 60 µg proteins in each group were
taken for 10% sodium dodecyl sulfate-polyacrylamide gel
electrophoresis and separation, and the protein was transferred
onto the polyvinylidene fluoride (PVDF) membrane with wet method.
The membrane was sealed using Tris-buffered saline (TBS) containing
5% skimmed milk at room temperature for 1 h, and mouse anti-human
MTSS1 and glyceraldehyde-3-phosphate dehydrogenase (GADPH) primary
monoclonal antibodies (diluted at 1:1,000; cat. nos. sc-101204,
sc-59540; Santa Cruz Biotechnology, Inc.) were added dropwise for
incubation at 4°C overnight. The next day, the membrane was washed
with Tris-buffered saline with Tween-20 (TBST) three times (15
min/time). Then goat anti-mouse horseradish peroxidase
(HRP)-labeled secondary polyclonal antibody (diluted at 1:2,000;
cat. no. sc-2005; Santa Cruz Biotechnology, Inc.) was added for
incubation at room temperature for 1 h, followed by washing with
TBST, luminous reaction using electrochemiluminescence (ECL) kit,
image scanning and analysis, and gray scale analysis with GADPH as
the internal reference.
Detection of the effect of miR-23a ASO
interference on cell proliferation capacity via methyl thiazolyl
tetrazolium (MTT) assay
In the experiment, the cells were divided into
negative control siRNA and miR-23a ASO. After 48 h, the cells
(DLBCL OCI-LY10) were collected and inoculated onto the 96-well
plate at a density of 1×10³/100 µl. After 48 h, 5 g/l
MTT solution was added into each well for incubation for 4 h. The
supernatant was removed from the wells, 100 µl dimethyl sulfoxide
(DMSO) solution was added into each well and agitated for 10 min.
The optical density of each well at the wavelength of 490 nm was
detected using a microplate reader (Thermo Fisher Scientific, Inc.,
Waltham, MA, USA), and the cell growth curve was drawn.
Detection of the effect of miR-23a ASO
interference on cell metastasis capacity via Transwell assay
At 48 h after transfection (DLBCL OCI-LY10), the
cells were collected to detect the metastasis capacity using
Transwell chamber. The cells were prepared into the
4×10⁵/ml cell suspension using the culture solution.
Cell suspension (100 µl) was added into the upper Transwell
chambers coated with Matrigel, while 500 µl culture solution was
added into the lower chamber for incubation in an incubator for 24
h. Then the chamber was removed and fixed via formalin for 2 min,
followed by 0.1% crystal violet staining for 15 min. The visual
fields were randomly selected under a microscope (Nikon Corp.,
Tokyo, Japan) for photography, counting and analysis.
Statistical analysis
Statistical Product and Service (SPSS) 17.0 software
(IBM Corp., Armonk, New York, USA) was used for data processing in
the present study. Measurement data were presented as mean ±
standard deviation, and the ANOVA test was used for intergroup
comparison and the post hoc test was SNK test. The Chi-square test
was used for intergroup comparison of enumeration data. Spearman's
test was used for correlation analysis. P≤0.05 indicated that the
difference was statistically significant.
Results
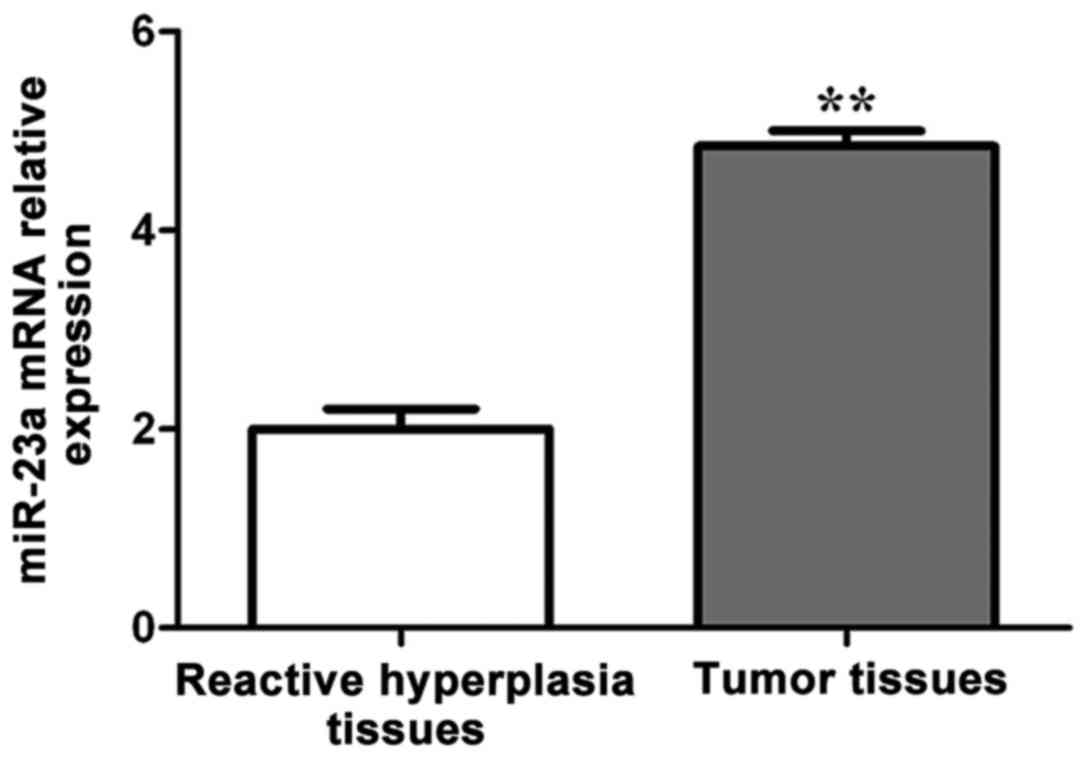
miR-23a mRNA expression in reactive
hyperplasia and tumor tissues
As shown in Fig. 1,
the miR-23a mRNA expression in DLBCL tissues was significantly
higher than that in reactive hyperplasia tissues, and the
difference was statistically significant (p<0.01).
According to the average relative expression level
of miR-23a mRNA in DLBCL tissues, 70 patients were divided into the
high-expression (n=56) and low-expression (n=14) miR-23a
groups.
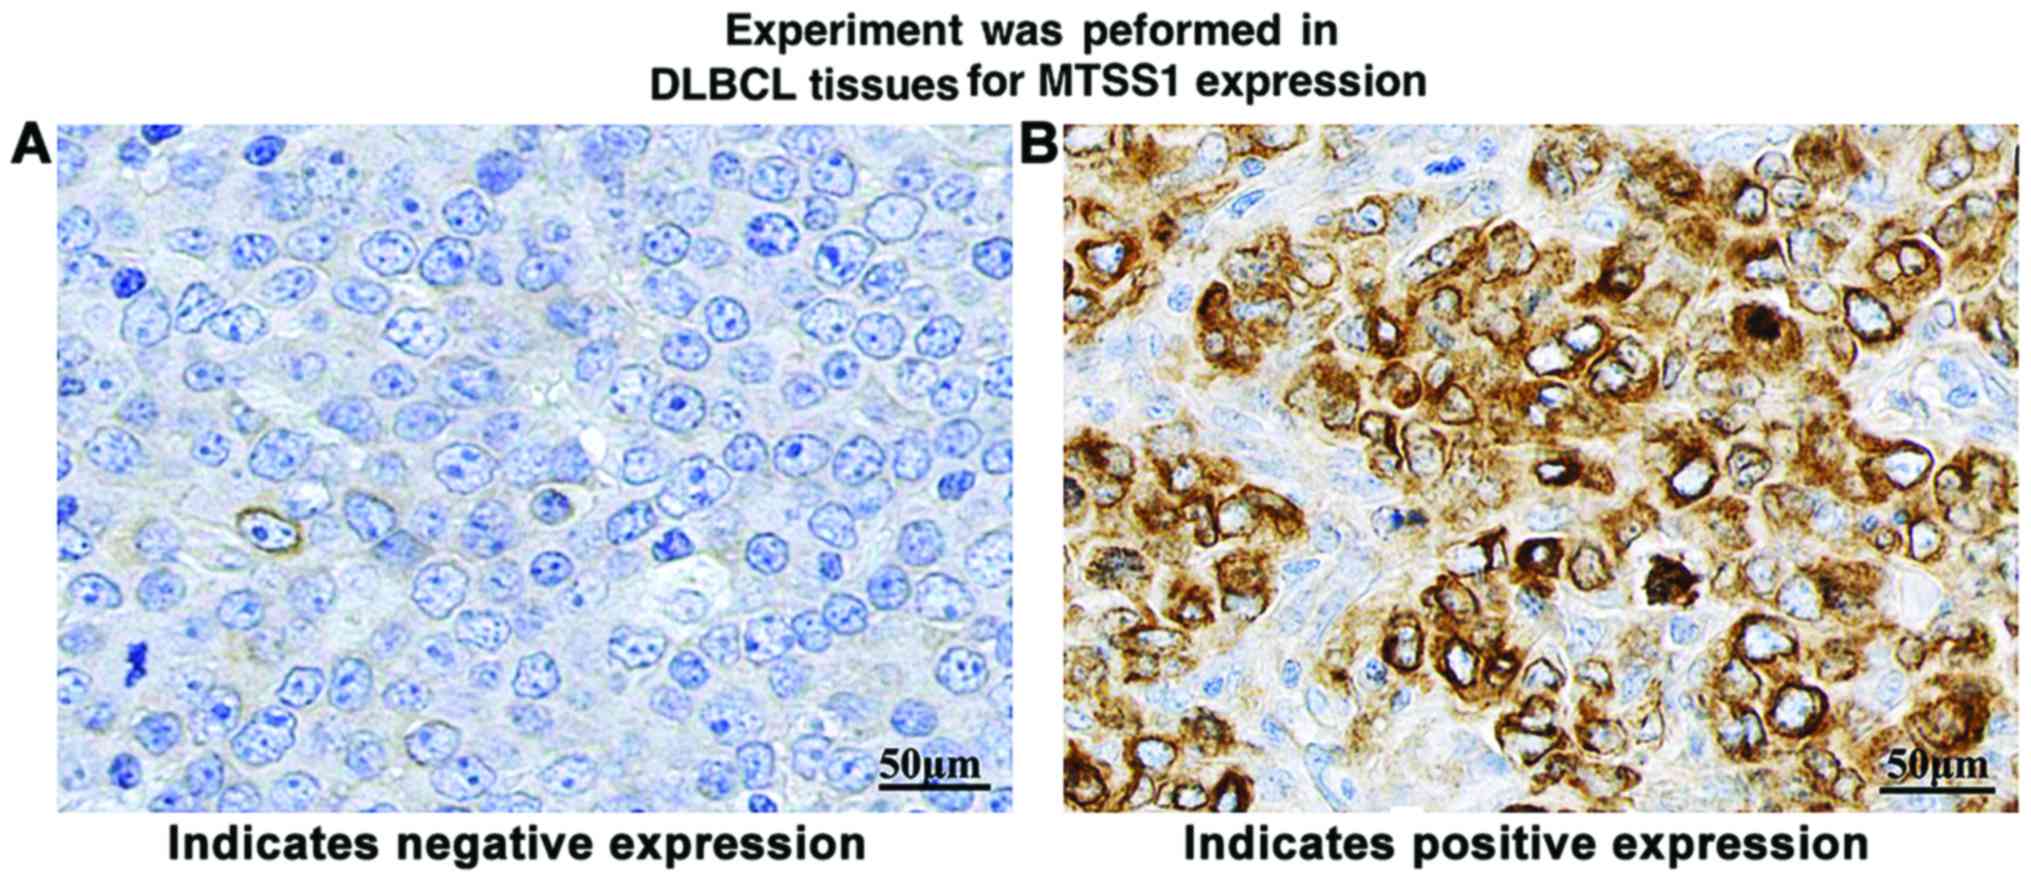
Detection of MTSS1 protein expression
in pathological tissues via immunohistochemical assay
The results of immunohistochemical detection showed
that positive immunohistochemical staining for MTSS1 appeared brown
yellow. MTSS1 proteins were mainly located in the cytoplasm,
showing diffuse distribution (Fig.
2). The positive expression rates of MTSS1 in DLBCL tissues and
reactive hyperplasia tissues were 30% (21/70) and 90% (27/30),
respectively, and the difference was statistically significant
(p<0.01) (Table II).
| Table II.Correlation between miR-23a and MTSS1
protein expression in DLBCL tissues. |
Table II.
Correlation between miR-23a and MTSS1
protein expression in DLBCL tissues.
|
| MTSS1 |
|
|
|---|
|
|
|
|
|
|---|
| miR-23a | Positive | Negative | r | P-value |
|---|
| High expression | 13 | 43 | −0.538 | <0.01 |
| Low expression | 8 | 6 |
|
|
Correlation between miR-23a and MTSS1
protein expression in DLBCL tissues
In the 70 cases of DLBCL tissues, there were 6 cases
of miR-23a protein positive (+) and MTSS1 protein (+), 15 cases of
miR-23a protein (−) and MTSS1 protein (−), 41 cases of miR-23a
protein (+) and MTSS1 protein (−), and 8 cases of miR-23a protein
(−) and MTSS1 protein (+). The correlation between miR-23a and
MTSS1 protein expression in DLBCL tissues was analyzed via
Spearman's test. The results revealed that there was a negative
correlation between them (correlation coefficient r=−0.538), and
the correlation was statistically significant (p<0.01) (Table II).
Relationship of miR-23a and MTSS1
expression with clinicopathological parameters of DLBCL
Analysis of the relationship of miR-23a and MTSS1
expression with clinicopathological parameters of DLBCL patients
showed that the high expression of miR-23a and negative expression
of MTSS1 were associated with Ann Arbor staging, extranodal
invasion and International Prognostic Index (IPI) score (p<0.01)
(Table III).
| Table III.Relationship of miR-23a and MTSS1
expression with clinicopathological parameters of DLBCL. |
Table III.
Relationship of miR-23a and MTSS1
expression with clinicopathological parameters of DLBCL.
|
|
| miR-23a | MTSS1 |
|---|
|
|
|
|
|
|---|
| Clinical data | No. | High expression (n,
%) | χ2 | P-value | Negative (n, %) | χ2 | P-value |
|---|
| Sex |
|
|
|
|
|
|
|
|
Male | 34 | 27 (79.41) | 0.01 | >0.05 | 26 (76.47) | 1.32 | >0.05 |
|
Female | 36 | 29 (80.56) |
|
| 23 (63.89) |
|
|
| Age (years) |
|
|
|
|
|
|
|
|
≥60 | 37 | 31 (83.78) | 0.70 | >0.05 | 25 (67.57) | 0.22 | >0.05 |
|
<60 | 33 | 25 (75.76) |
|
| 24 (72.73) |
|
|
| Ann Arbor
staging |
|
|
|
|
|
|
|
|
I–II | 29 | 19 (65.52) | 6.49 | <0.05 | 14 (48.28) | 11.13 | <0.01 |
|
III–IV | 41 | 37 (90.24) |
|
| 35 (85.37) |
|
|
| Extranodal
invasion |
|
|
|
|
|
|
|
|
Yes | 43 | 39 (90.70) | 7.97 | <0.01 | 37 (86.05) | 13.67 | <0.01 |
| No | 27 | 17 (62.96) |
|
| 12 (44.44) |
|
|
| IPI score |
|
|
|
|
|
|
|
|
0–2 | 39 | 27 (69.23) | 6.38 | <0.05 | 22 (56.41) | 7.74 | <0.01 |
|
3–5 | 31 | 29 (93.55) |
|
| 27 (87.70) |
|
|
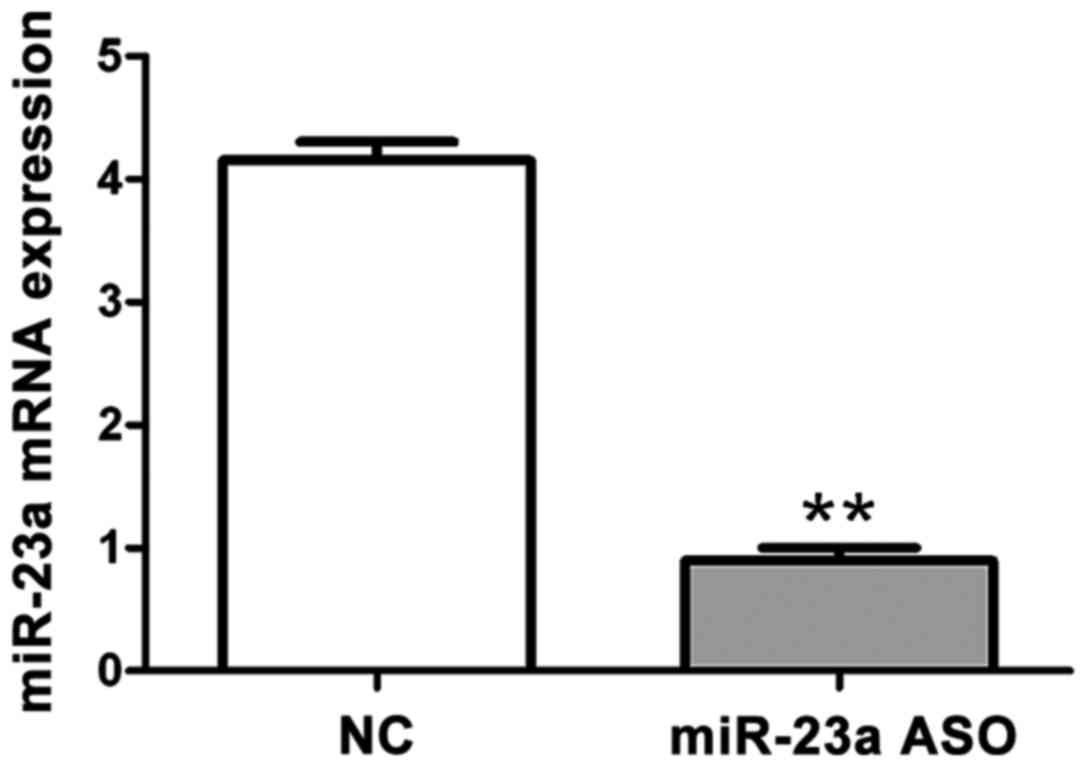
Verification of interference effect of
miR-23a ASO on mRNA via RT-qPCR
As shown in Fig. 3,
RT-qPCR was performed to confirm the interference effect of miR-23a
ASO on mRNA after OCI-LY10 cell transfection. The results showed
that mRNA content in the miR-23a ASO group was significantly lower
than that in the negative control group, and the difference was
statistically significant (p<0.01).
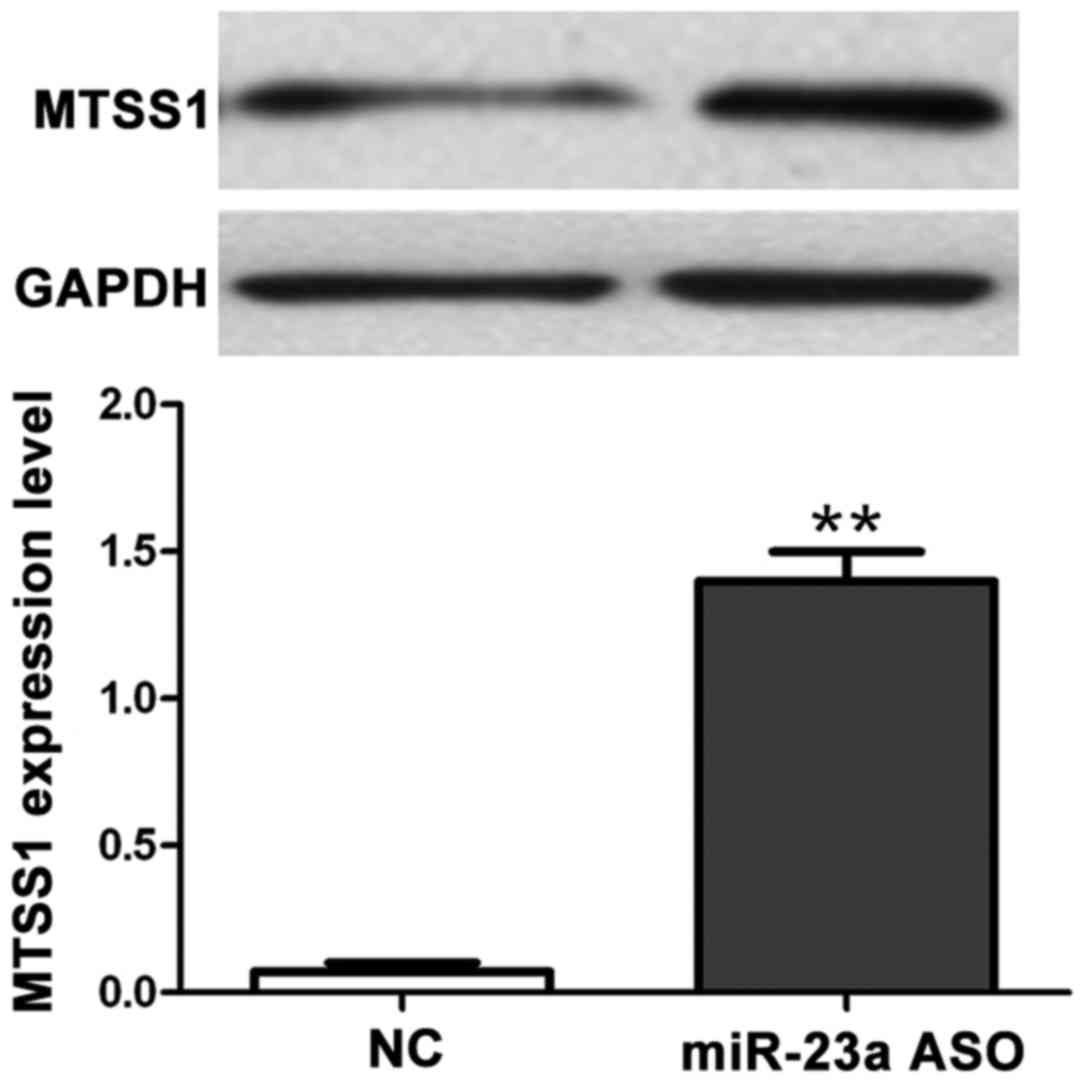
Detection of the effect of miR-23a ASO
interference in miR-23a on MTSS1 protein expression via western
blot analysis
The effect of RNA interference (RNAi) in miR-23a on
MTSS1 protein expression was detected via western blot analysis.
Results showed that compared with the control group, miR-23a
expression in ASO group was decreased (Fig. 3), but the MTSS1 protein expression was
increased (p<0.01), indicating that miR-23a can negatively
regulate the expression of MTSS1 (Fig.
4).
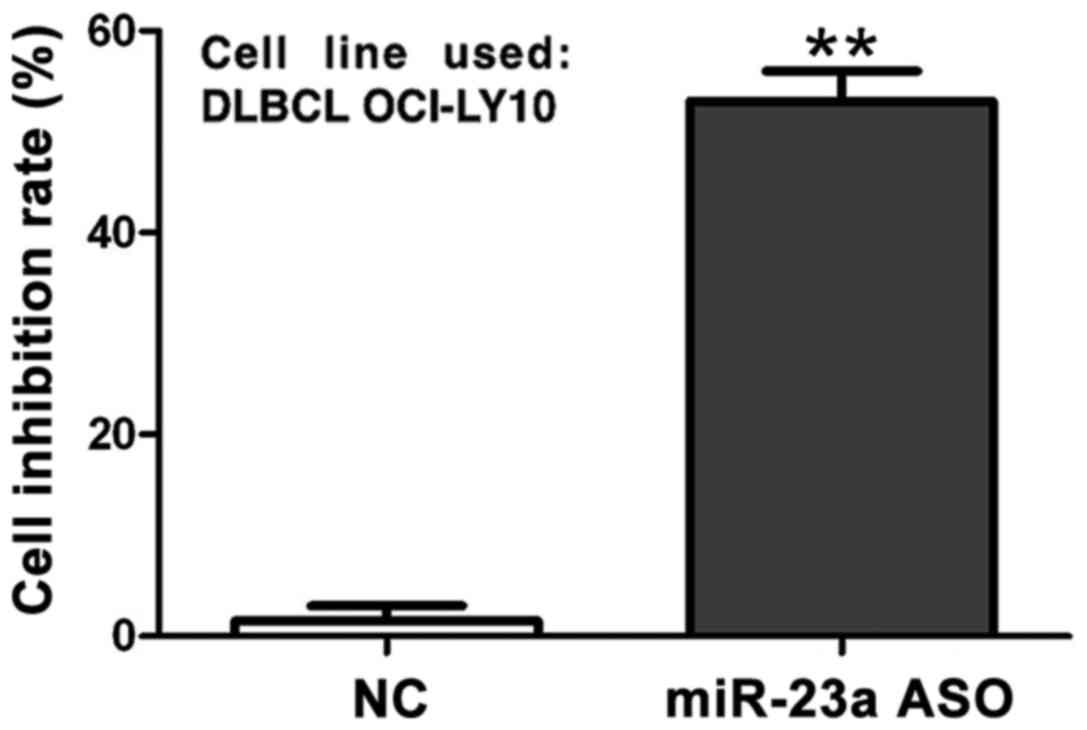
Detection of interference effect of
miR-23a ASO on cell proliferation capacity via MTT assay
MTT assay showed that compared with that in control
group, the cell proliferation inhibition rate in miR-23a ASO
interference group was significantly decreased (p<0.01), while
the inhibition rate increased to 53% at 48 h after transfection
(Fig. 5).
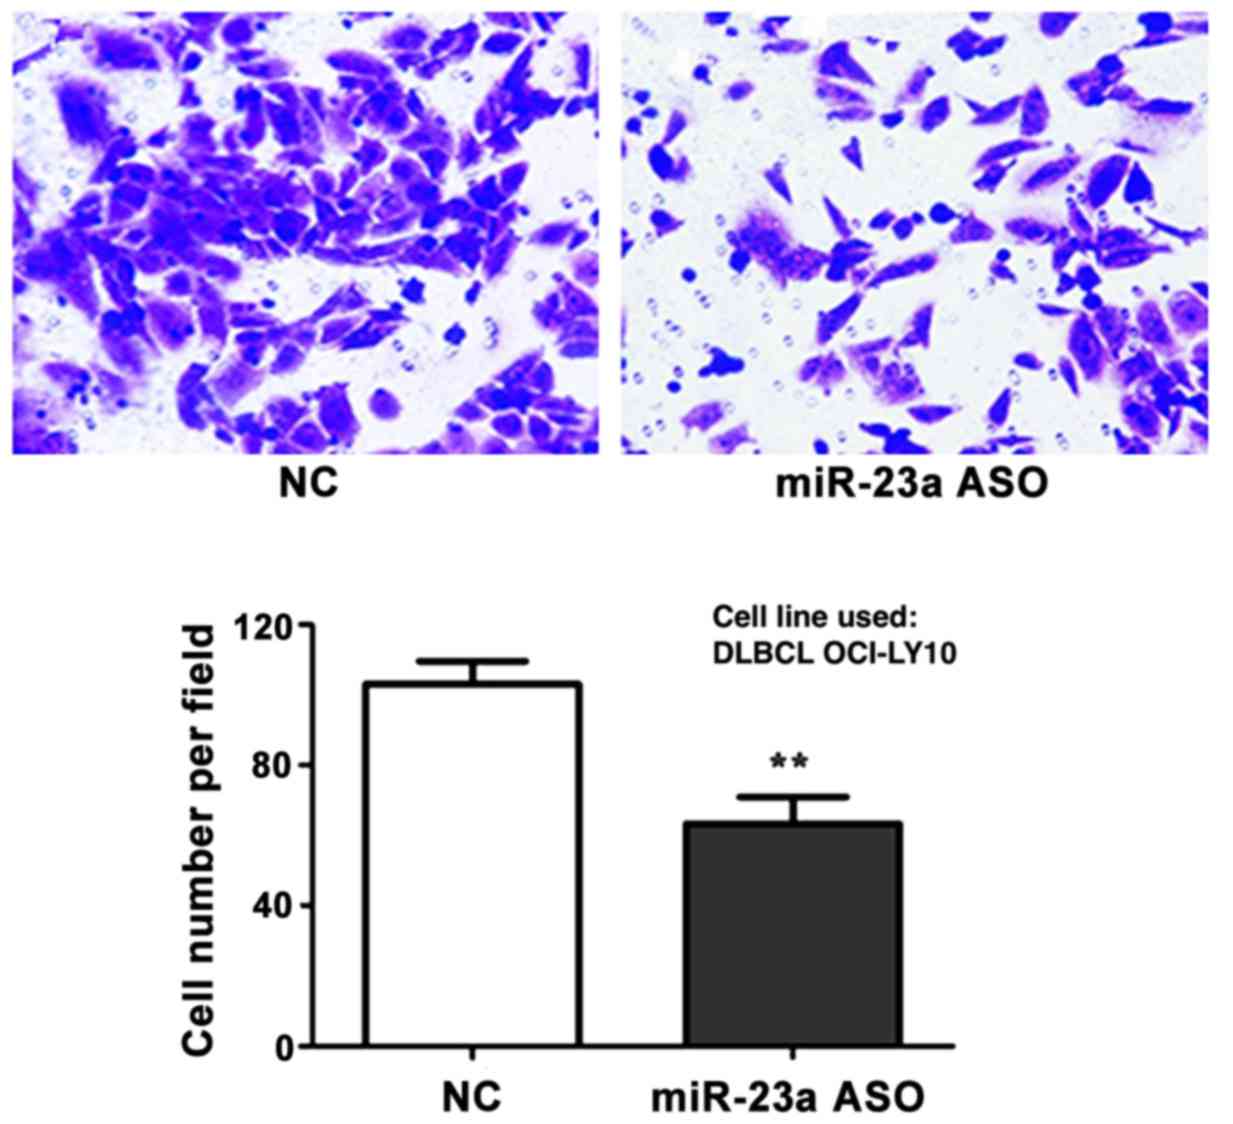
Detection of interference effect of
miR-23a ASO on cell metastasis capacity via Transwell assay
The interference effect of miR-23a ASO on cell
metastasis capacity was investigated via Transwell metastasis
assay. The results revealed that the number of metastatic cells in
ASO group was significantly decreased in comparison to control
group (p<0.01) (Fig. 6).
Discussion
The mechanism involved in the tumor occurrence and
progression is complex, and includes, not only the imbalance among
a variety of oncogenes and tumor suppressor genes, but it also
changes in different signal pathways. The miRNA function has
attracted significant attention in recent years. miRNAs have
multiple important roles in different life processes, such as
tissue embryo development, cell proliferation, differentiation and
apoptosis and immune regulation (16). The discovery of miRNA physiological
function provides a new perspective for the research on tumors.
miRNA is an endogenous small-molecular RNA with
non-coding properties, of 19–24 nucleotides in length and plays an
important role as a signal molecule in cell proliferation,
differentiation, apoptosis and other physiological processes
(17). The expression of miRNAs
regulates cell proliferation and differentiation in the
physiological state, and is related to the occurrence and
progression of tumor during abnormal conditions. The action of
miRNAs binds to the target gene, thereby negatively regulates the
target gene expression at the post-transcriptional level (18). It has also been reported that
miR-23 gene is involved in the cell growth and development,
such as proliferation, apoptosis and mutation. In terms of cell
metabolism, it was reported (19)
that N-acetylglucosyltransferase III, as the target gene of
miR-23a, played a regulatory role in the N-glycan synthesis process
(20). Recent findings have shown
that the occurrence and development of human tumors have very close
relationships with miRNA; there are special miRNAs in many cancer
cells, and these miRNAs regulate the cancer cell proliferation,
apoptosis and invasion (21). In the
tumor research field, miR-23a has become a new concern, which plays
a role as oncogene in most pathways, and participates in tumor
occurrence and metastasis in the respiratory, digestive and
reproductive system (22). MTSS1 has
confirmed ability to inhibit tumor metastasis (23), and the MTSS1-encoded intracellular
proteins play important roles in the recombination of actin
cytoskeleton. Therefore, it is generally believed that the protein
encoded by MTSS1 gene is related to tumor cell
proliferation, invasion and metastasis. Lee et al (24) found that MTSS1 gene expression
was increased in early malignant bladder tumor cell lines, but it
was not expressed or had low expression in the cases of prostate
cancer or breast cancer cell metastasis. Thus, MTSS1 gene
may inhibit tumor cell metastasis.
To investigate the expressions of miR-23a and MTSS1
in DLBCL, their effects on clinicopathological parameters of
patients with DLBCL were explored. The proliferation and metastasis
of DLBCL cells, miR-23a/MTSS1 expressions in DLBCL tissues and
reactive lymphoid hyperplasia tissues were detected using RT-qPCR
as well as immunohistochemistry, respectively. The results showed
that miR-23a mRNA expression in DLBCL tissues was significantly
higher than that in reactive hyperplasia tissues. The
immunohistochemical results revealed that the positive expression
rate of MTSS1 in DLBCL tissues (30%) was significantly lower than
that of reactive hyperplasia tissues (90%). In addition, the
correlation analysis showed that the miR-23a expression had a
significantly negative correlation with MTSS1 expression (r=−0.538,
p<0.01). Moreover, the expression of miR-23a and MTSS1 were
correlated with the Ann Arbor staging, extranodal invasion and IPI
score of patients. However, there was no significant correlation
with the sex and age of patients. In order to further confirm the
effects of miR-23a on MTSS1 expression, cell proliferation and
invasion, DLBCL OCI-LY10 cells were cultured in vitro. The
expression of miR-23a was silenced using the RNAi technique. The
results showed that miR-23a could promote the proliferation and
metastasis of OCI-LY10 cells by negative regulation of MTSS1
expression. The results were consistent with in vivo study
observations. Similar to the results of the present study, a recent
study showed that miR-23 gene had the function of promoting
the proliferation as well as metastasis of gastric cancer cells
(25). Furthermore, the target gene
of miR-23a, MTSS, could inhibit the expression of MTSS, leading to
rapid proliferation and metastasis of colon cancer cells (26). Moreover, the expression of miR-23a in
bladder tumor cells was significantly higher in comparison to
control group. This again demonstrated that miR-23a gene
played an important role in the progression of bladder cancer
(27). In addition, some studies have
also proved that the overexpression of MTSS1 in breast cancer cell
lines could obviously inhibit cancer cell proliferation, invasion
and adhesion. The inhibition was more significant when the
MTSS1 gene was knocked out (28). The study the prognostic significance
of both miR-23a and MTSS1 is to be examined in great detail in our
future studies by the comparative analyses of expression levels of
both miR23a as well as MTSS1 at DLBCL onset, remission and
relapse.
In conclusion, miR-23a and MTSS1 are abnormally
expressed in tumor tissues of patients with DLBCL and their
abnormal expression is related to the Ann Arbor staging, extranodal
invasion and IPI score. Moreover, miR-23a could affect the
proliferation and metastasis of DLBCL cells via negative regulation
of MTSS1 expression.
Acknowledgements
Not applicable.
Funding
No funding was received.
Availability of data and materials
The datasets used and/or analyzed during the current
study are available from the corresponding author on reasonable
request.
Authors' contributions
MX wrote the manuscript. TX and MX were responsible
for IHC, western blot analysis and PCR. Both authors read and
approved the final manuscript.
Ethics approval and consent to
participate
The Clinical Ethics Committee of Xijing Hospital
(Xi'an, China) approved this study, and patients or their families
signed the informed consent.
Consent for publication
Not applicable.
Competing interests
The authors declare that they have no competing
interests.
References
|
1
|
Vaidya R and Witzig TE: Prognostic factors
for diffuse large B-cell lymphoma in the R(X)CHOP era. Ann Oncol.
25:2124–2133. 2014. View Article : Google Scholar : PubMed/NCBI
|
|
2
|
Smith A, Howell D, Patmore R, Jack A and
Roman E: Incidence of haematological malignancy by sub-type: A
report from the Haematological Malignancy Research Network. Br J
Cancer. 105:1684–1692. 2011. View Article : Google Scholar : PubMed/NCBI
|
|
3
|
Hans CP, Weisenburger DD, Greiner TC,
Gascoyne RD, Delabie J, Ott G, Müller-Hermelink HK, Campo E,
Braziel RM, Jaffe ES, et al: Confirmation of the molecular
classification of diffuse large B-cell lymphoma by
immunohistochemistry using a tissue microarray. Blood. 103:275–282.
2004. View Article : Google Scholar : PubMed/NCBI
|
|
4
|
Shankland KR, Armitage JO and Hancock BW:
Non-Hodgkin lymphoma. Lancet. 380:848–857. 2012. View Article : Google Scholar : PubMed/NCBI
|
|
5
|
Ghielmini M, Vitolo U, Kimby E, Montoto S,
Walewski J, Pfreundschuh M, Federico M, Hoskin P, McNamara C,
Caligaris-Cappio F, et al: Panel Members of the 1st ESMO Consensus
Conference on Malignant Lymphoma: ESMO Guidelines consensus
conference on malignant lymphoma 2011 part 1: Diffuse large B-cell
lymphoma (DLBCL), follicular lymphoma (FL) and chronic lymphocytic
leukemia (CLL). Ann Oncol. 24:561–576. 2013. View Article : Google Scholar : PubMed/NCBI
|
|
6
|
Essadi I, Ismaili N, Tazi E, Elmajjaoui S,
Saidi A, Ichou M and Errihani H: Primary lymphoma of the head and
neck: Two case reports and review of the literature. Cases J.
1:4262008. View Article : Google Scholar : PubMed/NCBI
|
|
7
|
PDQ Adult Treatment Editorial Board: Adult
Non-Hodgkin Lymphoma Treatment (PDQ): Health Professional
VersionPDQ Cancer Information Summaries [Internet]. National Cancer
Institute (US); Bethesda: 2002
|
|
8
|
Dogan A, Bagdi E, Munson P and Isaacson
PG: CD10 and BCL-6 expression in paraffin sections of normal
lymphoid tissue and B-cell lymphomas. Am J Surg Pathol. 24:846–852.
2000. View Article : Google Scholar : PubMed/NCBI
|
|
9
|
Chhabra R, Dubey R and Saini N:
Cooperative and individualistic functions of the microRNAs in the
miR-23a~27a~24-2 cluster and its implication in human diseases. Mol
Cancer. 9:2322010. View Article : Google Scholar : PubMed/NCBI
|
|
10
|
Chhabra R, Adlakha YK, Hariharan M, Scaria
V and Saini N: Upregulation of miR-23a-27a-24-2 cluster induces
caspase-dependent and -independent apoptosis in human embryonic
kidney cells. PLoS One. 4:e58482009. View Article : Google Scholar : PubMed/NCBI
|
|
11
|
Kong KY, Owens KS, Rogers JH, Mullenix J,
Velu CS, Grimes HL and Dahl R: MIR-23A microRNA cluster inhibits
B-cell development. Exp Hematol. 38(629–640): e12010.
|
|
12
|
Schetter AJ, Nguyen GH, Bowman ED, Mathé
EA, Yuen ST, Hawkes JE, Croce CM, Leung SY and Harris CC:
Association of inflammation-related and microRNA gene expression
with cancer-specific mortality of colon adenocarcinoma. Clin Cancer
Res. 15:5878–5887. 2009. View Article : Google Scholar : PubMed/NCBI
|
|
13
|
Wang WL, Yang C, Han XL, Wang R, Huang Y,
Zi YM and Li JD: MicroRNA-23a expression in paraffin-embedded
specimen correlates with overall survival of diffuse large B-cell
lymphoma. Med Oncol. 31:9192014. View Article : Google Scholar : PubMed/NCBI
|
|
14
|
Du P, Ye L, Li H, Yang Y and Jiang WG: The
tumour suppressive role of metastasis suppressor-1, MTSS1, in human
kidney cancer, a possible connection with the SHH pathway. J Exp
Ther Oncol. 10:91–99. 2012.PubMed/NCBI
|
|
15
|
Jahid S, Sun J, Edwards RA, Dizon D,
Panarelli NC, Milsom JW, Sikandar SS, Gümüs ZH and Lipkin SM:
miR-23a promotes the transition from indolent to invasive
colorectal cancer. Cancer Discov. 2:540–553. 2012. View Article : Google Scholar : PubMed/NCBI
|
|
16
|
Brennecke J, Hipfner DR, Stark A, Russell
RB and Cohen SM: bantam encodes a developmentally regulated
microRNA that controls cell proliferation and regulates the
proapoptotic gene hid in Drosophila. Cell. 113:25–36. 2003.
View Article : Google Scholar : PubMed/NCBI
|
|
17
|
Blower PE, Chung JH, Verducci JS, Lin S,
Park JK, Dai Z, Liu CG, Schmittgen TD, Reinhold WC, Croce CM, et
al: MicroRNAs modulate the chemosensitivity of tumor cells. Mol
Cancer Ther. 7:1–9. 2008. View Article : Google Scholar : PubMed/NCBI
|
|
18
|
Du T and Zamore PD: microPrimer: The
biogenesis and function of microRNA. Development. 132:4645–4652.
2005. View Article : Google Scholar : PubMed/NCBI
|
|
19
|
Bushati N and Cohen SM: microRNA
functions. Annu Rev Cell Dev Biol. 23:175–205. 2007. View Article : Google Scholar : PubMed/NCBI
|
|
20
|
Rao SA, Santosh V and Somasundaram K:
Genome-wide expression profiling identifies deregulated miRNAs in
malignant astrocytoma. Mod Pathol. 23:1404–1417. 2010. View Article : Google Scholar : PubMed/NCBI
|
|
21
|
Deng D, Wang L, Chen Y, Li B, Xue L, Shao
N, Wang Q, Xia X, Yang Y and Zhi F: MicroRNA-124-3p regulates cell
proliferation, invasion, apoptosis, and bioenergetics by
targetingPIM1 in astrocytoma. Cancer Sci. 107:899–907. 2016.
View Article : Google Scholar : PubMed/NCBI
|
|
22
|
Hu X, Chen D, Cui Y, Li Z and Huang J:
Targeting microRNA-23a to inhibit glioma cell invasion via HOXD10.
Sci Rep. 3:34232013. View Article : Google Scholar : PubMed/NCBI
|
|
23
|
Lee SH, Kerff F, Chereau D, Ferron F, Klug
A and Dominguez R: Structural basis for the actin-binding function
of missing-in-metastasis. Structure. 15:145–155. 2007. View Article : Google Scholar : PubMed/NCBI
|
|
24
|
Lee YG, Macoska JA, Korenchuk S and Pienta
KJ: MIM, a potential metastasis suppressor gene in bladder cancer.
Neoplasia. 4:291–294. 2002. View Article : Google Scholar : PubMed/NCBI
|
|
25
|
Li X, Zhang Y, Zhang H, Liu X, Gong T, Li
M, Sun L, Ji G, Shi Y, Han Z, et al: miRNA-223 promotes gastric
cancer invasion and metastasis by targeting tumor suppressor
EPB41L3. Mol Cancer Res. 9:824–833. 2011. View Article : Google Scholar : PubMed/NCBI
|
|
26
|
Wang Z, Wei W and Sarkar FH: miR-23a, a
critical regulator of ‘migR’ ation and metastasis in colorectal
cancer. Cancer Discov. 2:489–491. 2012. View Article : Google Scholar : PubMed/NCBI
|
|
27
|
Gottardo F, Liu CG, Ferracin M, Calin GA,
Fassan M, Bassi P, Sevignani C, Byrne D, Negrini M, Pagano F, et
al: Micro-RNA profiling in kidney and bladder cancers. Urol Oncol.
25:387–392. 2007. View Article : Google Scholar : PubMed/NCBI
|
|
28
|
Parr C and Jiang WG: Metastasis suppressor
1 (MTSS1) demonstrates prognostic value and anti-metastatic
properties in breast cancer. Eur J Cancer. 45:1673–1683. 2009.
View Article : Google Scholar : PubMed/NCBI
|