Introduction
Pleural effusion (PE) is divided into exudative
effusion and transudative effusion. Exudative effusion is
predominantly caused by diseases such as infection or cancers.
Transudative effusion is mainly caused by diseases such as heart
failure, liver failure and kidney malfunction (1). A large proportion of pleural
inflammation is caused by bacterial infection, especially
mycobacterium tuberculosis accompanied by benign PE. By contrast,
many types of tumours that metastasize to lung or lung cancer in
situ are associated with malignant PE. Initially, cytological,
biochemical and microbiological analyses were used to investigate
PE types (2); however, these were
insufficient to differentiate benign PE from malignant PE. In
recent years, the diagnosis has been made with invasive techniques
such as video-assisted thoracic surgery (VATS) and thoracoscopic
biopsy (3). Nevertheless, the
clinical use of thoracoscopy has been restricted, since some
patients cannot tolerate anaesthesia including intubation or are
unable to be evaluated because of serious conditions (4). Although the indications for thoracoscopy
are increasing, it is contraindicated in unfit patients (5).
Recently, tumour markers have been widely used for
the diagnosis of PE, including carcinoembryonic antigen (CEA),
neuron-specific enolase (NSE), cytokeratin 19 (CYFRA 21–1), CA125,
CA153 and CA199. However, these markers are improper for clinical
practice because of their low sensitivity and specificity (4,6–12).
Procalcitonin (PCT) is produced by extra-thyroidal
organs such as the lung and liver after infections, especially
bacterial infections (13,14). PCT is thought to be a vital marker in
the diagnosis of sepsis (13–16). Therefore, PCT is often used to
distinguish bacterial infections from other diseases (17–20).
Reportedly, PCT is elevated in pneumonia and decreased in
tuberculosis and malignant PE (21).
Meanwhile, the acute-phase reactant protein C-reaction protein
(CRP) is primarily produced by the liver (22). The level of CRP in PE can be used to
distinguish parapneumonic effusion from other types of effusion
(23). To increase the sensitivity
and specificity of PE discrimination, we intended to evaluate the
diagnostic performance of PCT, CRP and CEA for detecting malignant
pleural disorders.
Materials and methods
Subjects
One hundred and fifty patients with a specific
diagnosis of exudative PE at the Affiliated Hospital of Nanjing
University of Traditional Chinese Medicine were enrolled in this
study from January 2016 to April 2017. Another group including 43
patients with exudative PE from December 2017 to March 2018 was
considered to verify the effect of the combined biomarkers in
detecting malignant pleural disorders. The study was approved by
the Ethical Committee of Affiliated Hospital of Nanjing University
of Traditional Chinese Medicine. All subjects agreed the study and
signed informed consent letters.
An initial diagnostic thoracocentesis for
microbiological, biochemical, and cytological studies was performed
in all patients, and thoracoscopy was conducted to identify the
disorder. The determination of PE aetiology was based on criteria
as follows: Malignant PEs were confirmed through cytological and/or
histological examination, most originating from tumours
metastasized to lung tissue or lung cancer in situ. Benign
PEs were from empyema, pneumonia and tuberculosis patients. The
levels of CRP, PCT and CEA in pleural fluid and serum were analysed
in all patients before any treatment.
Measurement of PCT, CEA and CRP
levels
Five millilitres of pleural fluid from each patient
was collected in the course of thoracocentesis and/or pleural
biopsy. The pleural fluid was centrifuged at 3,500 rpm for 10 min
at 4°C, and supernatants was obtained and stored at −20°C.
Simultaneously, 5 ml of blood from each patient was obtained for
serum samples. The levels of PCT were measured by a Getein1100
fluorescence immunity analyser (Getein Biotech, Inc., Nanjing,
China) with a functional assay sensitivity of 0.1 ng/ml. The CRP
levels were detected by a QuikRead go immunity analyser (Orion
Diagnostica Oy, Inc., Espoo, Finland) with a functional assay
sensitivity of 1.0 mg/l. The CEA levels were detected by a Unicel
Dxi800 microparticle chemiluminescence immunity analyser (Beckman
Coulter, Inc., Brea, CA, USA) with a functional assay sensitivity
of 0.1 ng/ml. All levels were analysed according to manufacturers'
instructions.
Statistical analysis
Since the data were not normally distributed, they
were expressed as medians (interquartile range). We used the
Mann-Whitney U test and Fisher's exact test for nonparametric
variables to compare the differences. McNemar's test was used to
evaluate the effectiveness of the combined biomarkers. The P-values
were corrected for the number of comparisons using the Bonferroni
method, and all tests were two-tailed. Spearman's rank test was
used for correlation assessments. ROCs were analysed to determine
the optimal cut-off values, and the area under the curve (AUC)
values were compared to select the variables that predict the
differentiation. P<0.05 was considered statistically
significant. All statistical analyses were performed using the
Statistical Package for Social Sciences software, version 16.0
(SPSS, Chicago, IL, USA).
Results
Clinical data and biological features
of all the enrolled patients
A total of 150 patients were enrolled in this study.
The benign group included 93 cases of benign PE: 25 cases of
empyema, 41 cases of pneumonia and 27 cases of tuberculosis, aged
46–91 years. The malignant group included 57 cases of malignant PE:
28 cases of lung cancer and 29 cases of cancers metastasized to
lung tissue, aged 43–92 years. The benign group was divided into 3
subgroups. The clinical data and biological features of the
patients are shown in Table I. These
two groups included 77 men and 73 women, and patients studied were
mainly older than 40 years of age, with a mean age of 70 years.
There were no differences in terms of age and sex between groups.
Under ultrasound, a large overlap in pleural effusion capacity was
found between the benign and malignant pleural disorders.
Nevertheless, cases with a large amount of fluid were more common
in malignant pleural disorders.
 | Table I.Clinical data of the populations. |
Table I.
Clinical data of the populations.
| Characteristic | Benign PE (n=93) | Malignant PE
(n=57) | P-value |
|---|
| Age, years | 71 (53–85) | 69 (47–83) | ns |
| Sex, M/F | 48/45 | 29/28 | ns |
| PE capacity, ml | 267 (93–610) | 719 (114–1,580) | 0.041 |
| PE WBC,
103/µl | 640 (270–2,000) | 930 (450–1,800) | 0.485 |
| PE NE, % | 67 (30–83) | 70 (39–91) | 0.469 |
| Sera |
|
|
|
| CRP,
mg/l | 41.0 (19.0–86.2) | 12.5 (5.0–33.2) | <0.001 |
| PCT,
ng/ml | 0.64 (0.14–3.21) | 0.11 (0.10–0.17) | 0.032 |
| CEA,
mg/l | 1.91 (1.00–3.12) | 10.82
(2.40–75.90) | 0.001 |
| Pleural fluid |
|
|
|
| CRP,
mg/l | 20.0 (8.0–41.0) | 4.0 (3.0–6.0) | 0.001 |
| PCT,
ng/ml | 0.22 (0.10–1.39) | 0.11 (0.10–0.15) | 0.017 |
| CEA,
mg/l | 1.27 (1.00–3.00) | 69.13
(13.20–499.33) | 0.001 |
| ADA,
IU/l | 10.7 (4.5–38.8) | 9.0 (5.9–12.8) | 0.081 |
| LDH,
IU/l | 293 (135–598) | 364 (212–790) | 0.448 |
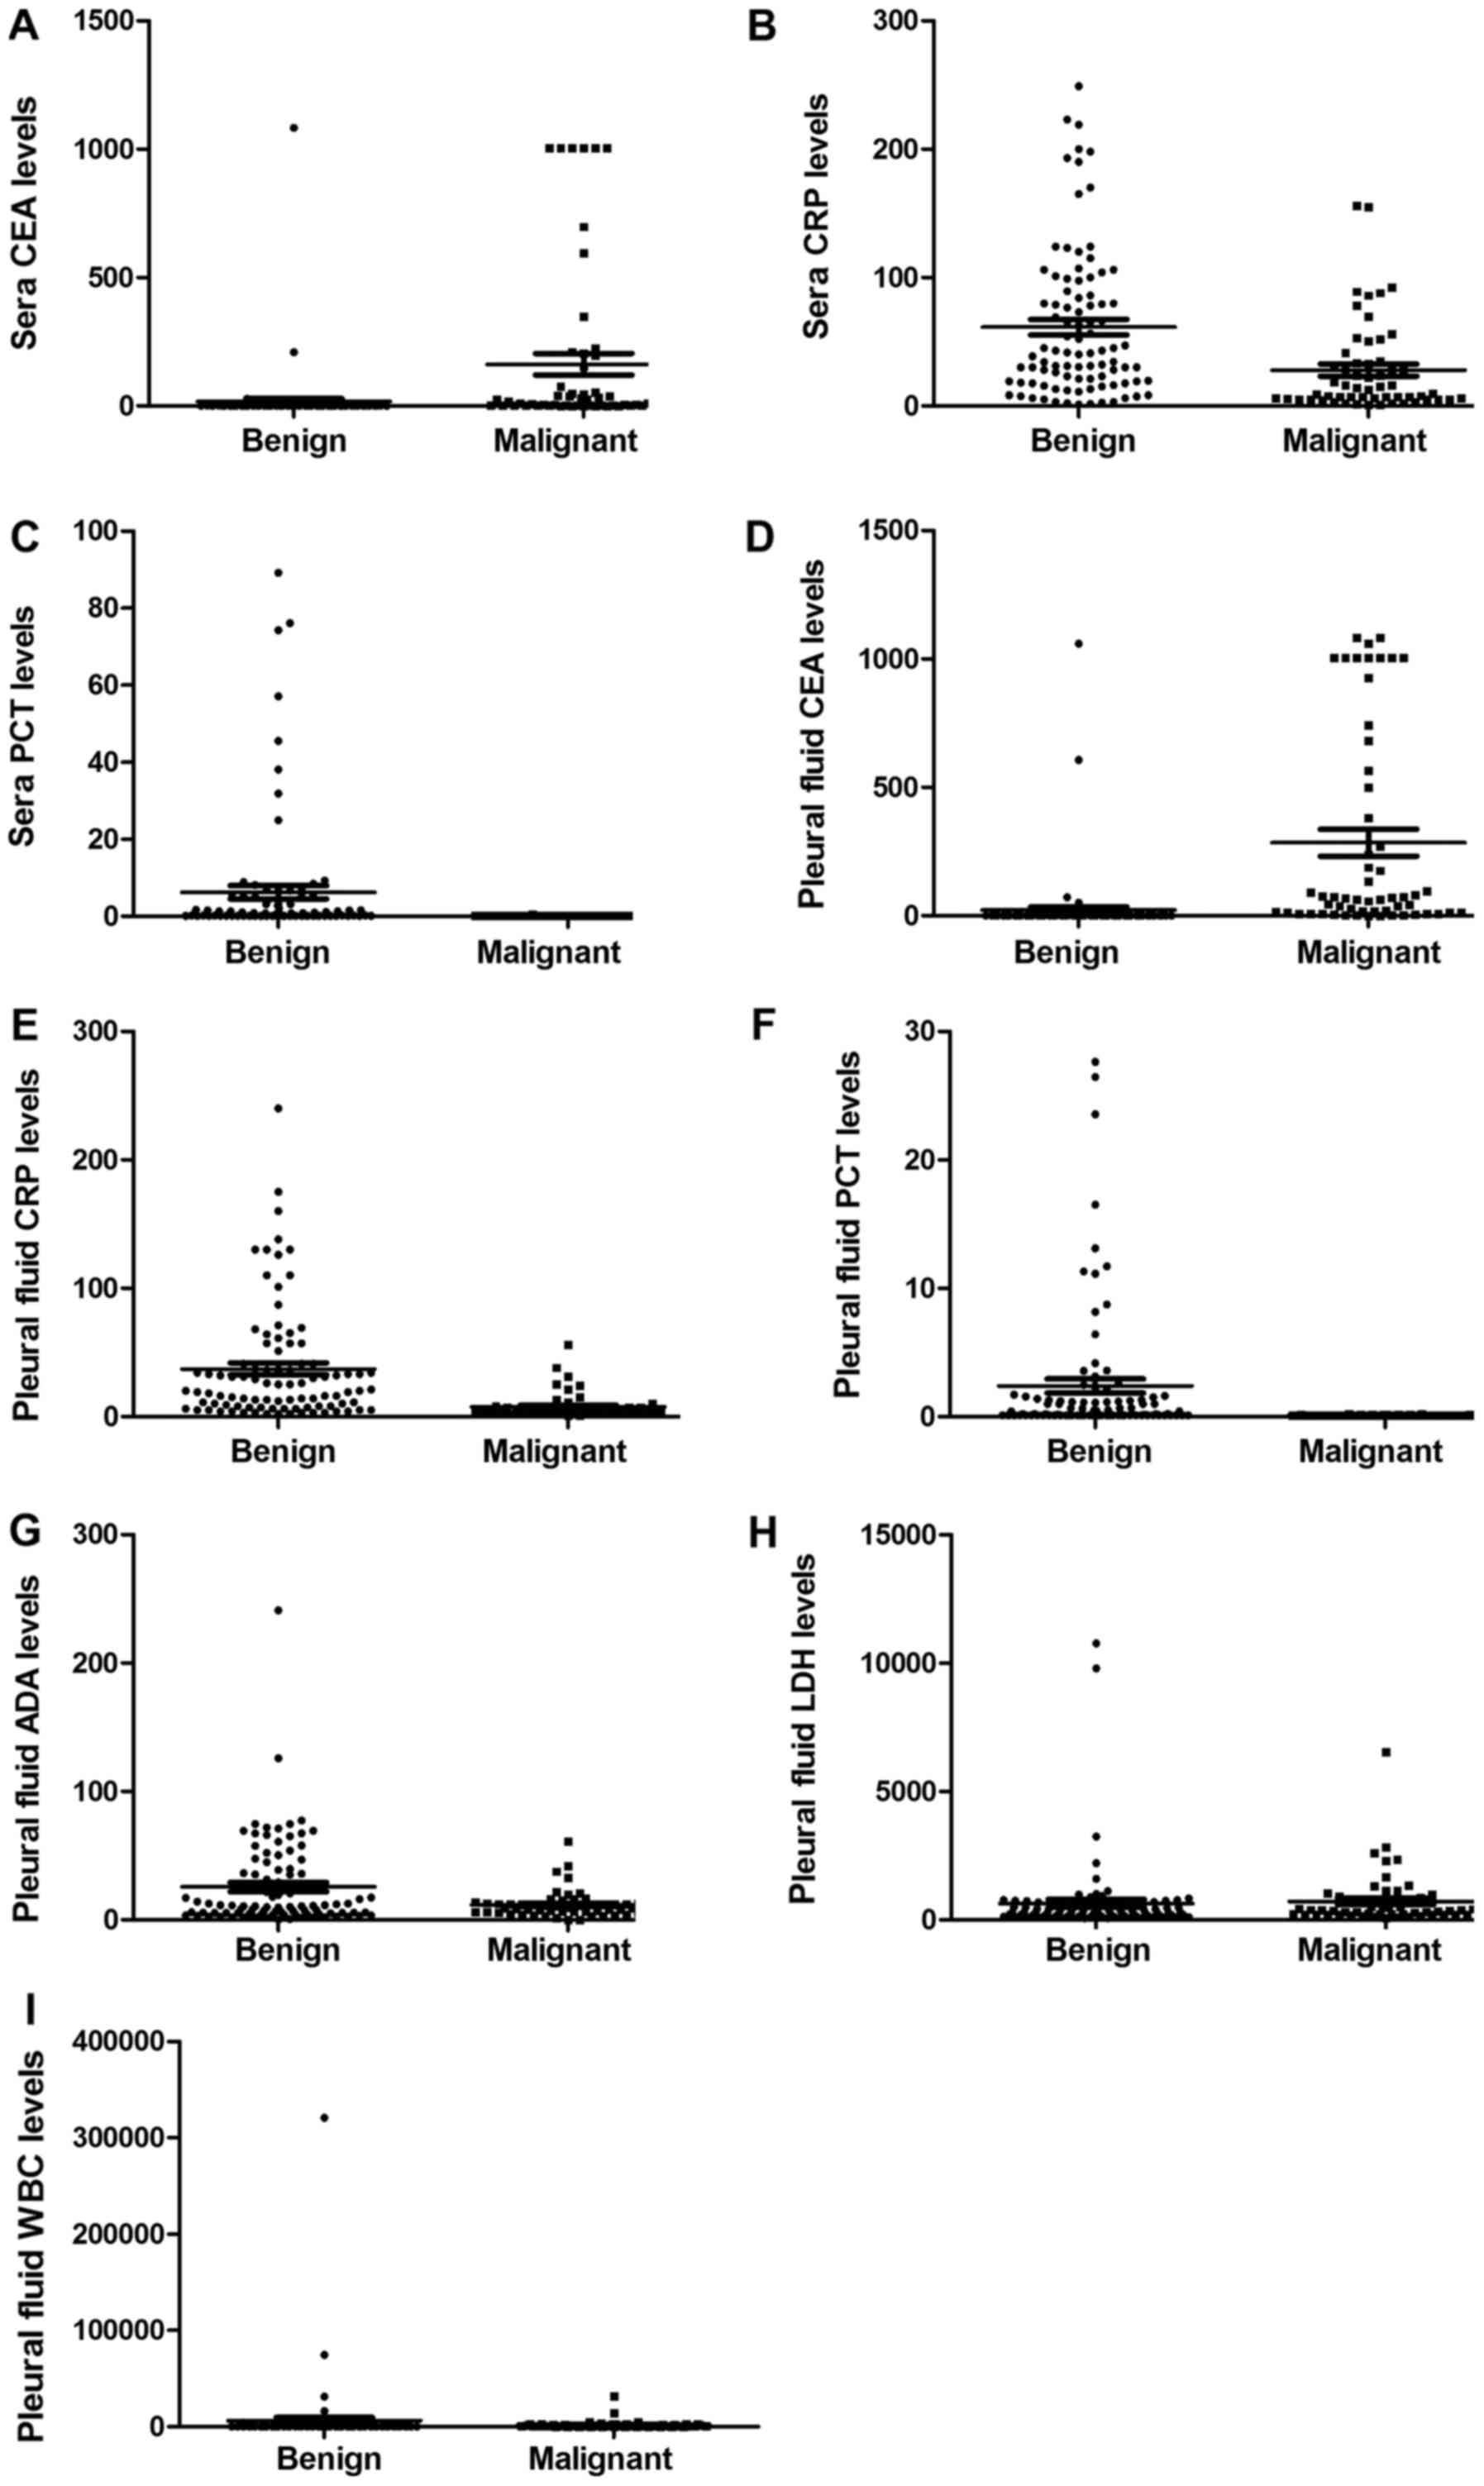
As shown in Table I
and Fig. 1, the positive rate of
white blood cell (WBC) count in all participating populations was
94.1%, while the positive rate of neutrophil (NE) was 73.8%.
However, neither WBCs counts nor NE percentages were different
between the groups. The pleural PCT, pleural CRP, sPCT and sCRP
levels were markedly higher in benign patients. By contrast, the
pleural CEA and sCEA levels were substantially lower in benign
patients. Although the levels of adenosine deaminase (ADA) and
lactate dehydrogenase (LDH) in several tuberculosis PE patients
were much higher, no significant differences were observed between
the benign and malignant PEs.
Subgroup analysis of benign
populations
To explore whether there were significant
differences between pneumonia and empyema and tuberculous PE, a
subgroup analysis of these groups was performed, and the
statistical relevance of this analysis was negative, as shown in
Table II.
| Table II.Clinical data of the benign
patients. |
Table II.
Clinical data of the benign
patients.
| Characteristic | Pneumonia
(n=41) | Empyema (n=25) | Tuberculous PE
(n=27) |
|---|
| Sera |
|
|
|
| CRP,
mg/l | 41.2
(17.3–96.4) | 41.8
(29.1–106.5) | 37.5
(15.7–73.1) |
| PCT,
ng/ml | 0.61
(0.11–3.16) | 0.60
(0.15–3.01) | 0.54
(0.12–3.37) |
| CEA,
mg/l | 1.93
(1.00–3.58) | 1.81
(1.10–3.02) | 1.95
(1.06–3.52) |
| Pleural fluid |
|
|
|
| CRP,
mg/l | 20.1
(6.2–49.3) | 27.8
(7.0–61.5) | 17.9
(3.0–37.1) |
| PCT,
ng/ml | 0.21
(0.10–1.45) | 0.27
(0.10–1.18) | 0.29
(0.11–1.09) |
| CEA,
mg/l | 1.24
(1.10–3.61) | 1.27
(1.02–3.30) | 1.34
(1.13–4.69) |
Descriptive analysis of parameters
determined in sera and in pleural fluid
It was worth mentioning that the levels of PCT, CRP
and CEA in both the pleural fluid and serum varied over a wide
range. Similarly, the effusion/serum ratios of PCT, CRP and CEA
also varied over a wide range, especially for CEA, nevertheless,
there were no significant differences between benign and malignant
patients, as shown in Table
III.
| Table III.Descriptive analysis of parameters
determined in sera and in pleural fluid and their PE/sera ratio
(n=100). |
Table III.
Descriptive analysis of parameters
determined in sera and in pleural fluid and their PE/sera ratio
(n=100).
|
|
|
| PE/Sera |
|---|
|
|
|
|
|
|---|
| Parameters | Sera range | Pleural fluid
range | Benign | Malignant | P-value |
|---|
| CRP, mg/l | <1–200 | <1–240 | 0.86
(0.37–1.93) | 0.79
(0.46–1.80) | 0.078 |
| PCT, ng/ml | <0.1–89.2 | <0.1–27.6 | 1.23
(0.49–2.96) | 1.12
(0.31–2.77) | 0.091 |
| CEA, mg/l | <1–1083 | <1–1083 | 6.71
(1.05–21.17) | 6.02
(0.91–19.49) | 0.117 |
Correlation analysis of CRP, CEA, PCT
and WBC in pleural fluid and in sera
To assay the values of the abovementioned markers to
discriminate between benign and malignant PE, correlation analysis
of CRP, CEA, PCT and WBC in the pleural fluid and serum were
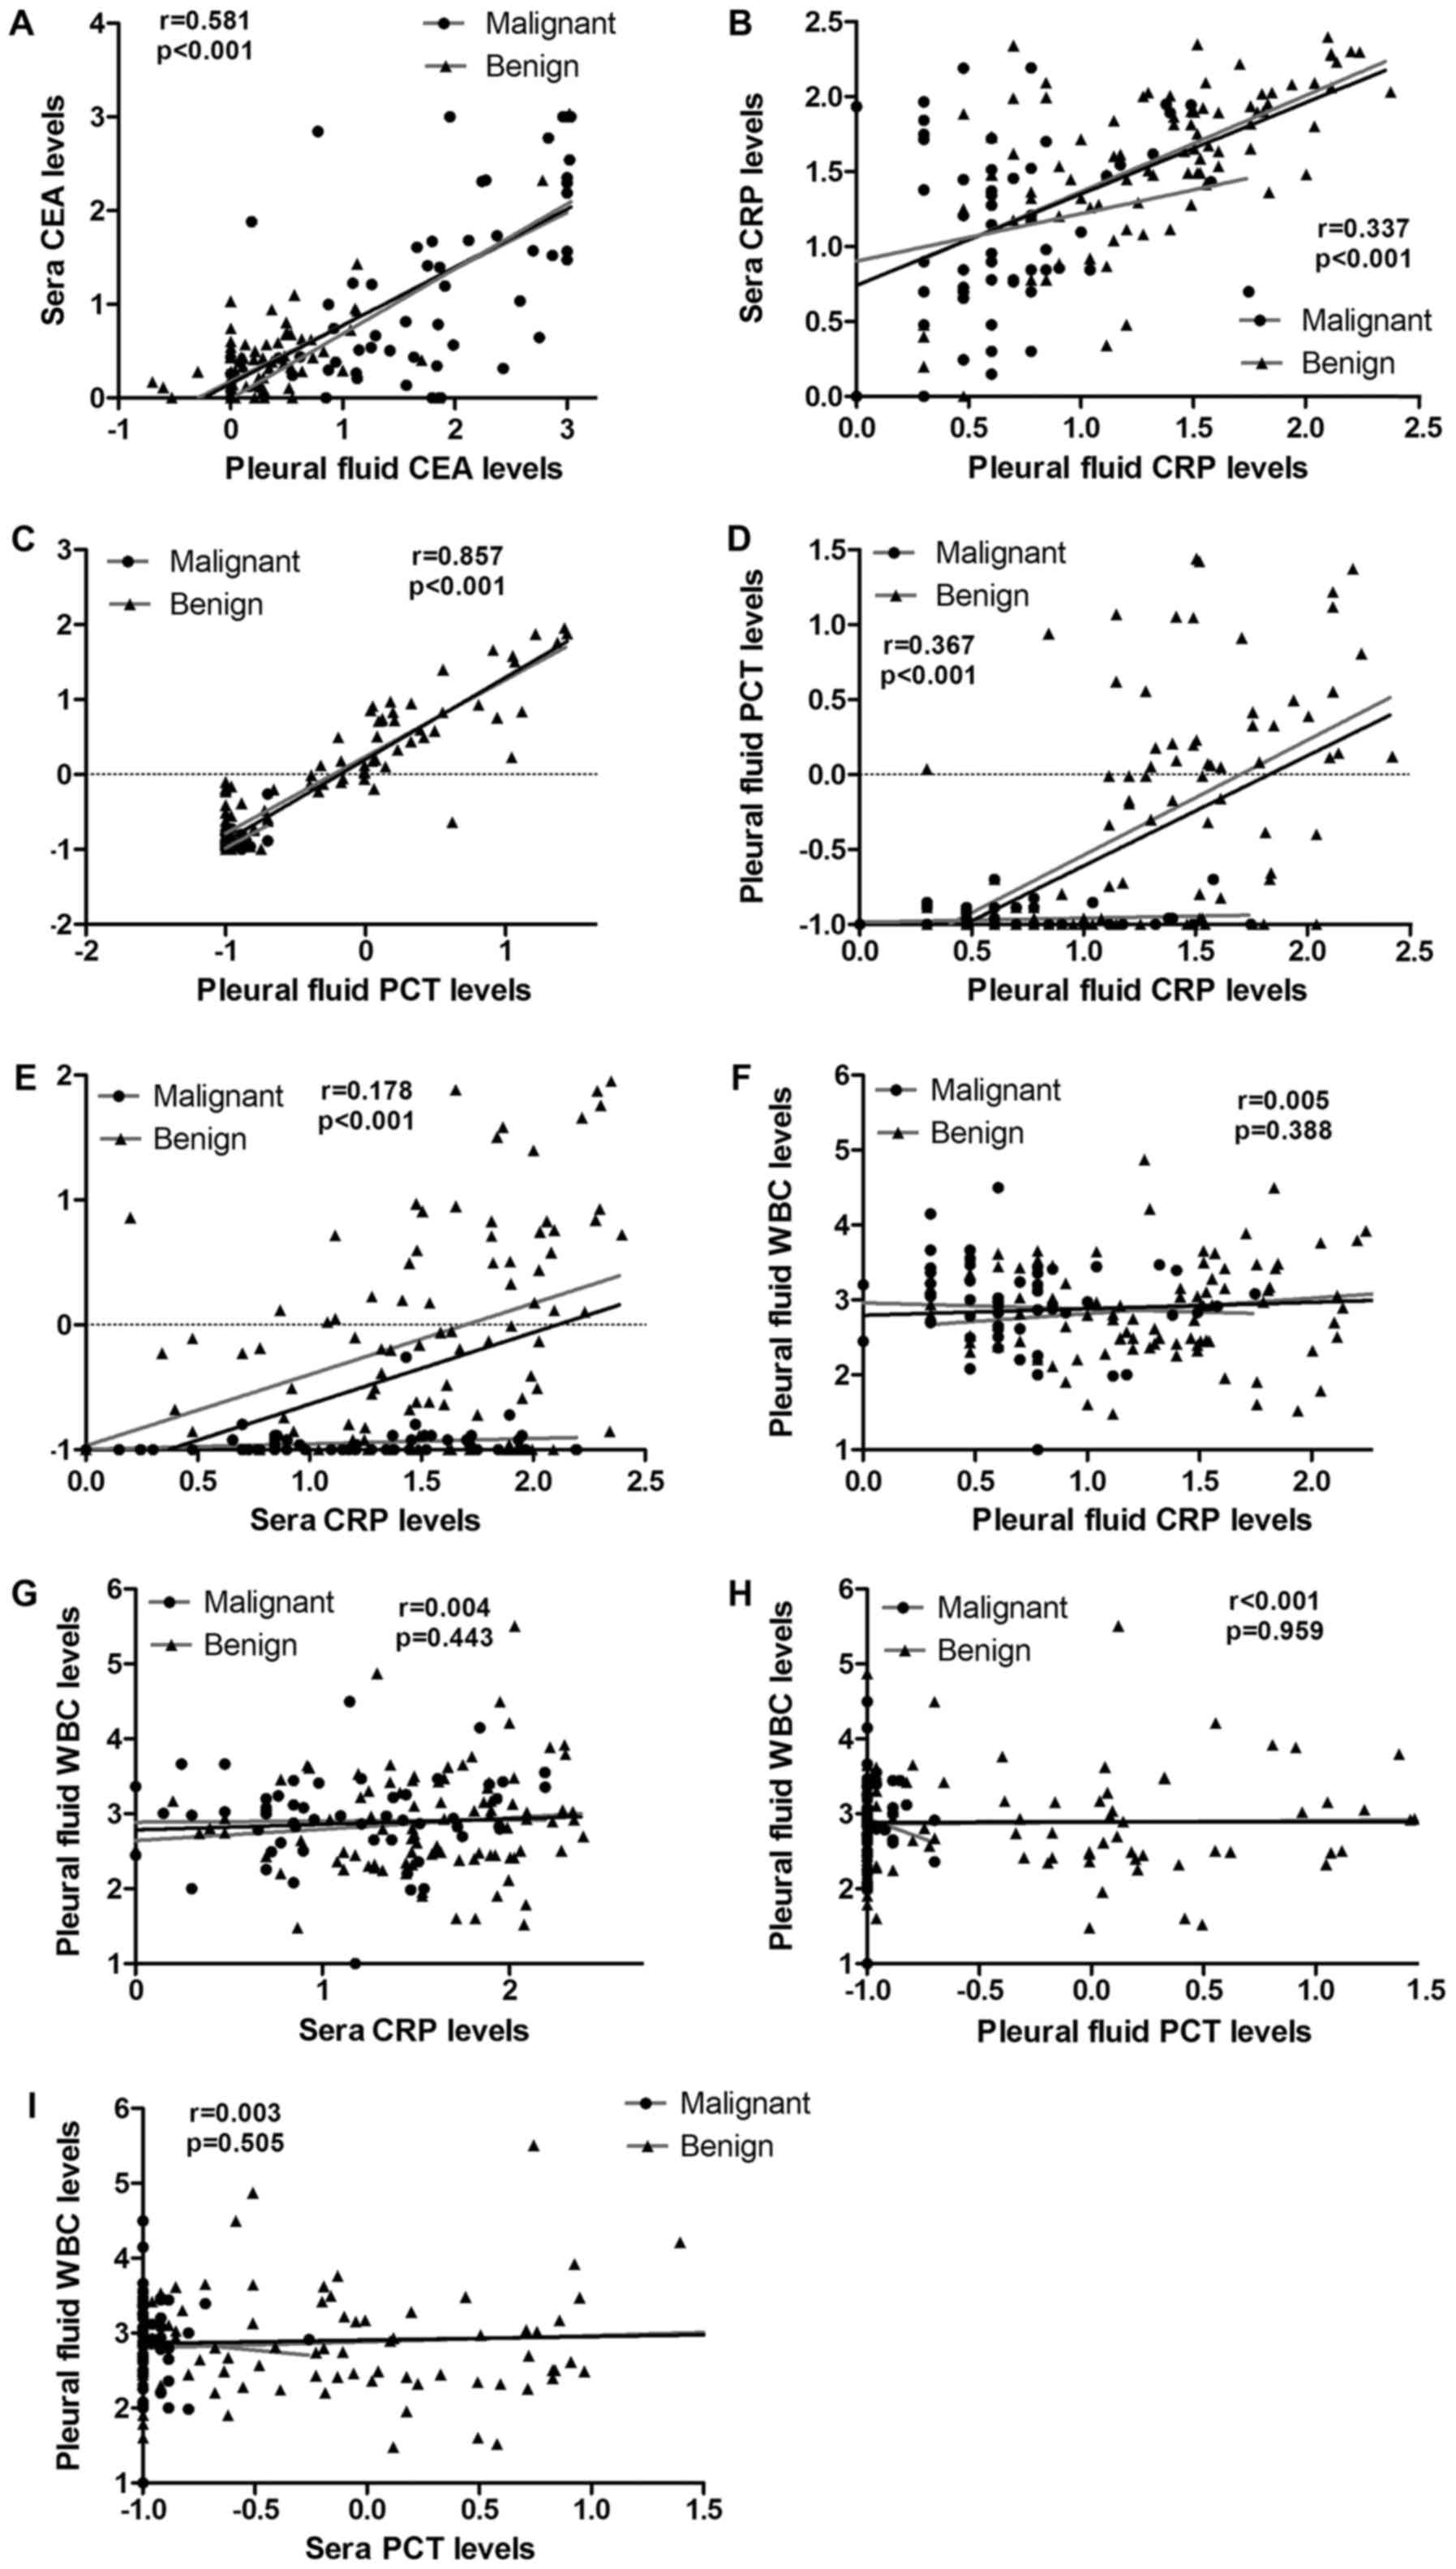
performed. As shown in Table IV and
Fig. 2, a significant positive
correlation between pleural PCT and sPCT was found (Spearman's
r=0.857; P<0.001). Meanwhile, a positive correlation between the
pleural CEA and sCEA levels was also found (Spearman's r=0.581;
P<0.001); no correlation was found for CRP (Spearman's r=0.337;
P<0.001). Additionally, there were no correlations between the
pleural PCT and pleural CRP, or sPCT and sCRP levels (Spearman's
r=0.367, P<0.001; Spearman's r=0.178; P<0.001,
respectively).
| Table IV.Correlation analysis of CRP, CEA, PCT
and WBC in pleural fluid and in sera. |
Table IV.
Correlation analysis of CRP, CEA, PCT
and WBC in pleural fluid and in sera.
| Parameter | Spearman's r | P-value |
|---|
| Pleural CRP and
sCRP | 0.337 | <0.001 |
| Pleural CEA and
sCEA | 0.581 | <0.001 |
| Pleural PCT and
sPCT | 0.857 | <0.001 |
| Pleural CRP and
pleural PCT | 0.367 | <0.001 |
| sCRP and sPCT | 0.178 | <0.001 |
| Pleural CRP and
pleural WBC | 0.005 | 0.388 |
| sCRP and pleural
WBC | 0.004 | 0.443 |
| Pleural PCT and
pleural WBC | <0.001 | 0.959 |
| sPCT and pleural
WBC | 0.003 | 0.505 |
Use of cut-off values of individual
biomarker or in combination for discrimination between benign and
malignant PE
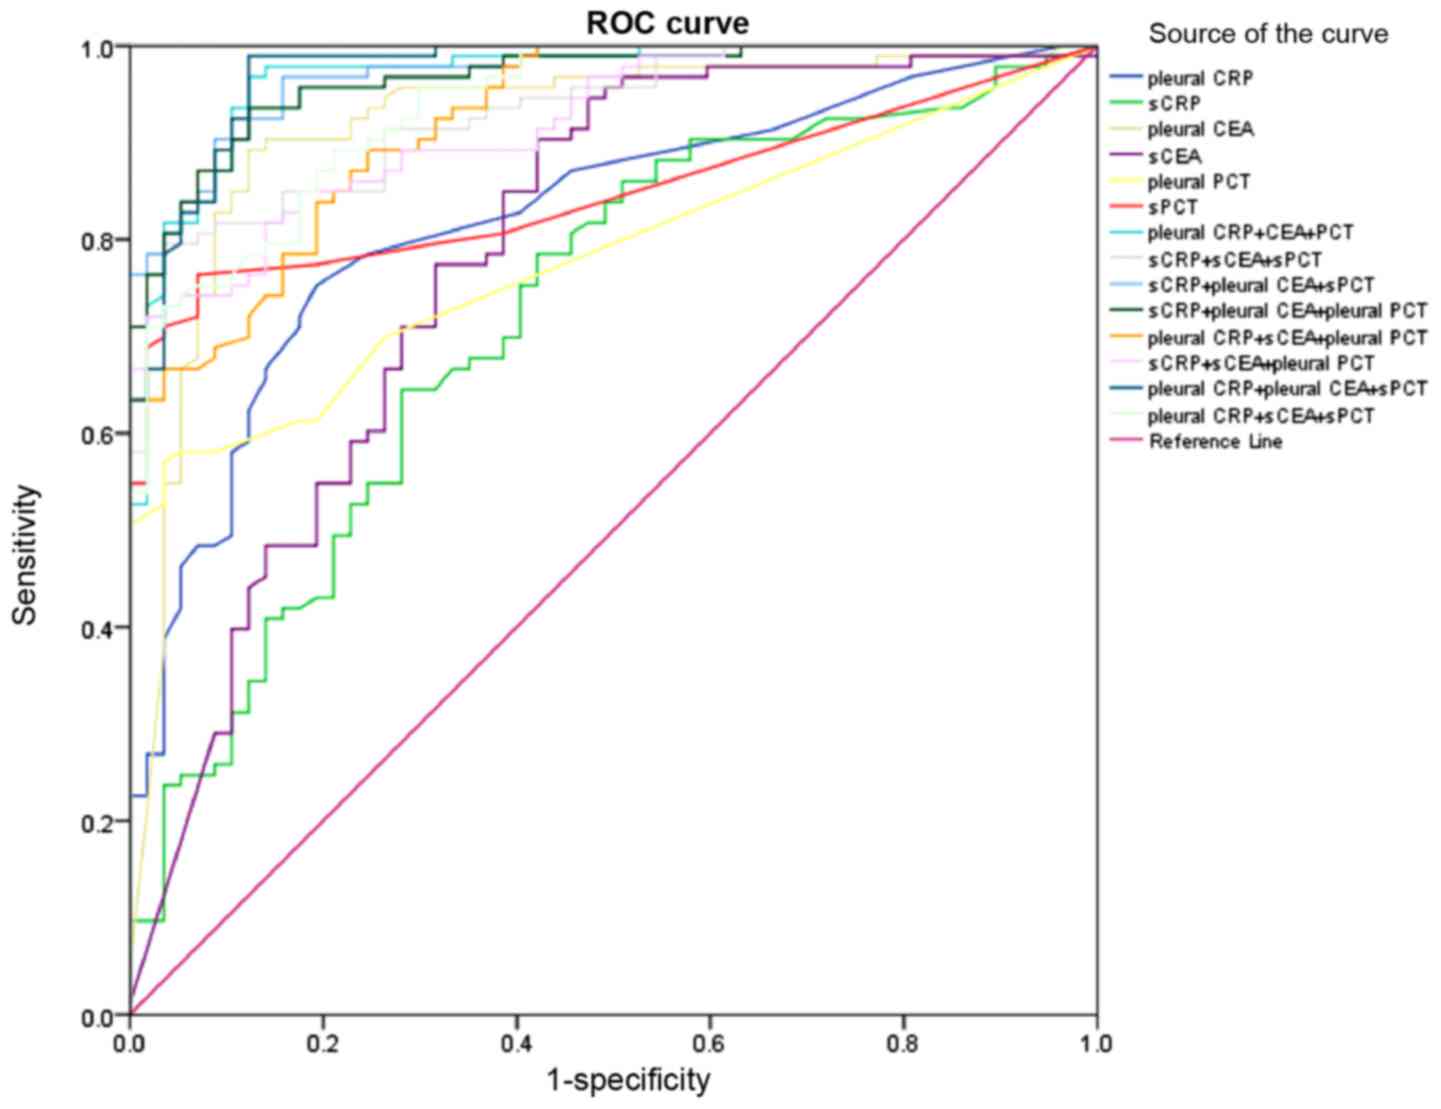
For individual biomarkers, discrimination was
identified at a cut-off point of 5.70 mg/l for pleural CEA with an
AUC of 0.872 (sensitivity: 89.2%, specificity: 87.7%), and 16.9
mg/l for sCRP with an AUC of 0.825 (sensitivity: 69.9%,
specificity: 43.9%); the cut-off values and AUC values are
displayed in Fig. 3 and Table V. As an individual predictor of
malignant PE, pleural CEA exhibited a better diagnostic performance
with a greater AUC value than did the other markers (P<0.001).
Nevertheless, sCEA exhibited poor diagnostic performance compared
to that of the others, with the lowest AUC value (P=0.001). For the
discrimination between benign and malignant PE, CEA in pleural
fluid and serum had better sensitivity than did other biomarkers
(sensitivity: 90.3, 89.2%, respectively), as well as superior
negative predictive value (NPV). By contrast, PCT in pleural fluid
and serum exhibited lower sensitivity and higher specificity
(sensitivity: 54.8, 63.1%; specificity: 96.5, 93.0%), as well as
superior positive predictive value (PPV). On ROC curve analysis,
optimal discrimination between benign and malignant PE was obtained
by pleural CRP, pleural CEA and sPCT with area under the curve
(AUC) of 0.973 (sensitivity: 98.9%, specificity: 89.5%), with the
highest accuracy (95.3%). During our analysis, pleural CRP, pleural
CEA and sPCT exhibited higher PPV and NPV. This result suggested
that as the pleural CEA level increased, the sPCT and pleural CRP
levels decreased, and the predictive value of malignant PE was
credible. Conversely, as the pleural CEA levels declined, the sPCT
and pleural CRP levels increased, and the predictive value for
benign PE was credible. In conclusion, the predictive ability of
combined biomarkers, including pleural CRP, pleural CEA and sPCT
was much higher than were other combinations.
| Table V.Use of cut-off values of individual
biomarker or in combination for discrimination between benign and
malignant PE. |
Table V.
Use of cut-off values of individual
biomarker or in combination for discrimination between benign and
malignant PE.
| Variable | Cut-off value | P-value | AUC (95% CI),
% | Sensitivity, % | Specificity, % | PPV/NPV, % | Accuracy, % |
|---|
| Pleural CRP,
mg/l | 7.50 | <0.001 | 0.786
(0.690–0.882) | 71.0 | 73.7 | 81.5/60.9 | 72.0 |
| sCRP, mg/l | 16.90 | <0.001 | 0.825
(0.733–0.917) | 69.9 | 43.9 | 67.0/47.2 | 60.0 |
| Pleural CEA,
mg/l | 5.70 | <0.001 | 0.872
(0.784–0.960) | 89.2 | 87.7 | 92.2/83.3 | 88.7 |
| sCEA, mg/l | 5.53 | 0.001 | 0.708
(0.584–0.832) | 90.3 | 57.9 | 77.8/78.6 | 78.0 |
| Pleural PCT,
ng/ml | 0.16 | <0.001 | 0.783
(0.697–0.870) | 54.8 | 96.5 | 96.2/56.7 | 70.7 |
| sPCT, ng/ml | 0.14 | <0.001 | 0.852
(0.779–0.925) | 63.1 | 93.0 | 94.4/67.9 | 80.7 |
| Pleural CRP + CEA +
PCT |
|
| 0.954
(0.915–0.994) | 96.8 | 87.7 | 92.8/94.3 | 93.3 |
| sCRP + sCEA +
sPCT |
|
| 0.926
(0.877–0.975) | 78.5 | 98.2 | 98.6/73.7 | 86.0 |
| sCRP + pleural CEA
+ sPCT |
|
| 0.971
(0.950–0.992) | 90.3 | 91.2 | 91.2/85.2 | 90.7 |
| sCRP + pleural CEA
+ pleural PCT |
|
| 0.965
(0.940–0.990) | 93.5 | 87.7 | 87.7/89.2 | 91.3 |
| Pleural CRP + sCEA
+ pleural PCT |
|
| 0.922
(0.882–0.962) | 89.2 | 75.4 | 75.4/81.1 | 84.0 |
| sCRP + sCEA +
pleural PCT |
|
| 0.920
(0.880–0.960) | 73.1 | 96.5 | 96.5/68.8 | 82.0 |
| Pleural CRP+
pleural CEA + sPCT |
|
| 0.973
(0.951–0.995) | 98.9 | 89.5 | 89.5/98.1 | 95.3 |
| Pleural CRP + sCEA
+ sPCT |
|
| 0.937
(0.902–0.972) | 73.1 | 96.5 | 96.5/68.8 | 82.0 |
Coincidence rate of combined
biomarkers in detecting malignant pleural disorders
To see the effect of the combined biomarkers on
detecting malignant pleural disorders, we verified the biomarkers
in another group of patients. As before, we divided the patients
into two groups. The benign group included 23 cases of benign PE: 6
cases of empyema, 14 cases of pneumonia and 3 cases of
tuberculosis. The malignant group included 20 cases of malignant
PE: 12 cases of lung cancer and 8 cases of cancers metastasized to
lung. In accordance with the combined biomarkers, 19 cases were
verified as benign among 23 cases of benign pleural disorders.
Meanwhile, 18 cases were verified as malignant among 20 cases of
malignant pleural disorders (Table
VI). Cytological and/or histological examinations were used to
confirm the nature of the pleural disorder. The coincidence rate
was 86.0%. According to McNemar's test, there were no differences
in the predictive value of the combined biomarkers compared to that
of the golden standard. The biomarkers were particularly helpful in
detecting malignant pleural disorders.
| Table VI.Coincidence rate of combined
biomarkers in detecting malignant pleural disorders. |
Table VI.
Coincidence rate of combined
biomarkers in detecting malignant pleural disorders.
|
| Golden
standard |
|
|---|
|
|
|
|
|---|
| Pleural CRP +
pleural CEA + sPCT | + | - | Total, n |
|---|
| + | 18 | 4 | 22 |
| – | 2 | 19 | 21 |
| Total, n | 20 | 23 | 43 |
Discussion
The conventional cytology method is deficient for
diagnosis of the types of PE, especially for distinguishing
malignant PE from benign PE (2,24–26). In recent years, research has been done
to find an effective diagnosis method. Individual tumour marker
analysis cannot provide an accurate diagnosis to determine whether
a disease in a patient with PE is malignant or not. Generally, it
is due to low sensitivity and specificity. Over the past decade,
there have been many reports regarding the clinical utility of
tumour markers in PE diagnosis (4,7,9,11,27–29),
however, the sensitivity and specificity of these markers for
discriminating between benign and malignant PE remain controversial
(28). Sometimes, the combination of
inappropriate tumour markers was useless, especially when the
primary tumour site was unknown (25).
In our study, we found that CEA levels both in
pleural fluid and in serum were elevated in malignant PE patients.
Furthermore, as a single biomarker, pleural CEA was much better at
discriminating between benign and malignant PE because of its
greater AUC area. However, it restricted its usefulness to
discrimination with low specificity. As a consequence, it is
extremely important to find some reliable and rapid markers, or
combinations of markers, that are capable of discriminating
malignant from benign PE. Therefore, some indicators other than
tumour markers are recommended by this study. Due to the main cause
of exudative pleural effusion being inflammation or tumour, we used
inflammatory markers in combination with tumour markers in order to
improve the diagnostic sensitivity and specificity in
discrimination between benign and malignant PE.
In the present study, some inflammation indicators,
including PCT and CRP, were chosen. However, PCT was different from
CRP because of its different response to antibiotic therapy. The
reliability of these indicators used alone or in combination as
diagnostic markers was investigated. As an acute-phase reaction
protein, CRP was used to screen for inflammation, including pleural
infections. However, some studies reported that CRP exhibited low
sensitivity and specificity for predicting lower respiratory tract
infections (30). In our study, CRP
was superior to PCT in terms of sensitivity but was inferior to PCT
in terms of specificity. On the other hand, CRP was superior to PCT
in terms of NPV but was inferior to PCT in terms of PPV. As an
inflammatory biomarker, PCT is more rapid than is CRP for the
detection of inflammation (31–33).
Furthermore, pleural PCT exhibited the highest specificity for
discrimination between benign and malignant PE. We found that there
was no correlation between PCT and CRP levels in pleural fluid and
serum in our study. To elevate the sensitivity, it was necessary to
combine these inflammatory biomarkers.
According to our study, both PCT and CRP levels were
significantly higher in benign PE patients than in malignant PE
patients, whether in the pleural fluid or in serum. To evaluate the
diagnostic value of the above-mentioned biomarkers, we performed
ROC analysis. The results revealed that the combined biomarkers,
including pleural CRP, pleural CEA and sPCT, were much more
valuable than were any individual biomarker, while improving the
diagnostic sensitivity, specificity and accuracy.
In conclusion, our data demonstrated that
combinations of biomarkers, including pleural CRP, pleural CEA and
sPCT had better diagnostic performance. Although we evaluated the
value of combined biomarkers, there were limitations. As mentioned
above, almost all malignant PE patients resulted from tumours, some
of whom may have had accompanying pneumonia or empyema. Lack of
differentiation in grouping might have influenced our findings.
Further studies are necessary to validate our results.
Acknowledgements
Not applicable.
Funding
This study was supported by the National Natural
Science Foundation of China (grant no. 81603358). The funding body
had no role in the design of the study and collection, analysis,
and interpretation of data and in writing the paper.
Availability of data and materials
All data generated or analyzed during this study are
included in this published article.
Authors' contributions
WG and WQ designed the study. MJ, XZ and JD
conducted the experiments and data analysis. MJ interpreted the
data and drafted the manuscript. SQ and FM were involved in sample
preparation, patient data collection and interpretation. JD
performed statistical analysis. All the authors have accepted
responsibility for the entire content of this submitted manuscript
and approved submission.
Ethics approval and consent to
participate
This study was carried out in accordance with the
recommendations of the Ethical Committee of Affiliated Hospital of
Nanjing University of Traditional Chinese Medicine with written
informed consent from all subjects. All subjects gave written
informed consent in accordance with the Declaration of Helsinki.
The protocol was approved by the Medical Ethics Committee of
Affiliated Hospital of Nanjing University of Traditional Chinese
Medicine.
Consent for publication
All subjects gave written informed consent for the
publication of any associated data and accompanying images.
Competing interests
The authors declare no competing interests.
References
|
1
|
Braunschweig T, Chung JY, Choi CH, Cho H,
Chen QR, Xie R, Perry C, Khan J and Hewitt SM: Assessment of a
panel of tumor markers for the differential diagnosis of benign and
malignant effusions by well-based reverse phase protein array.
Diagn Pathol. 10:532015. View Article : Google Scholar : PubMed/NCBI
|
|
2
|
Maskell NA and Butland RJ; Pleural
Diseases Group, Standards of Care Committee, British Thoracic
Society: BTS guidelines for the investigation of a unilateral
pleural effusion in adults. Thorax. 58(Suppl 2): ii8–ii17. 2003.
View Article : Google Scholar : PubMed/NCBI
|
|
3
|
Yoon DW, Cho JH, Choi YS, Kim J, Kim HK,
Zo JI and Shim YM: Predictors of survival in patients who underwent
video-assisted thoracic surgery talc pleurodesis for malignant
pleural effusion. Thorac Cancer. 7:393–398. 2016. View Article : Google Scholar : PubMed/NCBI
|
|
4
|
Porcel JM, Vives M, Esquerda A, Salud A,
Pérez B and Rodríguez-Panadero F: Use of a panel of tumor markers
(carcinoembryonic antigen, cancer antigen 125, carbohydrate antigen
15-3, and cytokeratin 19 fragments) in pleural fluid for the
differential diagnosis of benign and malignant effusions. Chest.
126:1757–1763. 2004. View Article : Google Scholar : PubMed/NCBI
|
|
5
|
Catarino PA and Goldstraw P: The future in
diagnosis and staging of lung cancer: Surgical techniques.
Respiration. 73:717–732. 2006. View Article : Google Scholar : PubMed/NCBI
|
|
6
|
Gu P, Huang G, Chen Y, Zhu C, Yuan J and
Sheng S: Diagnostic utility of pleural fluid carcinoembryonic
antigen and CYFRA 21-1 in patients with pleural effusion: A
systematic review and meta-analysis. J Clin Lab Anal. 21:398–405.
2007. View Article : Google Scholar : PubMed/NCBI
|
|
7
|
Liang QL, Shi HZ, Qin XJ, Liang XD, Jiang
J and Yang HB: Diagnostic accuracy of tumour markers for malignant
pleural effusion: A meta-analysis. Thorax. 63:35–41. 2008.
View Article : Google Scholar : PubMed/NCBI
|
|
8
|
Ryu JS, Lee HJ, Cho JH, Han HS and Lee HL:
The implication of elevated carcinoembryonic antigen level in
pleural fluid of patients with non-malignant pleural effusion.
Respirology. 8:487–491. 2003. View Article : Google Scholar : PubMed/NCBI
|
|
9
|
Alataş F, Alataş O, Metintaş M, Colak O,
Harmanci E and Demir S: Diagnostic value of CEA, CA 15-3, CA 19-9,
CYFRA 21-1, NSE and TSA assay in pleural effusions. Lung Cancer.
31:9–16. 2001. View Article : Google Scholar : PubMed/NCBI
|
|
10
|
Villena V, López-Encuentra A,
Echave-Sustaeta J, Martín-Escribano P, Ortuño-de-Solo B and
Estenoz-Alfaro J: Diagnostic value of CA 549 in pleural fluid.
Comparison with CEA, CA 15.3 and CA 72.4. Lung Cancer. 40:289–294.
2003.
|
|
11
|
Shitrit D, Zingerman B, Shitrit AB, Shlomi
D and Kramer MR: Diagnostic value of CYFRA 21-1, CEA, CA 19-9, CA
15-3, and CA 125 assays in pleural effusions: Analysis of 116 cases
and review of the literature. Oncologist. 10:501–507. 2005.
View Article : Google Scholar : PubMed/NCBI
|
|
12
|
Lee JH and Chang JH: Diagnostic utility of
serum and pleural fluid carcinoembryonic antigen, neuron-specific
enolase, and cytokeratin 19 fragments in patients with effusions
from primary lung cancer. Chest. 128:2298–2303. 2005. View Article : Google Scholar : PubMed/NCBI
|
|
13
|
Mehanic S and Baljic R: The importance of
serum procalcitonin in diagnosis and treatment of serious bacterial
infections and sepsis. Mater Sociomed. 25:277–281. 2013. View Article : Google Scholar : PubMed/NCBI
|
|
14
|
Uzzan B, Cohen R, Nicolas P, Cucherat M
and Perret GY: Procalcitonin as a diagnostic test for sepsis in
critically ill adults and after surgery or trauma: A systematic
review and meta-analysis. Crit Care Med. 34:1996–2003. 2006.
View Article : Google Scholar : PubMed/NCBI
|
|
15
|
Nijsten MW, Olinga P, The TH, de Vries EG,
Koops HS, Groothuis GM, Limburg PC, ten Duis HJ, Moshage H,
Hoekstra HJ, et al: Procalcitonin behaves as a fast responding
acute phase protein in vivo and in vitro. Crit Care Med.
28:458–461. 2000. View Article : Google Scholar : PubMed/NCBI
|
|
16
|
Wacker C, Prkno A, Brunkhorst FM and
Schlattmann P: Procalcitonin as a diagnostic marker for sepsis: A
systematic review and meta-analysis. Lancet Infect Dis. 13:426–435.
2013. View Article : Google Scholar : PubMed/NCBI
|
|
17
|
Brunkhorst R, Eberhardt OK, Haubitz M and
Brunkhorst FM: Procalcitonin for discrimination between activity of
systemic autoimmune disease and systemic bacterial infection.
Intensive Care Med. 26(Suppl 2): S199–S201. 2000. View Article : Google Scholar : PubMed/NCBI
|
|
18
|
Joo K, Park W, Lim MJ, Kwon SR and Yoon J:
Serum procalcitonin for differentiating bacterial infection from
disease flares in patients with autoimmune diseases. J Korean Med
Sci. 26:1147–1151. 2011. View Article : Google Scholar : PubMed/NCBI
|
|
19
|
Buhaescu I, Yood RA and Izzedine H: Serum
procalcitonin in systemic autoimmune diseases-where are we now?
Semin Arthritis Rheum. 40:176–183. 2010. View Article : Google Scholar : PubMed/NCBI
|
|
20
|
Kim SE: Serum procalcitonin is a candidate
biomarker to differentiate bacteremia from disease flares in
patients with inflammatory bowel disease. Gut Liver. 10:491–492.
2016. View
Article : Google Scholar : PubMed/NCBI
|
|
21
|
Wang CY, Hsiao YC, Jerng JS, Ho CC, Lai
CC, Yu CJ, Hsueh PR and Yang PC: Diagnostic value of procalcitonin
in pleural effusions. Eur J Clin Microbiol Infect Dis. 30:313–318.
2011. View Article : Google Scholar : PubMed/NCBI
|
|
22
|
Yang Y, Xie J, Guo F, Longhini F, Gao Z,
Huang Y and Qiu H: Combination of C-reactive protein, procalcitonin
and sepsis-related organ failure score for the diagnosis of sepsis
in critical patients. Ann Intensive Care. 6:512016. View Article : Google Scholar : PubMed/NCBI
|
|
23
|
Izhakian S, Wasser WG, Fox BD,
Vainshelboim B and Kramer MR: The diagnostic value of the pleural
fluid C-reactive protein in parapneumonic effusions. Dis Markers.
2016:75397802016. View Article : Google Scholar : PubMed/NCBI
|
|
24
|
Xu C, Yu L, Zhan P and Zhang Y: Elevated
pleural effusion IL-17 is a diagnostic marker and outcome predictor
in lung cancer patients. Eur J Med Res. 19:232014. View Article : Google Scholar : PubMed/NCBI
|
|
25
|
Antonangelo L, Sales RK, Corá AP, Acencio
MM, Teixeira LR and Vargas FS: Pleural fluid tumour markers in
malignant pleural effusion with inconclusive cytologic results.
Curr Oncol. 22:e336–e341. 2015. View Article : Google Scholar : PubMed/NCBI
|
|
26
|
Li H, Huang L, Tang H, Zhong N and He J:
Pleural fluid carcinoembryonic antigen as a biomarker for the
discrimination of tumor-related pleural effusion. Clin Respir J.
11:881–886. 2017. View Article : Google Scholar : PubMed/NCBI
|
|
27
|
Gaspar MJ, de Miguel J, García Díaz JD and
Díez M: Clinical utility of a combination of tumour markers in the
diagnosis of malignant pleural effusions. Anticancer Res.
28:2947–2952. 2008.PubMed/NCBI
|
|
28
|
Molina R, Bosch X, Auge JM, Filella X,
Escudero JM, Molina V, Solé M and López-Soto A: Utility of serum
tumor markers as an aid in the differential diagnosis of patients
with clinical suspicion of cancer and in patients with cancer of
unknown primary site. Tumour Biol. 33:463–474. 2012. View Article : Google Scholar : PubMed/NCBI
|
|
29
|
Miédougé M, Rouzaud P, Salama G, Pujazon
MC, Vincent C, Mauduyt MA, Reyre J, Carles P and Serre G:
Evaluation of seven tumour markers in pleural fluid for the
diagnosis of malignant effusions. Br J Cancer. 81:1059–1065. 1999.
View Article : Google Scholar : PubMed/NCBI
|
|
30
|
Blasi F, Stolz D and Piffer F: Biomarkers
in lower respiratory tract infections. Pulm Pharmacol Ther.
23:501–507. 2010. View Article : Google Scholar : PubMed/NCBI
|
|
31
|
Castelli GP, Pognani C, Meisner M, Stuani
A, Bellomi D and Sgarbi L: Procalcitonin and C-reactive protein
during systemic inflammatory response syndrome, sepsis and organ
dysfunction. Crit Care. 8:R234–R242. 2004. View Article : Google Scholar : PubMed/NCBI
|
|
32
|
Meidani M, Khorvash F, Abolghasemi H and
Jamali B: Procalcitonin and quantitative C-reactive protein role in
the early diagnosis of sepsis in patients with febrile neutropenia.
South Asian J Cancer. 2:216–219. 2013. View Article : Google Scholar : PubMed/NCBI
|
|
33
|
Magrini L, Travaglino F, Marino R, Ferri
E, de Berardinis B, Cardelli P, Salerno G and Di Somma S:
Procalcitonin variations after Emergency Department admission are
highly predictive of hospital mortality in patients with acute
infectious diseases. Eur Rev Med Pharmacol Sci. 17(Suppl 1):
S133–S142. 2013.
|