Introduction
Renal cell carcinoma (RCC) accounts for 2–3% of all
human malignancies (1). It is
estimated that more than 338,000 people are diagnosed with RCC each
year, with a 22% increase projected by 2020; there are more than
140,000 RCC-related deaths per year (2). Clear cell renal cell carcinoma (ccRCC)
is the most common (~75%), lethal subtype of RCC (3). Over the past decade, with improved
surgical procedures and the application of specific targeted drugs,
the survival of RCC patient has markedly improved (4). However, early accurate diagnosis of
ccRCC is still a great challenge and chemotherapeutic or
radiotherapeutic resistance remains (4).
A comprehensive understanding of ccRCC initiation,
progression and metastasis contributes to early diagnosis and
precise treatment. Previous studies have demonstrated that
mutations of VHL are significant drivers of ccRCC by
regulating various biological processes, and VHL alterations
are considered as prognostic markers in ccRCC (5). Moreover, targeted therapies associated
with the pVHL/HIF pathway have been tested in phase 3 trials
(4). VHL alterations alone are
insufficient to cause the cancer, as ccRCC is a systemic biological
disease. Sequencing studies have identified some other specific
molecular genetic alterations of ccRCC, such as mutations of
TCEB1 (6), PBRM1
(7) and abnormal expression of miR-92
(8), miR-210 (9). Further insights into the molecular
biology of ccRCC could help us find some novel molecular biomarkers
and potential targets for early diagnosis and precise
treatment.
Gene expression profiling arrays make it possible to
identify numerous differentially expressed genes in tumor samples
compared to non-tumor samples at the same time. In this study, we
performed an integrated bioinformatics analysis of three gene
expression profiles and identified several differentially expressed
genes (DEGs) in ccRCC tissues compared with normal controls. We
executed functional and pathway enrichment analysis,
protein-protein interaction (PPI) network analysis of DEGs and
employed the Kaplan-Meier method to analyze survival associated
with hub genes. We intended to provide further insights into the
complex molecular biology of ccRCC pathogenesis and to identify new
key genes that may be candidates for diagnostic biomarkers,
prognostic indicators or potential targets of precise therapy.
Materials and methods
Data collection
Three gene expression profiles (GSE36895, GSE46699
and GSE71963) were acquired from Gene Expression Omnibus (GEO)
database, a free public genomics data repository for array- and
sequence-based data.
The array data of GSE36895 included 29 ccRCC tumor
samples and 23 matched adjacent normal kidney cortices (10). GSE46699 was comprised of 126 samples
including 65 ccRCC tumors and 61 patient-matched adjacent-normal
tissues (11). GSE71963 contained 32
ccRCC tumor samples and 16 normal kidney samples (12).
Data processing
GEO2R, a tool for online analysis of GEO series
based on the R programming language (13), was used to screen DEGs between the
normal kidneys and ccRCC samples. Adjusted P-value (adj. P)
and |log Fold Change| (|log FC|) were used to select significant
DEGs. adj. P<0.05 and |log FC| >2 were chosen as the cutoff
criteria.
Functional and pathway enrichment
analysis
Gene ontology (GO) and Kyoto Encyclopedia of Genes
and Genomes (KEGG) pathway enrichment analysis of DEGs was carried
out using The Database for Annotation, Visualization and Integrated
Discovery (DAVID) online (14,15).
P<0.05 was selected as the cutoff value.
PPI network construction and
significant module analysis
STRING v10.5 was utilized for functional interaction
analysis to construct a PPI network (16). Confidence scores >0.7 were
considered significant. Genes with degrees >10 were selected as
hub genes. The PPI network was visualized by Cytoscape software,
and module of PPI network was screened by the Molecular Complex
Detection (MCODE) in Cytoscape. The parameters were set as follows:
Degree cutoff: 2, node score cutoff: 0.2, k-core: 2, and max.
depth: 100 (17). The functional and
pathway enrichment analysis of the significant module was carried
out by DAVID.
Regulation network analyses
The miRNAs and transcription factors (TFs) that
potentially regulated the DEGs were predicted using
Overrepresentation Enrichment Analysis (ORA) in WebGestal software
(18). Then miRNA-target network and
TF-target network were also visualized using Cytoscape
software.
TCGA verification and survival
analysis of hub genes
UALCAN, a tool for in-depth analyses of The Cancer
Genome Atlas (TCGA) data, was utilized to verify the differences in
expression levels of hub genes (19).
The correlation of hub genes with overall survival (OS) of ccRCC
patients was examined by recruiting UALCAN as well. Patient data
were categorized into two groups based on transcripts per million
(TPM) value. The data with TPM greater than upper quartile were
assigned to a high expression group and the others with TPM below
upper quartile belonged to low/medium expression group. Survival
analysis was performed by Kaplan-Meier method, and the log-rank
test was carried out. P<0.05 was selected as the cutoff
value.
Results
Identification of DEGs in ccRCC
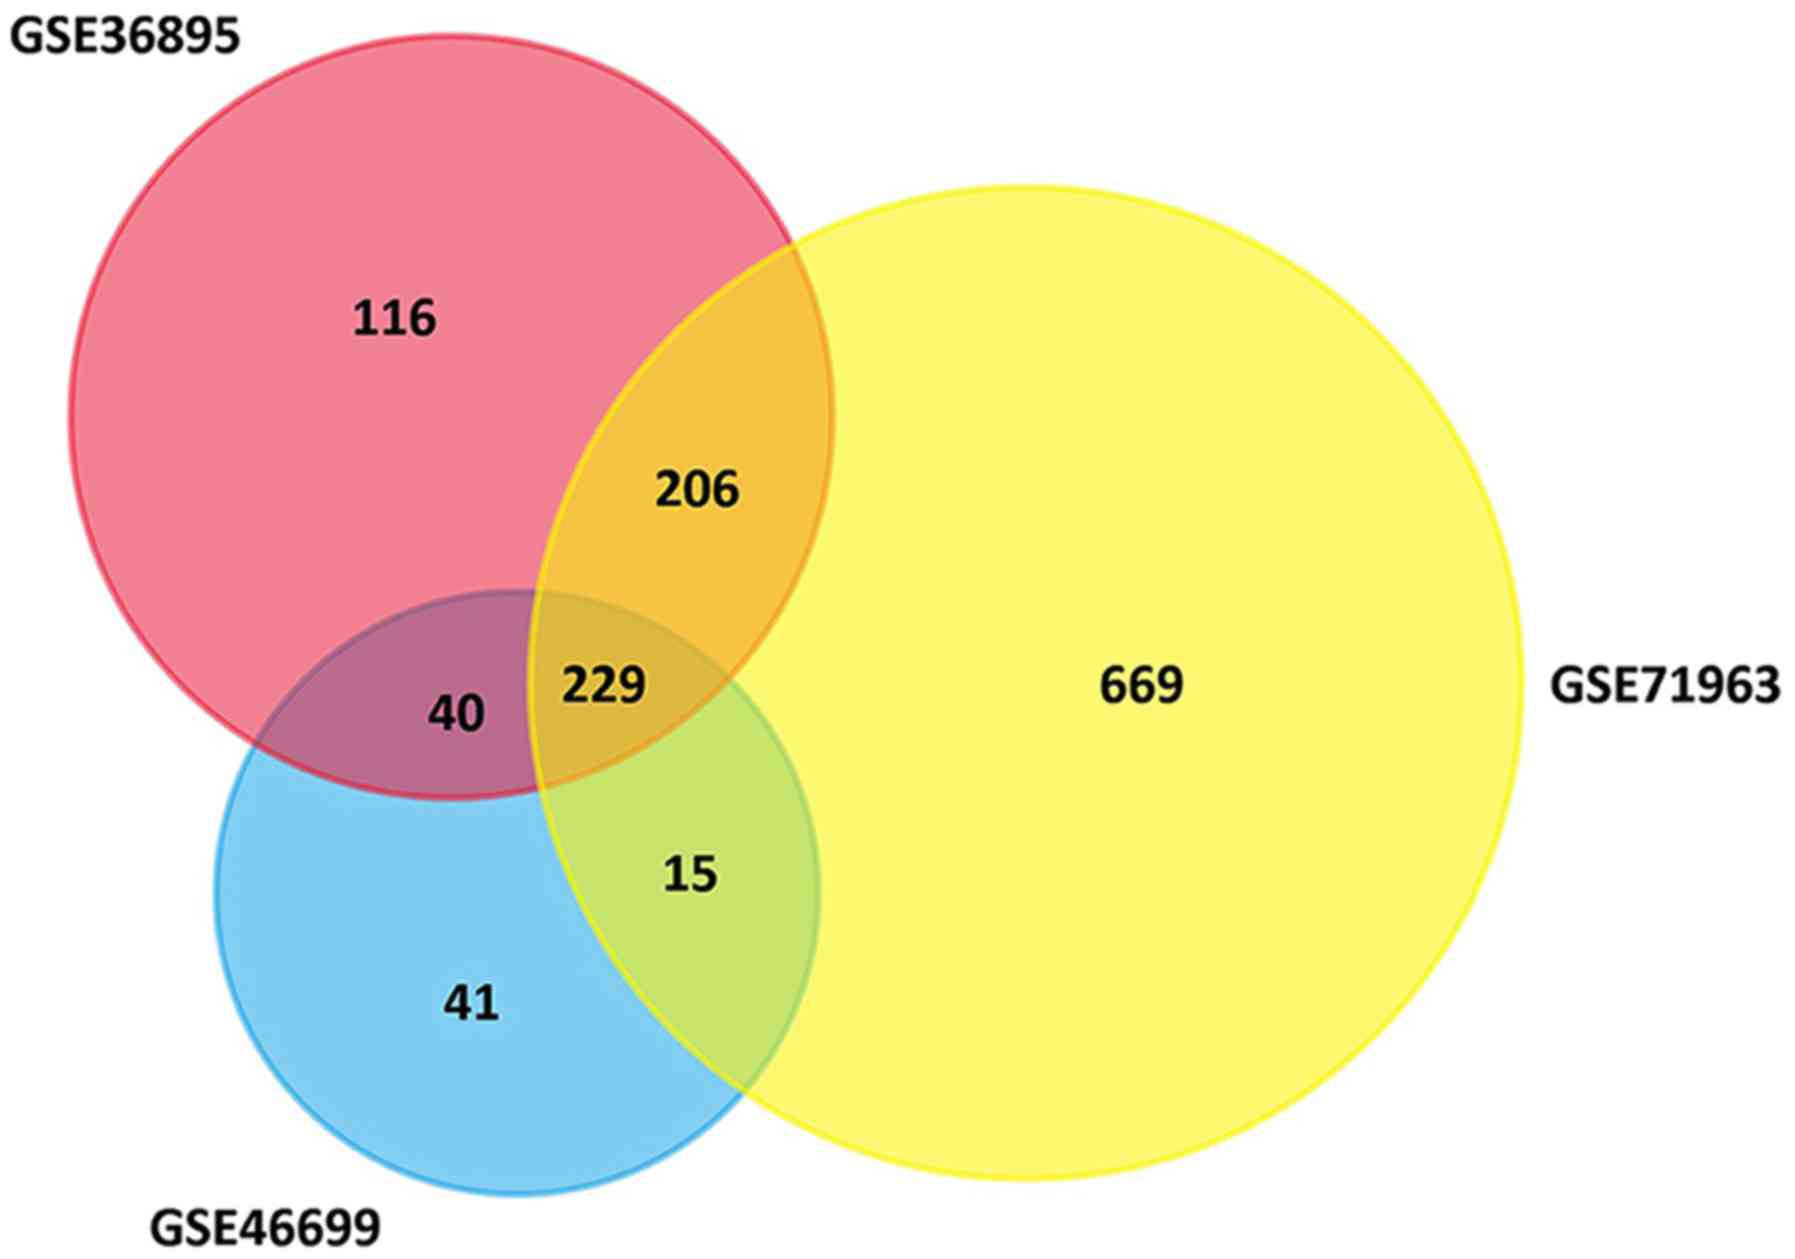
A total of 591, 325 and 1118 genes were extracted
from the GSE36895, GSE46699 and GSE71963 datasets, respectively.
There were 229 genes consistently differentially expressed in all
three datasets (Fig. 1), including 65
upregulated DEGs and 164 downregulated DEGs in ccRCC tissues
compared with normal kidney tissues (Table I).
 | Table I.DEGs in ccRCC tissues compared with
normal controls. |
Table I.
DEGs in ccRCC tissues compared with
normal controls.
| DEGs | Gene name |
|---|
| Upregulated | TNFAIP6, PFKP,
NDUFA4L2, CXCR4, NPTX2, C1QC, FLT1, LOX, PDK1,
COL23A1, CDCA2, GAS2L3, KCNK3, NETO2, FABP7, RNASET2, ANGPTL4,
GJC1, SCD, HILPDA, LOXL2, DGCR5, CA9, EGLN3, ENO2, TMEM45A,
PPP1R3C, CAV2, VWF, CCND1, ST8SIA4, C3, DIRAS2,
IGFBP3, FABP5, LAMA4, SAP30, CD36, CTHRC1, GAL3ST1, HK2,
VEGFA, SCARB1, AHNAK2, CAV1, TGFBI, INHBB, ZNF395,
PLOD2, TMCC1, PLXDC1, BHLHE41, CYP2J2, SPAG4, LPCAT1, CP, C1QB,
FAM26F, APOC1, ENPP3, SLC6A3, ACKR3, ANGPT2, NOL3, ESM1 |
| Downregulated | PTGER3, ERBB4,
RALYL, L1CAM, XPNPEP2, SLC4A1, MPPED2, EHF, HMGCS2, HPD, GGACT,
SLC7A13, HRG, UGT3A1, GATA3, TMEM174, SLC13A1, PROM2, CALB1, SUSD2,
KCNJ1, SLC12A3, CRYAA, HSD11B2, DEFB1, GPC5, CYP27B1, UCHL1, FABP1,
TMEM30B, CYP4F2, NELL1, MTURN, FGF9, NPHS2, PSAT1, SLC4A9, TFCP2L1,
ALDH4A1, SLC12A1, ERP27, ALDH8A1, SCIN, TSPAN8, KL,
AZGP1, SLC22A6, EFHD1, LOC100505985, CRHBP, AQP2, ASS1,
TACSTD2, PVALB, FOXI1, ABAT, TMEM52B, IRX2, MIOX, PIGR, ATP6V1G3,
SEMA6D, S100A2, SCD5, MAL, FGF1, SORD, DMRT2, TFAP2B,
GLDC, FBP1, RASD1, PLPPR1, CYP4F3, GSTM3, ESRRG, SLC47A2,
KNG1, SLC34A1, MUC15, PTPRO, DPEP1, MECOM, ACSF2, CYP17A1,
MT1G, PLG, UPP2, MFSD4A, SLC22A8, HAO2, ALDH6A1, MT1F,
TMEM213, CHL1, EGF, DCXR, UMOD, ATP6V0D2, ANK2, HOGA1, DIO1,
ELF5, SCNN1A, HSPA2, SOSTDC1, TYRP1, ENPP6, PCP4, GPC3, HS6ST2,
CLDN8, PCK1, SLC5A2, NOX4, BMPR1B, G6PC, WNK4, ADH6, HEPA, CAM2,
SOST, SH3GL2, SCNN1B, ALB, ALDOB, DCN, SCNN1G,
KCNJ10, SLC13A3, SUCNR1, AFM, RAB25, ACPP, HPGD, FXYD4, DNER, RHCG,
CYP4A11, CTXN3, KCNJ15, GRB14, PTH1R, GGT6, SLC26A7, C7, TMEM178A,
OGDHL, ATP6V1B1, DUSP9, SERPINA5, SFRP1, CLCNKB, SLC7A8, SLC7A8,
PIPOX, MAL2, PDE1A, TMPRSS2, GPAT3, PRODH2, FAM151A, EPCAM, MRO,
ATP6V0A4 |
GO analysis of DEGs in ccRCC
After performing GO analysis of DEGs with DAVID
online, the DEGs were classified into three groups: biological
process group, molecular function group and cellular component
group. We found that the upregulated genes were mainly enriched in
biological processes related to hypoxia, blood vessel morphogenesis
and angiogenesis. The downregulated genes were commonly involved in
functional terms associated with cellular components, metabolism
and homeostasis.
Pathway enrichment analysis of DEGs in
ccRCC
KEGG pathway enrichment analysis of DEGs was also
conducted with DAVID online. KEGG results of the up- and
downregulated genes were displayed in Tables II and III, respectively. The upregulated genes
were mostly enriched in HIF-1 signaling pathway, PPAR signaling
pathway, focal adhesion, coagulation cascades and AMPK signaling
pathway. The downregulated genes were mainly enriched in metabolic
pathways, collecting duct acid secretion, aldosterone-regulated
sodium reabsorption, carbon metabolism and biosynthesis of
antibiotics.
| Table II.KEGG pathway enrichment analysis of
65 upregulated DEGs. |
Table II.
KEGG pathway enrichment analysis of
65 upregulated DEGs.
| Pathway | Name | P-value | Genes |
|---|
| hsa04066 | HIF-1 signaling
pathway |
1.14×10⁻⁵ | PDK1, FLT1, VEGFA,
EGLN3, ENO2, HK2, ANGPT2 |
| hsa03320 | PPAR signaling
pathway |
4.19×10⁻⁴ | CD36, SCD, FABP7,
FABP5, ANGPTL4 |
| hsa04510 | Focal adhesion |
7.01×10⁻⁴ | CAV2, VWF, LAMA4,
CAV1, CCND1, FLT1, VEGFA |
| hsa04610 | Complement and
coagulation cascades |
5.81×10⁻³ | C1QB, VWF, C3,
C1QC |
| hsa04152 | AMPK signaling
pathway |
2.70×10⁻² | CCND1, CD36, SCD,
PFKP |
| hsa05150 | Staphylococcus
aureus infection |
3.35×10⁻² | C1QB, C3, C1QC |
| hsa04151 | PI3K-Akt signaling
pathway |
3.53×10⁻² | VWF, LAMA4, CCND1,
FLT1, VEGFA, ANGPT2 |
| hsa05230 | Central carbon
metabolism in cancer |
4.57×10⁻² | PDK1, PFKP,
HK2 |
| hsa00010 |
Glycolysis/Gluconeogenesis |
4.96×10⁻² | ENO2, PFKP,
HK2 |
| Table III.KEGG pathway enrichment analysis of
164 downregulated DEGs. |
Table III.
KEGG pathway enrichment analysis of
164 downregulated DEGs.
| Pathway | Name | P-value | Genes |
|---|
| hsa01100 | Metabolic
pathways |
2.40×10⁻⁵ | TYRP1, SORD, ASS1,
OGDHL, ALDOB, UPP2, ADH6, ATP6V1B1, GPAT3, PIPOX, GLDC, CYP27B1,
ALDH4A1, ATP6V0D2, HPD, ALDH6A1, KL, HOGA1, FBP1, PCK1, CYP4A11,
CYP17A1, GGT6, G6PC, HMGCS2, HAO2, ABAT, PRODH2, CYP4F3, CYP4F2,
ATP6V1G3, PSAT1, ATP6V0A4, DCXR |
| hsa04966 | Collecting duct
acid secretion |
2.40×10⁻⁵ | CLCNKB, SLC4A1,
ATP6V1G3, ATP6V1B1, ATP6V0A4, ATP6V0D2 |
| hsa04960 |
Aldosterone-regulated sodium
reabsorption |
1.51×10⁻⁴ | FXYD4, HSD11B2,
SCNN1G, SCNN1B, SCNN1A, KCNJ1 |
| hsa01200 | Carbon
metabolism |
3.81×10⁻³ | ALDH6A1, OGDHL,
ALDOB, HAO2, FBP1, PSAT1, GLDC |
| hsa01130 | Biosynthesis of
antibiotics |
7.03×10⁻³ | HMGCS2, ASS1,
OGDHL, ALDOB, HAO2, FBP1, PSAT1, PCK1, GLDC |
| hsa00010 |
Glycolysis/gluconeogenesis |
1.19×10⁻² | G6PC, ALDOB, FBP1,
ADH6, PCK1 |
| hsa04742 | Taste
transduction |
2.17×10⁻² | PDE1A, SCNN1G,
SCNN1B, SCNN1A |
| hsa05110 | Vibrio cholerae
infection |
3.32×10⁻² | ATP6V1G3, ATP6V1B1,
ATP6V0A4, ATP6V0D2 |
| hsa00630 | Glyoxylate and
dicarboxylate metabolism |
4.96×10⁻² | HAO2, HOGA1,
GLDC |
PPI network construction and
significant module analysis
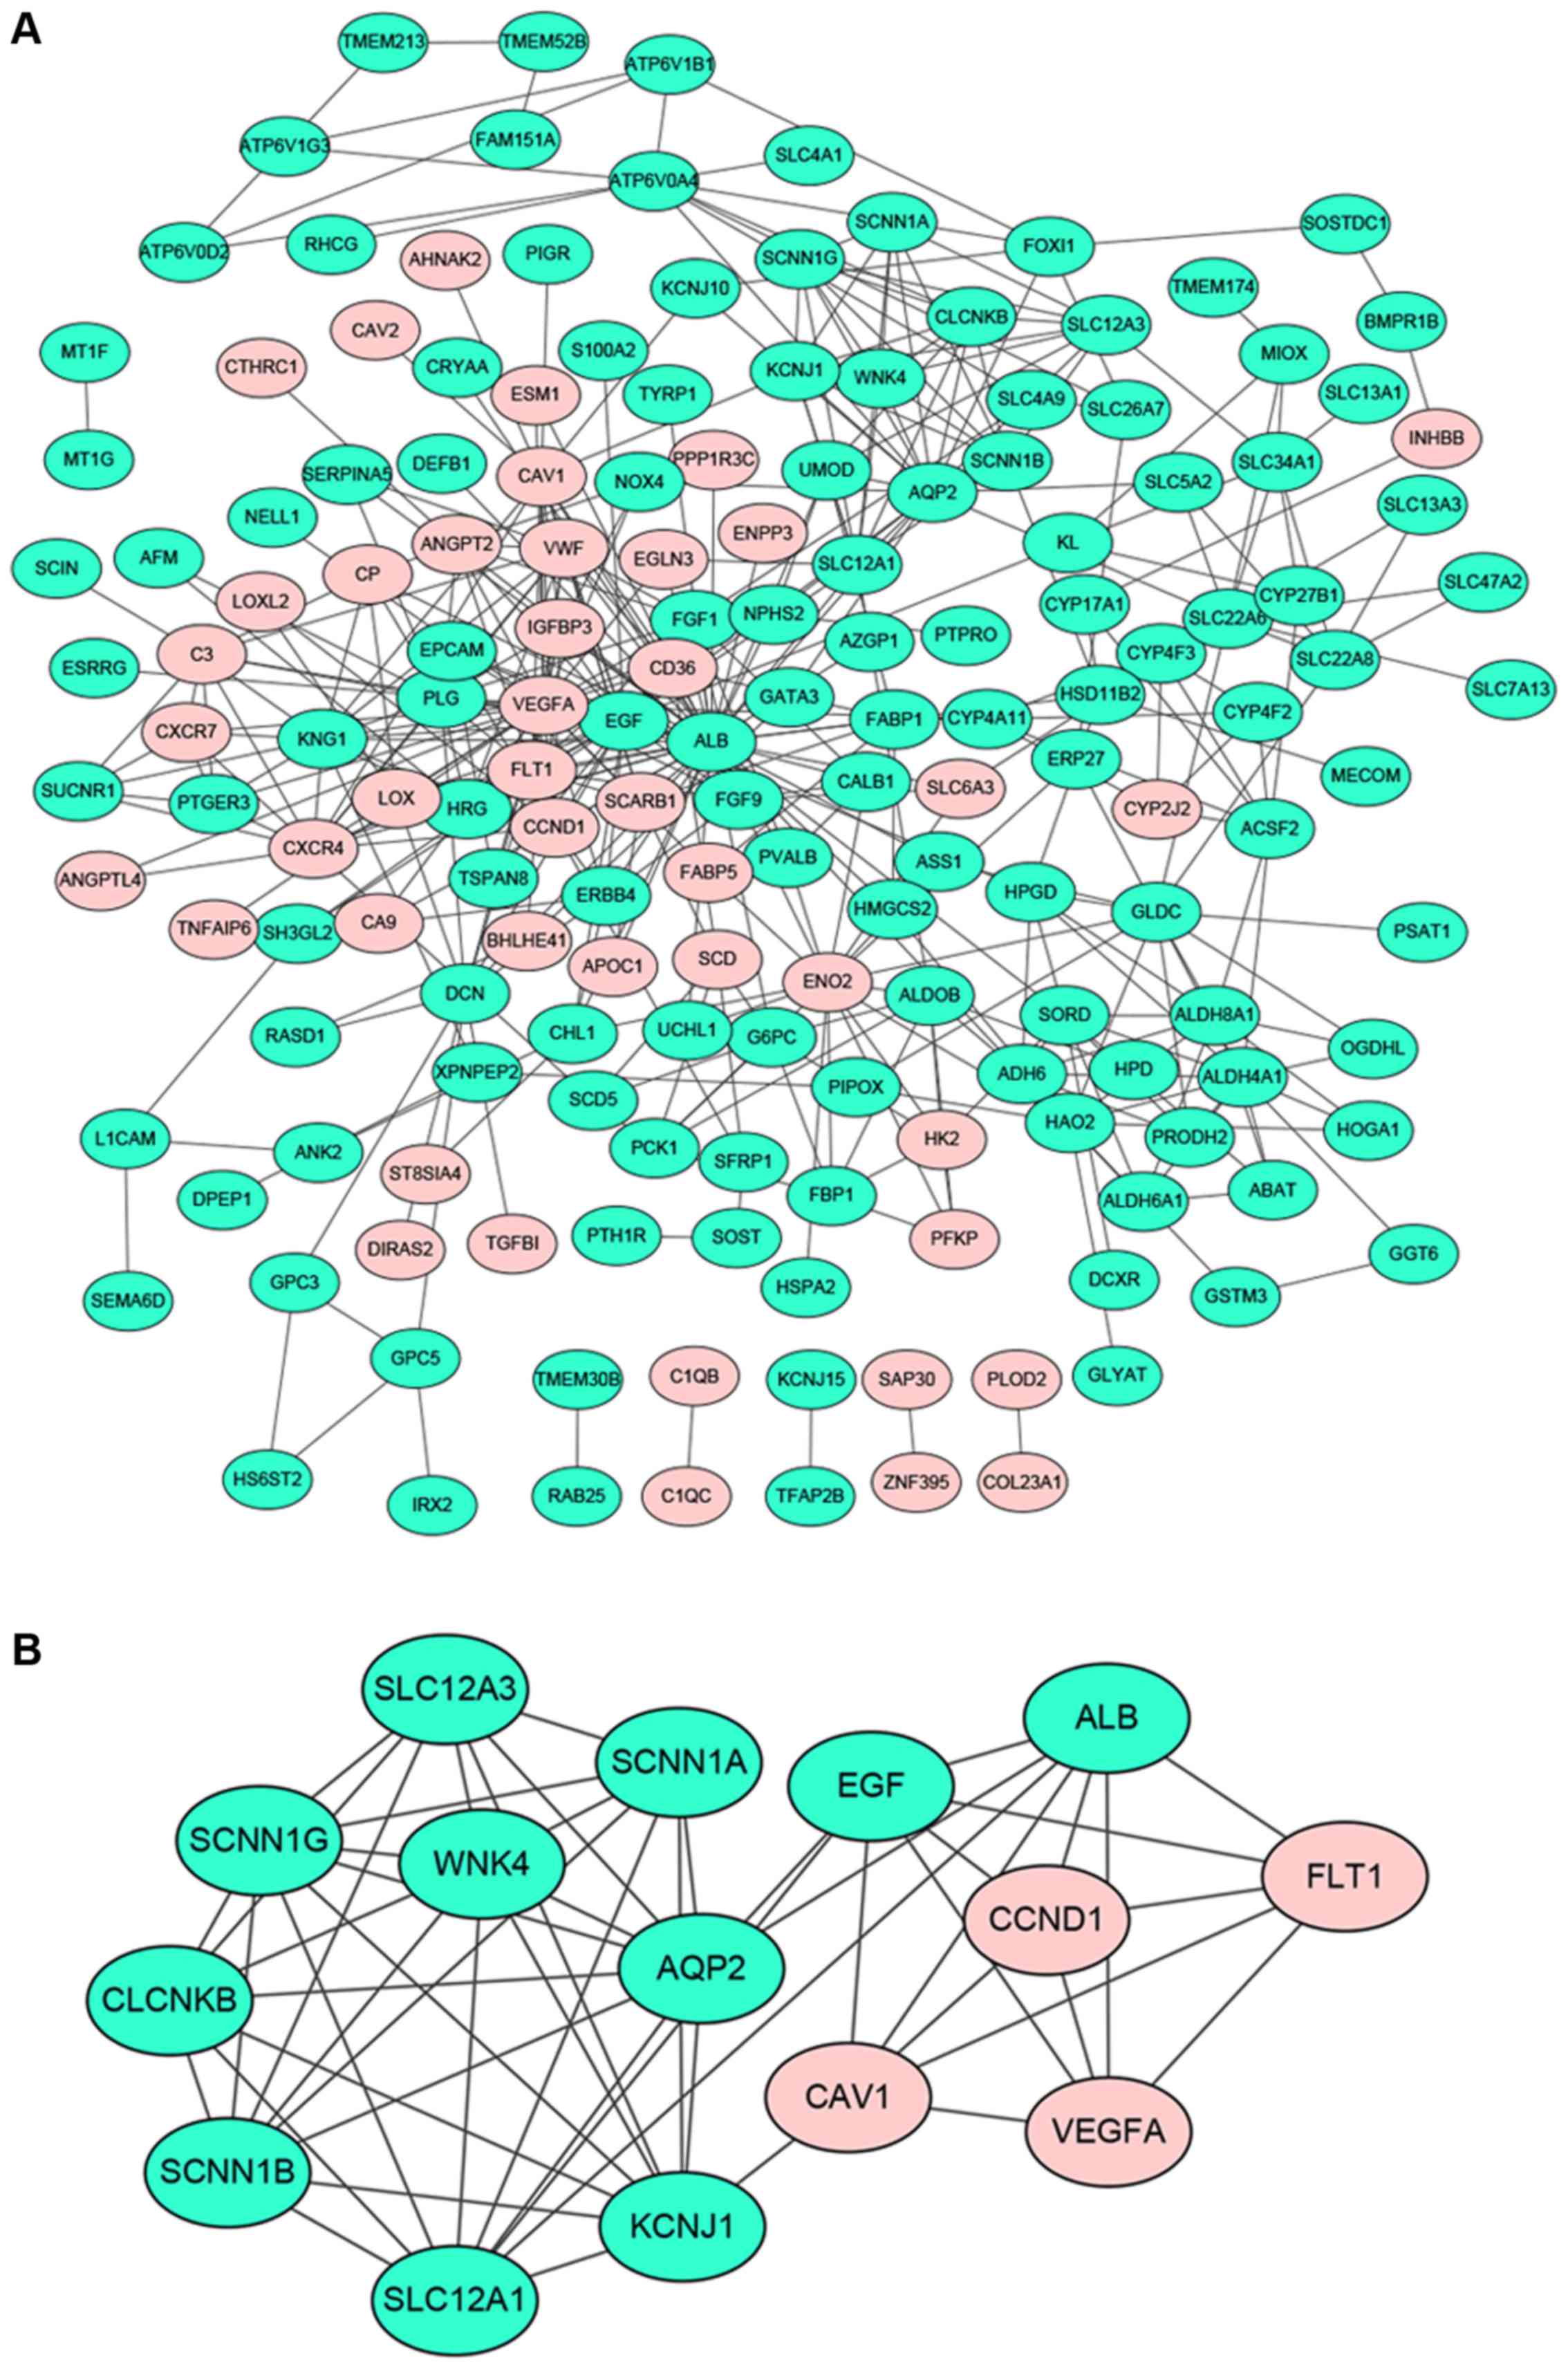
A total of 169 genes of the 229 DEGs in all three
datasets were filtered into the PPI network complex, containing 169
nodes and 432 edges (Fig. 2A). There
were 44 upregulated genes and 125 downregulated genes among the 169
DEGs. Seventeen nodes with a degree >10 were identified as hub
genes, such as ALB, VEGFA, EGF, AQP2, ENO2, PLG, FLT1,etc.
(bold in Table I). The characteristic
properties of the hub nodes based on analysis of the PPI network
were tabulated in Table IV. These
properties included degree, betweenness, closeness, stress and
average shortest path length. After performing module analysis by
MCODE, the most significant module was screened out from the PPI
network of DEGs, composed of 15 nodes and 54 edges (Fig. 2B). Functional and pathway enrichment
analysis of nodes in the module was displayed in Table V. Most of these nodes were enriched in
the functional terms related to substance transport and the
pathways associated with cancer.
| Table IV.Topology properties of 17 hub
genes. |
Table IV.
Topology properties of 17 hub
genes.
| Genes name | Degree | Betweenness
centrality | Closeness
centrality | Clustering
coefficient | Stress | Average shortest
path length |
|---|
| ALB | 50 | 0.42 | 0.50 | 0.10 | 30,746 | 2.00 |
| VEGFA | 35 | 0.14 | 0.42 | 0.15 | 11,030 | 2.40 |
| EGF | 26 | 0.14 | 0.45 | 0.25 | 11,990 | 2.23 |
| AQP2 | 19 | 0.20 | 0.41 | 0.23 | 15,956 | 2.44 |
| ENO2 | 17 | 0.08 | 0.39 | 0.13 | 6,610 | 2.60 |
| PLG | 16 | 0.01 | 0.38 | 0.45 | 1,644 | 2.62 |
| CAV1 | 15 | 0.05 | 0.39 | 0.29 | 4,140 | 2.57 |
| KNG1 | 15 | 0.04 | 0.38 | 0.45 | 3,414 | 2.62 |
| CXCR4 | 15 | 0.02 | 0.38 | 0.45 | 3,020 | 2.62 |
| FLT1 | 15 | 0.01 | 0.39 | 0.51 | 1,474 | 2.58 |
| VWF | 14 | 0.00 | 0.37 | 0.52 | 582 | 2.67 |
| GLDC | 13 | 0.06 | 0.34 | 0.15 | 5,708 | 2.96 |
| DCN | 12 | 0.09 | 0.37 | 0.26 | 6,442 | 2.69 |
| CCND1 | 12 | 0.04 | 0.38 | 0.47 | 2,944 | 2.65 |
| SLC12A1 | 12 | 0.03 | 0.38 | 0.42 | 3,942 | 2.62 |
| ALDH4A1 | 12 | 0.03 | 0.31 | 0.21 | 3,776 | 3.20 |
| FGF1 | 11 | 0.02 | 0.37 | 0.53 | 1,592 | 2.67 |
| Table V.Functional and pathway enrichment
analyses of nodes in the significant module. |
Table V.
Functional and pathway enrichment
analyses of nodes in the significant module.
| Term | Description | Count | P-value |
|---|
| GO:0006811 | Ion transport | 12 |
6.36×10⁻¹⁰ |
| GO:0034220 | Ion transmembrane
transport | 10 | 1.07
×10−08 |
| GO:0007588 | Excretion | 5 | 1.97
×10−08 |
| GO:0016324 | Apical plasma
membrane | 7 | 4.25
×10−08 |
| GO:0015672 | Monovalent
inorganic cation transport | 8 | 4.97
×10−08 |
| GO:0050878 | Regulation of body
fluid levels | 8 | 6.29
×10−08 |
| GO:0030001 | Metal ion
transport | 9 | 7.29
×10−08 |
| GO:0016324 | Apical plasma
membrane | 7 | 1.68
×10−07 |
| GO:0055085 | Transmembrane
transport | 10 | 1.70
×10−07 |
| GO:0006812 | Cation
transport | 9 | 2.94
×10−07 |
| KEGG:hsa04960 |
Aldosterone-regulated sodium
reabsorption | 4 |
1.94×10−05 |
| KEGG:hsa04510 | Focal adhesion | 5 |
1.40×10−04 |
| KEGG:hsa05219 | Bladder cancer | 3 |
1.50×10−03 |
| KEGG:hsa04742 | Taste
transduction | 3 |
1.81×10−03 |
| KEGG:hsa05212 | Pancreatic
cancer | 3 |
3.73×10−03 |
| KEGG:hsa04066 | HIF-1 signaling
pathway | 3 |
8.32×10−03 |
| KEGG:hsa04151 | PI3K-Akt signaling
pathway | 4 |
1.14×10−02 |
| KEGG:hsa05205 | Proteoglycans in
cancer | 3 |
3.22×10−02 |
| KEGG:hsa04015 | Rap1 signaling
pathway | 3 |
3.52×10−02 |
| KEGG:hsa04014 | Ras signaling
pathway | 3 |
4.03×10−02 |
| KEGG:hsa04060 | Cytokine-cytokine
receptor interaction | 3 |
4.16×10−02 |
TF-DEG regulatory network
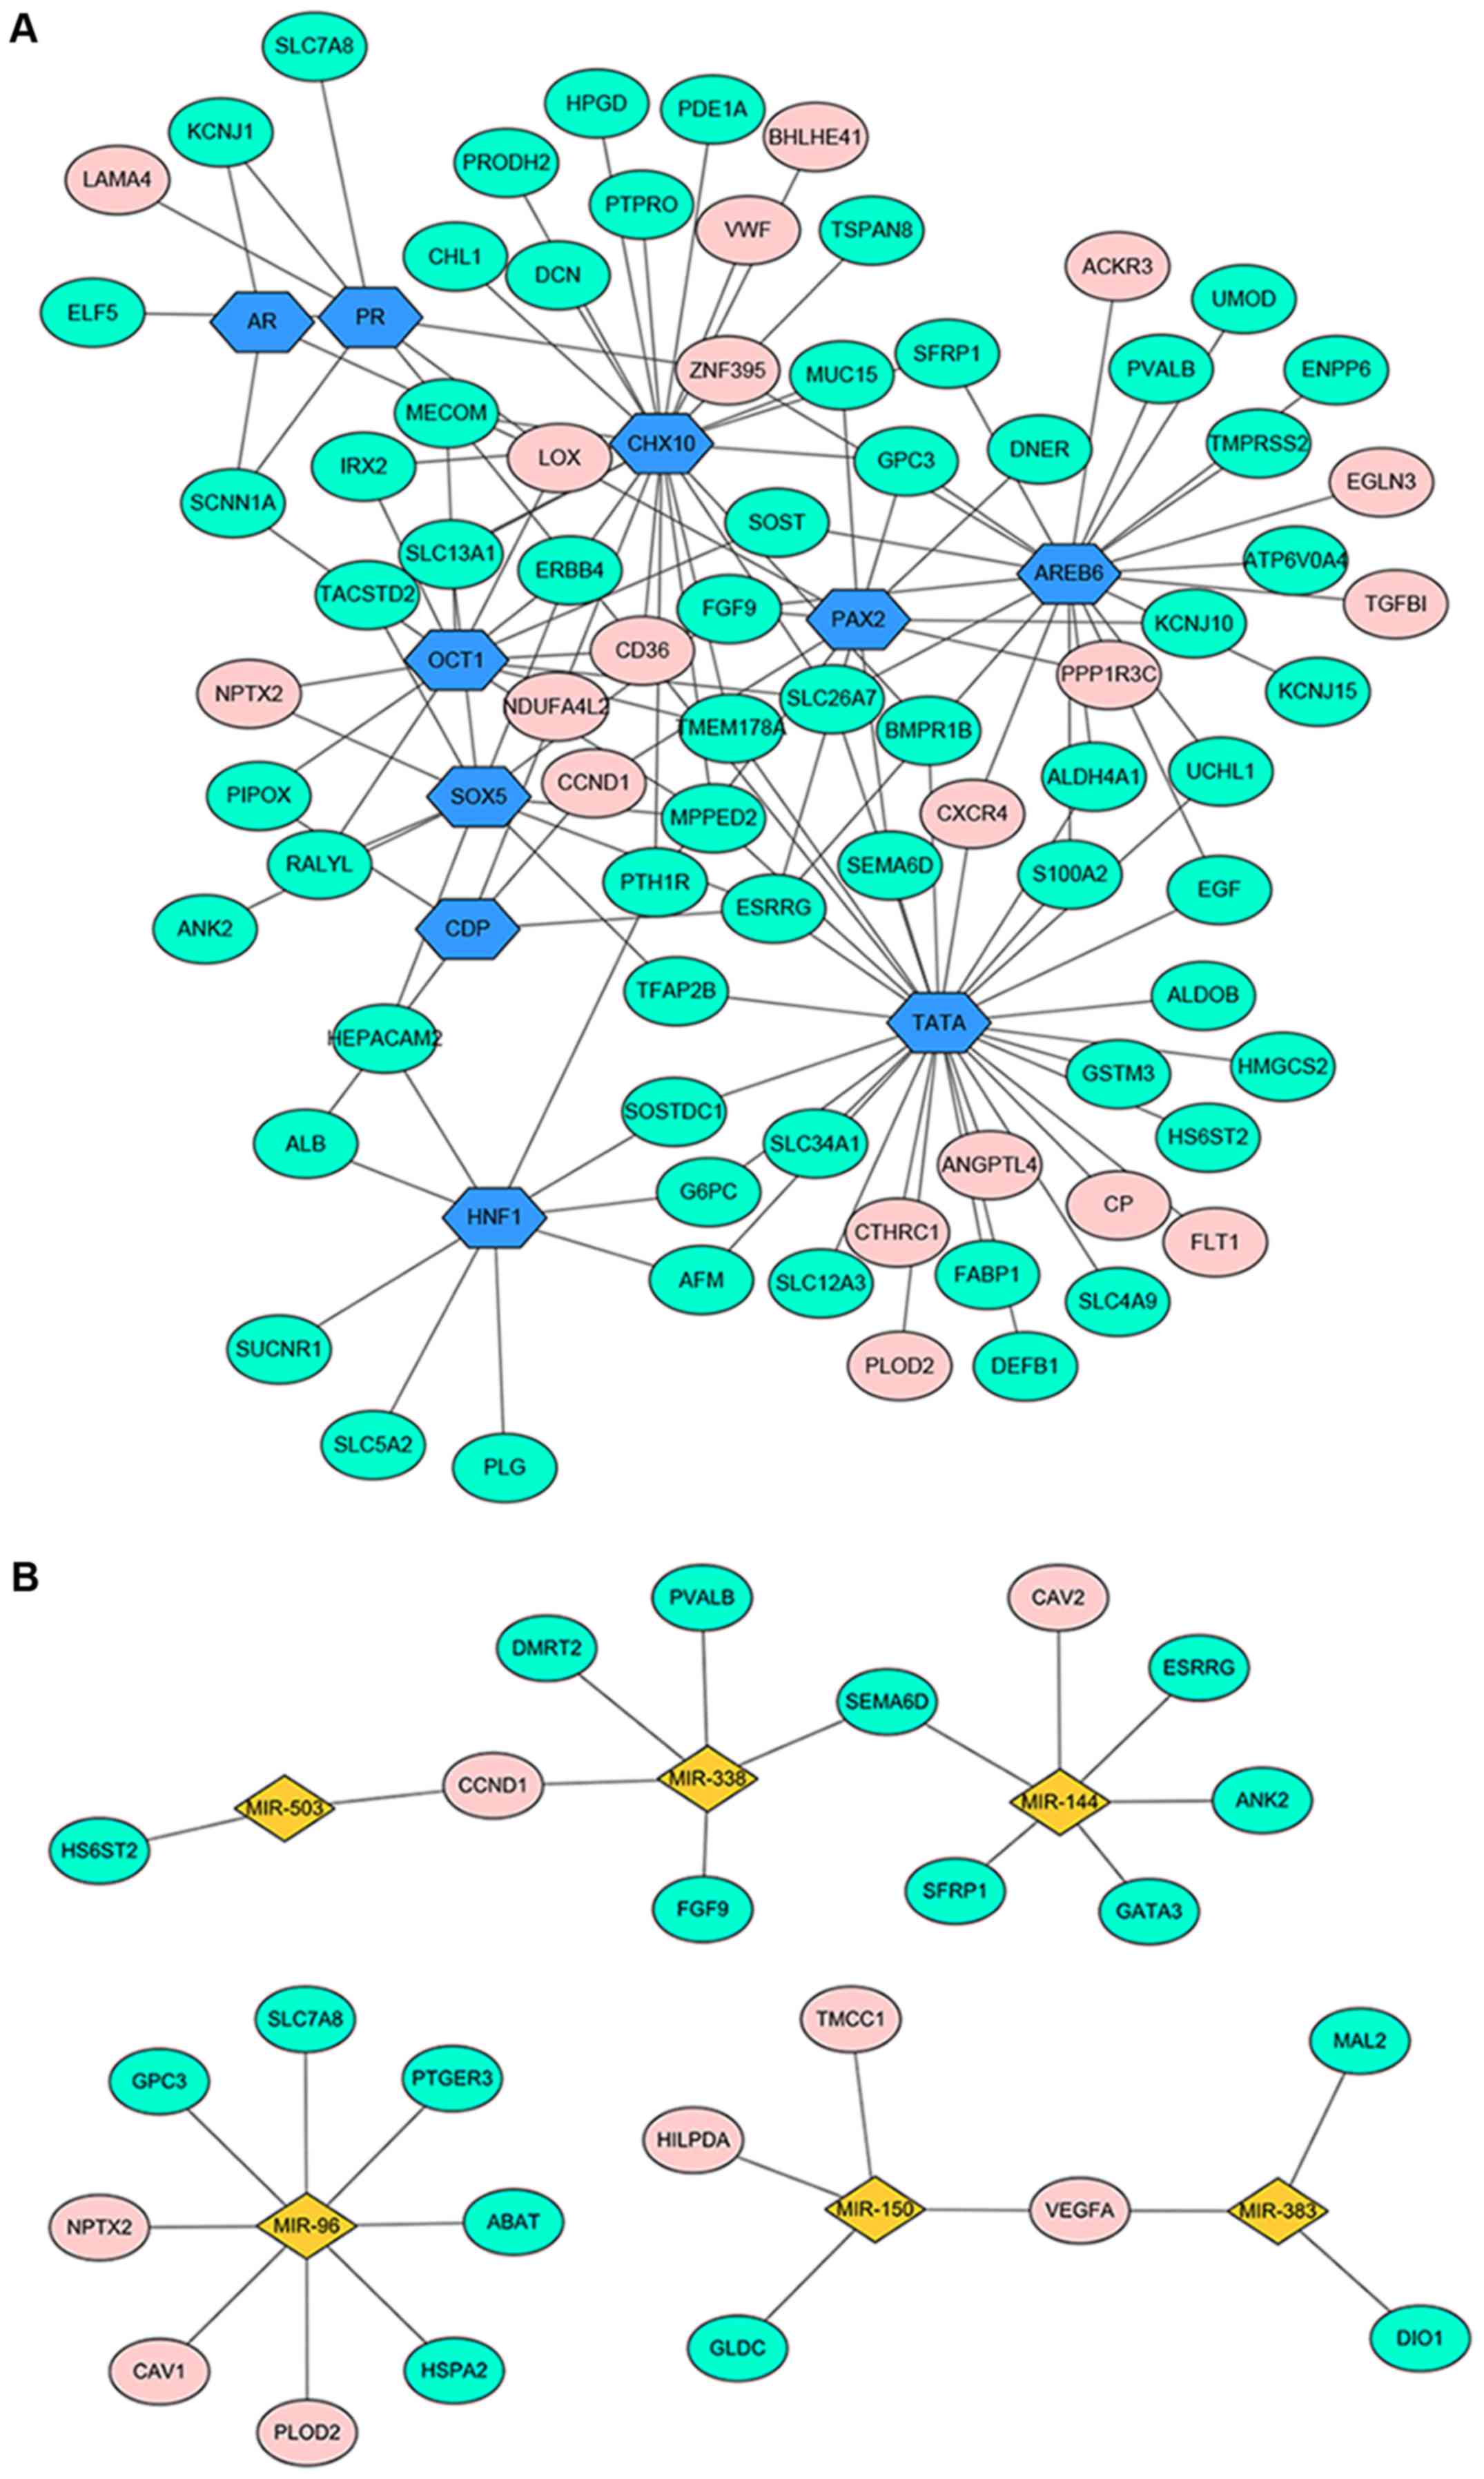
The DEG-associated transcriptional regulatory
network was shown in Fig. 3A. A total
of 90 nodes with 135 edges were contained in this regulation
network, including 61 downregulated genes, 19 upregulated genes and
10 TFs.
miRNA-DEG regulatory network
In total, 6 miRNAs were filtered out (miR-144,
miR-96, miR-503, miR-150, miR-383 and miR-338) (Fig. 3B). A total of 31 nodes and 28 edges
were included in this regulatory network.
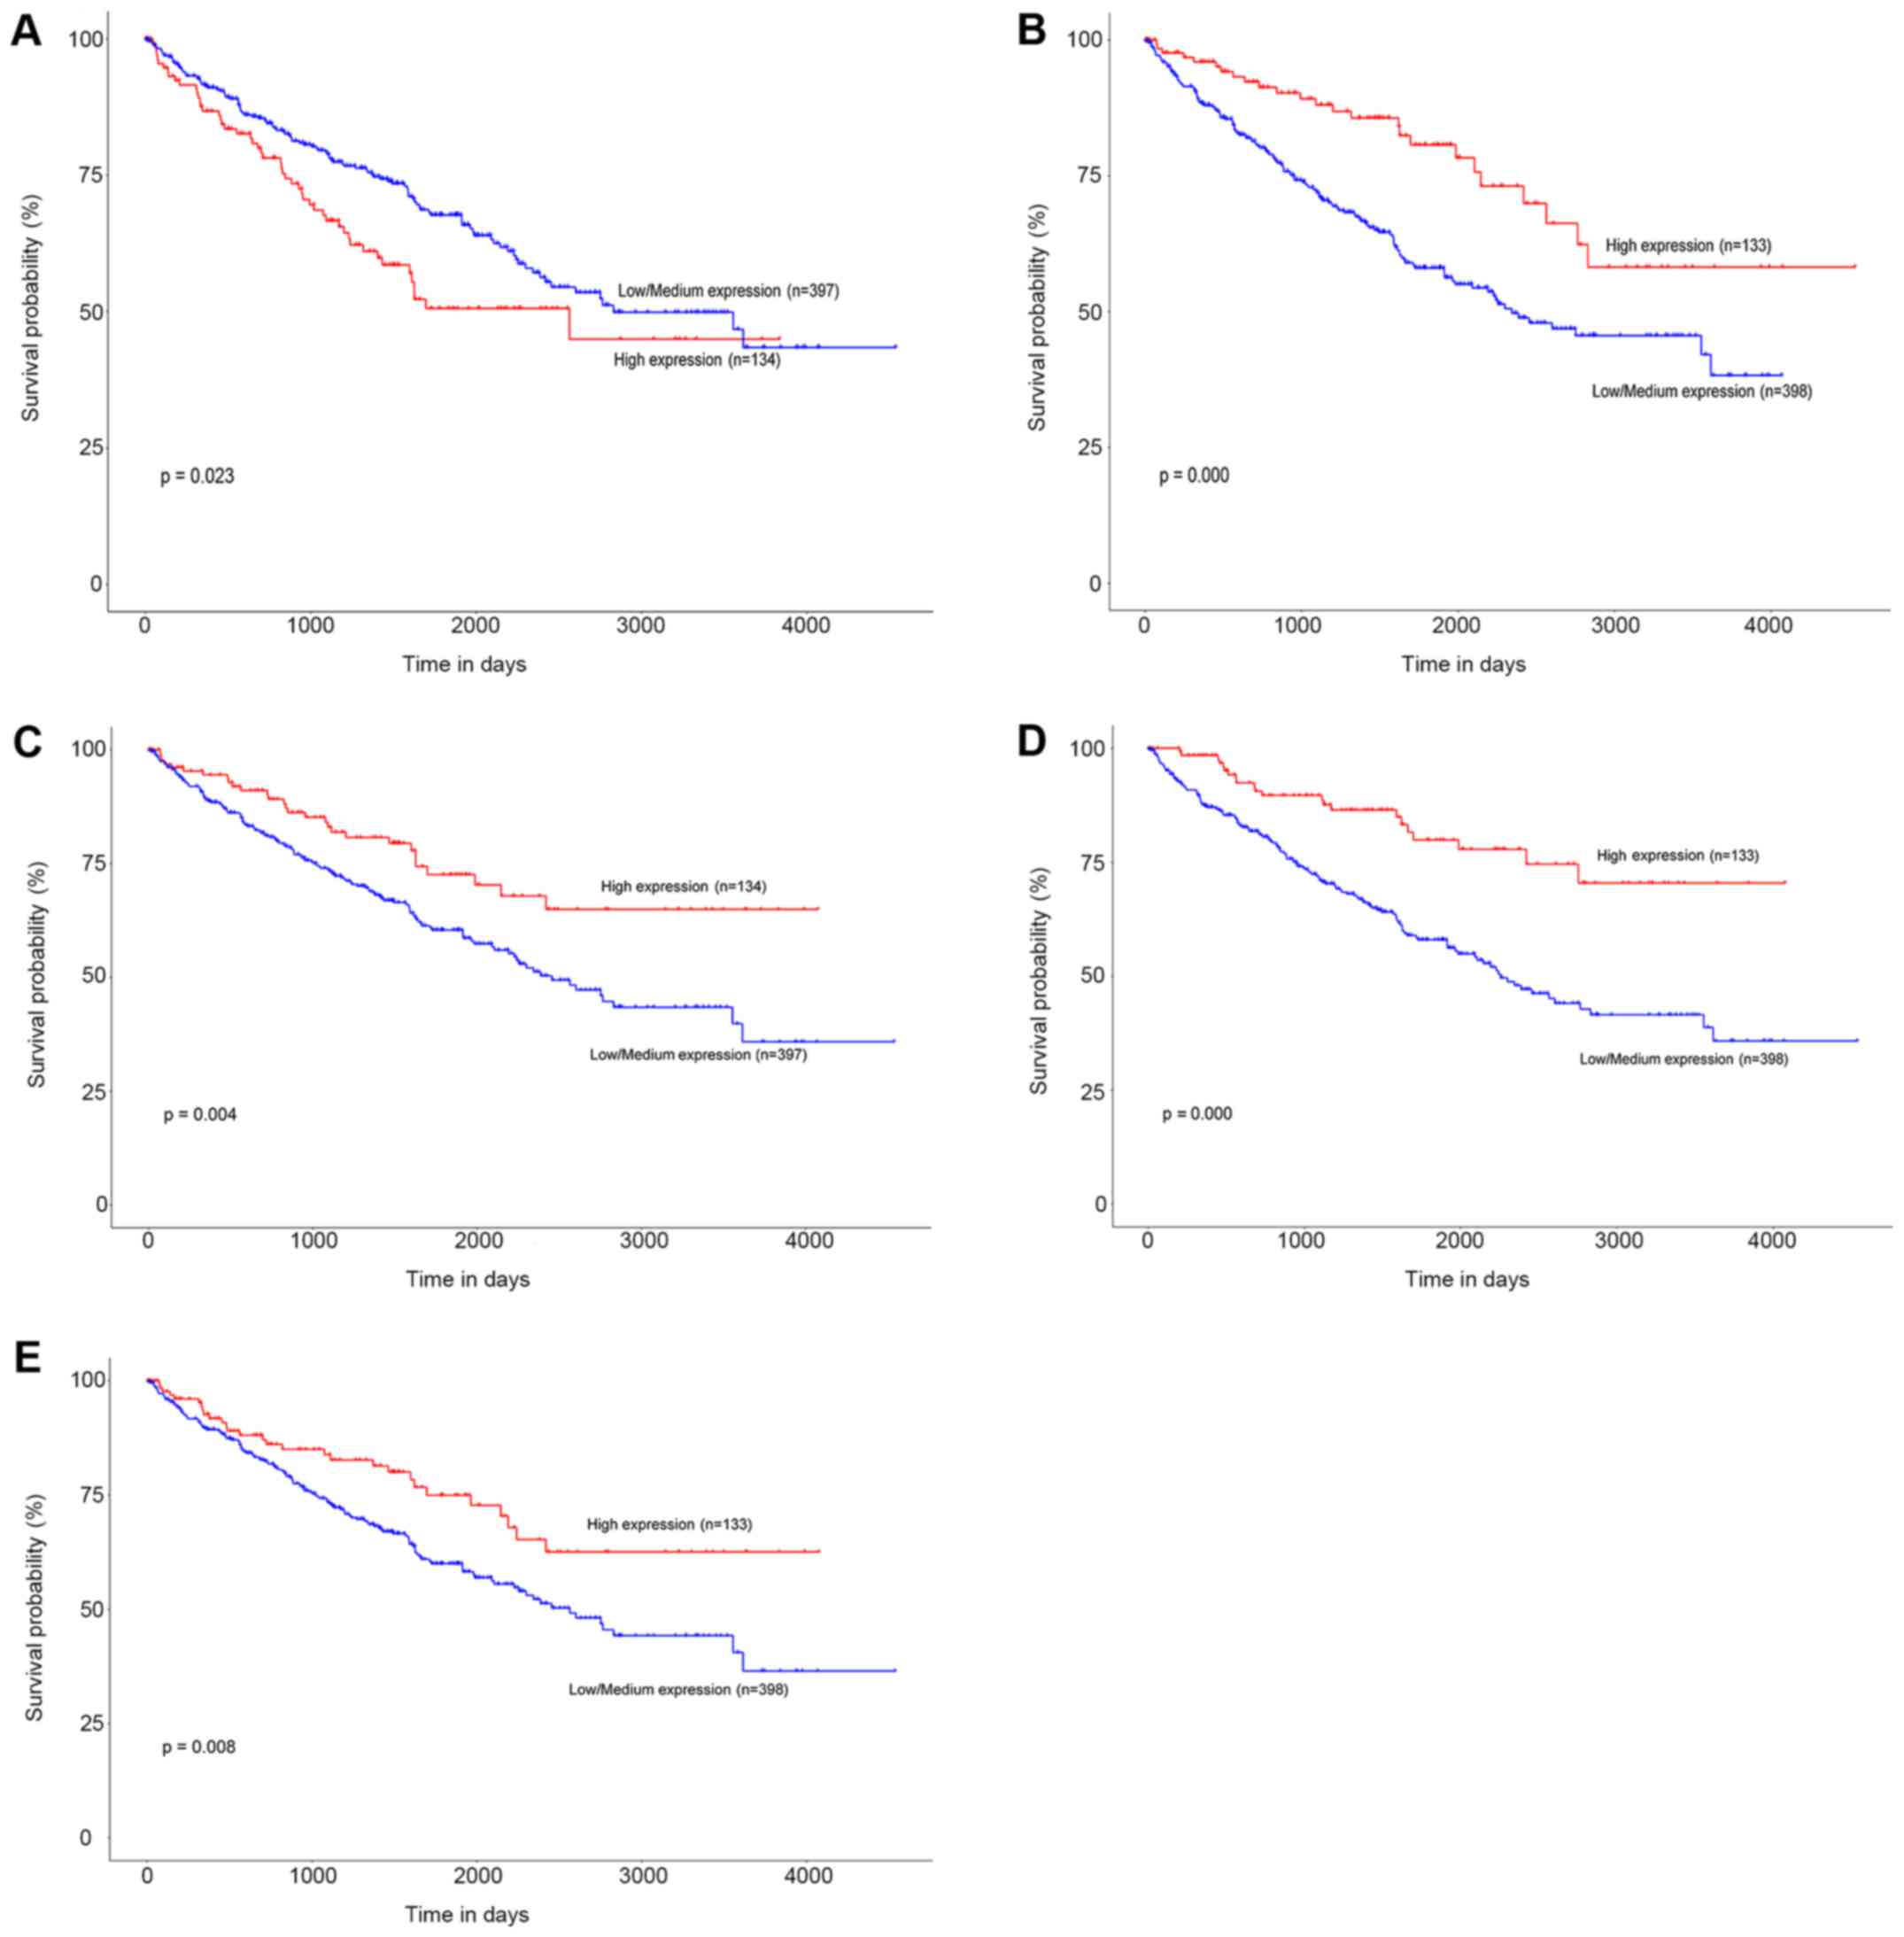
TCGA validation and the Kaplan-Meier
plot
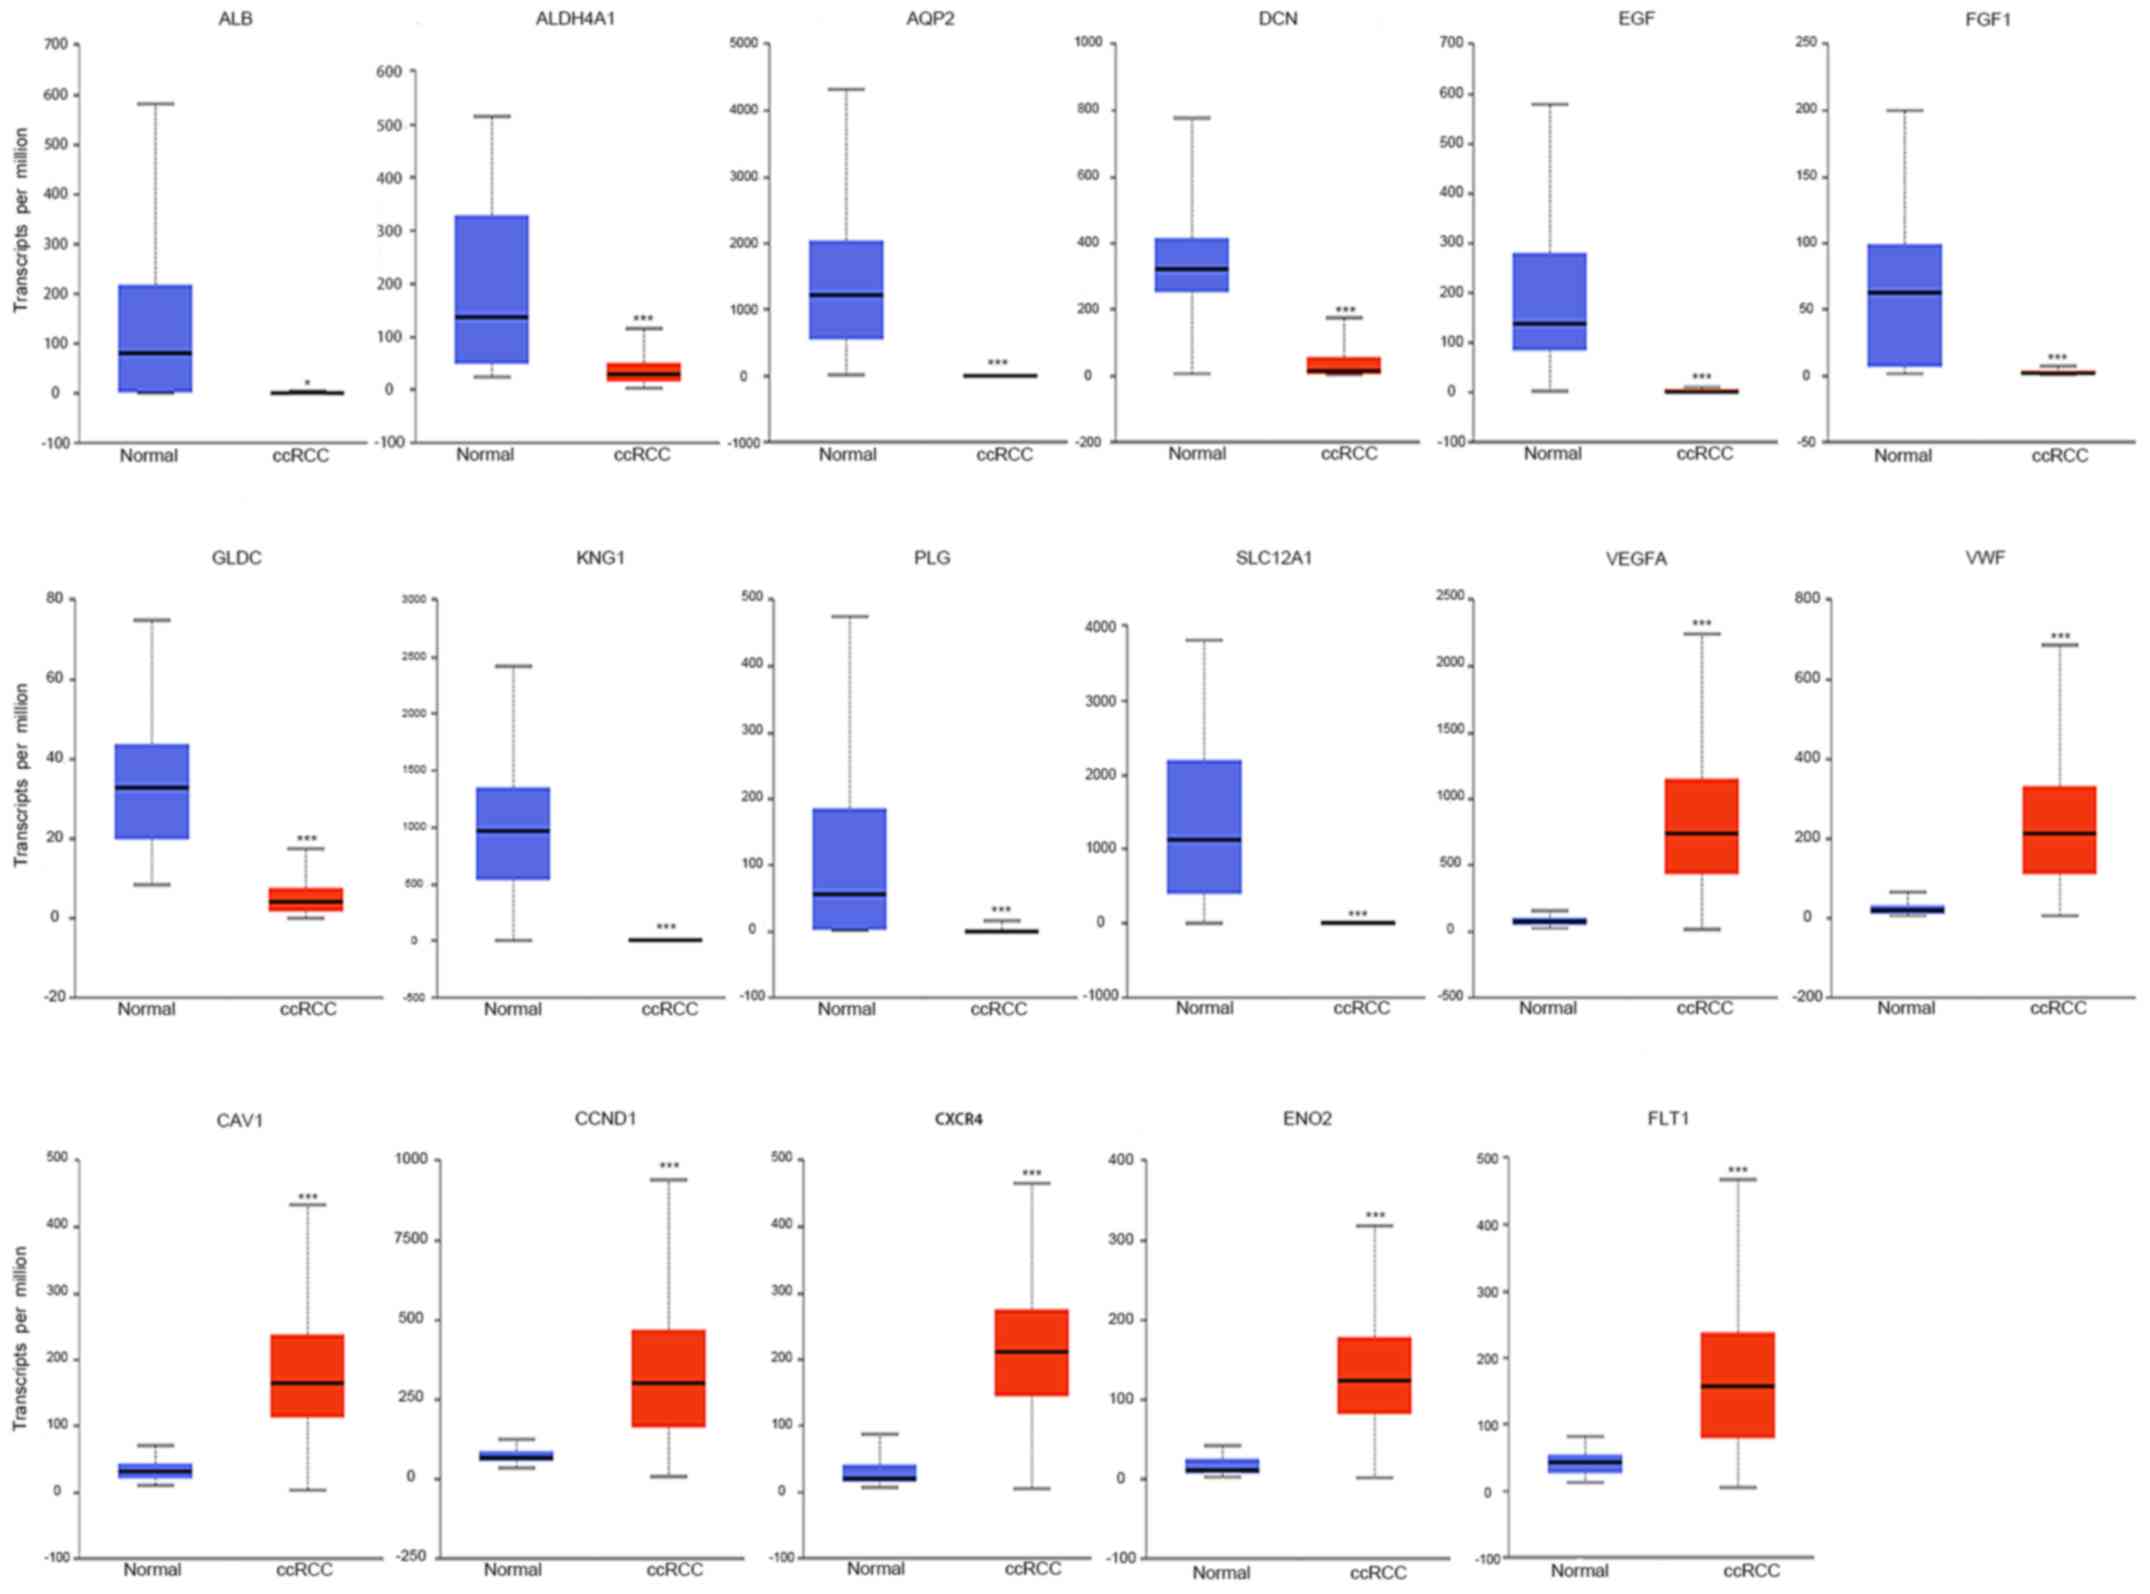
TCGA data of ccRCC patients were used via the UALCAN
data portal. The hub genes identified from the PPI network were
differentially expressed between ccRCC tissues and normal tissues
(Fig. 4). The expression trends were
identical within the three GEO datasets. Kaplan-Meier curve for
overall survival of TCGA patients with ccRCC was obtained according
to the low and high expression of each gene. The results showed
that patients in the high mRNA expression group for ENO2 had
significantly worse OS than those in the low/medium expression
group (P=0.023) (Fig. 5A). While high
mRNA expression level of CCND1 was associated with longer OS
for ccRCC patients (P=0.000), as well as FLT1 (P=0.004),
PLG (P=0.000), and VWF (P=0.008) (Fig. 5B-E).
Discussion
The prognosis remains uncertain in ccRCC patients.
Identifying novel potential biomarkers for early diagnosis,
prognostic evaluation or targeted therapy may improve patient
outcomes. Here we performed an in-depth analysis of three
expression profiles (with 126 ccRCC tissues and 100 normal
controls) using bioinformatics method and identified 65 up- and 164
downregulated genes. Then we constructed a PPI network of DEGs and
extracted 17 hub genes and one significant module from the PPI
network. GO and KEGG pathway analysis revealed that the DEGs were
commonly involved in functional terms and pathways related to the
progression and prognosis of ccRCC. For example, hypoxia and HIF-1
pathway alterations are critical for the initiation and metastasis
of ccRCC (20). Hypoxia could induce
a series of tumor-related aberrations within cellular metabolism,
apoptosis, migration and angiogenesis through dysregulation of HIF
target genes (20). Drugs targeting
the HIF-1 pathway have proven to be effective in treating ccRCC
patients (21). In addition,
metabolic pathways play a critical role in ccRCC progression
according to previous studies, as well as
glycolysis/gluconeogenesis, AMPK signaling pathway, and PI3K-Akt
signaling pathway (22).
Interestingly, the Staphylococcus aureus
infection pathway was found to be significant in our study. Growing
evidence has indicated that bacterial infection is highly
associated with certain human malignancies (23). It has been reported that lipoteichoic
acids from S. aureus induce proliferation of two human
non-small-cell lung cancer cell lines, A549 and H226 (24). However, the role of S. aureus
infection in ccRCC still remains to be detected.
Using a Kaplan-Meier plot for survival analysis, the
mRNA expression levels of ENO2, CCND1, PLT1, PLG and
VWF were found to be significantly correlated with OS in
ccRCC.
Enolase 2 (ENO2) encodes an enolase isoenzyme
which is considered as a sensitive and specific biomarker for
small-cell lung cancer (25,26). According to our KEGG results,
ENO2 was involved in several pathways compactly related to
ccRCC pathogenesis such as glycolysis/gluconeogenesis, HIF-1
signaling pathway and metabolic pathways. In addition, ENO2
is found to be induced by HIF-2a although suppression of its mRNA
expression alone does not significantly inhibit the growth of the
ccRCC cell line 786-O (27).
Combining our survival analysis, we infer that ENO2 may be
an indicator in the diagnosis and prognosis rather than a potential
target for therapy.
Cyclin D1 (CCND1) encodes an essential
protein in the cell cycle which shows dual functions in cell
growth. It is well-established that CCND1 regulates the cell
cycle transition from G1 to S phase by binding to CK4 and CDK6
(28,29). Previous studies suggest that the
overexpression of CCND1 promotes cell growth in many
malignancies (30–34). Other studies have shown an apoptotic
induction effect of CCND1. Consistent expression of an
exogenous CCND1 significantly inhibits cell proliferation
(35) and induces apoptosis in
mammary epithelial cell lines (36).
Upregulated CCND1 induces apoptosis of fibroblasts (37) and has a positive correlation with a
high apoptotic index in squamous cell carcinomas (38). Our analysis and previous studies show
that CCND1 is upregulated in ccRCC patients (39). Furthermore, it has been reported that
reducing CCND1 expression leads to a suppression of tumor
growth in ccRCC (27). CCND1
is considered as an oncogene in ccRCC. Interestingly, our results
showed that high expression of CCND1 was associated with
favorable prognosis in ccRCC. Similarly, CCND1 is elevated
and has a favorable effect on disease-free survival in papillary
superficial bladder cancer (40). Two
independent studies have shown that colon cancer patients with
higher CCND1 expression have better outcomes (41,42). The
molecular mechanism of CCND1 in cancer awaits further
investigation.
The importance of VEGF in RCC progression is
well established and several VEGFR inhibitors such as sunitinib and
sorafenib have proven to be significantly beneficial for
progression-free survival (PFS) and OS in phase 3 trials (43,44).
Recent research has demonstrated that FLT1 (also known as
VEGFR-1) protein expression in the tumor epithelium of
localized ccRCC patients has a negative effect on prognosis
(45). Other studies have found that
high mRNA expression level of FLT1 is significantly related
to favorable PFS in metastatic ccRCC patients treated with
sunitinib (46). In this study, we
found that higher mRNA expression levels of FLT1 in ccRCC
tissue were associated with longer OS. The implication of
FLT1 in ccRCC remains unclear. It should be noted that
FLT1 can be generated as a transmembrane form and a soluble
form. Soluble FLT1 (sFlt1) lacks transmembrane and
intracellular domains in contrast to the primary form, a
full-length transmembrane receptor (47). Additionally, sFlt1 is thought
to be a natural antagonist of VEGF. Recent studies have
found that sFlt1 has an antitumor effect on several cancer
cells (48–50). Enhanced sFlt1 expression in the
serum of breast cancer patients inhibits circulating tumor cells
entering the peripheral blood, which may contribute to favorable
outcomes (51). Herein we hypothesize
that not transmembrane FLT1 but sFLT1 may have an
antitumor effect on ccRCC and the value of sFlt1 in patient
serum or urine may be worthy of further evaluation.
More and more evidence has demonstrated that
plasminogen-plasmin system components are involved in tumor growth,
invasion and metastasis by regulating angiogenesis and cell
migration (52). The high levels of
uPA, uPAR or PAI-1 expression have proven to be
prognostic biomarkers of poor outcome in many cancers, such as
ovary cancer, breast cancer and renal cancer (53). The mRNA expression level of PLG
in ccRCC patients was found to be downregulated in our analysis and
other studies (54). Our results
revealed that the ccRCC patients with a higher PLG mRNA
expression had longer OS. Similar results have been reported in
advanced ovarian cancer recently, and PLG was identified to
be a favorable prognostic biomarker in this disease (55).
Another favorable biomarker in our analysis is
Von Willebrand Factor (VWF), which shows dual functions in
angiogenesis and cancer metastasis according to previous data
(56). VWF exhibits a
pro-apoptotic effect on 769P, a ccRCC-derived cell line (57). While others have found that serum
VWF levels are notably higher in progressive RCC patients
compared with stable RCC patients (58). More studies should be done to clarify
the link between VWF and ccRCC.
The main limitation of our study is that exploration
is done at a bioinformatics level, in silico. Future
studies, especially biological experiments in vitro and
in vivo are needed to validate the function of these DEGs in
ccRCC.
In conclusion, through an integrated bioinformatics
analysis of three gene profiles, we identified 229 DEGs, which may
contain key genes in ccRCC pathogenesis. Five of the 17 hub genes
including ENO2, CCND1, PLT1, PLG and VWF were
filtered out through our analysis and may be potential prognostic
biomarkers in ccRCC.
Acknowledgements
Not applicable.
Funding
This study was supported by the Guangdong Obers
Blood Purification Academician Work Station (grant no.
2013B090400004); the Guangzhou Entrepreneurial Leader Talent (grant
no. LCY201215); and the Guangdong Provincial Center for Clinical
Engineering of Blood Purification (grant no. 507204531040).
Availability of data and materials
The datasets used and/or analyzed during the current
study are available from the corresponding author on reasonable
request.
Authors' contributions
BH, LY and TL designed the study; TL, XC, SZ, BG,
BH, YL and CY performed data analysis; YM, FL and TW performed
literature research and data acquisition and participated in the
data analysis; TL and XC wrote the manuscript; BH and LY revised
the manuscript; YL and CY edited the manuscript and approved the
final version of the manuscript; LY obtained funding. All authors
read and approved the final manuscript.
Ethics approval and consent to
participate
Not applicable.
Consent for publication
Not applicable.
Competing interests
The authors declare no competing interests.
References
|
1
|
Li P, Znaor A, Holcatova I, Fabianova E,
Mates D, Wozniak MB, Ferlay J and Scelo G: Regional geographic
variations in kidney cancer incidence rates in European countries.
Eur Urol. 67:1134–1141. 2015. View Article : Google Scholar : PubMed/NCBI
|
|
2
|
Ferlay J, Soerjomataram I, Dikshit R, Eser
S, Mathers C, Rebelo M, Parkin DM, Forman D and Bray F: Cancer
incidence and mortality worldwide: Sources, methods and major
patterns in GLOBOCAN 2012. Int J Cancer. 136:E359–E386. 2015.
View Article : Google Scholar : PubMed/NCBI
|
|
3
|
Srinivasan R, Ricketts CJ, Sourbier C and
Linehan WM: New strategies in renal cell carcinoma: Targeting the
genetic and metabolic basis of disease. Clin Cancer Res. 21:10–17.
2015. View Article : Google Scholar : PubMed/NCBI
|
|
4
|
Capitanio U and Montorsi F: Renal cancer.
Lancet. 387:894–906. 2016. View Article : Google Scholar : PubMed/NCBI
|
|
5
|
Gossage L and Eisen T: Alterations in VHL
as potential biomarkers in renal-cell carcinoma. Nat Rev Clin
Oncol. 7:277–288. 2010. View Article : Google Scholar : PubMed/NCBI
|
|
6
|
Cancer Genome Atlas Research Network:
Comprehensive molecular characterization of clear cell renal cell
carcinoma. Nature. 499:43–49. 2013. View Article : Google Scholar : PubMed/NCBI
|
|
7
|
Ibragimova I, Maradeo ME, Dulaimi E and
Cairns P: Aberrant promoter hypermethylation of PBRM1, BAP1, SETD2,
KDM6A and other chromatin-modifying genes is absent or rare in
clear cell RCC. Epigenetics. 8:486–493. 2013. View Article : Google Scholar : PubMed/NCBI
|
|
8
|
Valera VA, Walter BA, Linehan WM and
Merino MJ: Regulatory effects of microRNA-92 (miR-92) on VHL gene
expression and the hypoxic activation of miR-210 in clear cell
renal cell carcinoma. J Cancer. 2:515–526. 2011. View Article : Google Scholar : PubMed/NCBI
|
|
9
|
McCormick RI, Blick C, Ragoussis J,
Schoedel J, Mole DR, Young AC, Selby PJ, Banks RE and Harris AL:
miR-210 is a target of hypoxia-inducible factors 1 and 2 in renal
cancer, regulates ISCU and correlates with good prognosis. Br J
Cancer. 108:1133–1142. 2013. View Article : Google Scholar : PubMed/NCBI
|
|
10
|
Peña-Llopis S, Vega-Rubín-de-Celis S, Liao
A, Leng N, Pavía-Jiménez A, Wang S, Yamasaki T, Zhrebker L,
Sivanand S, Spence P, et al: BAP1 loss defines a new class of renal
cell carcinoma. Nat Genet. 44:751–759. 2012. View Article : Google Scholar : PubMed/NCBI
|
|
11
|
Eckel-Passow JE, Serie DJ, Bot BM, Joseph
RW, Cheville JC and Parker AS: ANKS1B is a smoking-related
molecular alteration in clear cell renal cell carcinoma. BMC Urol.
14:142014. View Article : Google Scholar : PubMed/NCBI
|
|
12
|
Takahashi M, Tsukamoto Y, Kai T, Tokunaga
A, Nakada C, Hijiya N, Uchida T, Daa T, Nomura T, Sato F, et al:
Downregulation of WDR20 due to loss of 14q is involved in the
malignant transformation of clear cell renal cell carcinoma. Cancer
Sci. 107:417–423. 2016. View Article : Google Scholar : PubMed/NCBI
|
|
13
|
Barrett T, Wilhite SE, Ledoux P,
Evangelista C, Kim IF, Tomashevsky M, Marshall KA, Phillippy KH,
Sherman PM, Holko M, et al: NCBI GEO: Archive for functional
genomics data sets-update. Nucleic Acids Res. 41:(Database Issue):.
D991–D995. 2013. View Article : Google Scholar : PubMed/NCBI
|
|
14
|
Huang da W, Sherman BT and Lempicki RA:
Systematic and integrative analysis of large gene lists using DAVID
bioinformatics resources. Nat Protoc. 4:44–57. 2009. View Article : Google Scholar : PubMed/NCBI
|
|
15
|
Huang da W, Sherman BT and Lempicki RA:
Bioinformatics enrichment tools: Paths toward the comprehensive
functional analysis of large gene lists. Nucleic Acids Res.
37:1–13. 2009. View Article : Google Scholar : PubMed/NCBI
|
|
16
|
Szklarczyk D, Morris JH, Cook H, Kuhn M,
Wyder S, Simonovic M, Santos A, Doncheva NT, Roth A, Bork P, et al:
The STRING database in 2017: Quality-controlled protein-protein
association networks, made broadly accessible. Nucleic Acids Res.
45:D362–D368. 2017. View Article : Google Scholar : PubMed/NCBI
|
|
17
|
Bader GD and Hogue CW: An automated method
for finding molecular complexes in large protein interaction
networks. BMC Bioinformatics. 4:22003. View Article : Google Scholar : PubMed/NCBI
|
|
18
|
Wang J, Duncan D, Shi Z and Zhang B:
WEB-based GEne SeT AnaLysis Toolkit (WebGestalt): Update 2013.
Nucleic Acids Res. 41:W77–W83. 2013. View Article : Google Scholar : PubMed/NCBI
|
|
19
|
Chandrashekar DS, Bashel B, Balasubramanya
SAH, Creighton CJ, Ponce-Rodriguez I, Chakravarthi BVSK and
Varambally S: UALCAN: A portal for facilitating tumor subgroup gene
expression and survival analyses. Neoplasia. 19:649–658. 2017.
View Article : Google Scholar : PubMed/NCBI
|
|
20
|
Schödel J, Grampp S, Maher ER, Moch H,
Ratcliffe PJ, Russo P and Mole DR: Hypoxia, hypoxia-inducible
transcription factors, and renal cancer. Eur Urol. 69:646–657.
2016. View Article : Google Scholar : PubMed/NCBI
|
|
21
|
Escudier B, Szczylik C, Porta C and Gore
M: Treatment selection in metastatic renal cell carcinoma: Expert
consensus. Nat Rev Clin Oncol. 9:327–337. 2012. View Article : Google Scholar : PubMed/NCBI
|
|
22
|
Ciccarese C, Brunelli M, Montironi R,
Fiorentino M, Iacovelli R, Heng D, Tortora G and Massari F: The
prospect of precision therapy for renal cell carcinoma. Cancer
Treat Rev. 49:37–44. 2016. View Article : Google Scholar : PubMed/NCBI
|
|
23
|
Zhu C, Wang Y, Cai C and Cai Q: Bacterial
infection and associated cancers. Adv Exp Med Biol. 1018:181–191.
2017. View Article : Google Scholar : PubMed/NCBI
|
|
24
|
Hattar K, Reinert CP, Sibelius U,
Gökyildirim MY, Subtil FSB, Wilhelm J, Eul B, Dahlem G, Grimminger
F, Seeger W and Grandel U: Lipoteichoic acids from Staphylococcus
aureus stimulate proliferation of human non-small-cell lung cancer
cells in vitro. Cancer Immunol Immunother. 66:799–809. 2017.
View Article : Google Scholar : PubMed/NCBI
|
|
25
|
Fizazi K, Cojean I, Pignon JP, Rixe O,
Gatineau M, Hadef S, Arriagada R, Baldeyrou P, Comoy E and Le
Chevalier T: Normal serum neuron specific enolase (NSE) value after
the first cycle of chemotherapy: An early predictor of complete
response and survival in patients with small cell lung carcinoma.
Cancer. 82:1049–1055. 1998. View Article : Google Scholar : PubMed/NCBI
|
|
26
|
Oremek GM, Sauer-Eppel H and Bruzdziak TH:
Value of tumour and inflammatory markers in lung cancer. Anticancer
Res. 27:1911–1915. 2007.PubMed/NCBI
|
|
27
|
Zhang T, Niu X, Liao L, Cho EA and Yang H:
The contributions of HIF-target genes to tumor growth in RCC. PLoS
One. 8:e805442013. View Article : Google Scholar : PubMed/NCBI
|
|
28
|
MacLachlan TK, Sang N and Giordano A:
Cyclins, cyclin-dependent kinases and cdk inhibitors: Implications
in cell cycle control and cancer. Crit Rev Eukaryot Gene Expr.
5:127–156. 1995. View Article : Google Scholar : PubMed/NCBI
|
|
29
|
Alao JP: The regulation of cyclin D1
degradation: Roles in cancer development and the potential for
therapeutic invention. Mol Cancer. 6:242007. View Article : Google Scholar : PubMed/NCBI
|
|
30
|
Arber N, Hibshoosh H, Moss SF, Sutter T,
Zhang Y, Begg M, Wang S, Weinstein IB and Holt PR: Increased
expression of cyclin D1 is an early event in multistage colorectal
carcinogenesis. Gastroenterology. 110:669–674. 1996. View Article : Google Scholar : PubMed/NCBI
|
|
31
|
Gautschi O, Ratschiller D, Gugger M,
Betticher DC and Heighway J: Cyclin D1 in non-small cell lung
cancer: a key driver of malignant transformation. Lung Cancer.
55:1–14. 2007. View Article : Google Scholar : PubMed/NCBI
|
|
32
|
Bosch F, Jares P, Campo E, Lopez-Guillermo
A, Piris MA, Villamor N, Tassies D, Jaffe ES, Montserrat E, Rozman
C, et al: PRAD-1/cyclin D1 gene overexpression in chronic
lymphoproliferative disorders: A highly specific marker of mantle
cell lymphoma. Blood. 84:2726–2732. 1994.PubMed/NCBI
|
|
33
|
Faust JB and Meeker TC: Amplification and
expression of the bcl-1 gene in human solid tumor cell lines.
Cancer Res. 52:2460–2463. 1992.PubMed/NCBI
|
|
34
|
Buckley MF, Sweeney KJ, Hamilton JA, Sini
RL, Manning DL, Nicholson RI, deFazio A, Watts CK, Musgrove EA and
Sutherland RL: Expression and amplification of cyclin genes in
human breast cancer. Oncogene. 8:2127–2133. 1993.PubMed/NCBI
|
|
35
|
Han EK, Sgambato A, Jiang W, Zhang YJ,
Santella RM, Doki Y, Cacace AM, Schieren I and Weinstein IB: Stable
overexpression of cyclin D1 in a human mammary epithelial cell line
prolongs the S-phase and inhibits growth. Oncogene. 10:953–961.
1995.PubMed/NCBI
|
|
36
|
Han EK, Begemann M, Sgambato A, Soh JW,
Doki Y, Xing WQ, Liu W and Weinstein IB: Increased expression of
cyclin D1 in a murine mammary epithelial cell line induces p27kip1,
inhibits growth, and enhances apoptosis. Cell Growth Differ.
7:699–710. 1996.PubMed/NCBI
|
|
37
|
Sofer-Levi Y and Resnitzky D: Apoptosis
induced by ectopic expression of cyclin D1 but not cyclin E.
Oncogene. 13:2431–2437. 1996.PubMed/NCBI
|
|
38
|
Kotelnikov VM, Coon JS IV, Mundle S,
Kelanic S, LaFollette S, Taylor S IV, Hutchinson J, Panje W,
Caldarelli DD and Preisler HD: Cyclin D1 expression in squamous
cell carcinomas of the head and neck and in oral mucosa in relation
to proliferation and apoptosis. Clin Cancer Res. 3:95–101.
1997.PubMed/NCBI
|
|
39
|
Tang SW, Chang WH, Su YC, Chen YC, Lai YH,
Wu PT, Hsu CI, Lin WC, Lai MK and Lin JY: MYC pathway is activated
in clear cell renal cell carcinoma and essential for proliferation
of clear cell renal cell carcinoma cells. Cancer Lett. 273:35–43.
2009. View Article : Google Scholar : PubMed/NCBI
|
|
40
|
Sgambato A, Migaldi M, Faraglia B, de
Aloysio G, Ferrari P, Ardito R, de Gaetani C, Capelli G, Cittadini
A and Trentini GP: Cyclin D1 expression in papillary superficial
bladder cancer: Its association with other cell cycle-associated
proteins, cell proliferation and clinical outcome. Int J Cancer.
97:671–678. 2002. View Article : Google Scholar : PubMed/NCBI
|
|
41
|
Holland TA, Elder J, McCloud JM, Hall C,
Deakin M, Fryer AA, Elder JB and Hoban PR: Subcellular localisation
of cyclin D1 protein in colorectal tumours is associated with
p21(WAF1/CIP1) expression and correlates with patient survival. Int
J Cancer. 95:302–306. 2001. View Article : Google Scholar : PubMed/NCBI
|
|
42
|
Ogino S, Nosho K, Irahara N, Kure S, Shima
K, Baba Y, Toyoda S, Chen L, Giovannucci EL, Meyerhardt JA and
Fuchs CS: A cohort study of cyclin D1 expression and prognosis in
602 colon cancer cases. Clin Cancer Res. 15:4431–4438. 2009.
View Article : Google Scholar : PubMed/NCBI
|
|
43
|
Motzer RJ, Hutson TE, Tomczak P,
Michaelson MD, Bukowski RM, Rixe O, Oudard S, Negrier S, Szczylik
C, Kim ST, et al: Sunitinib versus interferon alfa in metastatic
renal-cell carcinoma. N Engl J Med. 356:115–124. 2007. View Article : Google Scholar : PubMed/NCBI
|
|
44
|
Escudier B, Eisen T, Stadler WM, Szczylik
C, Oudard S, Staehler M, Negrier S, Chevreau C, Desai AA, Rolland
F, et al: Sorafenib for treatment of renal cell carcinoma: Final
efficacy and safety results of the phase III treatment approaches
in renal cancer global evaluation trial. J Clin Oncol.
27:3312–3318. 2009. View Article : Google Scholar : PubMed/NCBI
|
|
45
|
Klatte T, Seligson DB, LaRochelle J, Shuch
B, Said JW, Riggs SB, Zomorodian N, Kabbinavar FF, Pantuck AJ and
Belldegrun AS: Molecular signatures of localized clear cell renal
cell carcinoma to predict disease-free survival after nephrectomy.
Cancer Epidemiol Biomarkers Prev. 18:894–900. 2009. View Article : Google Scholar : PubMed/NCBI
|
|
46
|
Beuselinck B, Jean-Baptiste J, Schöffski
P, Couchy G, Meiller C, Rolland F, Allory Y, Joniau S, Verkarre V,
Elaidi R, et al: Validation of VEGFR1 rs9582036 as predictive
biomarker in metastatic clear-cell renal cell carcinoma patients
treated with sunitinib. BJU Int. 118:890–901. 2016. View Article : Google Scholar : PubMed/NCBI
|
|
47
|
Kendall RL and Thomas KA: Inhibition of
vascular endothelial cell growth factor activity by an endogenously
encoded soluble receptor. Proc Natl Acad Sci USA. 90:10705–10709.
1993. View Article : Google Scholar : PubMed/NCBI
|
|
48
|
Miyake T, Kumasawa K, Sato N, Takiuchi T,
Nakamura H and Kimura T: Soluble VEGF receptor 1 (sFLT1) induces
non-apoptotic death in ovarian and colorectal cancer cells. Sci
Rep. 6:248532016. View Article : Google Scholar : PubMed/NCBI
|
|
49
|
Takano S, Ishikawa E, Matsuda M, Sakamoto
N, Akutsu H, Yamamoto T and Matsumura A: The anti-angiogenic role
of soluble-form VEGF receptor in malignant gliomas. Int J Oncol.
50:515–524. 2017. View Article : Google Scholar : PubMed/NCBI
|
|
50
|
Niu J, Wang Y, Wang J, Bin L and Hu X:
Delivery of sFIT-1 engineered MSCs in combination with a continuous
low-dose doxorubicin treatment prevents growth of liver cancer.
Aging (Albany NY). 8:3520–3534. 2016. View Article : Google Scholar : PubMed/NCBI
|
|
51
|
Vilsmaier T, Rack B, Janni W, Jeschke U
and Weissenbacher T; SUCCESS Study Group: Angiogenic cytokines and
their influence on circulating tumour cells in sera of patients
with the primary diagnosis of breast cancer before treatment. BMC
Cancer. 16:5472016. View Article : Google Scholar : PubMed/NCBI
|
|
52
|
Kwaan HC and McMahon B: The role of
plasminogen-plasmin system in cancer. Cancer Treat Res. 148:43–66.
2009. View Article : Google Scholar : PubMed/NCBI
|
|
53
|
McMahon BJ and Kwaan HC: Components of the
plasminogen-plasmin system as biologic markers for cancer. Adv Exp
Med Biol. 867:145–156. 2015. View Article : Google Scholar : PubMed/NCBI
|
|
54
|
Schrödter S, Braun M, Syring I, Klümper N,
Deng M, Schmidt D, Perner S, Müller SC and Ellinger J:
Identification of the dopamine transporter SLC6A3 as a biomarker
for patients with renal cell carcinoma. Mol Cancer. 15:102016.
View Article : Google Scholar : PubMed/NCBI
|
|
55
|
Zhao S, Dorn J, Napieralski R, Walch A,
Diersch S, Kotzsch M, Ahmed N, Hooper JD, Kiechle M, Schmitt M and
Magdolen V: Plasmin(ogen) serves as a favorable biomarker for
prediction of survival in advanced high-grade serous ovarian
cancer. Biol Chem. 398:765–773. 2017. View Article : Google Scholar : PubMed/NCBI
|
|
56
|
Mojiri A, Stoletov K, Carrillo MA,
Willetts L, Jain S, Godbout R, Jurasz P, Sergi CM, Eisenstat DD,
Lewis JD and Jahroudi N: Functional assessment of von Willebrand
factor expression by cancer cells of non-endothelial origin.
Oncotarget. 8:13015–13029. 2017. View Article : Google Scholar : PubMed/NCBI
|
|
57
|
Mochizuki S, Soejima K, Shimoda M, Abe H,
Sasaki A, Okano HJ, Okano H and Okada Y: Effect of ADAM28 on
carcinoma cell metastasis by cleavage of von Willebrand factor. J
Natl Cancer Inst. 104:906–922. 2012. View Article : Google Scholar : PubMed/NCBI
|
|
58
|
Braybrooke JP, O'Byrne KJ, Propper DJ,
Blann A, Saunders M, Dobbs N, Han C, Woodhull J, Mitchell K, Crew
J, et al: A phase II study of razoxane, an antiangiogenic
topoisomerase II inhibitor, in renal cell cancer with assessment of
potential surrogate markers of angiogenesis. Clin Cancer Res.
6:4697–4704. 2000.PubMed/NCBI
|