Introduction
Gastric cancer (GC) is one of the most common
malignancies globally (1). Despite a
general decline in morbidity, GC is still one of the leading causes
of cancer-associated mortality in males from less well-developed
countries (2,3). Surgery is the primary form of treatment
for this disease, and adjuvant chemotherapy has made significant
progress in recent years (4).
However, the prognosis of patients with GC who are diagnosed at
advanced stage remains poor (5).
Therefore, it is necessary to develop more effective therapeutic
strategies in order to decrease the mortality rate of GC.
Tumorigenesis and progression of GC are known to be multistep
processes involving the alteration of oncogenes and tumor
suppressor genes (6,7). GC-associated genes that regulate the
malignant phenotype are potential therapeutic targets for GC
treatment (8); therefore, it is
necessary to screen for genes that are specific and sensitive.
The RNA-binding protein musashi (MSI) family are
markers of stem cells and progenitor cells, which inhibit the
translation of certain mRNAs and maintain the stem-cell state, also
affecting cell differentiation and tumorigenesis (9,10). The
family contains two paralogues, MSI1 and MSI2. These genes are also
expressed in cancer cells and are associated with cell
differentiation and the regulation of epithelial-to-mesenchymal
transition (EMT) via inhibition of Jagged1 (11). MSI2 is predominantly expressed in
hematopoietic stem cells (HSCs), where it modulates engraftment and
the depletion of HSCs, and is overexpressed in myeloid leukemia,
where it regulates cell proliferation ad apoptosis and indicates a
poor prognosis (12). MSI2 has also
been demonstrated to be involved in certain solid carcinomas. For
example, MSI2 is upregulated in hepatocellular carcinoma (HCC)
(13) and colorectal adenocarcinomas
(14), and its upregulation promotes
cell growth and invasion, and is associated with a poor prognosis.
In a previous study, MSI2 was demonstrated to be downregulated in
grade II GC (15). Our group inferred
that a larger sample size may lead to a clearer conclusion
regarding the function of MSI2 in GC.
In the present study, our group investigated the
associations between MSI2 expression levels and clinicopathological
characteristics of patients with GC, and its biological functions.
Differences in MSI2 expression were examined in 67 pairs of GC
tissues and non-cancerous tissues. Reverse
transcription-quantitative polymerase chain reaction (RT-qPCR)
analysis revealed that MSI2 mRNA was overexpressed in the majority
of GC tissues, although no significance was observed. The
aforementioned results were confirmed by western blot analysis of 8
pairs of tissues. The associations with clinicopathological factors
were then examined, and the results revealed that the expression
level of MSI2 mRNA was positively associated with invasion depth,
tumor-node-metastasis (TNM) stage (16), degree of differentiation and tumor
size. The expression levels of MSI2 were then examined in the GC
cell line MKN-28, and gain-of-function assays were performed. The
results indicated that MSI2 promoted MKN-28 cell proliferation,
migration, invasion and neovascularization in vitro.
Materials and methods
Cell lines
Human umbilical vein endothelial cells (HUVECs) and
the gastric MKN-28 cell line was originally purchased from National
Infrastructure of Cell Line Resource of China (Beijing, China).
This cell line was determined to be derived from MKN-74 cells
(http://cellbank.nibiohn.go.jp/~cellbank/en/search_res_det.cgi?ID=340),
and the authors have checked for contamination as described
previously (17). Cells were cultured
in Hyclone™ RPMI-1640 medium (Hyclone; GE Healthcare
Life Sciences, Logan, UT, USA) with 10% Hyclone fetal bovine serum
(FBS; Hyclone; GE Healthcare Life Sciences) at 37°C with 5%
CO2.
Clinical samples and data
collection
Of the available sample from patients with GC, a
number had been used for previous study and the amount of tissue
remaining was insufficient for the present study A total of 67
patients with GC with sufficient tissue for mRNA and protein
extraction were selected for the present study treated at the
Department of Gastrointestinal Surgery, Shandong Provincial
Hospital Affiliated to Shandong University (Jinan, China) from
January 2012 to December 2012. None patients had undergone
treatments prior to surgery. GC tissue samples and adjacent
non-cancerous tissue samples 5 cm from tumor margin were obtained
from the aforementioned patients. And the tissues were stored at
−80°C. The present study was approved by the Research Ethics
Committee of Shandong Provincial Hospital Affiliated to Shandong
University and all patients provided written informed consent.
RT-qPCR
Total RNA was extracted from GC tissue samples and
adjacent non-cancerous tissue samples using RNAiso Plus reagent
(cat. no. 9108/9109; Takara Bio, Inc., Otsu, Japan) according to
the manufacturer's protocol. The RNA was reverse transcribed in a
20 µl reaction volume using the PrimeScript™ RT reagent
kit (cat. no. RR047A; Takara Bio, Inc.) according to the
manufacturer's protocol, with 2.0 µl 5X gDNA Eraser Buffer, 1.0 µl
gDNA Eraser, 1.0 µg total RNA and an equal amount of RNase Free
dH2O, incubated at room temperature for 5 min, and 4.0
µl 5X PrimeScript Buffer 2, 1.0 µl PrimeScript RT Enzyme Mix I, 1.0
µl RT Primer Mix*4, 4.0 µl RNase Free dH2O and 10.0 µl
RNA template incubated at 37°C for 15 min followed by 85°C for 5
sec and 4°C for 30 min. qPCR analyses were performed with SYBR
Premix Ex Taq™ II (Takara Bio, Inc.) using GAPDH as a
reference gene. The PCR conditions were as following: denatured at
95°C for 30 sec, followed by amplification at 95°C for 5 sec and
60°C for 30 sec for 40 cycles. RT-qPCR of MSI2 mRNA expression was
performed using the LightCycler 480 Real-Time PCR system (Roche
Diagnostics, Basel, Switzerland), with each sample triplicated.
∆∆Cq was used to quantify the expression levels of MSI2 mRNA
(18). The primer sequences used were
as follows: MSI2 forward, 5′-GCAACGGCCTTTACAAATGGATAC-3′ and
reverse, 5′-CAGGTCTGAGGACATCACCTAAACA-3′; GAPDH forward,
5′-GCACCGTCAAGGCTGAGAAC-3′ and reverse,
5′-TGGTGAAGACGCCAGTGGA-3′.
Western blotting
Total protein from GC and adjacent non-cancerous
tissue samples was extracted with RIPA Lysis Buffer (Beyotime
Institute of Biotechnology, Shanghai, China) for 30 min at 4°C,
with supernatant collected following 12,000 × g centrifugation. The
extracted protein was quantified with a Bicinchoninic Acid Protein
Assay kit (Beyotime Institute of Biotechnology). Protein samples
(~40 µg) were added to each lane, separated using 10% SDS-PAGE, and
transferred to polyvinylidene fluoride (PVDF) membranes (GE
Healthcare, Chicago, IL, USA). The PVDF membranes were blocked with
5% skimmed milk powder for 1 h at room temperature and washed three
times with tris-buffered saline with Tween-20 (TBST), incubated
with specific monoclonal primary antibodies against MSI2 (cat. no.
ab76148; 1:1,000; Abcam, Cambridge, UK) at 4°C overnight, and then
incubated with peroxidase-conjugated affinipure goat anti-rabbit
immunoglobulin G antibodies (cat. no. ZB-2301; 1:5,000; OriGene
Technologies, Inc., Beijing, China) for 1 h at room temperature and
washed with TBST three times. Protein levels were normalized to
total β-actin with mouse monoclonal antibody (cat. no. ab8226;
1:1,000; Abcam). The protein expression level was detected by
ImageQuant LAS 4000 mini Biomolecular Imager (GE Healthcare Life
Sciences) with Immobilon™ Western Chemiluminescent HRP
Substrate (EMD Millipore, Billerica, MA, USA). Image J (Version 2;
National Institutes of Health, Bethesda, MD, USA) was used for the
quantification of grey level of bands.
Transfection of MSI2 into MKN-28
cells
The MSI2 overexpression vector pEGFP-N1-MSI2 was
constructed by Shanghai Harmonious One Biotechnology Co., Ltd.
(Shanghai, China). A total of 4×10⁵ cells were seeded in
6-well cell culture plates ~24 h prior to transfection. For
transfection, 10 µl Lipofectamine 2000 Reagent (Thermo Fisher
Scientific, Inc.) and 4 µg plasmid vectors were prepared and mixed
with Opti-MEM medium (Thermo Fisher Scientific, Inc.) according to
the manufacturer's protocol, and added to 6-well culture plates
with a total of 2 ml medium. Cells transfected with pEGFP-N1
(Shanghai Qihe Biotechnology Co., Ltd., Shanghai, China) were used
as the control. Following 6 h transfection, the medium was replaced
and the fluorescence activity of green fluorescent protein was used
to measure transfection efficiency 24 h after transfection, and the
nuclei were stained with DAPI. The images were captured using an
inverted fluorescence microscope (Nikon Ti-S; Nikon Corporation,
Tokyo, Japan). MSI2 protein expression levels were measured by
western blotting, as aforementioned.
Cell proliferation assays
Colony formation assays were performed to evaluate
cell proliferation. Cells transfected with the aforementioned
vectors were trypsinized into single cell suspensions, and
1×10³ cells were seeded in 35 cm2 culture
plates with 2 ml RPMI-1640 medium with 10% FBS. The cells were
stained with hematoxylin for 10 min at 37°C following culture at
37°C with 5% CO2 for 2 weeks.
A Cell Counting Kit-8 (CCK-8) assay was also
performed to assess GC cell proliferation. A total of
2.5×10³ MKN-28 cells, transfected as aforementioned,
were seeded in 96-well plates and cultured with 100 µl RPMI-1640
medium with 10% FBS at 37°C with 5% CO2. After 24, 48
and 72 h culture, 10 µl CCK-8 (Dojindo Molecular Technologies,
Inc., Kumamoto, Japan) was added to each plate and cultured at 37°C
with 5% CO2 for 1 h. The optical density (OD) at 450 nm
was measured to assess cell proliferation, and each group was
replicated five times in total.
Invasion and migration assays
Transwell assays were performed to measure the
invasion and migration MKN-28 cell, transfected as aforementioned.
For the invasion assay, 50 µl diluted Matrigel (BD Biosciences, San
Jose, CA, USA) was added in the upper chamber of Transwell plates
(24-well plate inserts, 8 µm pore size; Corning Incorporated,
Corning, NY, USA). Then, 6×10⁵ cells were seeded in 200
µl RPMI-1640 medium with 0.5% bovine serum albumin (Sigma-Aldrich;
Merck KGaA, Darmstadt, Germany), and 500 µl RPMI-1640 medium with
10% FBS was added to each lower chamber. For the migration assays,
no Matrigel was added to the upper chamber and 8×10⁴
cells were seeded. All of the 24-well culture plates used for the
invasion and migration assays were incubated at 37°C with 5%
CO2 for 24 h. Finally, after wiping off the non-migrated
or non-invaded cells in the upper chamber with a cotton swab, the
membranes were separated and stained with hematoxylin. The cells
that had penetrated to the lower chamber were counted and
photographed using a light microscope (Leica DM4000B; Leica
Microsystems GmbH, Wetzlar Germany), and mean level of three fields
was used for evaluation.
Wound healing assays were also performed to confirm
the migratory function of transfected MKN-28 cells. GC cells were
seeded into 6-well plates with 2 ml RPMI-1640 medium with 10% FBS
and permitted to grow to 90% confluence. Then, a wound field was
made using a sterile 200 µl pipette tip. Separated cells were
detached with 2 ml RPMI-1640 medium without FBS. The cells were
then incubated at 37°C with 5% CO2. Pictures were
captured using a digital camera system at 2 time points (0 and 48
h) and migration distance was used to evaluate migration
activity.
Tube formation assay in HUVECs
GC cells, transfected as aforementioned, were plated
in 6-well culture plates with 2 ml RPMI-1640 medium with 10% FBS.
When cells reached ~90% confluence, they were washed twice with PBS
buffer and the medium was changed to 2 ml RPMI-1640 medium with 10%
FBS. After 24 h culture in an incubator at 37°C with 5%
CO2, the conditional media were collected. A total of
100 µl growth-factor reduced Matrigel (BD Biosciences) was used to
coat a 96-well plate, and HUVECs (5×10³) were seeded and
cultured at 37°C with 5% CO2. HUVECs cultured in the
conditional media were observed using a light microscope (Leica
Microsystems GmbH) after 6–8 h culture. Numbers of tubes were used
to evaluate the tube formation ability. And tubes in three fields
were counted.
Statistical analysis
Statistical analysis was performed using SPSS 18.0
software (SPSS, Inc., Chicago, IL, USA). The OD values are
expressed as the mean ± standard deviation of at least three
separate experiments, and the OD450 values are expressed
as the mean ± standard deviation of at least five separate
experiments. The χ2 test was used to calculate the
associations between clinicopathological characteristics, and the
independent samples Student's t test was used to analyze the
differences between MSI2 overexpression groups and vector groups.
Overall survival was assessed using the Kaplan-Meier method with
log rank test. P<0.05 was considered to indicate a statistically
significant difference.
Results
MSI2 is upregulated in GC tissues and
is associated with clinicopathological features of patients with
GC
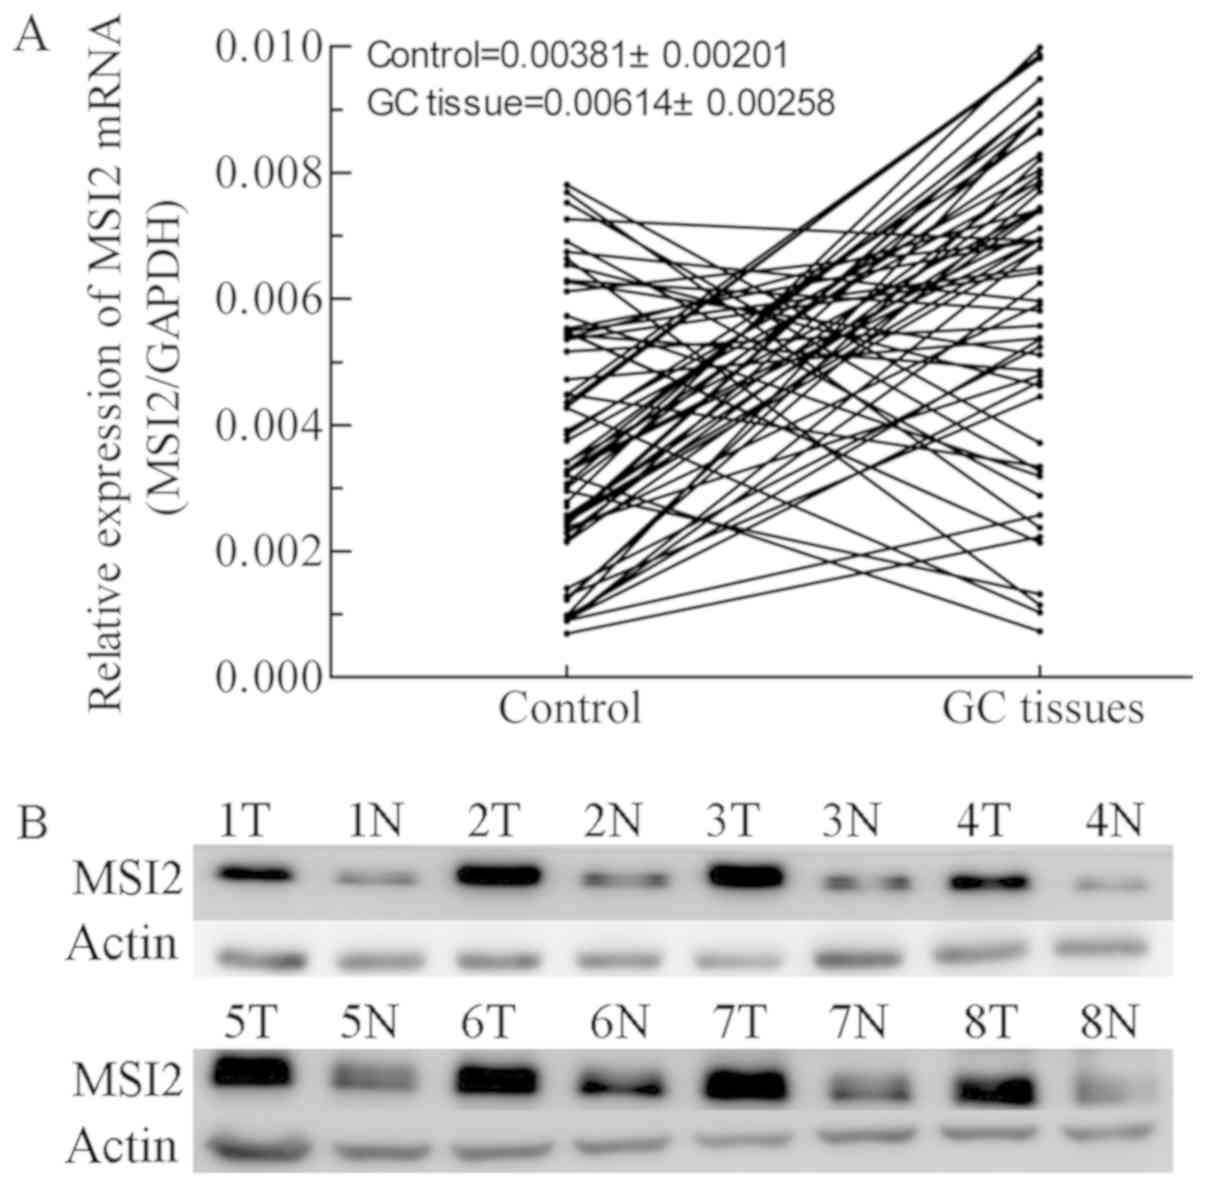
Although a previous investigation of 30 pairs of GC
tissues and paired normal tissues revealed that MSI2 mRNA
expression levels were not significantly different (15), analysis of a larger number of samples
in the present study revealed that MSI2 mRNA expression levels were
increased in the majority of GC tissues compared with adjacent
normal controls, although there was no significant difference
(Fig. 1A). MSI2 protein expression
was also upregulated in 8 pairs of tissues (Fig. 1B). Next, two folds of MSI2 mRNA
expression, compared with adjacent non-cancerous tissues was set as
the cut-off value, and the associations between MSI2 mRNAs levels
and clinicopathological features of patients with GC were
investigated in 67 pairs of tissues. The results revealed that MSI2
mRNA overexpression was associated with invasion depth, TNM stage,
degree of differentiation and tumor sizes (P<0.05; Table I). However, no associations were
observed between MSI2 mRNA expression levels and other
clinicopathological characteristics including sex, age, tumor
location and human epidermal growth factor receptor 2
expression.
 | Table I.Associations between MSI2 mRNA
expression and clinicopathological features of patients with
gastric cancer. |
Table I.
Associations between MSI2 mRNA
expression and clinicopathological features of patients with
gastric cancer.
| Clinicopathological
feature | n | MSI2 overexpression
≥2-fold, n (%) | P-value |
|---|
| Sex |
|
| 0.565 |
| Male | 51 | 31 (60.8) |
|
|
Female | 16 | 11 (68.8) |
|
| Age, years |
|
| 0.094 |
|
<60 | 33 | 24 (72.7) |
|
| ≥60 | 34 | 18 (52.9) |
|
| Location |
|
| 0.726 |
|
Proximal | 25 | 15 (60.0) |
|
|
Distant | 42 | 27 (64.3) |
|
| Invasion depth |
|
| 0.017 |
|
T1+T2 | 16 | 6
(37.5) |
|
|
T3+T4 | 51 | 36 (70.6) |
|
| Metastasis |
|
| 0.270 |
| No | 14 | 7
(50.0) |
|
|
Yes | 53 | 35 (66.0) |
|
| TNM stage |
|
| 0.028 |
| Stage I
and II | 19 | 8
(42.1) |
|
| Stage
III and IV | 48 | 34 (70.8) |
|
|
Differentiation |
|
| 0.020 |
|
Well-differentiated | 28 | 14 (50.0) |
|
| Poorly
differentiated | 39 | 26 (66.7) |
|
| Tumor size,
cm2 |
|
| 0.029 |
| Cutting
area ≤6 | 34 | 17 (50.0) |
|
| Cutting
area >6 | 33 | 25 (75.8) |
|
Upregulation of MSI2 is associated
with poor prognosis in GC
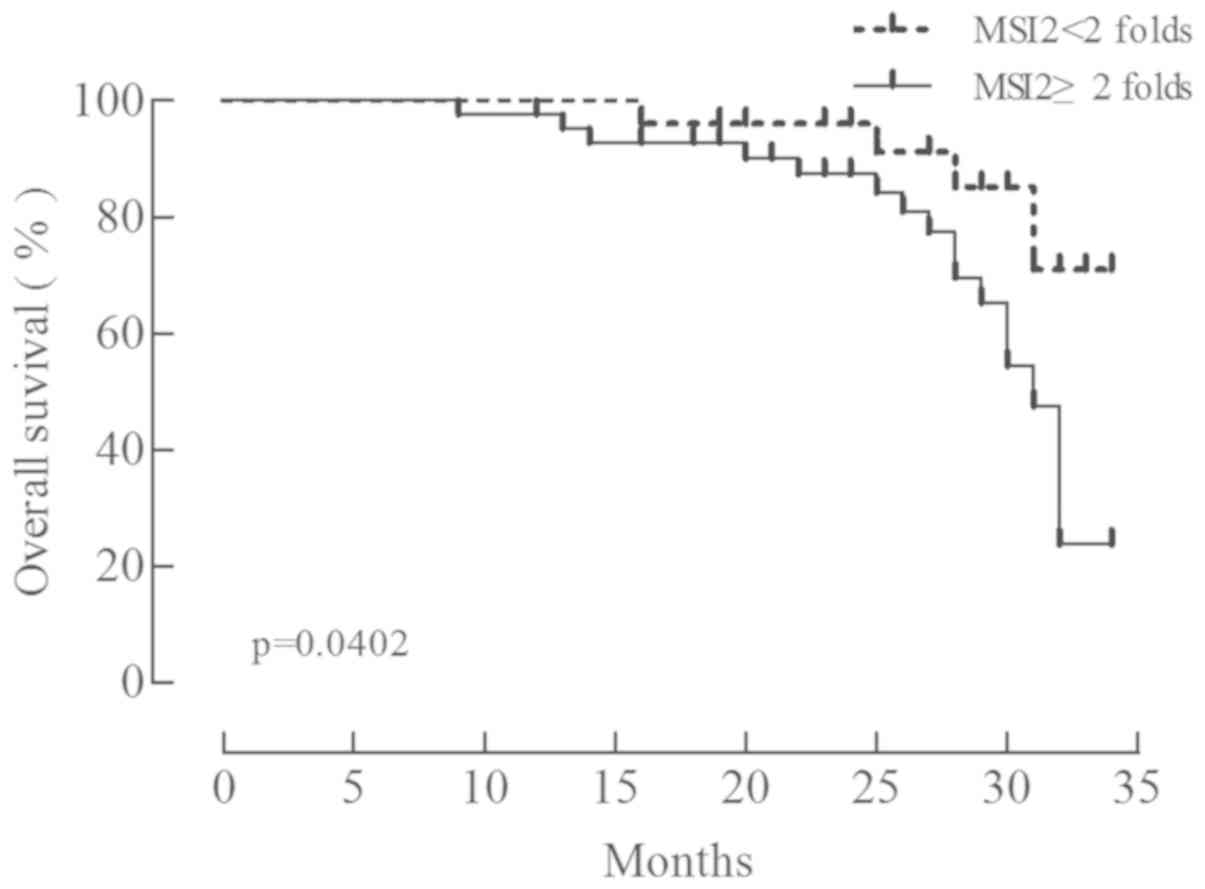
The overall survival of patients with GC following
surgery was analyzed using the Kaplan-Meier method. The patients
were classified into two groups according to the relative
expression of MSI2 (MSI2 mRNA/GAPDH mRNA): A low expression group
with 25 patients (group 1; cancer/normal <2) and a high
expression group with 42 patients (group 2; cancer/normal ≥2). The
overall survival rate was significantly lower in group 1 (Fig. 2; χ2=4.221, P=0.040),
indicating that MSI2 expression is associated with a poor prognosis
in GC.
MSI2 promotes GC cell proliferation,
migration and invasion
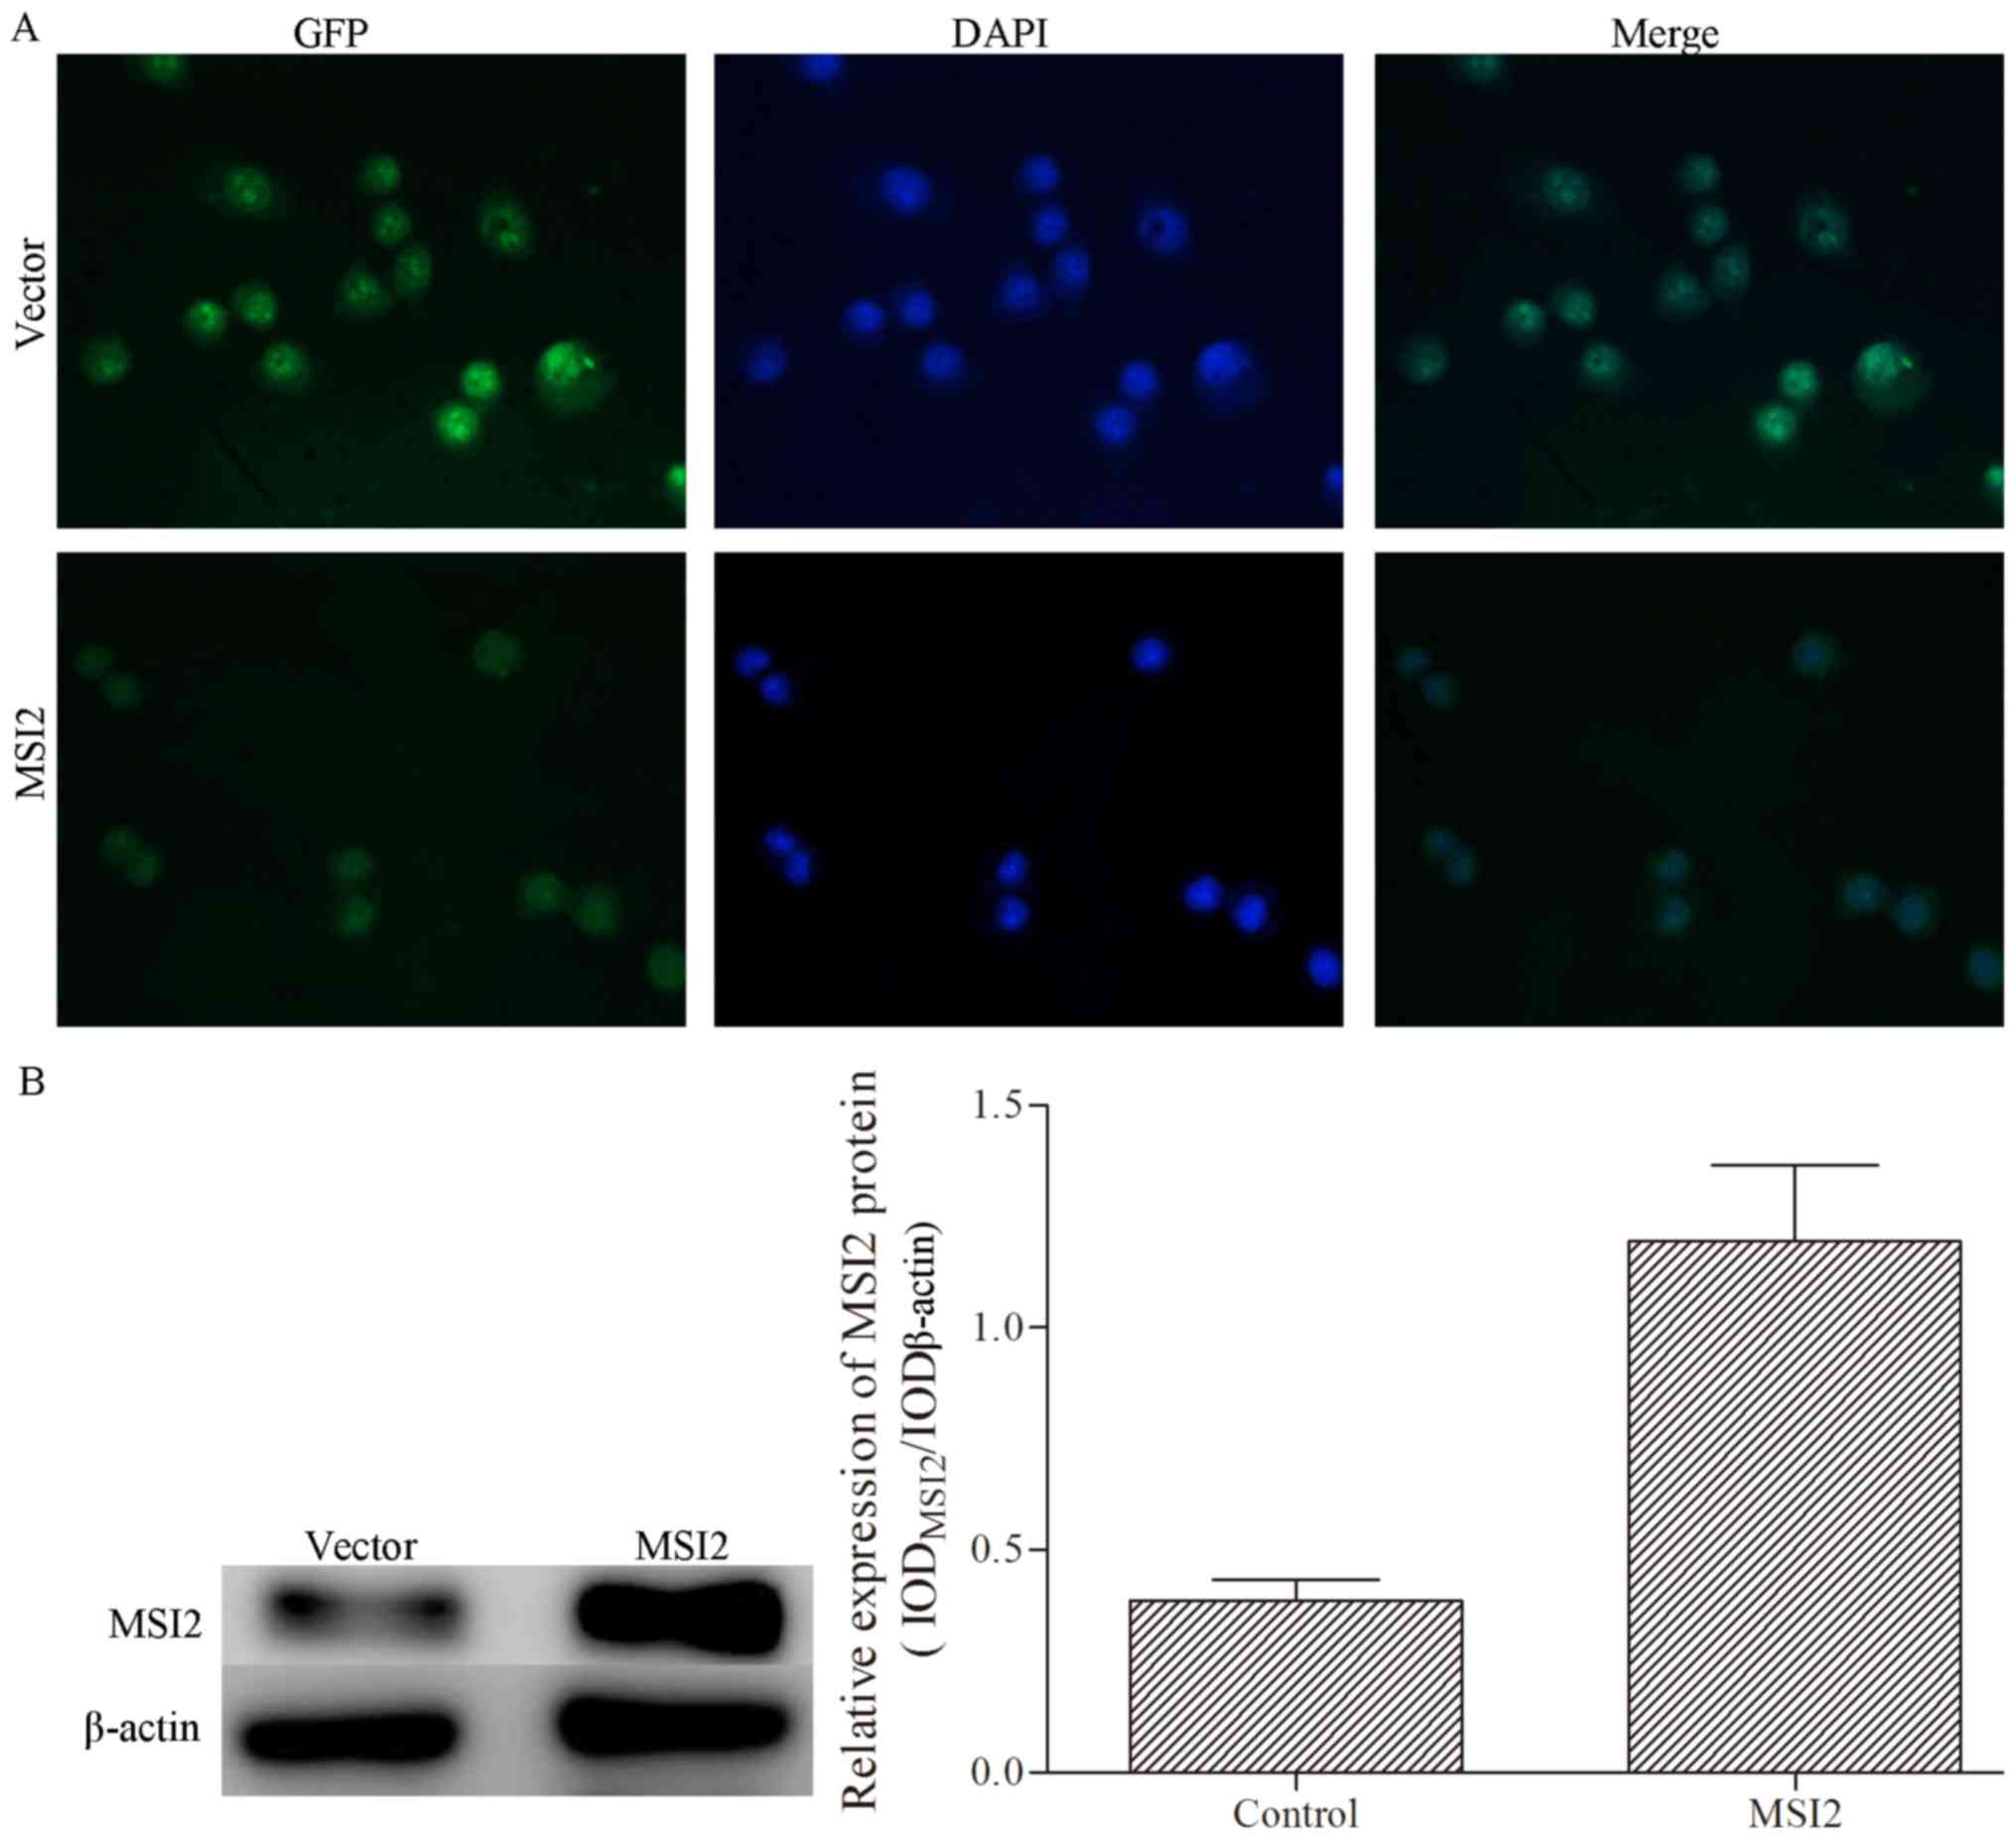
MKN-28 cells were transfected with pEGFP-N1 with a
reporter gene encoding green fluorescence protein, and the
transfection efficiency was verified by inverted fluorescence
microscopy and western blotting (Fig.
3). MSI2 expression was successfully induced in MKN-28 cells by
pEGFP-N1-MSI2, and an empty vector was used as the negative
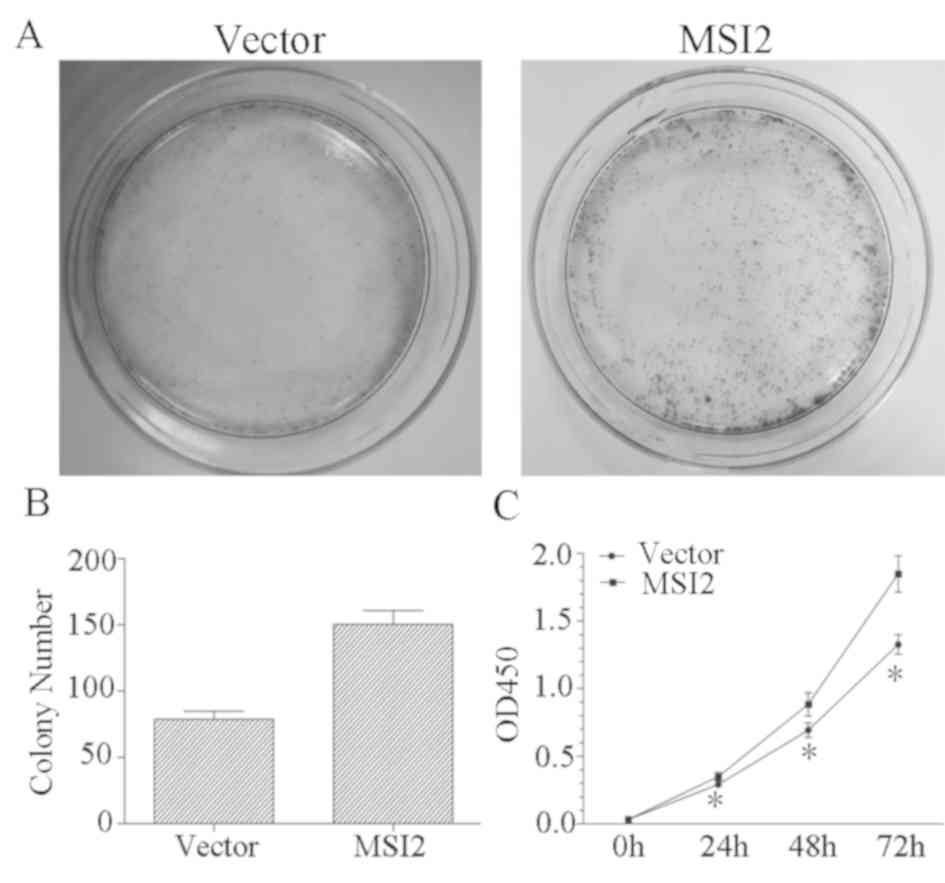
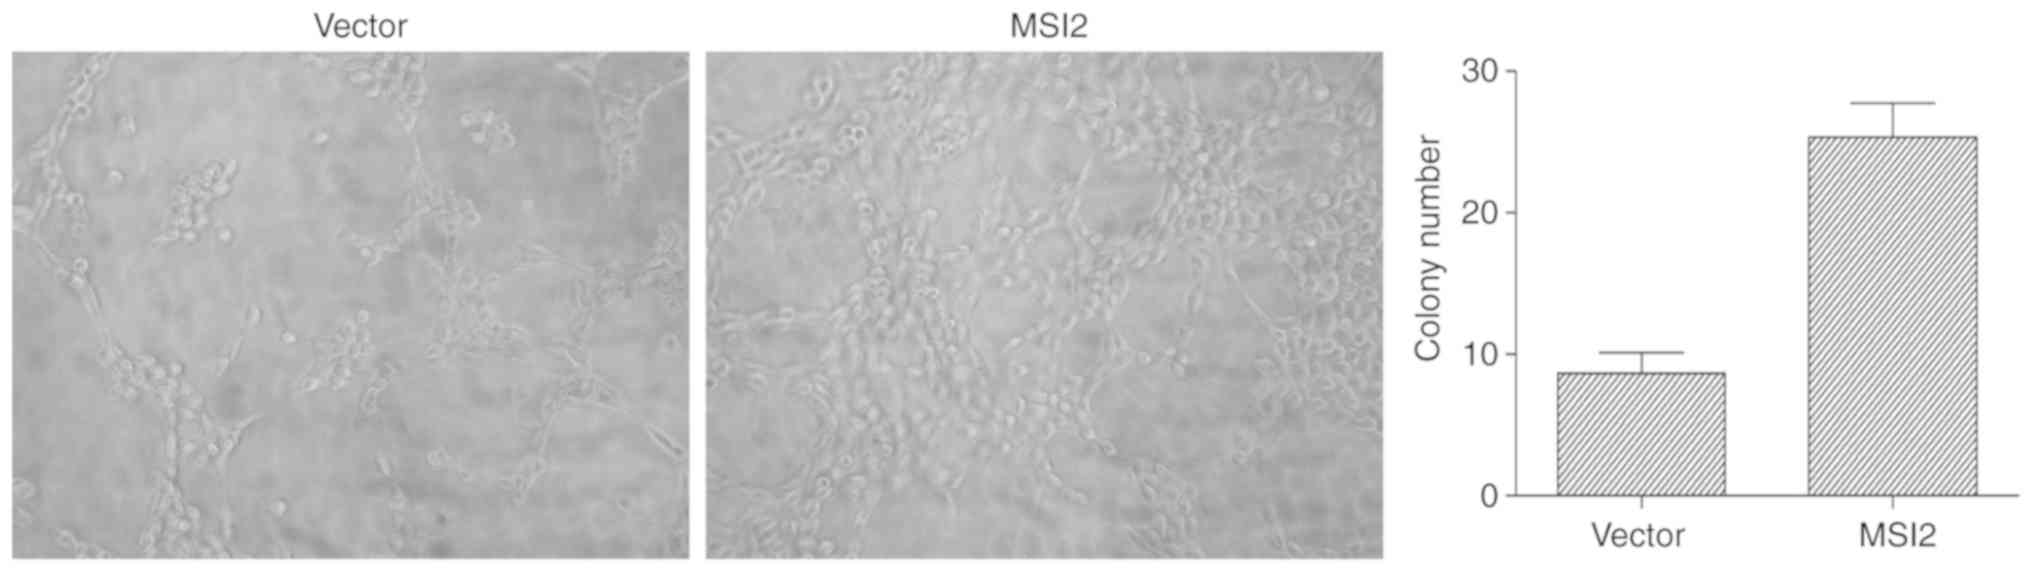
control. The results of the colony formation assay revealed that
colony numbers were significantly increased in the MSI2 group
compared with the control group (Fig. 4A
and B), and the results of the CCK-8 assay revealed that MKN-28
cells overexpressing MSI2 proliferate faster than MKN-28 cells
transfected with the empty vector (Fig.
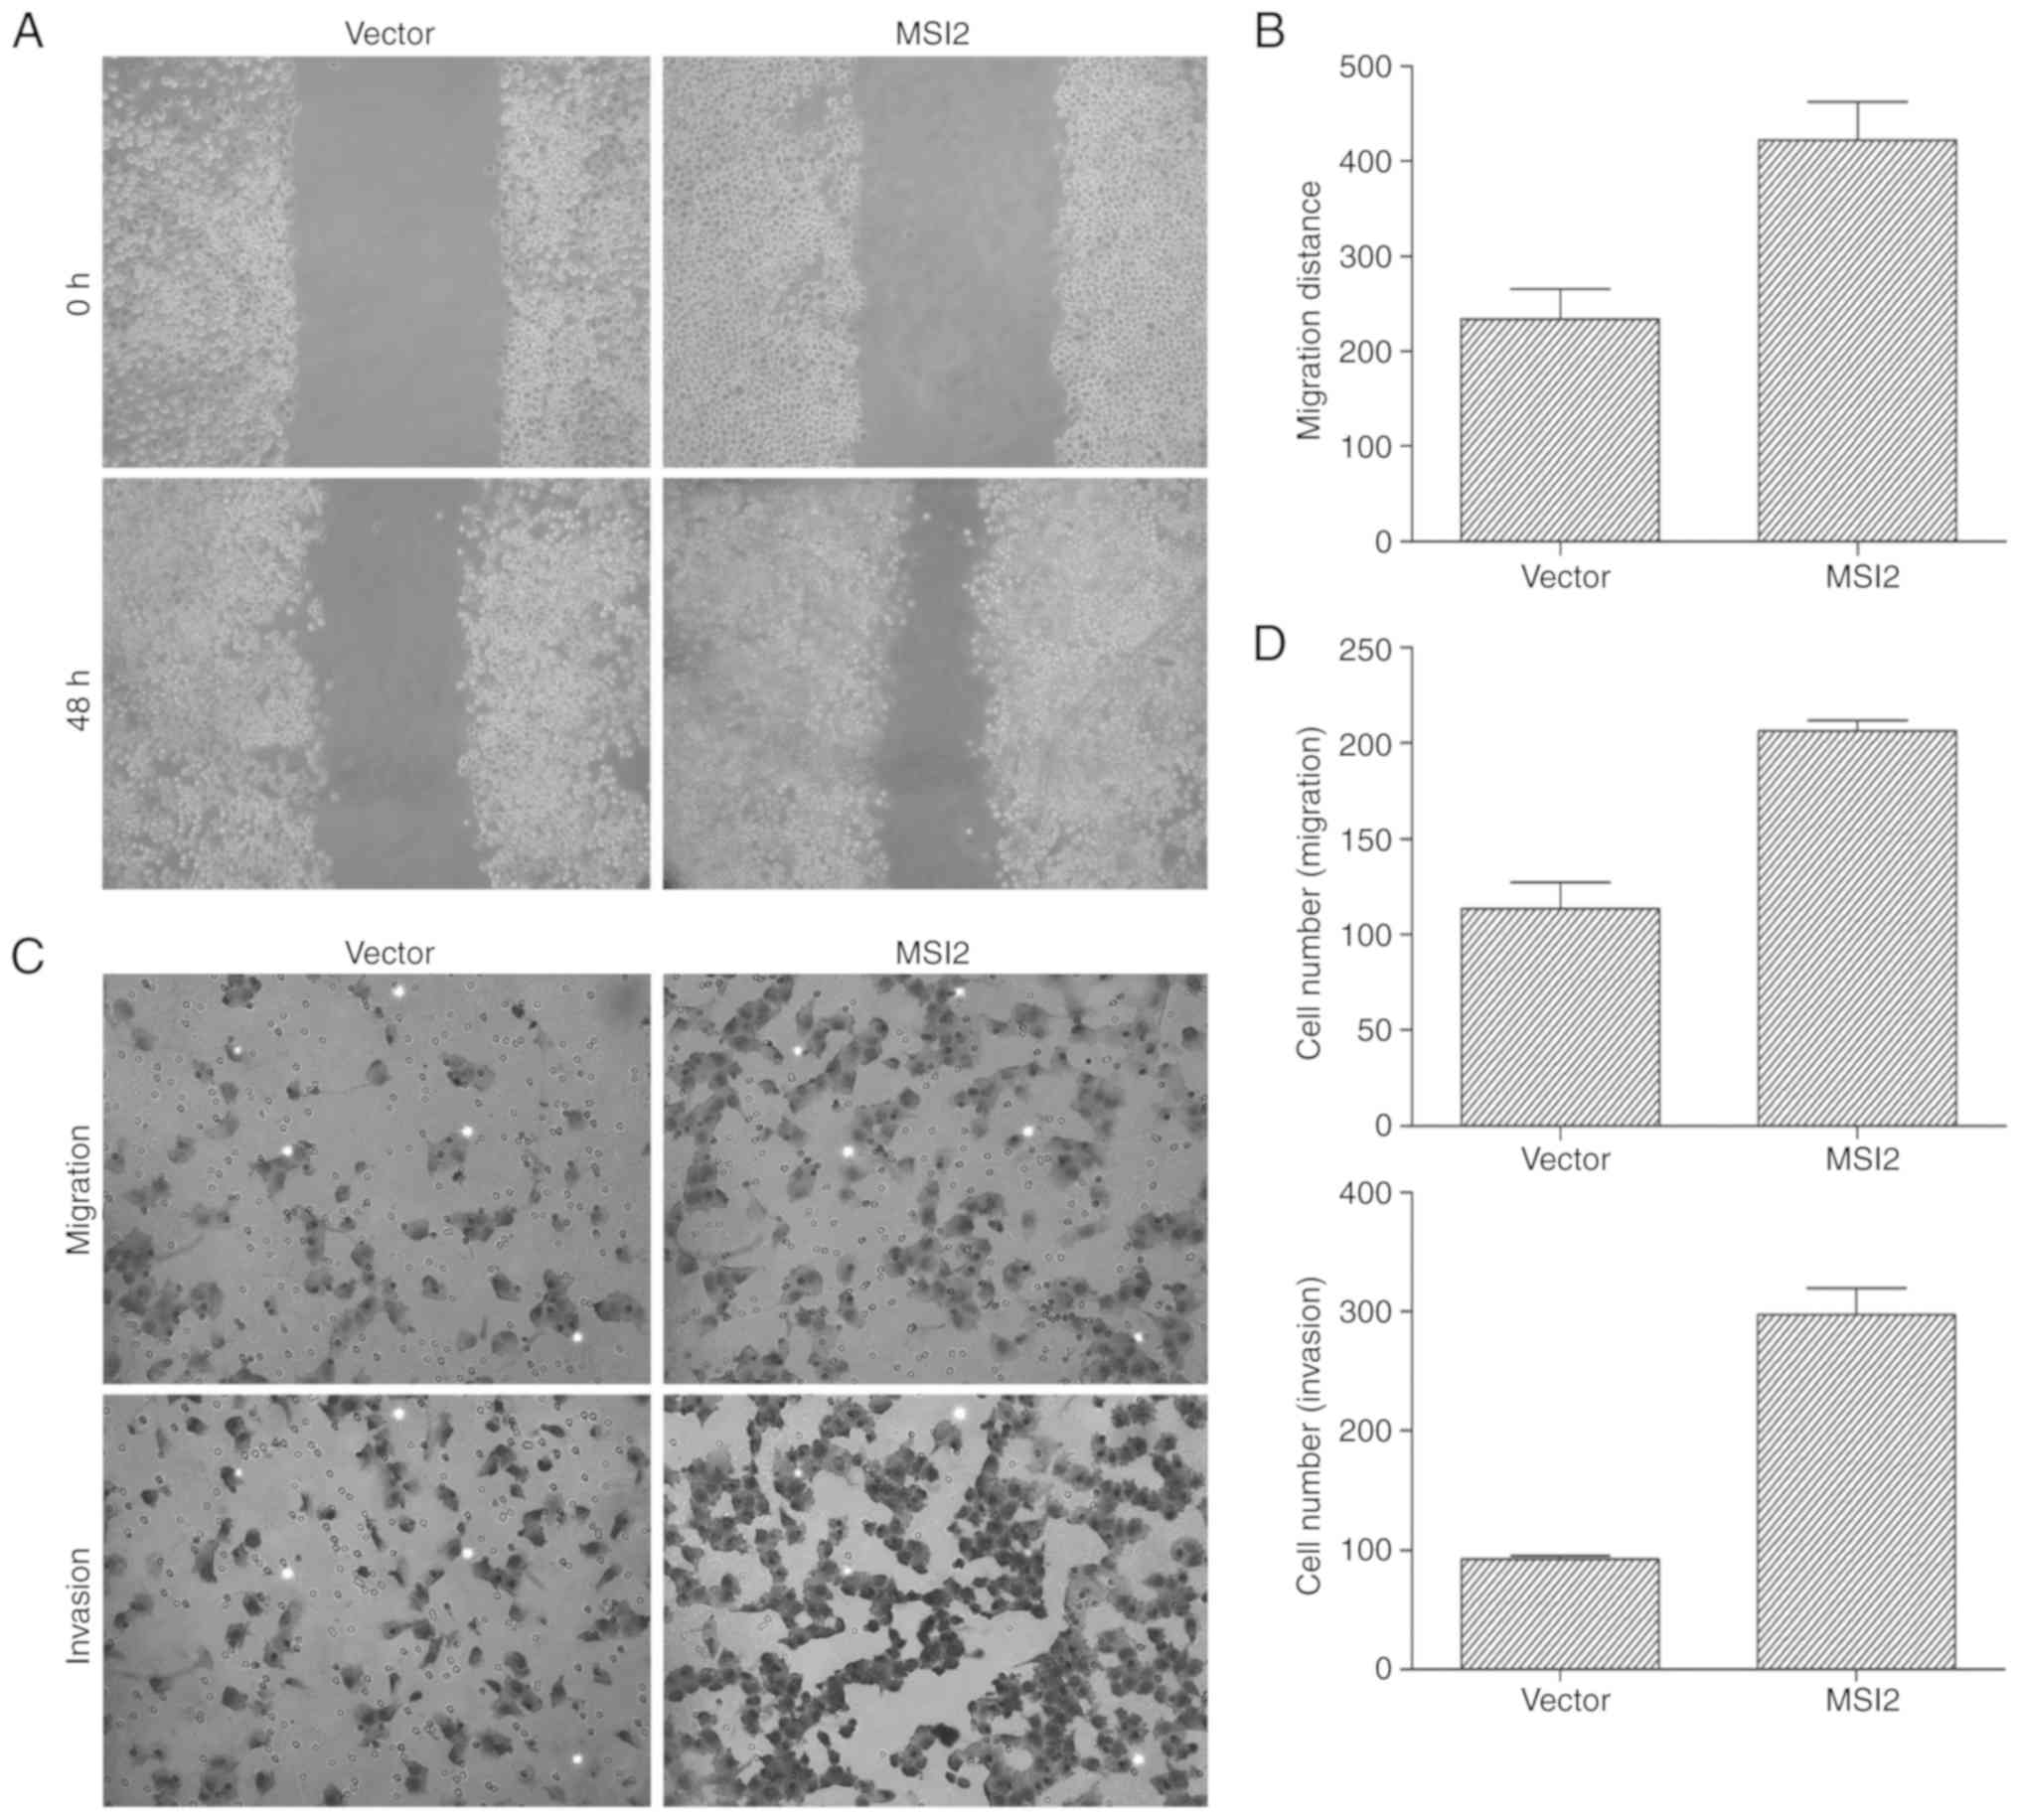
4C). To assess the effects of MSI2 on GC cell migration and
invasion, Transwell assays and wound healing assays were performed
in MKN-28 cells following transfection with MSI2 expression vectors
and the corresponding empty vector control. The results of the
wound healing assay demonstrated that cells in the
MSI2-overexpression group migrated further than those in the empty
vector control group (Fig. 5A and B),
and the Transwell assay results for invasion and migration revealed
that the number of cells in the lower chambers were significantly
increased in the MSI2-overexpression group compared with the
control group (Fig. 5C and D). Taken
together, these results indicated that MSI2 promotes GC cell
proliferation, migration and invasion.
MSI2 promotes tube formation in
vivo
To assess the effects of MSI2 on tube formation in
HUVECs, a Matrigel tube formation test was performed. The results
revealed that the tubular formation activity of MSI2-overexpression
MKN-28 cells was significantly increased compared with the empty
vector control (Fig. 6). These
results indicated that MSI2 promotes tubular formation in HUVECs
in vitro.
Discussion
GC remains a substantial threat to human health
(2,3).
Although the overall survival of patients with GC has increased
(19), outcomes in China remain worse
than that in the USA at present (20). Although developments in endoscopic
screening and biopsies have improved screening strategies for early
stage GC, and laparoscopic resection has increased the ratio of
early stage patients that receive treatment (21), endoscopic screening is impractical in
general clinical practice due to its invasive nature. Furthermore,
the biological mechanisms underlying GC still remain to be
comprehensively elucidated, although GC tumorigenesis and
development are known to be long, multistep processes involving
various genetic alterations, including oncogenic activation and the
inactivation of tumor suppressor pathways (22). However, since the biological
mechanisms GC remain unclear, prolonging the overall survival of
patients with GC by improving treatment strategies will be
difficult. Therefore, the discovery of novel biomarkers, regulatory
molecules and therapeutic targets for GC will help to improve the
prognosis of GC and overall public health.
MSI2 is a member of the MSI family, which is
involved in the maintenance of stem cells and the regulation of
cell differentiation (9,10). MSI2 is involved in the development of
the central nervous system, and binds to the poly A-binding protein
to regulate gene expression at the post-transcriptional level
(23). Previously, MSI2 was indicated
to be involved in GC; however, no alteration of MSI2 expression
levels were observed and decreased expression levels in grade II GC
were observed (15). However, the use
of MSI2 as a biomarker for GC and its involvement in the regulation
of GC remain to be fully elucidated.
MSI2 has been demonstrated to be involved in
malignancies of the circulatory system and to promote a malignant
phenotype (12,24,25), and
has also been indicated to be dysregulated in several types of
solid cancer, and to promote the malignant activity of these cancer
cells. MSI2 has been demonstrated to be associated with tumor size,
tumor differentiation, the number of tumor nodules, Barcelona
clinic liver cancer stage, vascular invasion, recurrence and poor
prognosis in HCC (13,26). In the present study, the expression
levels of MSI2 mRNA and protein in GC tissues and adjacent
non-cancerous tissues were assessed using by RT-qPCR and western
blotting, respectively. The results suggested that MSI2 was
upregulated in the majority of GC tissues compared with adjacent
non-cancerous tissues, although there was no significant
difference. To classify the clinical value of MSI2, the
associations between MSI2 and the clinicopathological features of
patients with GC were than analyzed. The results revealed that MSI2
expression levels were associated with malignant GC phenotypes,
including invasion depth, TNM stage, degree of differentiation and
tumor size. Furthermore, overexpression of MSI2 resulted in a
poorer prognosis in patients with GC. Taken together, the
aforementioned results indicate that MSI2 is a potential valuable
biomarker for the diagnosis of GC and for determining GC prognosis,
as it has oncogenic functions.
The differences between cancer cells and normal
cells include sustained proliferation, the evasion of growth
suppression, resistance to cell death, replicative immortality,
angiogenesis, invasion and metastasis (27). MSI2 has been demonstrated to promote
HCC invasion and progression by activating EMT or via the
Wnt/β-catenin signaling pathway (13,26). To
investigate the biological functions of MSI2 in GC cells, MSI2
expression was induced by transfection of an expression vector into
the GC cell line MKN-28, and gain-of-function assays were performed
in vitro. CCK-8 and colony formation assays were performed
to elucidate the function of MSI2 in GC cell proliferation. The
results revealed that MSI2 overexpression resulted in increased
proliferation in the MKN-28 cell line and an increased number of
colonies, indicating that MSI2 promoted MKN-28 cell proliferation.
Wound healing assays and Transwell migration and invasion assays
were performed to investigate the involvement of MSI2 in GC cell
migration and invasion. An increased number of cells recorded in
the lower chambers and a decreased width of the scratch compared
with the control group indicated that MSI2 promoted GC cell
migration and invasion. The aforementioned results indicated MSI2
may serve oncogenic functions in GC by directly invading the
extracellular matrix, which is the natural protective barrier, and
migrating to adjacent organs. To explore whether MSI2 promoted GC
metastasis in other ways, tubular formation assays were performed
in HUVECs. The results revealed that more tubes were formed in the
MSI2 overexpression group compared with the control group. This
indicated that MSI2 promoted vessel formation activity in HUVECs,
suggesting that MSI2 promotes angiogenesis. Taken together, these
results indicate that MSI2 acts as an oncogene and is involved in
the promotion of GC carcinogenesis and progression.
In conclusion, MSI2 mRNA and protein expression
levels were increased in GC tissues, so it may be a potential
biomarker for GC diagnosis following verification from a larger
sample. Furthermore, MSI2 expression is associated with various
malignant phenotypes, including invasion depth, TNM stage, degree
of differentiation and tumor size, and is a risk factor for
determining the prognosis of GC. The in vitro assays
demonstrated that MSI2 promotes GC cell proliferation, migration,
invasion and angiogenesis. These results indicated that MSI2 may
act as an oncogene in GC by increasing proliferation and promoting
metastasis via inducing migration, invasion and angiogenesis.
However, the underlying mechanisms and signaling pathways remain
unclear, and further investigations with a large scale of samples
and GC cell lines are required to assess the potential clinical
applications of MSI2.
Acknowledgements
Not applicable.
Funding
The present study was supported by grants from the
National Natural Science Foundation of China (grant nos. 81672379
and 81572355), the Natural Science Foundation of Shandong Province
(grant nos. ZR2015HM078 and ZR2016HM16) and the Taishan Young
Scholars Foundation of Shandong Province (grant no. TSQN20161072).
The processes of study design, data collection, analysis and
interpretation and manuscript writing had no funding body
participation.
Availability of data and materials
The datasets used and/or analyzed during the current
study are available from the corresponding author on reasonable
request.
Authors' contributions
XG designed the experiment, provided financial
support, revised the manuscript and gave final approval of the
version to be published. XG was responsible for the interpretation
of data. ZY and JL performed the experiments, acquired the data and
wrote the paper. YS and LL made substantive contibutions to the
work, including data collecting and manuscript revising..
Ethics approval and consent to
participate
The present study was approved by the Research
Ethics Committee of Shandong Provincial Hospital Affiliated to
Shandong University (approval no. 2012-101) and all patients
provided written informed consent to participate.
Patient consent for publication
The patients' data was anonimised, and hospital
numbers and associated data may be provided only for scientific
purposes. All patients provided written informed consent that their
data may be published.
Competing interests
The authors declare that they have no competing
interests.
References
|
1
|
Ferlay J, Soerjomataram I, Dikshit R, Eser
S, Mathers C, Rebelo M, Parkin DM, Forman D and Bray F: Cancer
incidence and mortality worldwide: Sources, methods and major
patterns in GLOBOCAN 2012. Int J Cancer. 136:E359–E386. 2015.
View Article : Google Scholar : PubMed/NCBI
|
|
2
|
Bertuccio P, Chatenoud L, Levi F, Praud D,
Ferlay J, Negri E, Malvezzi M and La Vecchia C: Recent patterns in
gastric cancer: A global overview. Int J Cancer. 125:666–673. 2009.
View Article : Google Scholar : PubMed/NCBI
|
|
3
|
Torre LA, Bray F, Siegel RL, Ferlay J,
Lortet-Tieulent J and Jemal A: Global cancer statistics, 2012. CA
Cancer J Clin. 65:87–108. 2015. View Article : Google Scholar : PubMed/NCBI
|
|
4
|
Lordick F and Terashima M: Gastric cancer
adjuvant therapy. Best Pract Res Clin Gastroenterol. 30:581–591.
2016. View Article : Google Scholar : PubMed/NCBI
|
|
5
|
Catalano V, Labianca R, Beretta GD, Gatta
G, de Braud F and Van Cutsem E: Gastric cancer. Crit Rev Oncol
Hematol. 54:209–241. 2009. View Article : Google Scholar
|
|
6
|
Sugimura T, Terada M, Yokota J, Hirohashi
S and Wakabayashi K: Multiple genetic alterations in human
carcinogenesis. Environ Health Perspect. 98:5–12. 1992. View Article : Google Scholar : PubMed/NCBI
|
|
7
|
Guo X, Liu W, Pan Y, Ni P, Ji J, Guo L,
Zhang J, Wu J, Jiang J, Chen X, et al: Homeobox gene IRX1 is a
tumor suppressor gene in gastric carcinoma. Oncogene. 29:3908–3920.
2010. View Article : Google Scholar : PubMed/NCBI
|
|
8
|
Wang Z, Tang F, Qi G, Yuan S, Zhang G,
Tang B and He S: KDM5B is overexpressed in gastric cancer and is
required for gastric cancer cell proliferation and metastasis. Am J
Cancer Res. 5:87–100. 2014.PubMed/NCBI
|
|
9
|
Okano H, Imai T and Okabe M: Musashi: A
translational regulator of cell fate. J Cell Sci. 115:1355–1359.
2002.PubMed/NCBI
|
|
10
|
Siddall NA, McLaughlin EA, Marriner NL and
Hime GR: The RNA-binding protein Musashi is required intrinsically
to maintain stem cell identity. Proc Natl Acad Sci USA.
103:8402–8407. 2006. View Article : Google Scholar : PubMed/NCBI
|
|
11
|
Katz Y, Li F, Lambert NJ, Sokol ES, Tam
WL, Cheng AW, Airoldi EM, Lengner CJ, Gupta PB, Yu Z, et al:
Musashi proteins are post-transcriptional regulators of the
epithelial-luminal cell state. Elife. 3:e039152014. View Article : Google Scholar : PubMed/NCBI
|
|
12
|
Kharas MG, Lengner CJ, Al-Shahrour F,
Bullinger L, Ball B, Zaidi S, Morgan K, Tam W, Paktinat M, Okabe R,
et al: Musashi-2 regulates normal hematopoiesis and promotes
aggressive myeloid leukemia. Nat Med. 16:903–908. 2010. View Article : Google Scholar : PubMed/NCBI
|
|
13
|
He L, Zhou X, Qu C, Hu L, Tang Y, Zhang Q,
Liang M and Hong J: Musashi2 predicts poor prognosis and invasion
in hepatocellular carcinoma by driving epithelial-mesenchymal
transition. J Cell Mol Med. 18:49–58. 2014. View Article : Google Scholar : PubMed/NCBI
|
|
14
|
Wang S, Li N, Yousefi M, Nakauka-Ddamba A,
Li F, Parada K, Rao S, Minuesa G, Katz Y, Gregory BD, et al:
Transformation of the intestinal epithelium by the MSI2 RNA-binding
protein. Nat Commun. 6:65172015. View Article : Google Scholar : PubMed/NCBI
|
|
15
|
Emadi-Baygi M, Nikpour P, Mohammad-Hashem
F, Maracy MR and Haghjooy-Javanmard S: MSI2 expression is decreased
in grade II of gastric carcinoma. Pathol Res Pract. 209:689–691.
2013. View Article : Google Scholar : PubMed/NCBI
|
|
16
|
Sobin LH, Gospodarowicz MK and Wittekind
C: TNM classification of Malignant Tumours. (7th). Wiley-Blackwell.
Hoboken, NJ. 2009.
|
|
17
|
Capes-Davis A, Theodosopoulos G, Atkin I,
Drexler HG, Kohara A, MacLeod RA, Masters JR, Nakamura Y, Reid YA,
Reddel RR and Freshney RI: Check your cultures! A list of
cross-contaminated or misidentified cell lines. Int J Cancer.
127:1–8. 2010. View Article : Google Scholar : PubMed/NCBI
|
|
18
|
Livak KJ and Schmittgen TD: Analysis of
relative gene expression data using real-time quantitative PCR and
the 2(-Delta Delta C(T)) method. Methods. 25:402–8. 2001.
View Article : Google Scholar : PubMed/NCBI
|
|
19
|
Zheng L, Wu C, Xi P, Zhu M, Zhang L, Chen
S, Li X, Gu J and Zheng Y: The survival and the long-term trends of
patients with gastric cancer in Shanghai, China. BMC Cancer.
14:3002014. View Article : Google Scholar : PubMed/NCBI
|
|
20
|
Strong VE, Wu AW, Selby LV, Gonen M, Hsu
M, Song KY, Park CH, Coit DG, Ji JF and Brennan MF: Differences in
gastric cancer survival between the U.S. and China. J Surg Oncol.
112:31–37. 2015. View Article : Google Scholar : PubMed/NCBI
|
|
21
|
Leja M, You W, Camargo MC and Saito H:
Implementation of gastric cancer screening-the global experience.
Best Pract Res Clin Gastroenterol. 28:1093–1106. 2014. View Article : Google Scholar : PubMed/NCBI
|
|
22
|
Figueiredo C, Costa S, Karameris A and
Machado JC: Pathogenesis of gastric cancer. Helicobacter. 20 Suppl
1:S30–S35. 2015. View Article : Google Scholar
|
|
23
|
Sakakibara S, Nakamura Y, Satoh H and
Okano H: Rna-binding protein Musashi2: Developmentally regulated
expression in neural precursor cells and subpopulations of neurons
in mammalian CNS. J Neurosci. 21:8091–1107. 2001. View Article : Google Scholar : PubMed/NCBI
|
|
24
|
Mansouri L, Gunnarsson R, Sutton LA, Ameur
A, Hooper SD, Mayrhofer M, Juliusson G, Isaksson A, Gyllensten U
and Rosenquist R: Next generation RNA-sequencing in prognostic
subsets of chronic lymphocytic leukemia. Am J Hematol. 87:737–740.
2012. View Article : Google Scholar : PubMed/NCBI
|
|
25
|
Thol F, Winschel C, Sonntag AK, Damm F,
Wagner K, Chaturvedi A, Göhring G, Schlegelberger B, Lubbert M,
Fiedler W, et al: Prognostic significance of expression levels of
stem cell regulators MSI2 and NUMB in acute myeloid leukemia. Ann
Hematol. 92:315–323. 2013. View Article : Google Scholar : PubMed/NCBI
|
|
26
|
Wang MH, Qin SY, Zhang SG, Li GX, Yu ZH,
Wang K, Wang B, Teng MJ and Peng ZH: Musashi-2 promotes hepatitis
Bvirus related hepatocellular carcinoma progression via the
Wnt/β-catenin pathway. Am J Cancer Res. 5:1089–1100.
2015.PubMed/NCBI
|
|
27
|
Hanahan D and Weinberg RA: Hallmarks of
cancer: The next generation. Cell. 144:646–674. 2011. View Article : Google Scholar : PubMed/NCBI
|