Introduction
Breast dynamic contrast-enhanced magnetic resonance
imaging (DCE-MRI) is currently considered the most sensitive
technique for the detection of breast lesions (1). In addition to morphological features,
the shape of the time-intensity curve (TIC) of the signal from
breast DCE-MRI has been used as an effective tool to assess
possible lesion malignancy, which is highly associated with the
extent of angiogenesis (2).
Generally, an upslope with a quick washout pattern of the TIC is
regarded as an important marker for predicting malignancy (3). Currently, in the majority of hospitals,
the breast lesion is extracted manually based on the parametric map
reflecting the maximum slope increase (MSI) of the TIC. The mean
TIC of signals from the manually delineated area is subsequently
computed, in addition to the mean MSI value. Previous studies have
reported a high sensitivity for this operator-dependent method but
only a low to moderate specificity for identifying benign tumors
compared with malignant tumors (2,4–6).
To increase the specificity of breast malignant
lesion detection, the current study devised a novel method for the
analysis of TIC. Compared with the traditional method, the method
proposed in the current study exhibits three different features.
Firstly, the traditional method selects the representative area of
the lesion manually but in the proposed method the lesion area is
identified semi-automatically. Secondly, the traditional method
classifies the TIC subjectively according to its shape based on
three washout patterns, while the proposed method categorizes the
TIC quantitatively. Finally, the traditional method only calculates
one parameter, MSI, using commercial software embedded in the
workstation. By contrast, several additional parameters are
introduced in the current study to evaluate the performance of the
proposed method in differentiating malignant lesions from benign
lesions. The current study proposes that the new methodology may be
useful for identifying clinical markers of breast tumor malignancy
with greater specificity. This may assist the differentiation
between malignant and benign breast lesions prior to breast
conservation surgery being considered.
Materials and methods
Materials
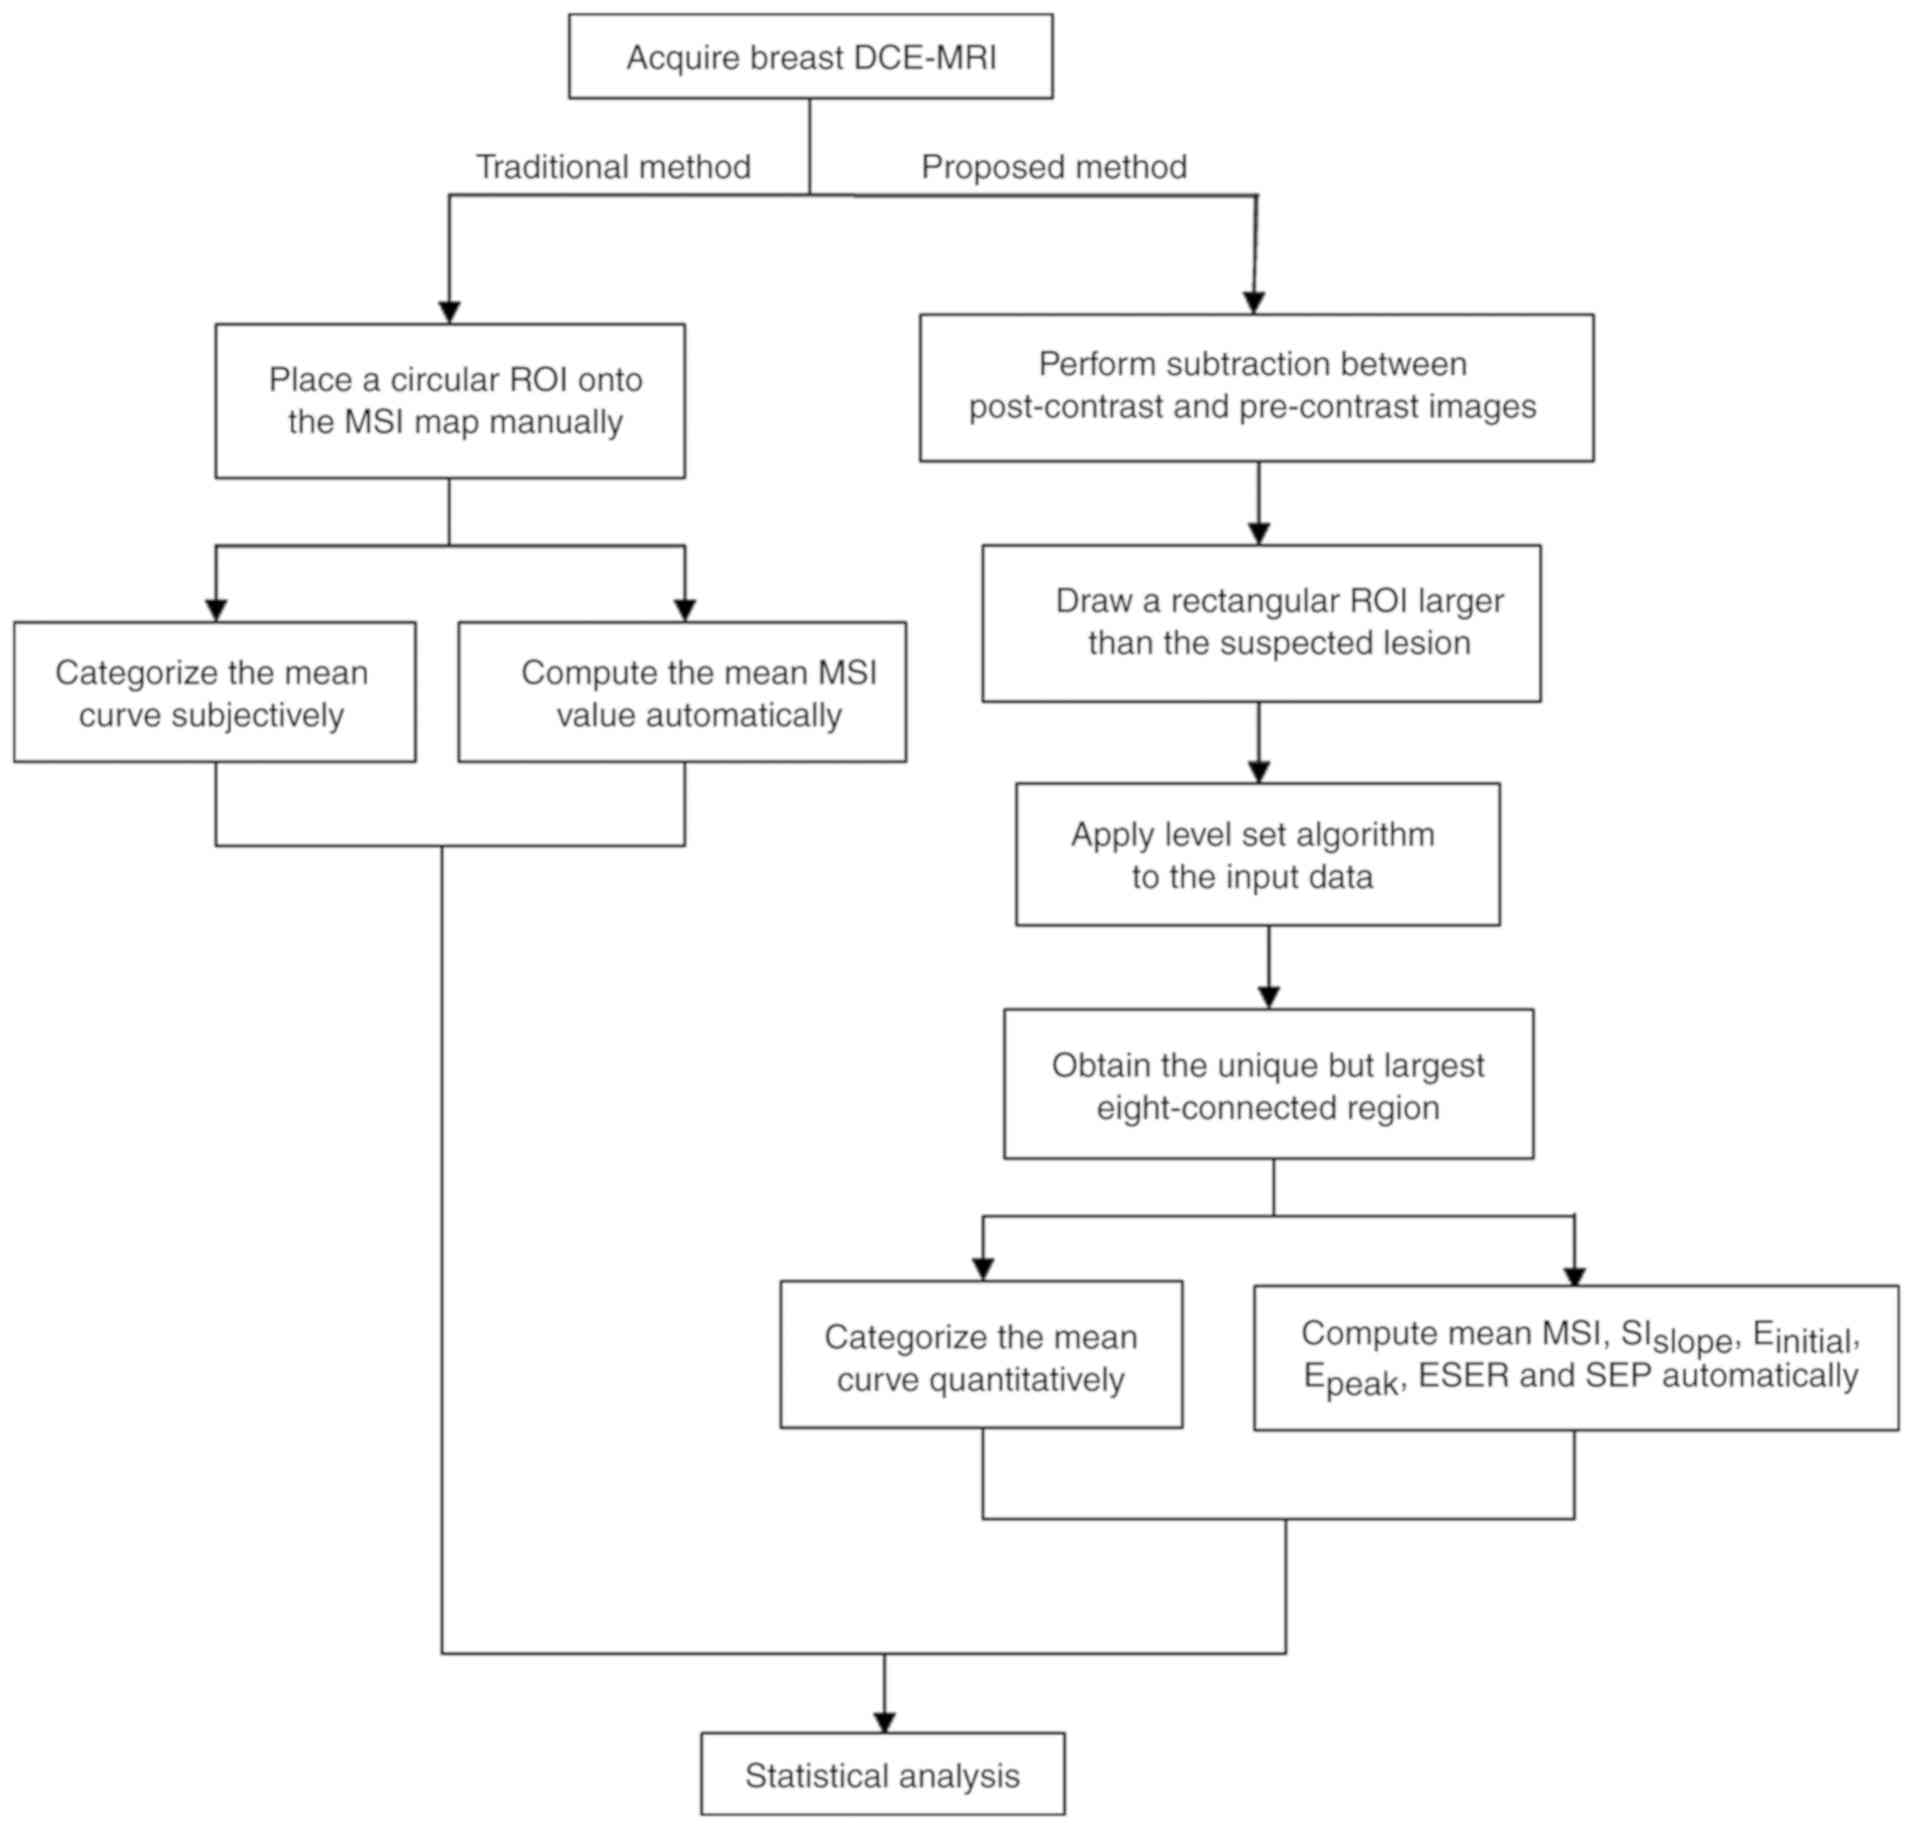
The experimental procedures employed in the current
study are presented in Fig. 1. The
conventional method for TIC analysis was performed using FuncTool
Performance software (version 9.4.05A; GE Healthcare, Chicago, IL,
USA) embedded in a workstation. The semi-automatic diagnostic
procedure was performed separately using an offline personal
computer with a program developed by the current study based on
MATLAB language (version R2010b; MathWorks, Natick, MA, USA).
MRI protocols and patients
The current study was approved by the Ethics
Committee of Shengjing Hospital of China Medical University
(Shenyang, China). All images were retrospectively selected and
downloaded from the existing Picture Archiving and Communication
Systems (PACS) database of the Shengjing Hospital of China Medical
University (Shenyang, China), therefore the requirement for
informed consent was waived. All patient information was
anonymized.
DCE-MRI data were acquired using a GoldSeal Signa
HDxt 3.0T scanner (GE Healthcare) with a dedicated surface
multichannel receiver coil. Prior to imaging, the space between the
coil and breast was filled with soft plastic foam to reduce the
influence of possible patient motion on subsequent analysis.
Following axial localization, dynamic examination was performed
using VIBRANT-VX (GE Healthcare) with the following settings:
Repetition time, 7.42 msec; echo time, 4.25 msec; flip angle, 15°;
slice thickness, 2.2 mm; space between slices, 2.2 mm; inversion
time, 20 msec; image matrix, 1,024×1,024; and slice number, 78.
Breast DCE-MRI was performed with nine acquisitions and a temporal
resolution of 80 sec per acquisition. The first acquisition was an
unenhanced baseline scan; subsequently, 0.15 mmol/kg of contrast
agent (Omniscan; GE Healthcare or Magnevist; Bayer AG, Leverkusen,
Germany) was administrated through an antecubital vein catheter via
a power injector at 4 ml/sec, followed by an equal volume of saline
flush at 4 ml/sec.
A total of 1,431 breast DCE-MRI images were obtained
at Shengjing Hospital between January 2010 and August 2014 and were
read by a radiologist with 13 years of work experience. A number of
patients were referred for multiple DCE-MRI examinations prior to
and following therapy, however all images collected for the current
study were acquired for diagnostic purposes prior to therapeutic
treatment. All of the selected lesions were single lesions
presenting a mass-like shape, occurring in either the left or right
breast. In addition, each lesion was confirmed as benign or
malignant by biopsy or pathology (the time interval between MRI and
histopathological examination was <5 days). Following the
removal of patients that did not meet the inclusion criteria, 156
patients, with a mean age of 49.5 years (range, 23–71 years), were
selected for the present study. The maximum size of the lesions
ranged between 6.7 and 44.3 mm. Details of the diagnoses verified
by pathology or biopsy are presented in Table I.
 | Table I.Detailed histopathological diagnoses
for all malignant (n=85) and benign (n=71) breast lesions. |
Table I.
Detailed histopathological diagnoses
for all malignant (n=85) and benign (n=71) breast lesions.
| Diagnosis | n | % |
|---|
| Malignant | 85 | 54.49 |
|
Invasive ductal carcinoma | 71 | 45.51 |
|
Invasive lobular
carcinoma | 3 |
1.92 |
| Ductal
carcinoma in situ | 4 |
2.56 |
|
Phylloid tumor | 5 |
3.21 |
|
Papillary carcinoma | 2 |
1.28 |
| Benign | 71 | 45.51 |
| High
risk (complex sclerosing lesion, FEA, CCC with focal atypia) | 5 |
3.21 |
|
Fibroadenoma, fibroadenomatous
hyperplasia | 33 | 21.15 |
|
Papilloma | 4 |
2.56 |
| DH,
CCC, FCC, focal fibrosis, nodular sclerosing adenosis | 16 | 10.26 |
|
Miscellaneous (chronic
abscess, gynecomastia, fat necrosis and pseudoangiomatosis) | 13 |
8.33 |
Traditional method
Manual extraction of lesions and qualitative
analysis of TIC. Each image was downloaded from the PACS server and
imported to the FuncTool Performance software by a radiologist with
22 years of experience, who was blinded to patient clinical
information. A circular region of interest (ROI) was placed onto
the MSI parametric map to delineate the suspicious lesion area with
the most intense enhancement. The mean TIC from the ROI was
observed with the naked eye and classified subjectively by its
shape as one of three washout patterns: Type I (persistently
enhancing), where the signal intensity continued to increase over
time; type II (plateau), where the signal intensity did not change
over time following its initial increase during the delayed phase;
and type III (washout), where the signal intensity decreased after
reaching the highest point of its initial increase during the
delayed phase.
New method
Semi-automatic extraction of lesions and
quantitative analysis of TIC. The current study used a series of
post-processing steps to outline the suspicious lesion area.
Firstly, the third post-contrast image was
subtracted from the pre-contrast image. The subtracted volume image
was analyzed and the slice image with the lesion of maximum size
was selected for subsequent analysis. Secondly, a rectangular ROI
was drawn onto the selected slice to include the lesion, where the
ROI was larger than the lesion area. This ROI image was considered
as the input data. Next, a common image segmentation algorithm, the
level set method (7), was applied to
the input data. To improve the numerical accuracy of traditional
level-set segmentation, the current study utilized a new
variational formulation in which regularity was intrinsically
maintained during Distance Regularized Level Set Evolution (DRLSE).
Unlike the traditional method, the DRLSE-based level set method can
eliminate the need for reinitialization, which reduces numerical
errors. In addition, a simpler and more efficient finite difference
scheme can be adopted to conduct the DRLSE function. The
effectiveness of the method used in the current study had been
demonstrated by applying it to edge-based active contour models of
image segmentation (7). In addition,
the computational cost can be greatly reduced compared with that of
the traditional level-set segmentation method. Finally, the unique
and largest eight-connected region was selected as the lesion
area.
Following extraction of the lesion area,
quantitative analysis was performed as follows. First, the TICs
from the lesion area were averaged and the mean curve was
categorized quantitatively as one of three types based on the
following formula: SIslope = [(SItail -
SImean) / SImean] × 100%, where
SImean is the mean value between the first two
post-contrast time points and SItail is the signal
intensity at the last time point. The mean curve was designated as
type I when the SIslope was ≥+10%, type II when the
SIslope was between −10% and +10% and type III when the
SIslope was ≤-10%.
The following quantitative parameters were also
derived from the mean curve. MSI = max (SIi+1 -
SIi), where SIi and SIi+1 denote
the signal intensity of the former and latter phases, respectively,
and i ranges between 0 and 7. Initial percentage of enhancement
(Einitial) = (SI1 - SI0) /
SI0 × 100, where SI1 and SI0
represent the signal intensities of the first and pre-contrast
images, respectively. The percentage of peak enhancement
(Epeak) = (SIpeak - SI0) /
SI0 × 100, where SIpeak represents the peak
value of the contrast enhancement. The early signal enhancement
ratio (ESER) = (SI1 - SI0) / (SI2
- SI0) × 100, where SI2 is the intensity at
the second post-contrast time point. The second enhancement
percentage (SEP) = (SI2 - SI0) /
SI0 × 100.
The aforementioned parameters were also calculated
for the target region on a pixel-by-pixel basis and the
corresponding parametric map was color-coded. The values from the
lesion area were averaged for each parameter.
Statistical methods
For TIC categorization, types II and III were
designated as malignant, whereas the type I curve was designated as
benign. By comparison with pathological results, the specificity,
sensitivity and accuracy were calculated for the traditional
subjective method and the new proposed quantitative method. A
paired-sample Wilcoxon's test was performed using SPSS software
(version 16.0; SPSS, Inc., Chicago, IL, USA) to compare the two
methods. P<0.05 was considered to indicate a statistically
significant difference.
For each quantitative parameter, a receiver
operating characteristic (ROC) curve was generated using the
statistical software MedCalc (version 14.10.20; http://www.medcalc.org/) and the area under the ROC
curve (AUC) was used as an index of diagnostic performance. The
optimal cutoff value was also obtained using MedCalc for each
parameter, from which the specificity, sensitivity and accuracy
were determined.
Results
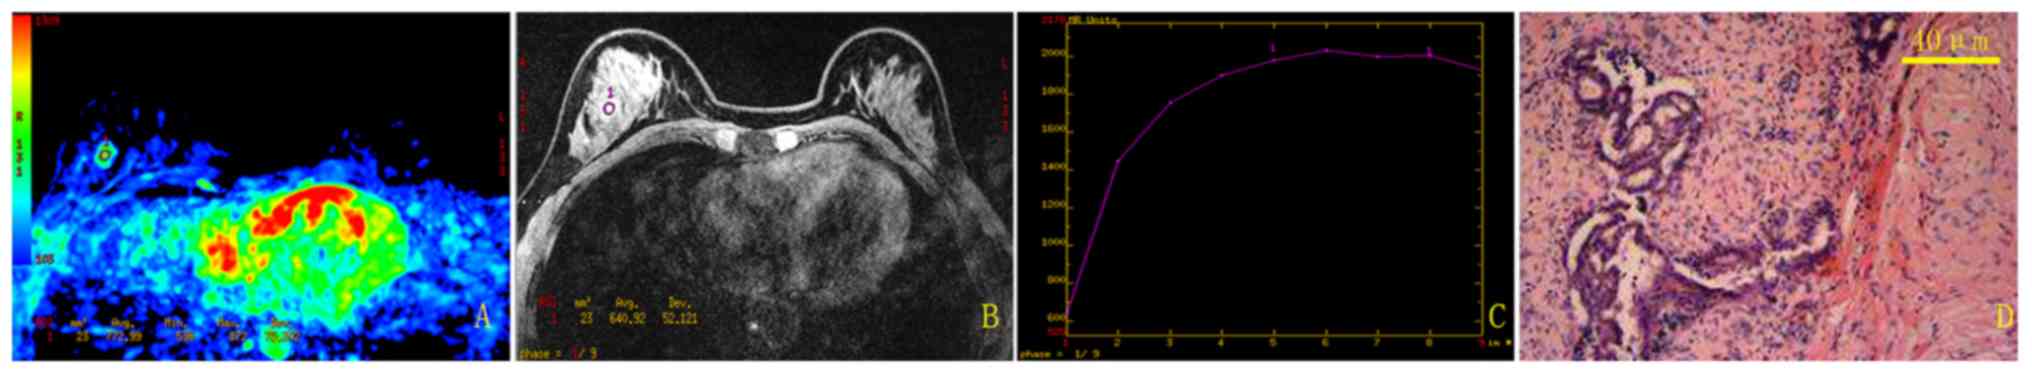
The current study used a randomly selected patient
(benign; 39 years old) to illustrate the results of the traditional
method (Fig. 2) and the new method
(Fig. 3). Using the traditional
method, the mean TIC for this patient was categorized as type II,
which was a false positive result. In comparison, using the new
semi-automatic quantitative method, the mean TIC was classified as
type I, which agreed with the pathological result.
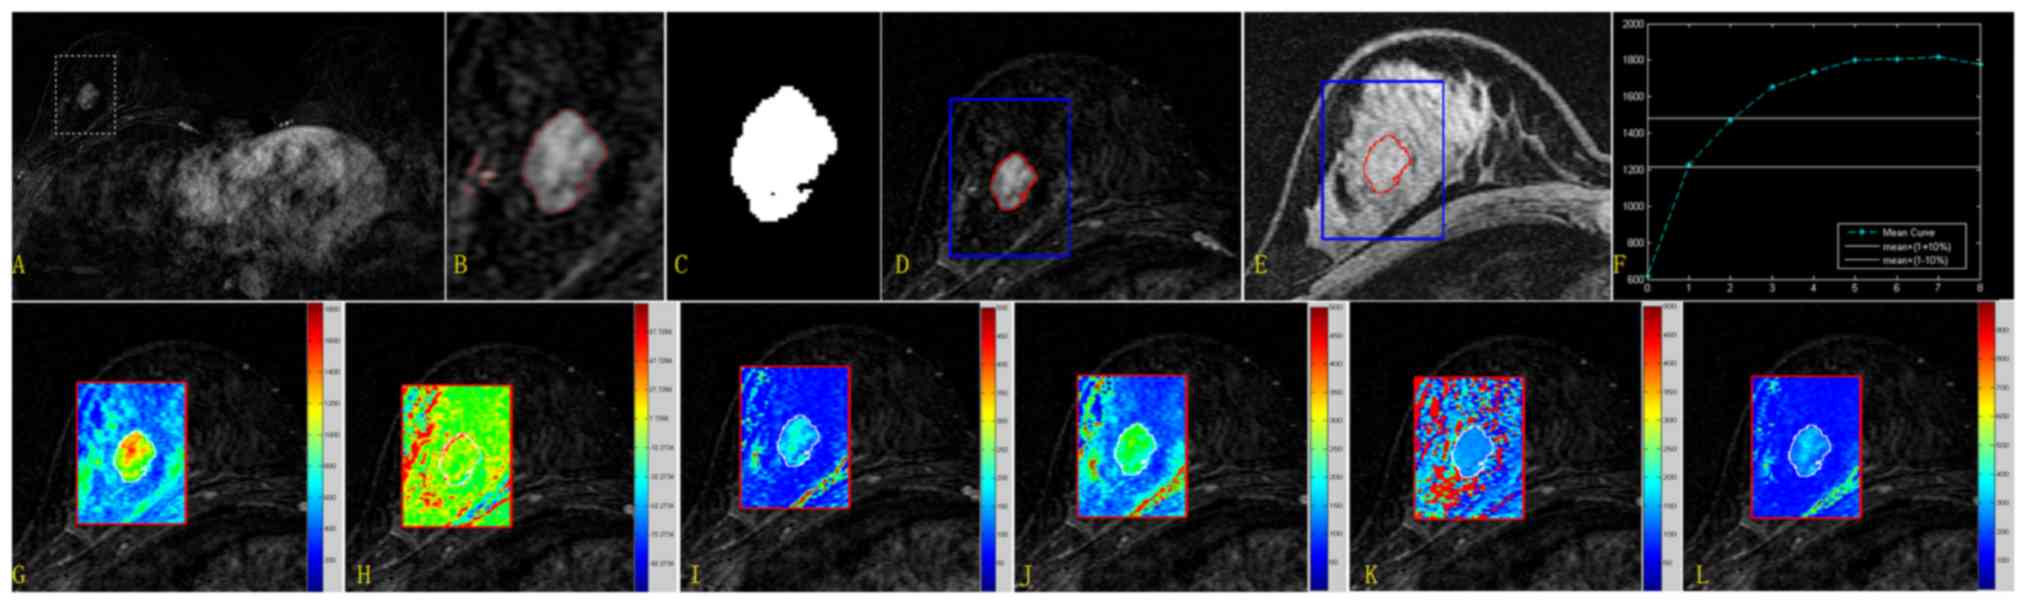 | Figure 3.Extraction procedure for the lesion
area and quantitative results from the new method for the randomly
selected case. Upper row: Extraction of the lesion region and
quantitative categorization of the mean TIC. (A) Subtracted image
for subsequent analysis covered by a rectangular ROI. (B) Segmented
image based on the level set algorithm (only the ROI is presented).
(C) The unique but largest eight-connected image was considered the
target region. (D) Enlarged subtracted image covered by the lesion
margin (red, lesion borderline; blue, ROI borderline). (E) The
lesion margin superimposed on the pre-contrast image. (F) Mean TIC.
Mean values calculated for the parameters SIslope,
Einitial, Epeak, ESER, MSI and SEP were
31.979, 100.421, 197.066, 71.683, 622.287 and 140.089,
respectively. Lower row: Quantitative parametric maps for the ROI
image. (G) MSI map. (H) SIslope map. (I)
Einitial map. (J) Epeak map. (K) ESER map.
(L) SEP map. Mean values calculated for SIslope,
Einitial, Epeak, ESER, MSI and SEP were
34.237, 101.577, 207.811, 71.4369, 1276.007 and 141.387,
respectively. TIC, time-intensity curve; ROI, region of interest;
SIslope, signal intensity slope; Einitial,
initial percentage of enhancement; Epeak, percentage of
peak enhancement; ESER, early signal enhancement ratio; MSI,
maximum slope of increase; SEP, second enhancement percentage. |
For the two methods, the statistical results of TIC
categorization are presented in Table
II. A significant difference was identified in the diagnostic
accuracy between the traditional method and the quantitative method
proposed in the current study (Z=−6.594, P<0.001). For the
quantitative parameters, the statistical results are presented in
Fig. 4 and Table III. The highest accuracy (84.0%) was
obtained based on the parameter SIslope, derived from
the mean TIC. Compared with the traditional method, the new method
demonstrated a higher sensitivity (84.7% vs. 64.7%) and specificity
(83.1% vs. 62.0%).
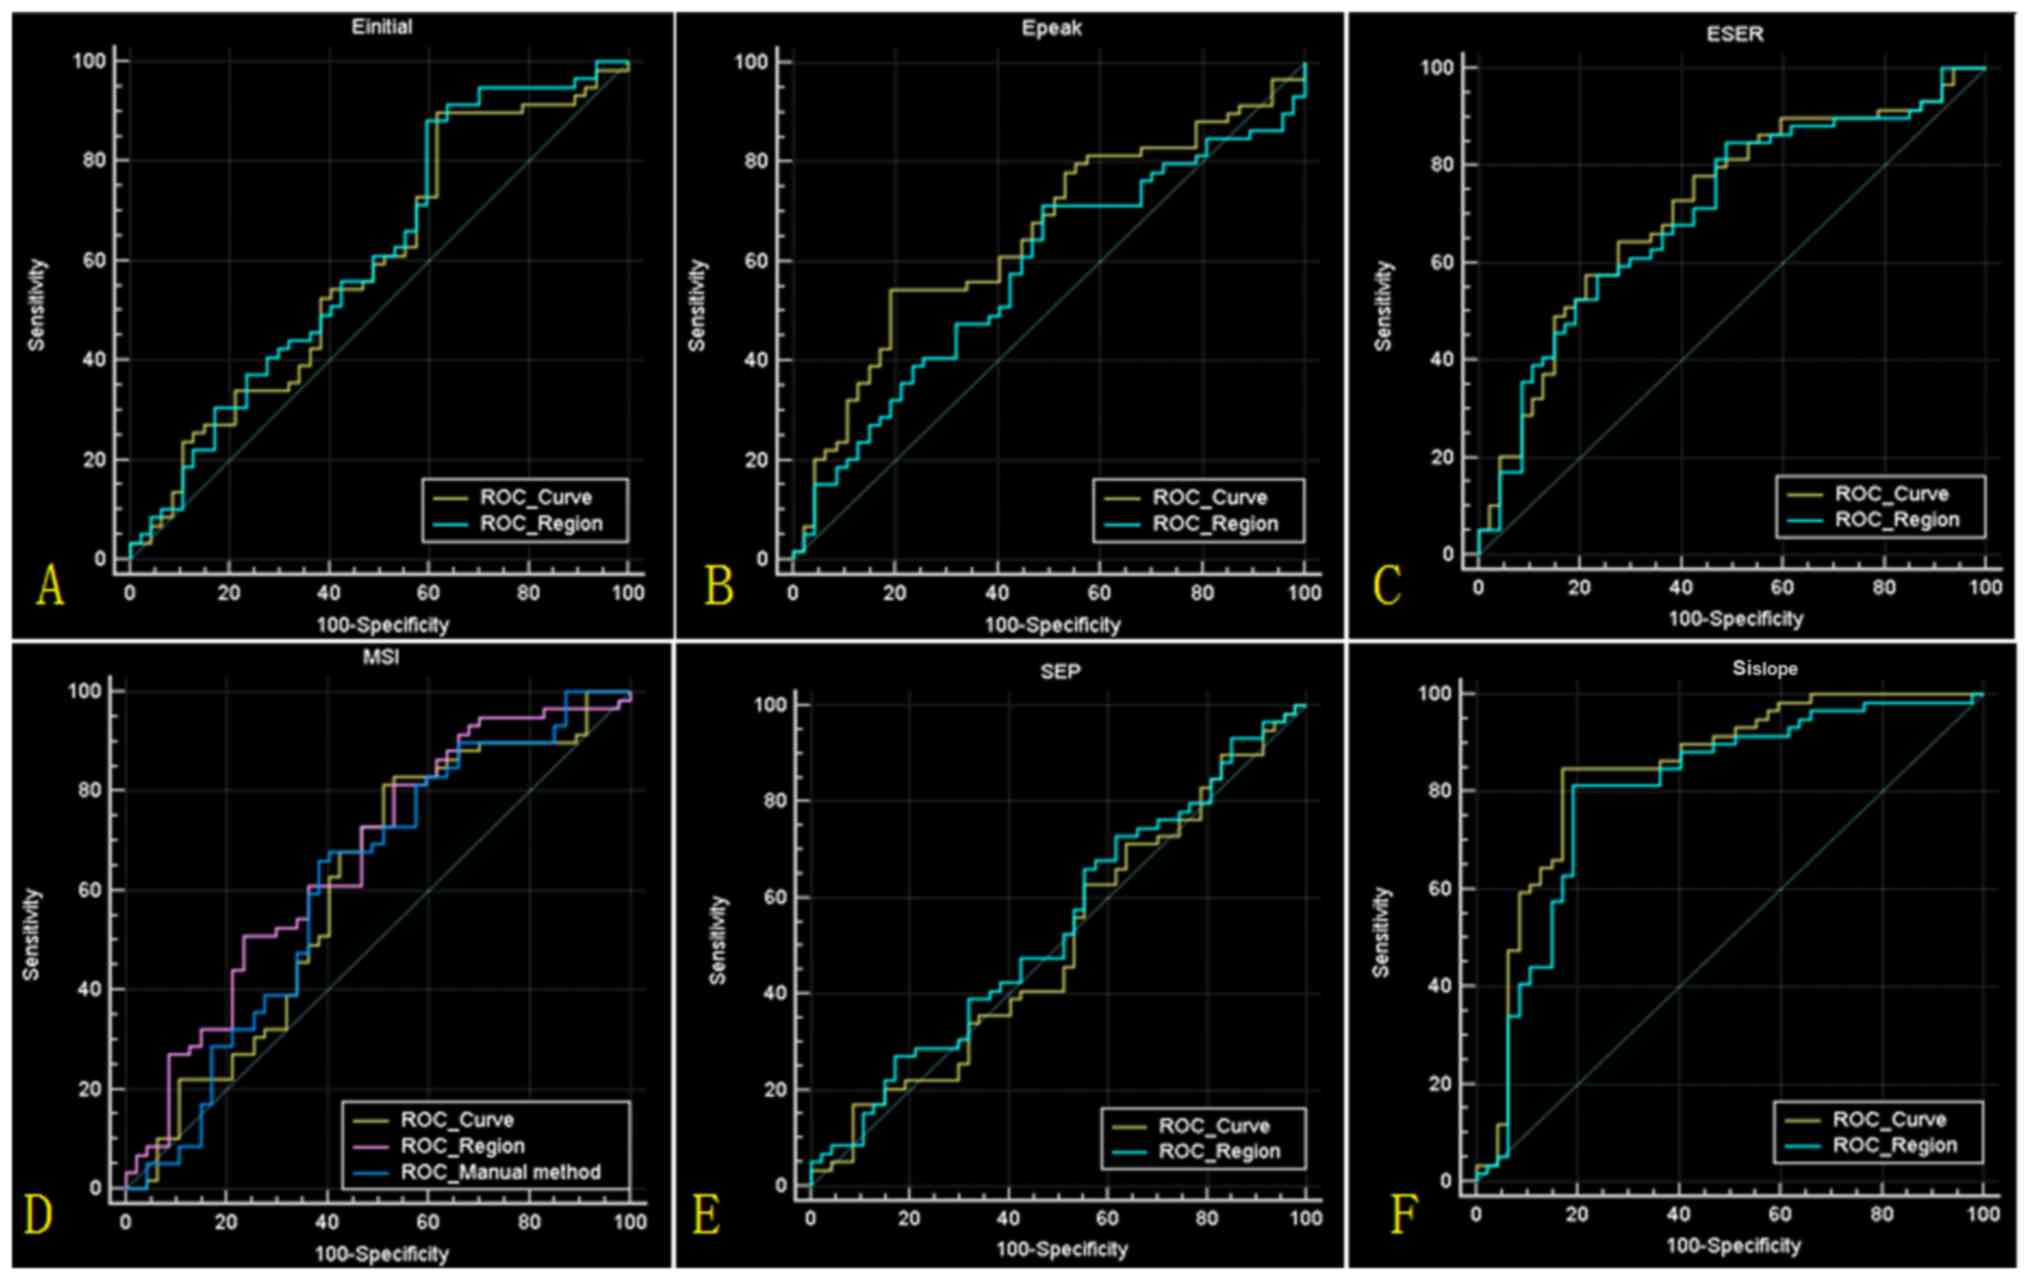 | Figure 4.Results of ROC analyses. (A-F) ROC
curves for Einitial, Epeak, ESER, MSI, SEP
and SIslope values, respectively, calculated from the
mean time intensity curve (ROC_Curve) and lesion region
(ROC_Region). (D) The ROC curve for MSI values calculated from the
traditional method (ROC_Manual method) is also indicated. ROC,
receiver operating characteristic; Einitial, initial
percentage of enhancement; Epeak, percentage of peak
enhancement; ESER, early signal enhancement ratio; MSI, maximum
slope of increase; SEP, second enhancement percentage;
SIslope, signal intensity slope. |
| Table II.Time intensity curve categorization
results obtained using the traditional method and proposed
semi-automatic method. |
Table II.
Time intensity curve categorization
results obtained using the traditional method and proposed
semi-automatic method.
| Parameter | Traditional
method | Proposed
method |
|---|
| Sensitivity, % | 85.9 | 83.5 |
| Specificity, % | 32.4 | 80.3 |
| Accuracy, % | 61.5 | 82.1 |
| Table III.Mean curve statistical analysis for
the quantitative parameters. |
Table III.
Mean curve statistical analysis for
the quantitative parameters.
| A, Proposed
method |
|---|
|
|---|
| Parameter | AUC | SE | 95% CI | Optimal cutoff | Sensitivity, % | Specificity, % | Accuracy, % |
|---|
| Mean time intensity
curve |
|
Sislope | 0.846 | 0.0409 | 0.766, 0.927 | ≤9.296 | 84.7 | 83.1 | 84.0 |
|
MSI | 0.611 | 0.0573 | 0.498, 0.723 | >682.142 | 81.2 | 49.3 | 66.7 |
|
Einitial | 0.590 | 0.0568 | 0.479, 0.701 | >112.81 | 89.4 | 38.0 | 66.0 |
|
Epeak | 0.652 | 0.0538 | 0.547, 0.758 | ≤210.934 | 54.1 | 80.3 | 66.0 |
|
ESER | 0.716 | 0.0507 | 0.617, 0.816 | >77.146 | 64.7 | 72.8 | 68.0 |
|
SEP | 0.505 | 0.0574 | 0.392, 0.617 | >205.264 | 41.2 | 49.3 | 44.9 |
| Lesion region |
|
Sislope | 0.802 | 0.0461 | 0.712, 0.892 | ≤16.952 | 81.2 | 80.3 | 80.8 |
|
MSI | 0.663 | 0.0539 | 0.558, 0.769 | ≤1503.171 | 81.2 | 46.5 | 65.4 |
|
Einitial | 0.611 | 0.0565 | 0.500, 0.722 | >115.984 | 88.2 | 40.9 | 66.7 |
|
Epeak | 0.576 | 0.0561 | 0.466, 0.686 | ≤308.249 | 71.8 | 50.7 | 62.2 |
|
ESER | 0.705 | 0.0514 | 0.604, 0.806 | >70.063 | 84.7 | 50.7 | 69.2 |
|
SEP | 0.537 | 0.0570 | 0.426, 0.649 | >180.913 | 73.0 | 38.0 | 57.1 |
|
| B, Traditional
method |
|
|
Parameter | AUC | SE | 95% CI | Optimal
cutoff | Sensitivity,
% | Specificity,
% | Accuracy,
% |
|
| MSI | 0.604 | 0.0572 | 0.503, 0.699 | >884.427 | 64.7 | 62.0 | 63.4 |
Discussion
Breast carcinoma is the most common cancer type and
a leading cause of mortality in females worldwide (8). Traditional examination techniques,
including X-ray, mammography and ultrasonography are routinely
utilized in clinical practice to predict tumor
chemo-responsiveness. However, these techniques exhibit only low to
moderate associations with histologically verified pathology
following breast surgery (4,7,9,10). DCE-MRI with repetitive measurements
following contrast media administration is a frequently used
technique in the diagnosis and staging of breast cancer lesions
(5,6,11,12). Furthermore, DCE-MRI has the ability to
reliably monitor the effect of neoadjuvant chemotherapy in the
treatment of breast cancer (4,13,14). TICs of signals from DCE-MRI differ
between malignant and benign breast lesions are strongly associated
with tumor angiogenesis and provide insights into lesion
pathophysiology (15,16). For malignant cases, a TIC curve
typically exhibits a strong initial enhancement of signal followed
by a plateau or washout; by contrast, benign lesions typically
present continuously increasing time courses. However, overlap
exists between the enhancement curve types of benign and malignant
lesions. For traditional interpretation of DCE-MRI, the manual
placement of the ROI to delineate a contrast-enhancing lesion is
subjective and may lead to inaccuracies if the ROI is placed in a
less vital area of the lesion. In addition, categorization of TIC
according to its shape is subjective, which may result in low
diagnostic accuracy (17). The
reported specificity for the traditional method in distinguishing
benign from malignant lesions is relatively low and high
false-positive rates may result in high biopsy rates, which not
only unnecessarily increase health care costs, but may also harm
numerous cancer-free females with long-term psychological
consequences (18,19).
To obtain higher diagnostic specificity, the current
study has proposed a novel method for TIC analysis, which
determines the lesion area semi-automatically, objectively
categorizes the TIC as one of the three washout patterns and
provides a higher number of quantitative parameters reflecting the
enhancement information. The results identified that the proposed
method demonstrated improved performance in distinguishing benign
from malignant lesions compared with the traditional method. For
TIC classification, although the sensitivity of the traditional
method was high, its specificity was low, which is in agreement
with a number of previous studies (20–25). Low
specificity in DCE-MRI diagnosis may lead to low accuracy. Compared
with the traditional method, the new method slightly decreased the
sensitivity, but substantially increased the specificity when using
the parameter SIslope derived from the mean curve.
Therefore, overall accuracy was improved. Traditionally, the
optimal threshold value is set at +10% (14). However, the current study identified
that diagnostic accuracy was improved if the value was set at
+9.30%. The current study proposes that the establishment of a new
optimal cutoff value may improve future interpretations of breast
DCE-MRIs, eliminating unnecessary surgeries and biopsies for benign
lesions. The results presented in the current study may be useful
for guiding future studies and may lead to further retrospective
analyses of similar datasets.
Previously, a number of studies investigating
computer-aided diagnosis of breast DCE-MRI have been performed with
the aim of improving the differentiation of benign from malignant
lesions (6,15,16,19,21,26-29).
A computerized detection scheme to compute a global
contrast-enhanced feature was proposed by Yang et al
(19), which achieved a diagnostic
sensitivity of 91.3%, but a specificity of only 66%. A
semi-automatic lesion segmentation system based on a supervised
learning formulation was reported by Levman et al (26). In contrast to the traditional
enhancement threshold method, AUC indexing improved diagnostic
performance from 0.75 to 0.79. In studies by El Khouli et al
(21) and Newell et al
(29), parameters reflecting
hemodynamic information were measured to distinguish between benign
and malignant lesions, resulting in higher performance compared
with conventional kinetic curve analysis. In an innovative study
(16), kinetic curve and
morphological features were analyzed quantitatively and a
morphodynamic index (MDI) was presented. With an MDI cutoff value
of 50%, the sensitivity and specificity were reported as 96.5 and
75.5%, respectively. Compared with these studies, the method
proposed in the current study provides a higher number of
quantitative parameters reflecting the enhancement information of
breast lesions. The maximum AUC (0.846) in the current study, with
sensitivity of 84.7 and specificity of 83.1%, was obtained from
SIslope values measured from the mean curve of the
semi-automatically extracted lesion, with a corresponding accuracy
of 84.0%. The diagnostic accuracy may be even higher if
morphological features were also analyzed. In real clinical
practice, breast MRI findings should also be interpreted based on
the following three characteristics according to the American
College of Radiology Breast Imaging Reporting and Data System MRI
criteria: i) Shape (round, oval, lobular or irregular), ii) margin
(smooth, irregular or spiculated) and iii) internal enhancement
(homogeneous, heterogeneous, rim enhancement, dark internal septa,
enhancing internal septa, central enhancement or no enhancement)
(30). In addition, other specific
findings identified by MRI, including apparent diffusion
coefficient values, should be analyzed to increase diagnostic
accuracy.
Two limitations of the current study should be
emphasized. First, the sample size in the current study was
insufficient to obtain a definitive conclusion. If the sample size
was changed, the optimal cutoff value and accuracy rate may change
accordingly. Second, the current study only analyzed TICs from
breast DCE-MRI and did not utilize morphological features of the
lesions for tumor diagnosis, which may have further improved the
diagnostic accuracy of breast DCE-MRI using the proposed
semi-automatic method (2,31,32).
In summary, experimental results suggest that the
proposed method in the current study may improve the accuracy of
DCE-MRI in distinguishing benign from malignant breast lesions.
Furthermore, the proposed method may be a useful supplementary tool
to assist with the subjective interpretation of a DCE-MRI made by a
radiologist.
Acknowledgements
Not applicable.
Funding
The present study was financially supported by the
Science and Technique Foundation of Liaoning (grant no. 2011402016)
and the Startup Foundation for Doctors of Liaoning Province (grant
no. 201601118).
Availability of data and materials
The datasets used and/or analyzed during the present
study are available from the corresponding author on reasonable
request.
Authors' contributions
JDY was responsible for the experimental design. JWY
collected the general data of patients. JWY and ZJ conducted the
quantitative analysis. All authors read and approved the final
manuscript.
Ethics approval and consent to
participate
The present study was approved by the Ethics
Committee of Shengjing Hospital of China Medical University
(Shenyang, China). As this was a retrospective study, the
requirement for informed consent was waived. All patient
information was anonymized.
Patient consent for publication
Not applicable.
Competing interests
The authors declare that they have no competing
interests.
References
|
1
|
Kuhl CK, Schrading S, Bieling HB,
Wardelmann E, Leutner CC, Koenig R, Kuhn W and Schild HH: MRI for
diagnosis of pure ductal carcinoma in situ: A prospective
observational study. Lancet. 370:485–492. 2007. View Article : Google Scholar : PubMed/NCBI
|
|
2
|
Chang YC, Huang YH, Huang CS, Chang PK,
Chen JH and Chang RF: Classification of breast mass lesions using
model-based analysis of the characteristic kinetic curve derived
from fuzzy c-means clustering. Magn Reson Imaging. 30:312–322.
2012. View Article : Google Scholar : PubMed/NCBI
|
|
3
|
Vag T, Baltzer PA, Dietzel M, Zoubi R,
Gajda M, Camara O and Kaiser WA: Kinetic analysis of lesions
without mass effect on breast MRI using manual and
computer-assisted methods. Eur Radiol. 21:893–898. 2011. View Article : Google Scholar : PubMed/NCBI
|
|
4
|
Böttcher J, Renz DM, Zahm DM, Pfeil A,
Fallenberg EM, Streitparth F, Maurer MH, Hamm B and Engelken FJ:
Response to neoadjuvant treatment of invasive ductal breast
carcinomas including outcome evaluation: MRI analysis by an
automatic CAD system in comparison to visual evaluation. Acta
Oncol. 53:759–768. 2014. View Article : Google Scholar : PubMed/NCBI
|
|
5
|
Renz DM, Böttcher J, Baltzer PA, Dietzel
M, Vag T, Gajda M, Camara O, Runnebaum IB and Kaiser WA: The
contralateral synchronous breast carcinoma: A comparison of
histology, localization, and magnetic resonance imaging
characteristics with the primary index cancer. Breast Cancer Res
Treat. 120:449–459. 2010. View Article : Google Scholar : PubMed/NCBI
|
|
6
|
Renz DM, Diekmann F, Schmitzberger FF,
Pietsch H, Fallenberg EM, Durmus T, Huppertz A, Böttcher J, Bick U,
Hamm B, et al: Pharmacokinetic approach for dynamic breast MRI to
indicate signal intensity time curves of benign and malignant
lesions by using the tumor flow residence time. Invest Radiol.
48:69–78. 2013. View Article : Google Scholar : PubMed/NCBI
|
|
7
|
Li C, Xu C, Gui C and Fox MD: Distance
regularized level set evolution and its application to image
segmentation. IEEE Trans Image Process. 19:3243–3254. 2010.
View Article : Google Scholar : PubMed/NCBI
|
|
8
|
Sun L, Chen G, Zhou Y, Zhang L, Jin Z, Liu
W, Wu G, Jin F, Li K and Chen B: Clinical significance of MSKCC
nomogram on guiding the application of touch imprint cytology and
frozen section in intraoperative assessment of breast sentinel
lymph nodes. Oncotarget. 8:78105–78112. 2017.PubMed/NCBI
|
|
9
|
Croshaw R, Shapiro-Wright H, Svensson E,
Erb K and Julian T: Accuracy of clinical examination, digital
mammogram, ultrasound, and MRI in determining postneoadjuvant
pathologic tumor response in operable breast cancer patients. Ann
Surg Oncol. 18:3160–3163. 2011. View Article : Google Scholar : PubMed/NCBI
|
|
10
|
Sardanelli F, Podo F, Santoro F, Manoukian
S, Bergonzi S, Trecate G, Vergnaghi D, Federico M, Cortesi L,
Corcione S, et al: High Breast Cancer Risk Italian 1 (HIBCRIT-1)
Study. Multicenter surveillance of women at high genetic breast
cancer risk using mammography, ultrasonography, and
contrast-enhanced magnetic resonance imaging (the high breast
cancer risk italian 1 study): Final results. Invest Radiol.
46:94–105. 2011. View Article : Google Scholar : PubMed/NCBI
|
|
11
|
Lehman CD, Gatsonis C, Kuhl CK, Hendrick
RE, Pisano ED, Hanna L, Peacock S, Smazal SF, Maki DD, Julian TB,
et al; ACRIN Trial 6667 Investigators Group, . MRI evaluation of
the contralateral breast in women with recently diagnosed breast
cancer. N Engl J Med. 356:1295–1303. 2007. View Article : Google Scholar : PubMed/NCBI
|
|
12
|
Pediconi F, Miglio E, Telesca M, Luciani
ML, Kirchin MA, Passariello R and Catalano C: Effect of
preoperative breast magnetic resonance imaging on surgical decision
making and cancer recurrence rates. Invest Radiol. 47:128–135.
2012. View Article : Google Scholar : PubMed/NCBI
|
|
13
|
Johansen R, Jensen LR, Rydland J, Goa PE,
Kvistad KA, Bathen TF, Axelson DE, Lundgren S and Gribbestad IS:
Predicting survival and early clinical response to primary
chemotherapy for patients with locally advanced breast cancer using
DCE-MRI. J Magn Reson Imaging. 29:1300–1307. 2009. View Article : Google Scholar : PubMed/NCBI
|
|
14
|
Abramson RG, Li X, Hoyt TL, Su PF,
Arlinghaus LR, Wilson KJ, Abramson VG, Chakravarthy AB and
Yankeelov TE: Early assessment of breast cancer response to
neoadjuvant chemotherapy by semi-quantitative analysis of
high-temporal resolution DCE-MRI: Preliminary results. Magn Reson
Imaging. 31:1457–1464. 2013. View Article : Google Scholar : PubMed/NCBI
|
|
15
|
Baltzer PA, Renz DM, Kullnig PE, Gajda M,
Camara O and Kaiser WA: Application of computer-aided diagnosis
(CAD) in MR-mammography (MRM): Do we really need whole lesion time
curve distribution analysis? Acad Radiol. 16:435–442. 2009.
View Article : Google Scholar : PubMed/NCBI
|
|
16
|
Renz DM, Böttcher J, Diekmann F,
Poellinger A, Maurer MH, Pfeil A, Streitparth F, Collettini F, Bick
U, Hamm B, et al: Detection and classification of
contrast-enhancing masses by a fully automatic computer-assisted
diagnosis system for breast MRI. J Magn Reson Imaging.
35:1077–1088. 2012. View Article : Google Scholar : PubMed/NCBI
|
|
17
|
Beresford MJ, Padhani AR, Taylor NJ,
Ah-See ML, Stirling JJ, Makris A, d'Arcy JA and Collins DJ: Inter-
and intraobserver variability in the evaluation of dynamic breast
cancer MRI. J Magn Reson Imaging. 24:1316–1325. 2006. View Article : Google Scholar : PubMed/NCBI
|
|
18
|
Brodersen J and Siersma VD: Long-term
psychosocial consequences of false-positive screening mammography.
Ann Fam Med. 11:106–115. 2013. View
Article : Google Scholar : PubMed/NCBI
|
|
19
|
Yang Q, Li L, Zhang J, Shao G and Zheng B:
A computerized global MR image feature analysis scheme to assist
diagnosis of breast cancer: A preliminary assessment. Eur J Radiol.
83:1086–1091. 2014. View Article : Google Scholar : PubMed/NCBI
|
|
20
|
Partridge SC, Rahbar H, Murthy R, Chai X,
Kurland BF, DeMartini WB and Lehman CD: Improved diagnostic
accuracy of breast MRI through combined apparent diffusion
coefficients and dynamic contrast-enhanced kinetics. Magn Reson
Med. 65:1759–1767. 2011. View Article : Google Scholar : PubMed/NCBI
|
|
21
|
El Khouli RH, Macura KJ, Kamel IR, Jacobs
MA and Bluemke DA: 3-T dynamic contrast-enhanced MRI of the breast:
Pharmacokinetic parameters versus conventional kinetic curve
analysis. AJR Am J Roentgenol. 197:1498–1505. 2011. View Article : Google Scholar : PubMed/NCBI
|
|
22
|
Bluemke DA, Gatsonis CA, Chen MH,
DeAngelis GA, DeBruhl N, Harms S, Heywang-Köbrunner SH, Hylton N,
Kuhl CK, Lehman C, et al: Magnetic resonance imaging of the breast
prior to biopsy. JAMA. 292:2735–2742. 2004. View Article : Google Scholar : PubMed/NCBI
|
|
23
|
Choi HK, Cho N, Moon WK, Im SA, Han W and
Noh DY: Magnetic resonance imaging evaluation of residual ductal
carcinoma in situ following preoperative chemotherapy in breast
cancer patients. Eur J Radiol. 81:737–743. 2012. View Article : Google Scholar : PubMed/NCBI
|
|
24
|
Pinker-Domenig K, Bogner W, Gruber S,
Bickel H, Duffy S, Schernthaner M, Dubsky P, Pluschnig U, Rudas M,
Trattnig S, et al: High resolution MRI of the breast at 3 T: Which
BI-RADS® descriptors are most strongly associated with
the diagnosis of breast cancer. Eur Radiol. 22:322–330. 2012.
View Article : Google Scholar : PubMed/NCBI
|
|
25
|
Pinker K, Bogner W, Baltzer P, Gruber S,
Bickel H, Brueck B, Trattnig S, Weber M, Dubsky P, Bago-Horvath Z,
et al: Improved diagnostic accuracy with multiparametric magnetic
resonance imaging of the breast using dynamic contrast-enhanced
magnetic resonance imaging, diffusion-weighted imaging, and
3-dimensional proton magnetic resonance spectroscopic imaging.
Invest Radiol. 49:421–430. 2014. View Article : Google Scholar : PubMed/NCBI
|
|
26
|
Levman J, Warner E, Causer P and Martel A:
Semi-automatic region-of-interest segmentation based computer-aided
diagnosis of mass lesions from dynamic contrast-enhanced magnetic
resonance imaging based breast cancer screening. J Digit Imaging.
27:670–678. 2014. View Article : Google Scholar : PubMed/NCBI
|
|
27
|
Williams TC, DeMartini WB, Partridge SC,
Peacock S and Lehman CD: Breast MR imaging: Computer-aided
evaluation program for discriminating benign from malignant
lesions. Radiology. 244:94–103. 2007. View Article : Google Scholar : PubMed/NCBI
|
|
28
|
Renz DM, Durmus T, Böttcher J, Taupitz M,
Diekmann F, Huppertz A, Pfeil A, Maurer MH, Streitparth F, Bick U,
et al: Comparison of gadoteric acid and gadobutrol for detection as
well as morphologic and dynamic characterization of lesions on
breast dynamic contrast-enhanced magnetic resonance imaging. Invest
Radiol. 49:474–484. 2014. View Article : Google Scholar : PubMed/NCBI
|
|
29
|
Newell D, Nie K, Chen JH, Hsu CC, Yu HJ,
Nalcioglu O and Su MY: Selection of diagnostic features on breast
MRI to differentiate between malignant and benign lesions using
computer-aided diagnosis: Differences in lesions presenting as mass
and non-mass-like enhancement. Eur Radiol. 20:771–781. 2010.
View Article : Google Scholar : PubMed/NCBI
|
|
30
|
D'Orsi CJ, Sickles EA, Mendelson EB and
Morris EA: ACR BI-RADS® Atlas, Breast Imaging Reporting
and Data System. American College of Radiology; Reston, VA:
2013
|
|
31
|
Kong Y, Deng Y and Dai Q: Discriminative
clustering and feature selection for brain MRI segmentation. IEEE
Signal Process Lett. 22:573–577. 2015. View Article : Google Scholar
|
|
32
|
Kong Y, Li Y, Wu J and Shu H: Noise
reduction of diffusion tensor images by sparse representation and
dictionary learning. Biomed Eng Online. 15:52016. View Article : Google Scholar : PubMed/NCBI
|