Introduction
Ovarian cancer (OVC) is one of the most frequently
occurring types of gynecological cancer, with 204,000 new cases
identified each year and a five-year survival rate of 44% for all
stages of cancer development (1–4). More
than 70% of OVC cases are identified in the late stages of cancer
(stage III or IV according to the International Federation of
Gynecology and Obstetrics standard) (2). Despite improvements in anticancer
therapeutic methods, the mortality rate of OVC has not decreased
over the past 20 years due to difficulties in screening early
stages of the disease (5). Current
diagnostic methods include pelvic examination, ultrasonograms,
blood tests and tissue examination (6,7);
however, these methods have several limitations, including their
inability to diagnose OVC at an early stage or to detect
invasiveness. Thus, early and easy-to-use diagnostic methods for
OVC are required in order to increase the survival rate of patients
with OVC.
Several previous studies have investigated the use
of serological markers to accurately detect OVC. Such markers
include cancer antigen (CA) 125, human epididymis protein 4 (HE4),
and macrophage colony-stimulating factor (M-CSF) (5,8,10).
Serum CA125 and HE4 concentrations have been used as markers for
OVC using radioimmunoassay (6,9,10).
Furthermore, 70% of patients with OVC with various OVC cell lines
have high serum levels of M-CSF (11). While M-CSF is a monocyte-specific
cytokine for proliferation and differentiation, it also acts as a
growth factor for certain epithelial cancers in an autocrine and
paracrine manner (12). However,
these markers lack accuracy and have difficulty in early diagnosis.
For example CA125 was discovered 20 years ago and has been used
widely as an OVC marker since (13). However, CA125 has low specificity
and sensitivity during the early stages of OVC (6,9,14),
thus an ideal marker has yet to be elucidated.
The present study profiled low-mass metabolic
compounds in methanol/chloroform extracts obtained from the sera of
patients with OVC and healthy controls using matrix-assisted laser
desorption/ionization-time-of-flight (MALDI-TOF) mass spectrometry
and identified two molecules using tandem mass spectrometry (MS/MS)
analysis. The present study identified a differential pattern of
lysophosphatidylcholine (LPC) (16:0) and L-homocysteic acid (HCA)
in patients with OVC, and discusses the advantages of profiling
low-mass metabolic compounds for screening OVC.
Materials and methods
Serum from patients with OVC
All participants provided written informed consent
and the study protocol was approved by the Institutional Review
Board of the Ewha Womans University (Seoul, Korea). A total of 142
patients and 100 control participants were enrolled in the present
study (Table I).
 | Table ICharacteristics of the patients with
ovarian cancer and the control participants included in the present
study. |
Table I
Characteristics of the patients with
ovarian cancer and the control participants included in the present
study.
| Parameter | Ovarian cancer
(n=142) | Control (n=100) |
|---|
| Age, mean ± SD | 52±13 | 51±13 |
| Stage, n (%) |
| IA | 37 (26.1) | - |
| IB | 2 (1.4) | - |
| IC | 12 (8.5) | - |
| IIA | 0 (0.0) | - |
| IIB | 1 (0.7) | - |
| IIIA | 0 (0.0) | - |
| IIIB | 1 (0.7) | - |
| IIIC | 77 (54.2) | - |
| IV | 12 (8.5) | - |
| Histology, n (%) |
| Serous | 90 (63.4) | - |
| Mucinous | 23 (16.2) | - |
| Endometrioid | 8 (5.6) | - |
| Clear cell | 11 (7.7) | - |
| Transitional
cell | 7 (4.9) | - |
| Mixed | 3 (2.1) | - |
| Grade, n (%) |
| Mild | 24 (16.9) | - |
| Moderate | 35 (24.6) | - |
| Severe | 83 (58.5) | - |
MALDI-TOF analysis for collecting
low-mass ions (LMIs) in serum
Four times volume of methanol/chloroform (2:1; v/v)
was incubated with 25 μl serum for 10 min at room temperature
subsequent to vortexing. The solution was centrifuged at 6,000 × g
for 10 min at 4°C. The supernatant was then dried in a concentrator
for 1 h and resolved in 30 μl 50% acetonitrile/0.1% trifluoroacetic
acid (TFA) using a vortex for 30 min.
Methanol/chloroform extract was mixed (1:12; v/v)
with an α-cyano-4-hydroxycinnamic acid solution in 50%
acetonitrile/0.1% TFA. A total of 1 μl of the solution was then
spotted on the MALDI target for analysis. Individual mass spectra
from the serum extracts of the patients with OVC were obtained
using a 4700 Proteomics Analyzer (Ab Sciex, Framingham, MA, USA).
The mass-spectral data represent the average of 20 accumulated
spectra. All individual peak areas were normalized to the total
area up to 2,500 m/z. To minimize experimental error, variable
factors including focus mass, laser intensity, target plate and
data acquisition time were tested. The ideal focus mass and laser
intensity were fixed at 500 m/z and 5,000, respectively (15). With the fixed focus mass and laser
intensity, one sample was analyzed six times under the different
extraction and data acquisition times.
LMI selection and statistical
analysis
All MALDI mass spectra, formatted as t2d files, were
analyzed using MarkerView™ software, version 1.2 (Applied
Biosystems/MDS Sciex, Toronto, ON, Canada). The optimized
parameters used to compare LMI mass peaks in the serum extracts
obtained from the patients with OVC were as follows: Mass
tolerance, 100 ppm; minimum required response, 100; maximum number
of peaks, 5000; and normalization, by total area sums. Subsequent
to collecting the data using MALDI mass spectra, principal
component analysis-discriminant analysis (PCA-DA) and t-tests were
used to select LMIs with differential peak intensities in serum
extracts from patients with OVC.
Measurement of HCA in serum
The level of HCA in the sera was measured using an
ELISA kit (Cusabio Biotech, Co., Ltd., Wuhan, China) according to
the manufacturer’s instructions.
Measurement of LPC (16:0) in serum
A nanoflow high-performance liquid chromatography
instrument (Easy nLC; Thermo Scientific, Inc., Waltham, MA, USA)
was coupled to an LTQ mass spectrometer (Thermo Scientific, Inc.).
A PepMap® RSLC, C18, 2 μm, 100 Å analytical column (50
cm; inner diameter, 75 μm; Dianex Corporation, Sunnyvale, CA, USA)
was used. Reversed phase chromatography was performed using a
binary buffer system consisting of 0.1% formic acid (buffer A) and
acetonitrile in 0.1% formic acid (buffer B). The sample was
separated using a linear gradient of 3–50% buffer B at a flow rate
of 300 nl/min. The gradient time was 90 min and the total run time
for the liquid chromatography MS/MS was 120 min. The extracted LPC
was analyzed using the selected reaction monitoring (SRM) mode. The
SRM transitions for the LPC lipid were set to m/z 496.4 to 183.96
and m/z 496.4 to 478.33. The SRM data were acquired within fragment
ion mass ± 2 m/z and each SRM transition and respective retention
time was validated for specific LPC. Data were processed through
integrating the appropriate peaks for LPC, followed by comparing
the calculated peak areas using two-paired t-tests.
Statistical analysis
Between-group differences were calculated using the
student’s t-test and within-group correlations were calculated
using Spearman’s rank correlation coefficient. P<0.05 was
considered to indicate a statistically significant difference.
Results
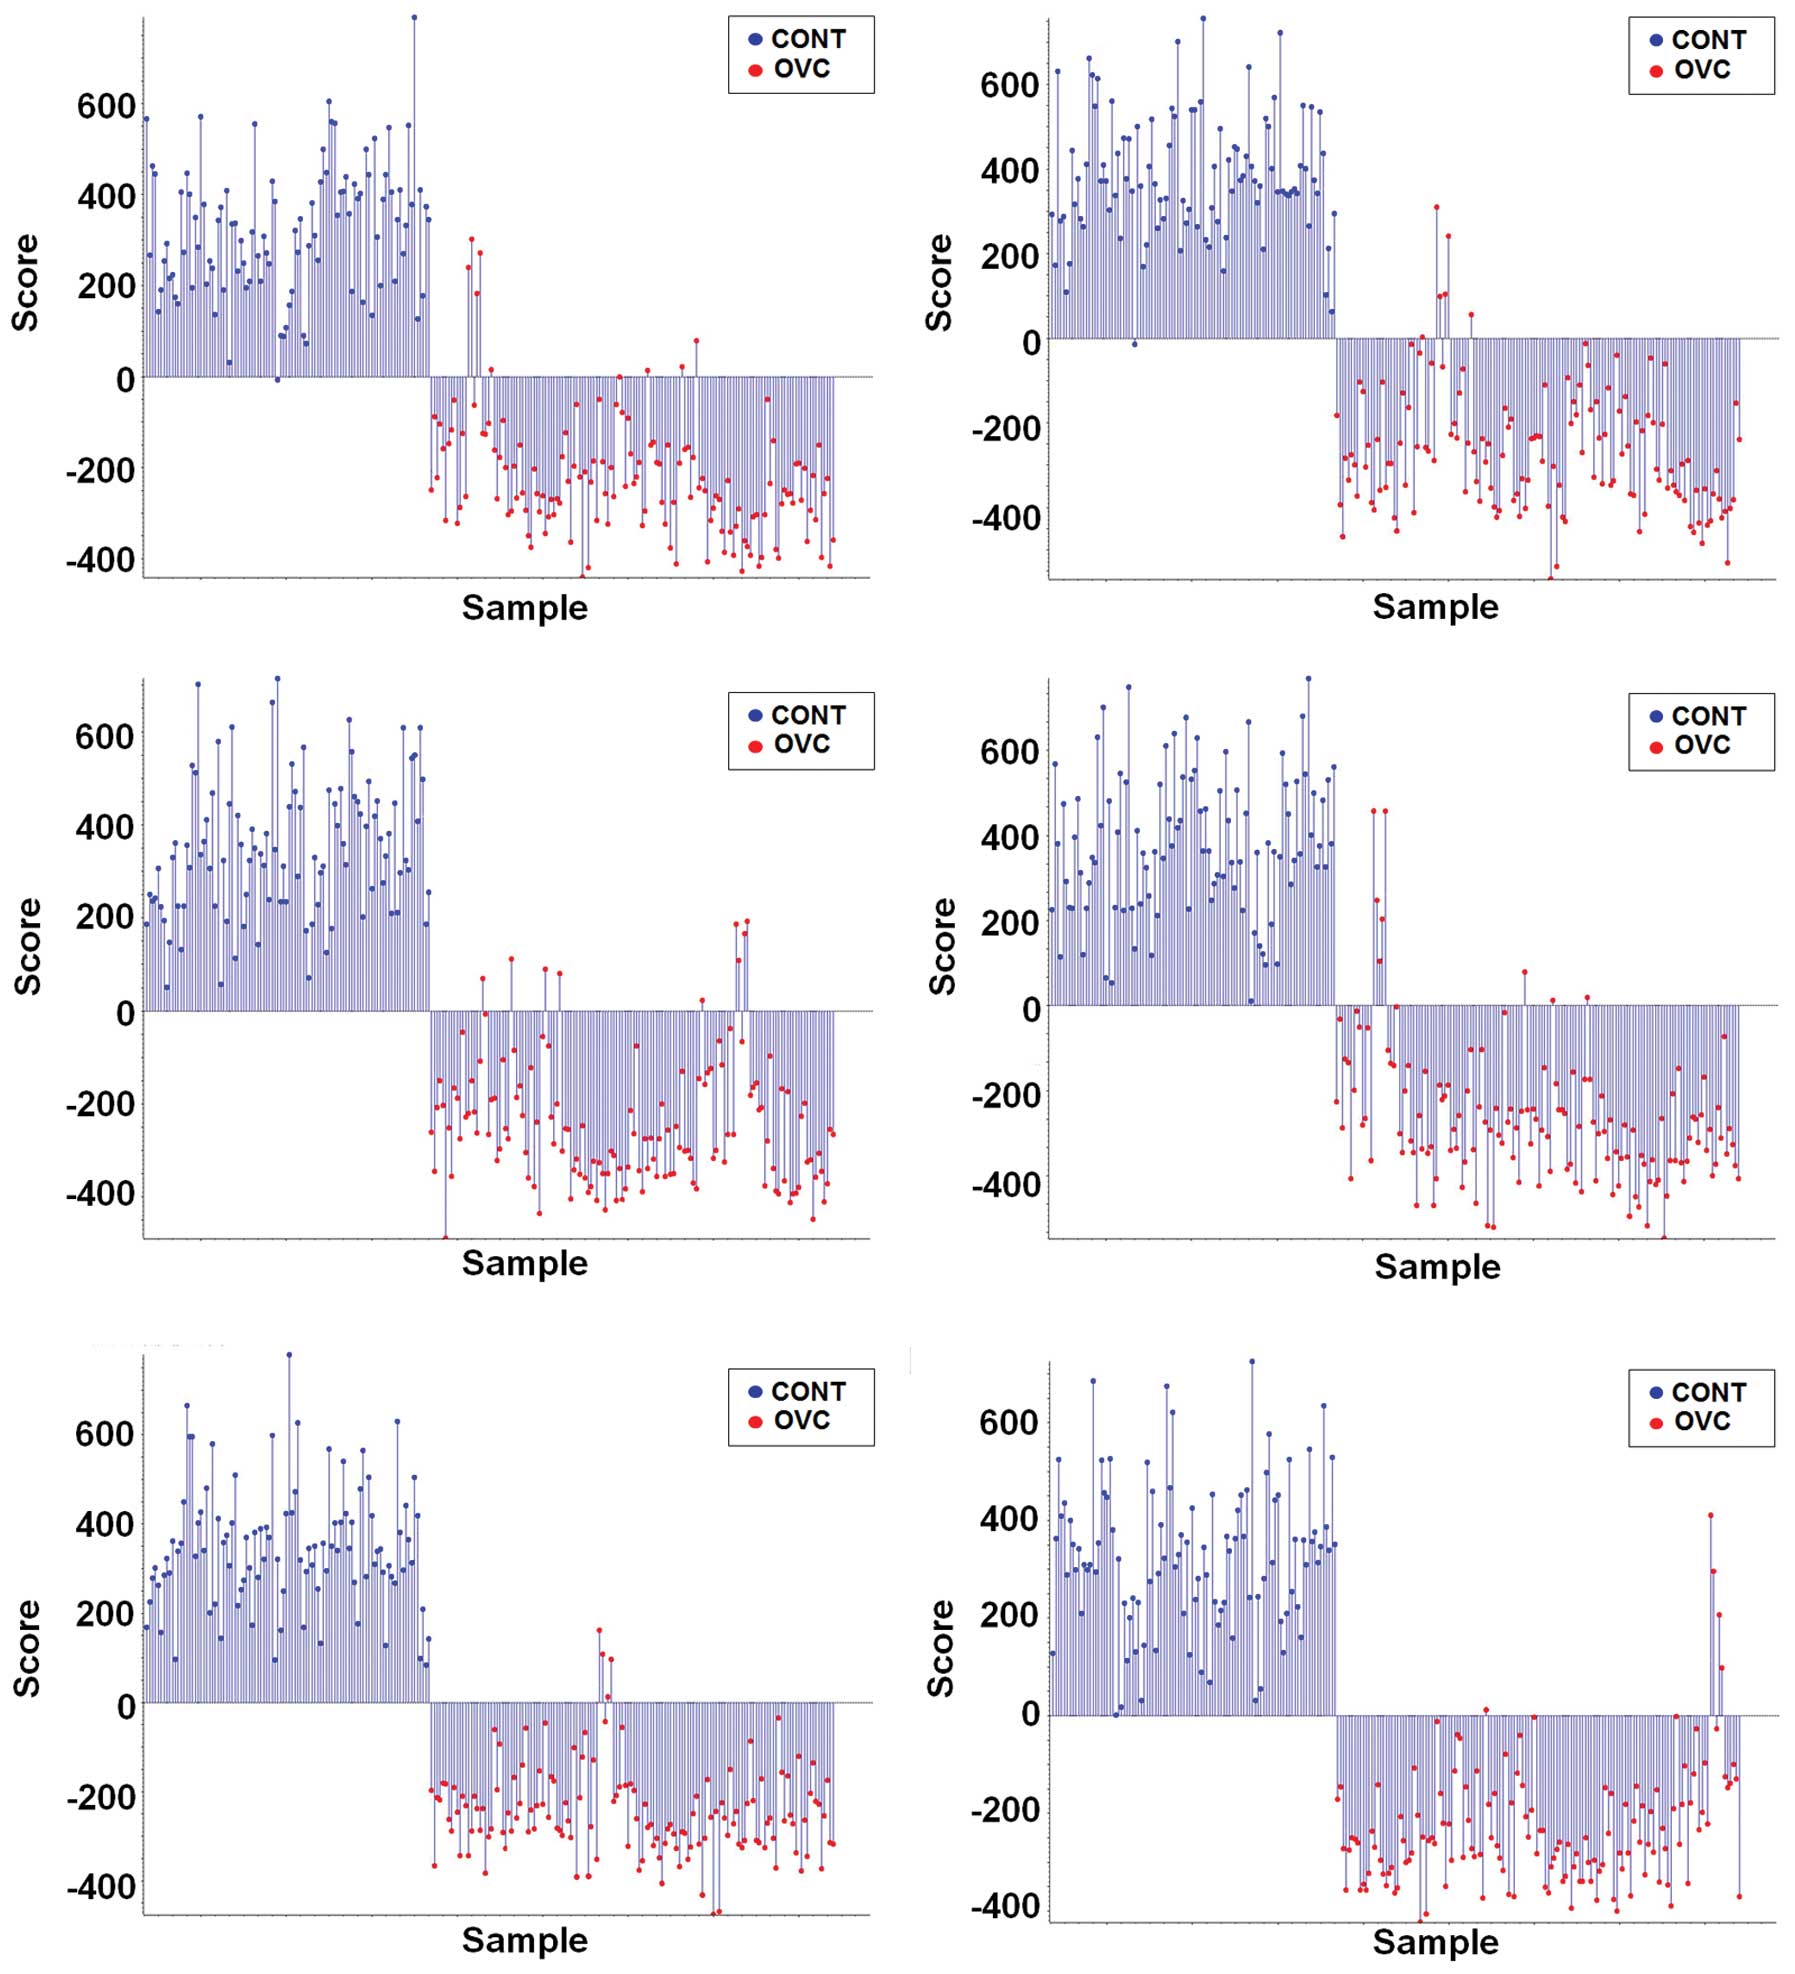
Differential LMIs in methanol/chloroform
extracts from the sera of patients with OVC
Data (m/z and mass peak intensity) regarding the
LMIs with mostly <1,000 m/z collected from the sera extracts of
100 healthy control individuals and 142 patients with OVC were used
in the PCA-DA in order to determine whether differential LMI
patterns exist in the sera of patients with OVC. Supervised PCA-DA
using LMI data obtained from six repeats of MALDI-TOF analysis
discriminated the patients with OVC from the control individuals
(Fig. 1).
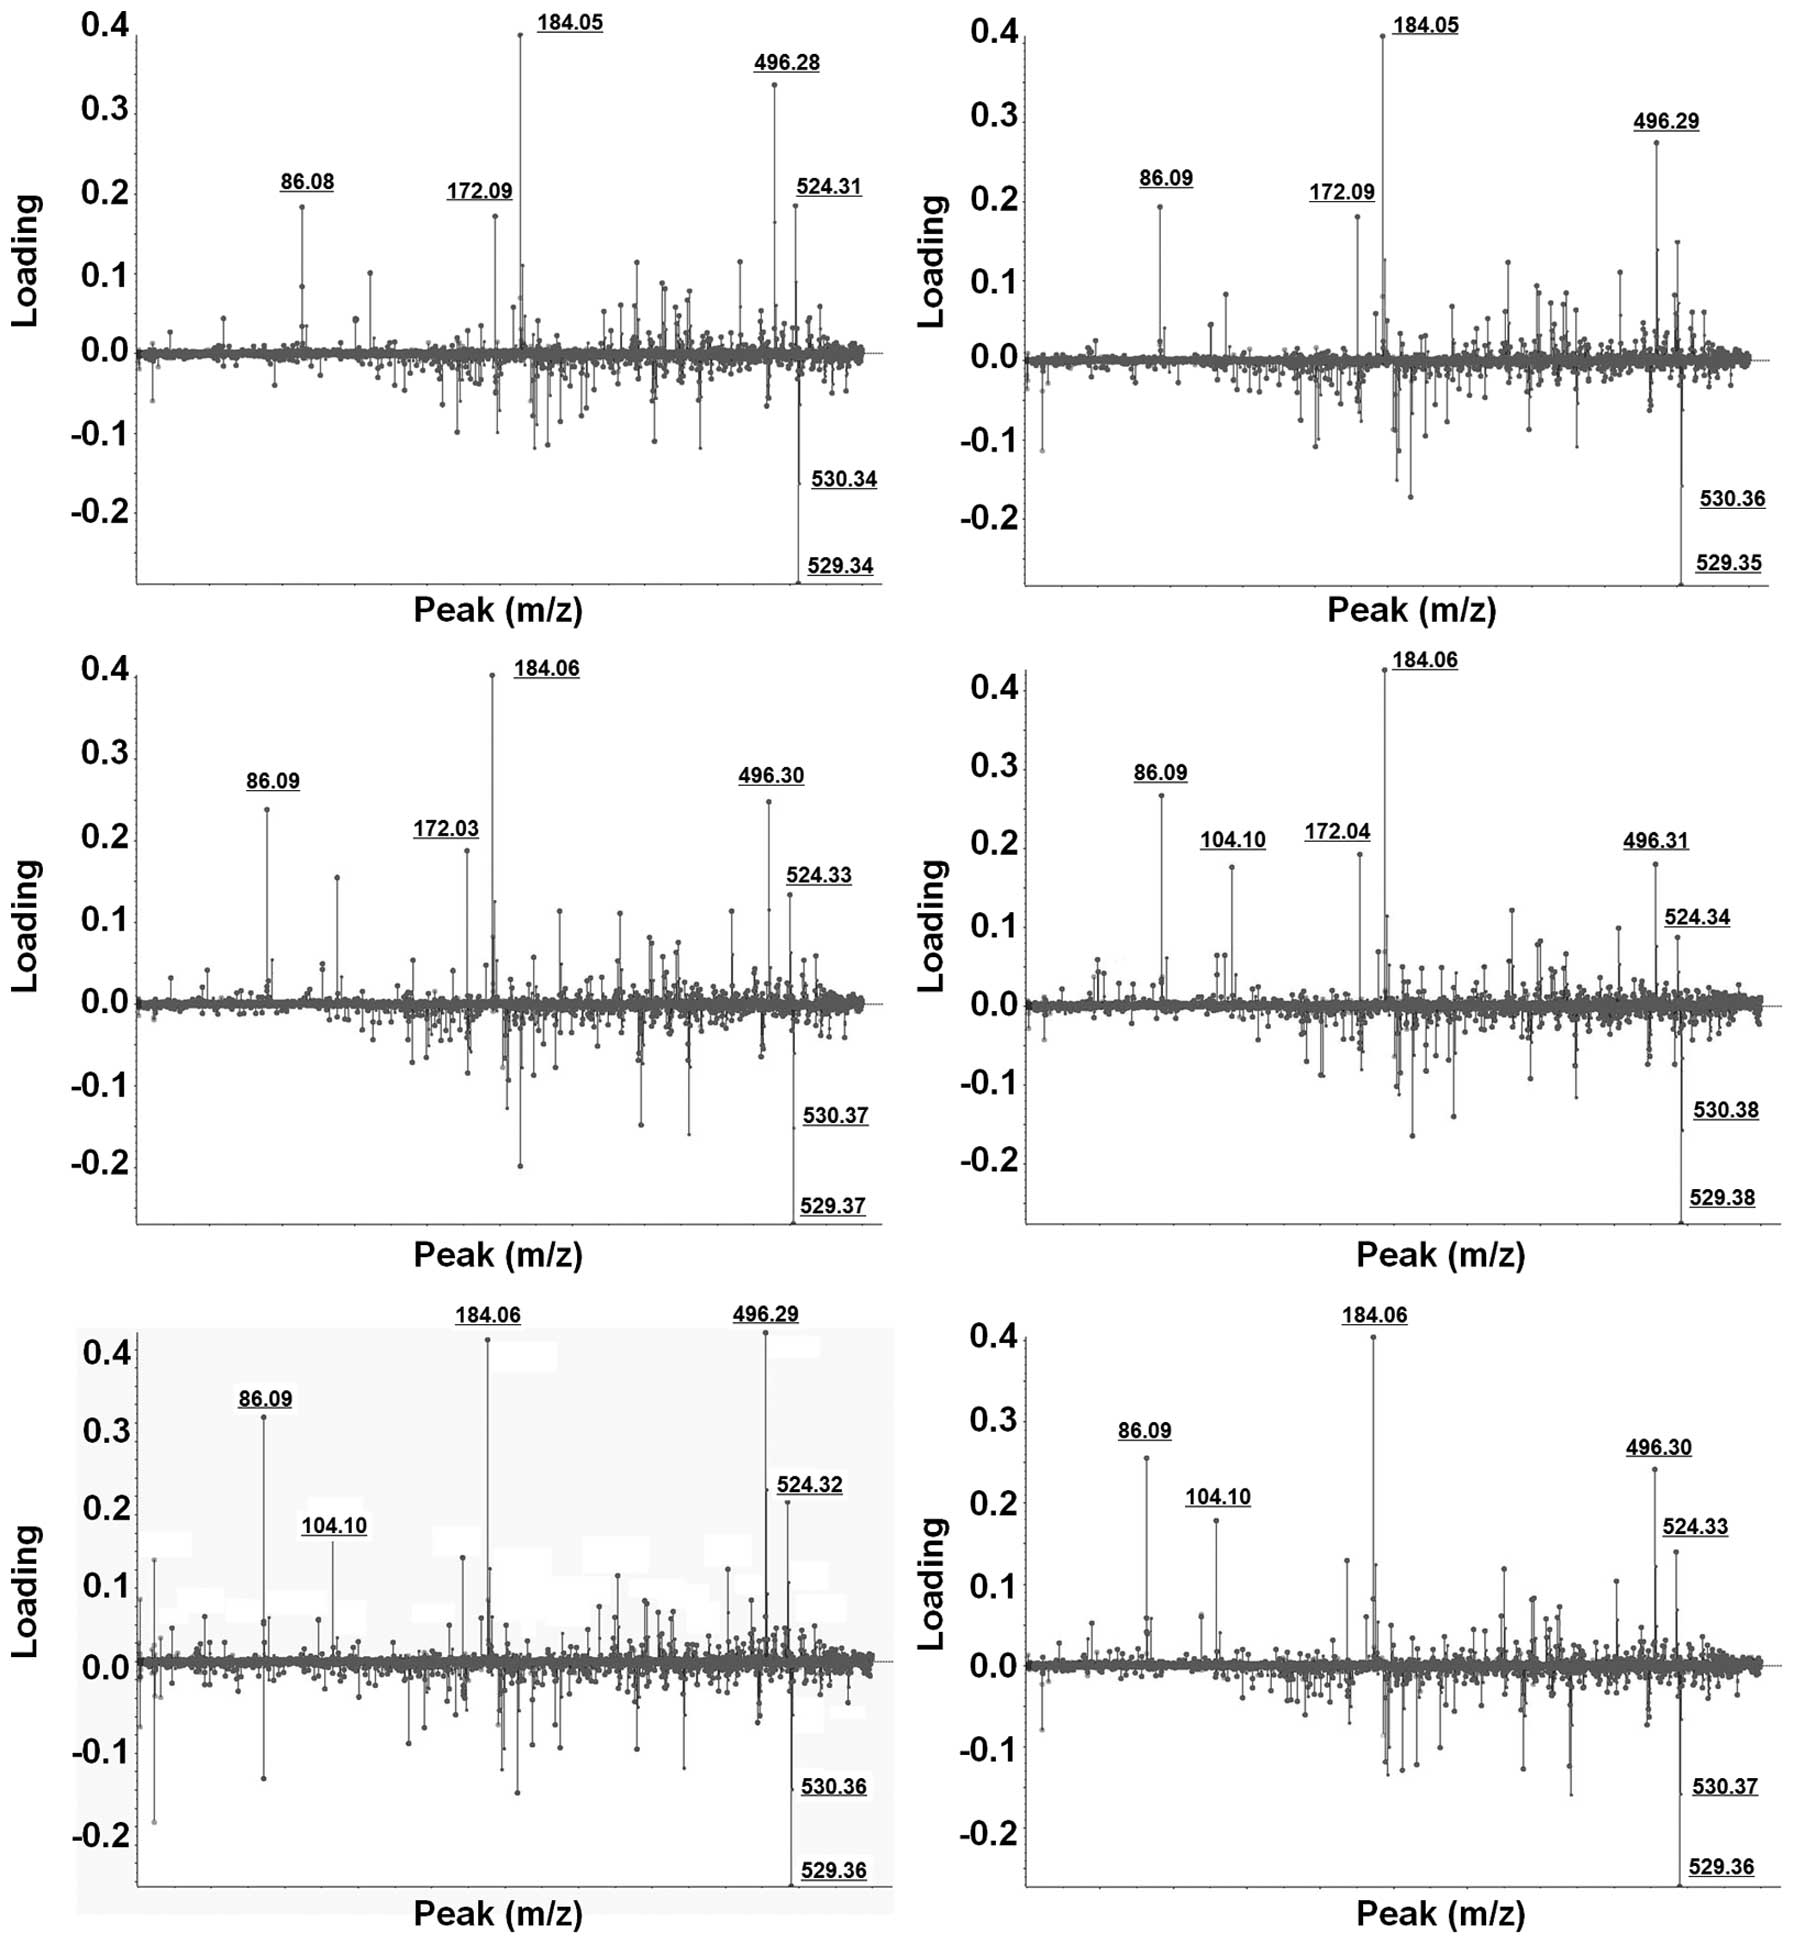
Selection and identification of LMIs
showing a differential pattern in patients with OVC
Weighting factors (loading value) for all individual
LMIs were calculated using PCA-DA (Fig.
2). LMIs which consistently exhibited higher weighting factors
in six different PCA-DA analyses were selected. Despite slight mass
shifting, LMIs with 184.05 and 496.30 m/z showed strong
discriminating power for OVC screening (Fig. 2).
In order to identify LMIs with 184.05 and 496.30
m/z, candidate metabolites within ± 0.05 m/z difference were
identified using the Human Metabolome Database (HMDB). Ten
candidate metabolites with 184.05±0.05 m/z were identified
(Table II). Among the candidate
metabolites, the metabolic description of HCA in the HMDB was most
correlated with OVC, and LPC (16:0) was the only metabolite with
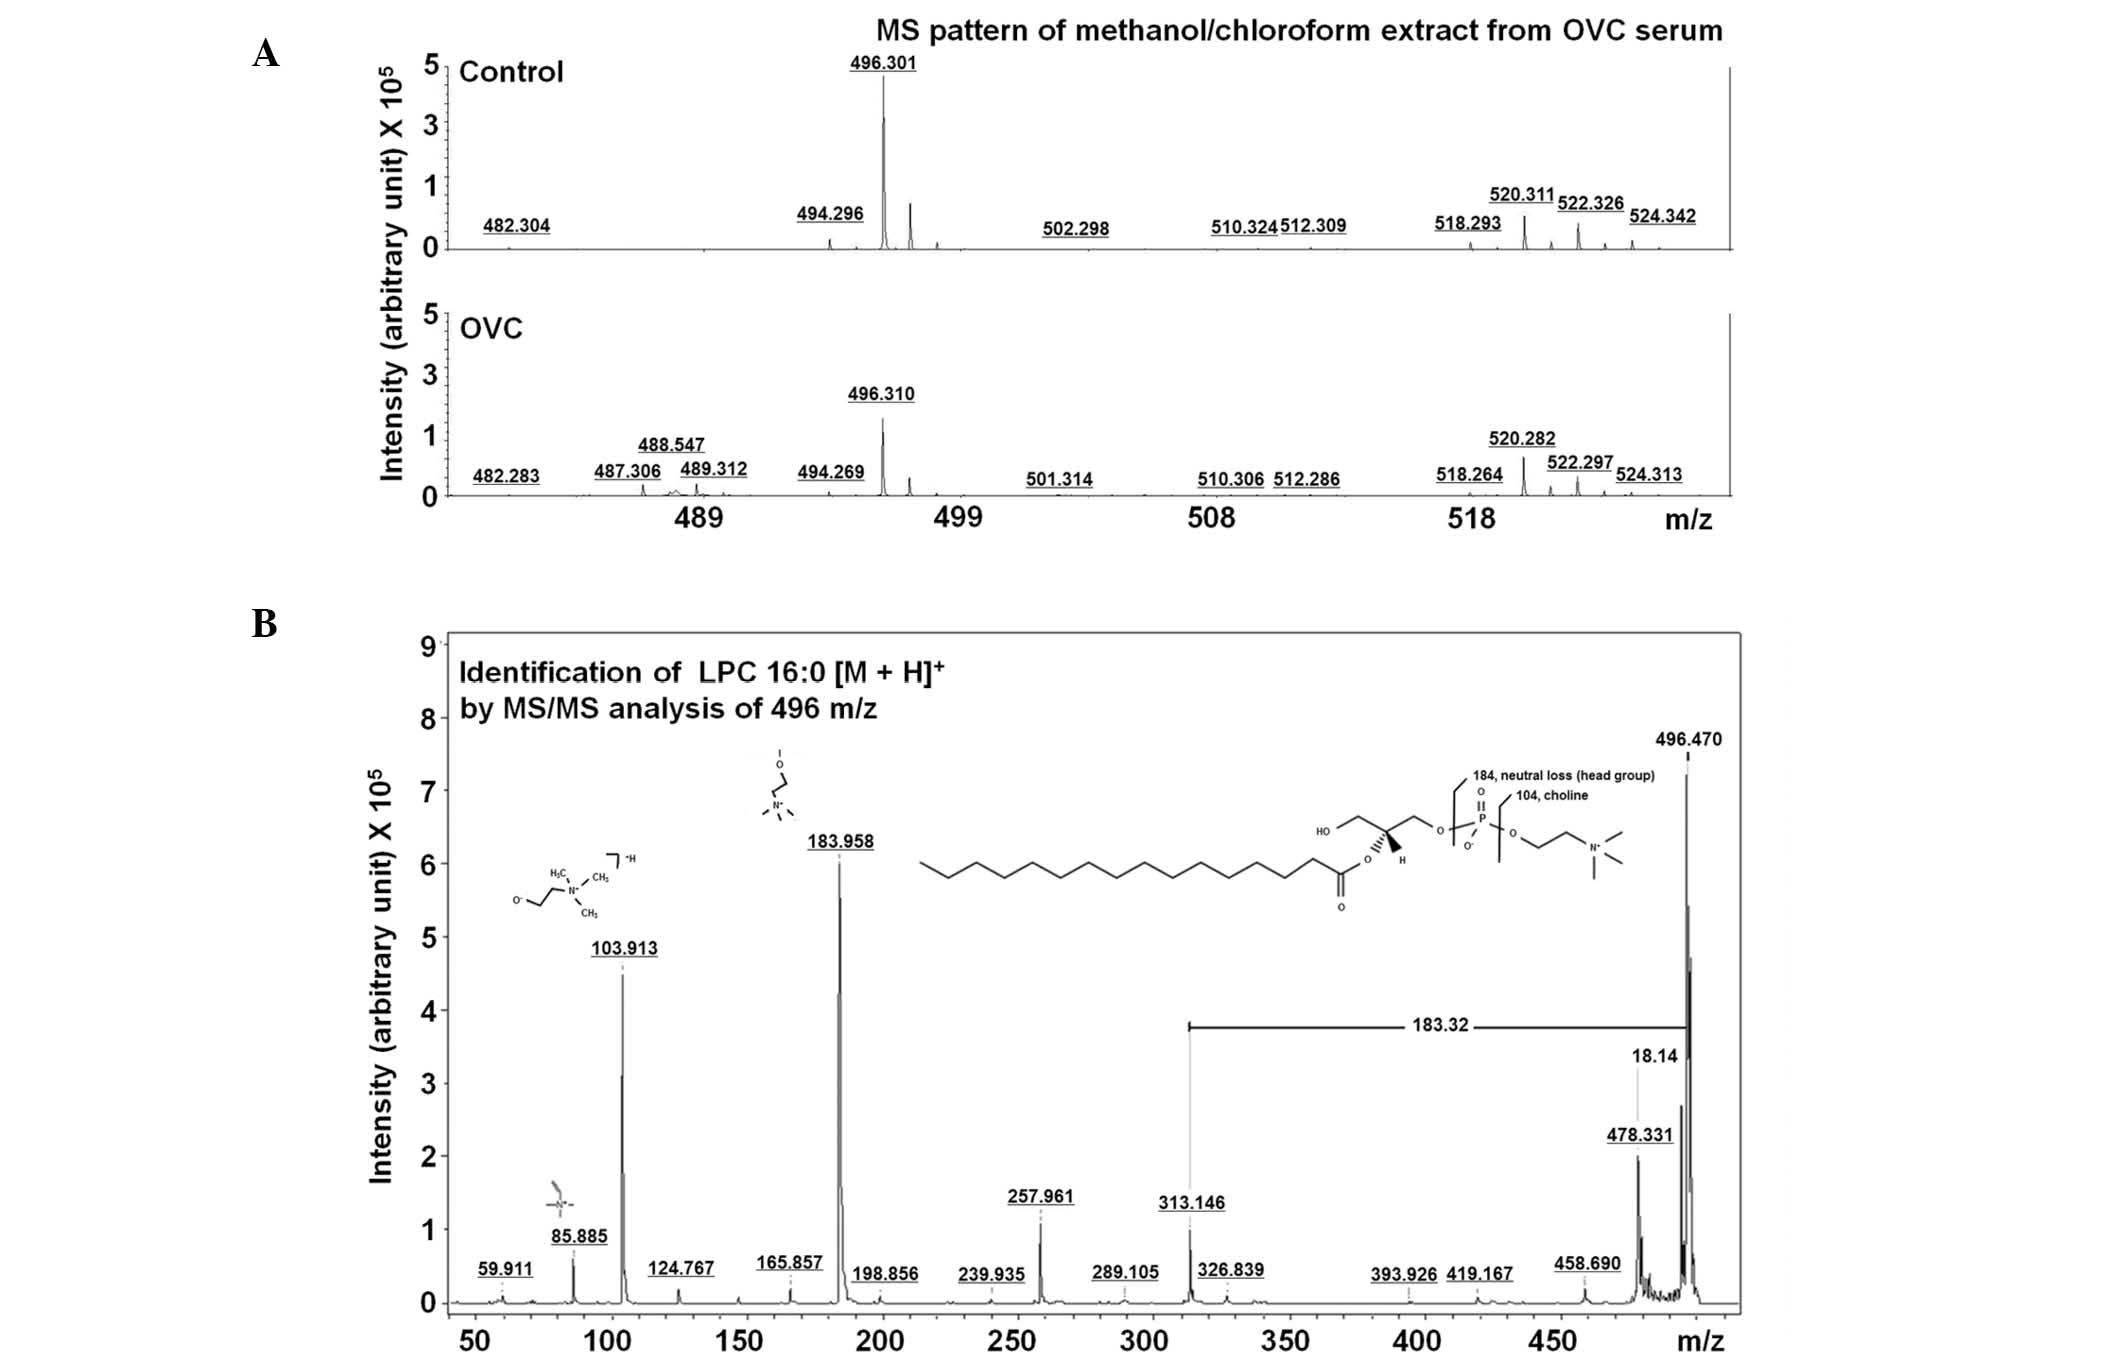
496.30±0.05 m/z (Table II). The
LMI with 496.30 m/z on the mass spectrum (Fig. 3A) was further analyzed using MS/MS
analysis and was identified to be LPC (16:0) through comparing the
MS/MS spectrum of lipid compounds (Fig.
3B).
| Table IICandidate metabolites with
H+ adducts in human metabolome database. |
Table II
Candidate metabolites with
H+ adducts in human metabolome database.
| Compound | Name | Adduct | Adduct MW (Da) | Compound MW (Da) | Delta |
|---|
| Metabolites with
184.05±0.05 m/z |
| HMDB00017 | 4-Pyridoxic acid | M+H | 184.06043 | 183.05316 | 0.010434 |
| HMDB02205 | L-Homocysteic
acid | M+H | 184.02742 | 183.02014 | 0.022581 |
| HMDB11657 |
2,6-Diamino-4-hydroxy-5-N-
ethylformamidopyrimidine | M+H | 184.08290 | 183.07563 | 0.032901 |
| HMDB33141 |
2-Amino-α-carboline | M+H | 184.08692 | 183.07965 | 0.036923 |
| HMDB29723 | Saccharin | M+H | 184.00629 | 182.99901 | 0.043710 |
| HMDB02832 |
Methylnoradrenaline | M+H | 184.09682 | 183.08954 | 0.046819 |
| HMDB15652 | Levonordefrin | M+H | 184.09682 | 183.08954 | 0.046819 |
| HMDB00819 | Normetanephrine | M+H | 184.09682 | 183.08954 | 0.046819 |
| HMDB29455 | Ginkgotoxin | M+H | 184.09682 | 183.08954 | 0.046819 |
| HMDB00068 | Epinephrine | M+H | 184.09682 | 183.08954 | 0.046819 |
| Metabolites with
496.30±0.05 m/z |
| HMDB10382 | LPC (16:0) | M+H | 496.33977 | 495.33249 | 0.039765 |
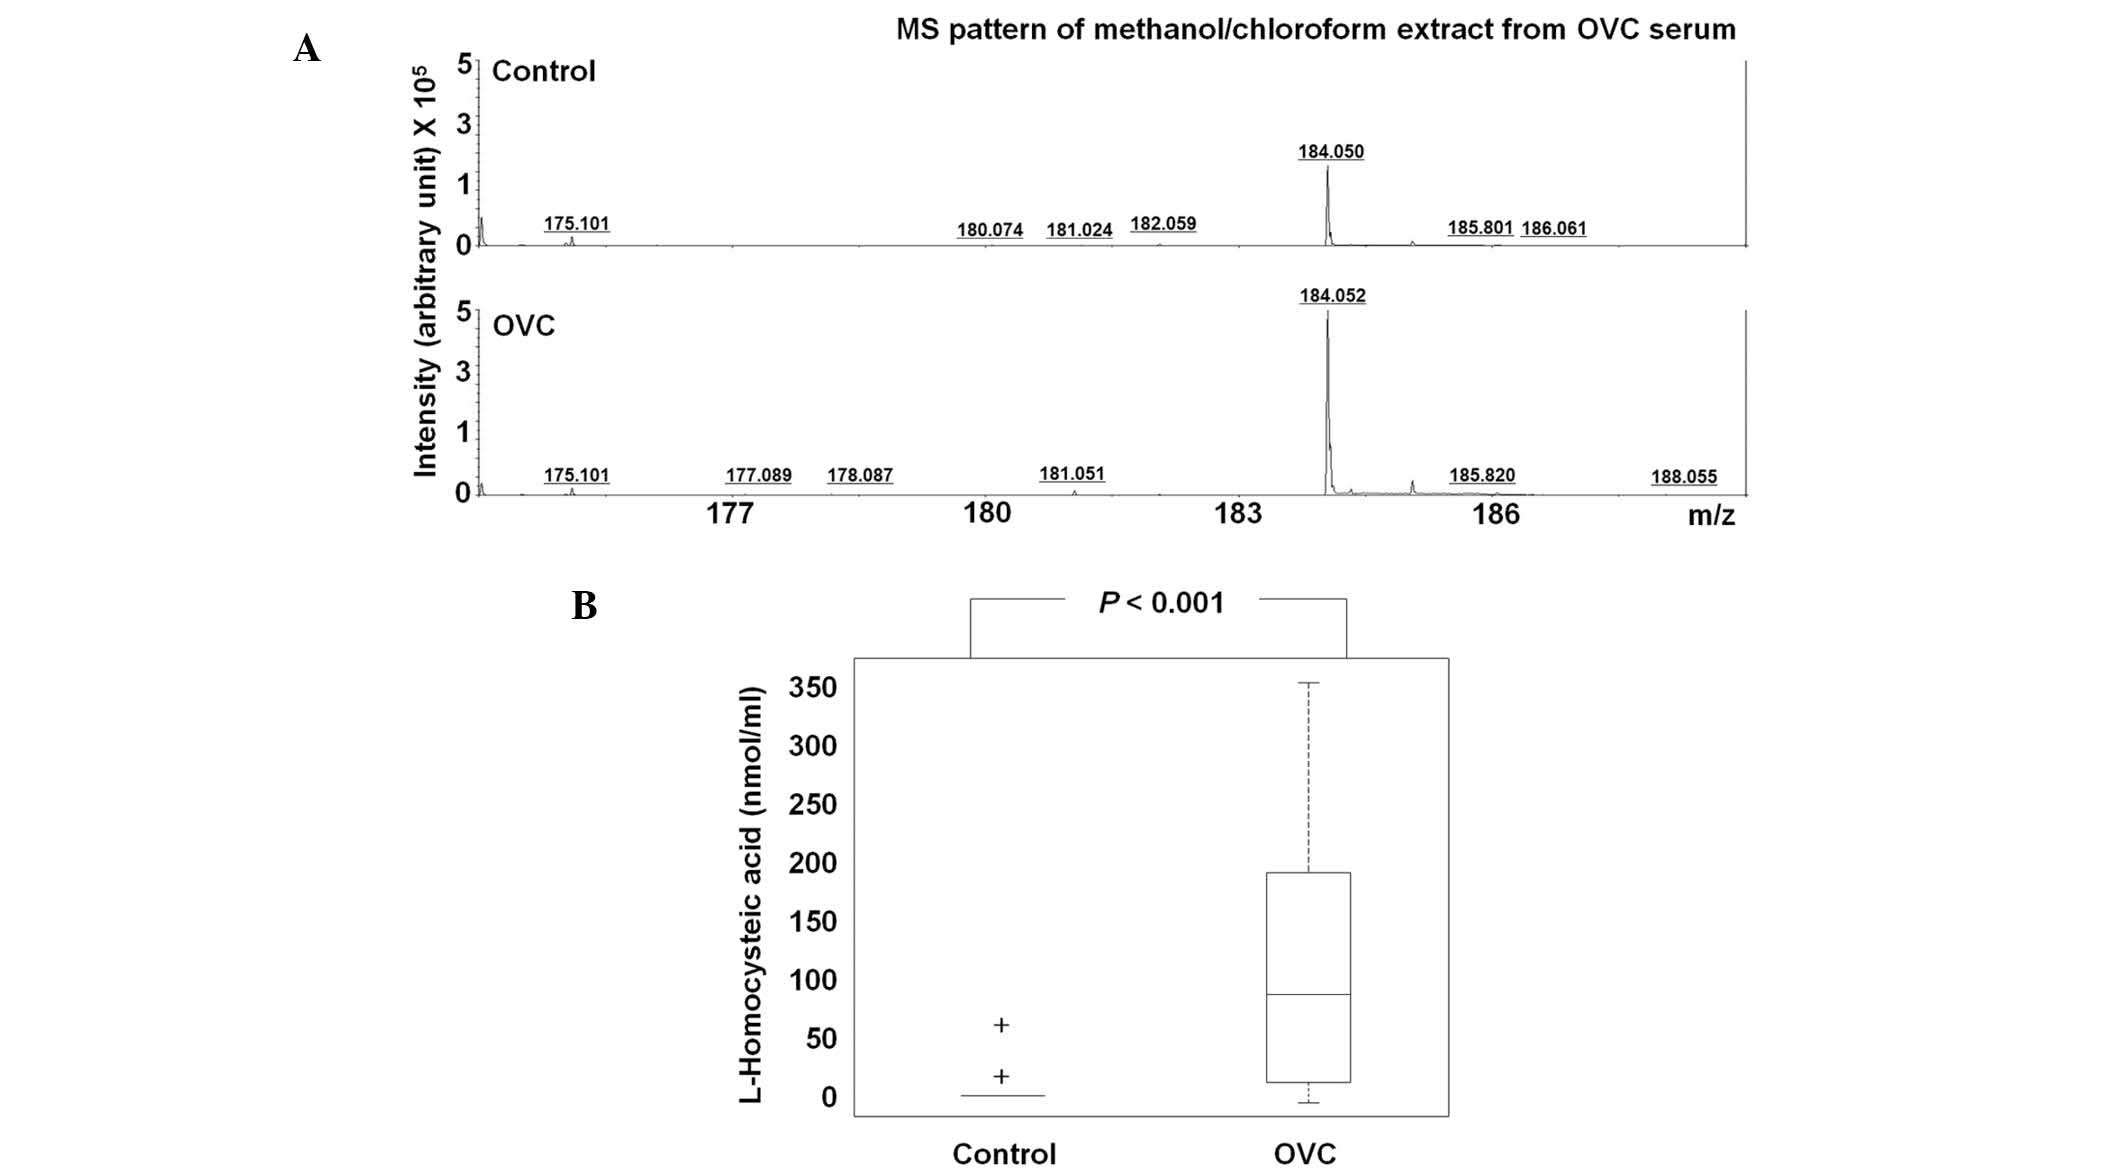
Differential level of HCA and LPC
(16:0)
The level of HCA was assessed in 63 control
participants and 25 patients with OVC (Table III). Due to insufficient amounts
of sera, HCA was not detected in 59/63 of the controls, but the
majority of cases of OVC (16/25) exhibited significantly higher
levels of HCA, with the mean HCA concentration in the sera of the
control individuals being 0.16 nmol/ml compared with 0.60 nmol/ml
in the patients with OVC (P<0.001; Fig. 4A). At the cutoff of 10 nmol/ml, the
sensitivity and specificity of HCA were 64.0 and 96.9%,
respectively; thus, HCA may have potential for OVC screening
(Table III).
| Table IIIL-homocysteic acid levels in the sera
of 63 control participants and 25 patients with OVC. |
Table III
L-homocysteic acid levels in the sera
of 63 control participants and 25 patients with OVC.
| Control | OVC |
|---|
|
|
|---|
| Sample no. | Conc. (nmol/ml) | Sample no. | Conc. (nmol/ml) | Sample no. | Conc. (nmol/ml) | Sample no. | Conc. (nmol/ml) |
|---|
| Control 01 | 0.000 | Control 26 | 0.000 | Control 51 | 0.000 | OVC 01 | 25.991 |
| Control 02 | 0.000 | Control 27 | 0.000 | Control 52 | 0.000 | OVC 02 | 0.000 |
| Control 03 | 0.000 | Control 28 | 0.000 | Control 53 | 48.750 | OVC 03 | 109.620 |
| Control 04 | 0.000 | Control 29 | 0.000 | Control 54 | 0.000 | OVC 04 | 0.000 |
| Control 05 | 0.000 | Control 30 | 0.000 | Control 55 | 0.000 | OVC 05 | 20.037 |
| Control 06 | 0.000 | Control 31 | 0.000 | Control 56 | 0.000 | OVC 06 | 0.000 |
| Control 07 | 0.000 | Control 32 | 0.000 | Control 57 | 0.000 | OVC 07 | 0.000 |
| Control 08 | 0.000 | Control 33 | 0.000 | Control 58 | 0.000 | OVC 08 | 0.000 |
| Control 09 | 0.000 | Control 34 | 0.000 | Control 59 | 0.000 | OVC 09 | 116.759 |
| Control 10 | 0.000 | Control 35 | 0.000 | Control 60 | 0.000 | OVC 10 | 79.676 |
| Control 11 | 0.000 | Control 36 | 0.111 | Control 61 | 0.000 | OVC 11 | 61.083 |
| Control 12 | 0.000 | Control 37 | 0.000 | Control 62 | 0.000 | OVC 12 | 172.352 |
| Control 13 | 0.000 | Control 38 | 0.000 | Control 63 | 0.000 | OVC 13 | 286.398 |
| Control 14 | 0.000 | Control 39 | 0.000 | | | OVC 14 | 203.306 |
| Control 15 | 0.000 | Control 40 | 0.000 | | | OVC 15 | 0.000 |
| Control 16 | 0.000 | Control 41 | 0.000 | | | OVC 16 | 175.713 |
| Control 17 | 0.000 | Control 42 | 0.000 | | | OVC 17 | 175.676 |
| Control 18 | 0.000 | Control 43 | 0.000 | | | OVC 18 | 74.824 |
| Control 19 | 4.981 | Control 44 | 0.000 | | | OVC 19 | 133.407 |
| Control 20 | 0.000 | Control 45 | 49.750 | | | OVC 20 | 344.787 |
| Control 21 | 0.000 | Control 46 | 0.000 | | | OVC 21 | 206.537 |
| Control 22 | 0.000 | Control 47 | 0.000 | | | OVC 22 | 0.000 |
| Control 23 | 0.000 | Control 48 | 0.000 | | | OVC 23 | 0.000 |
| Control 24 | 0.000 | Control 49 | 0.000 | | | OVC 24 | 72.565 |
| Control 25 | 0.000 | Control 50 | 0.000 | | | OVC 25 | 0.000 |
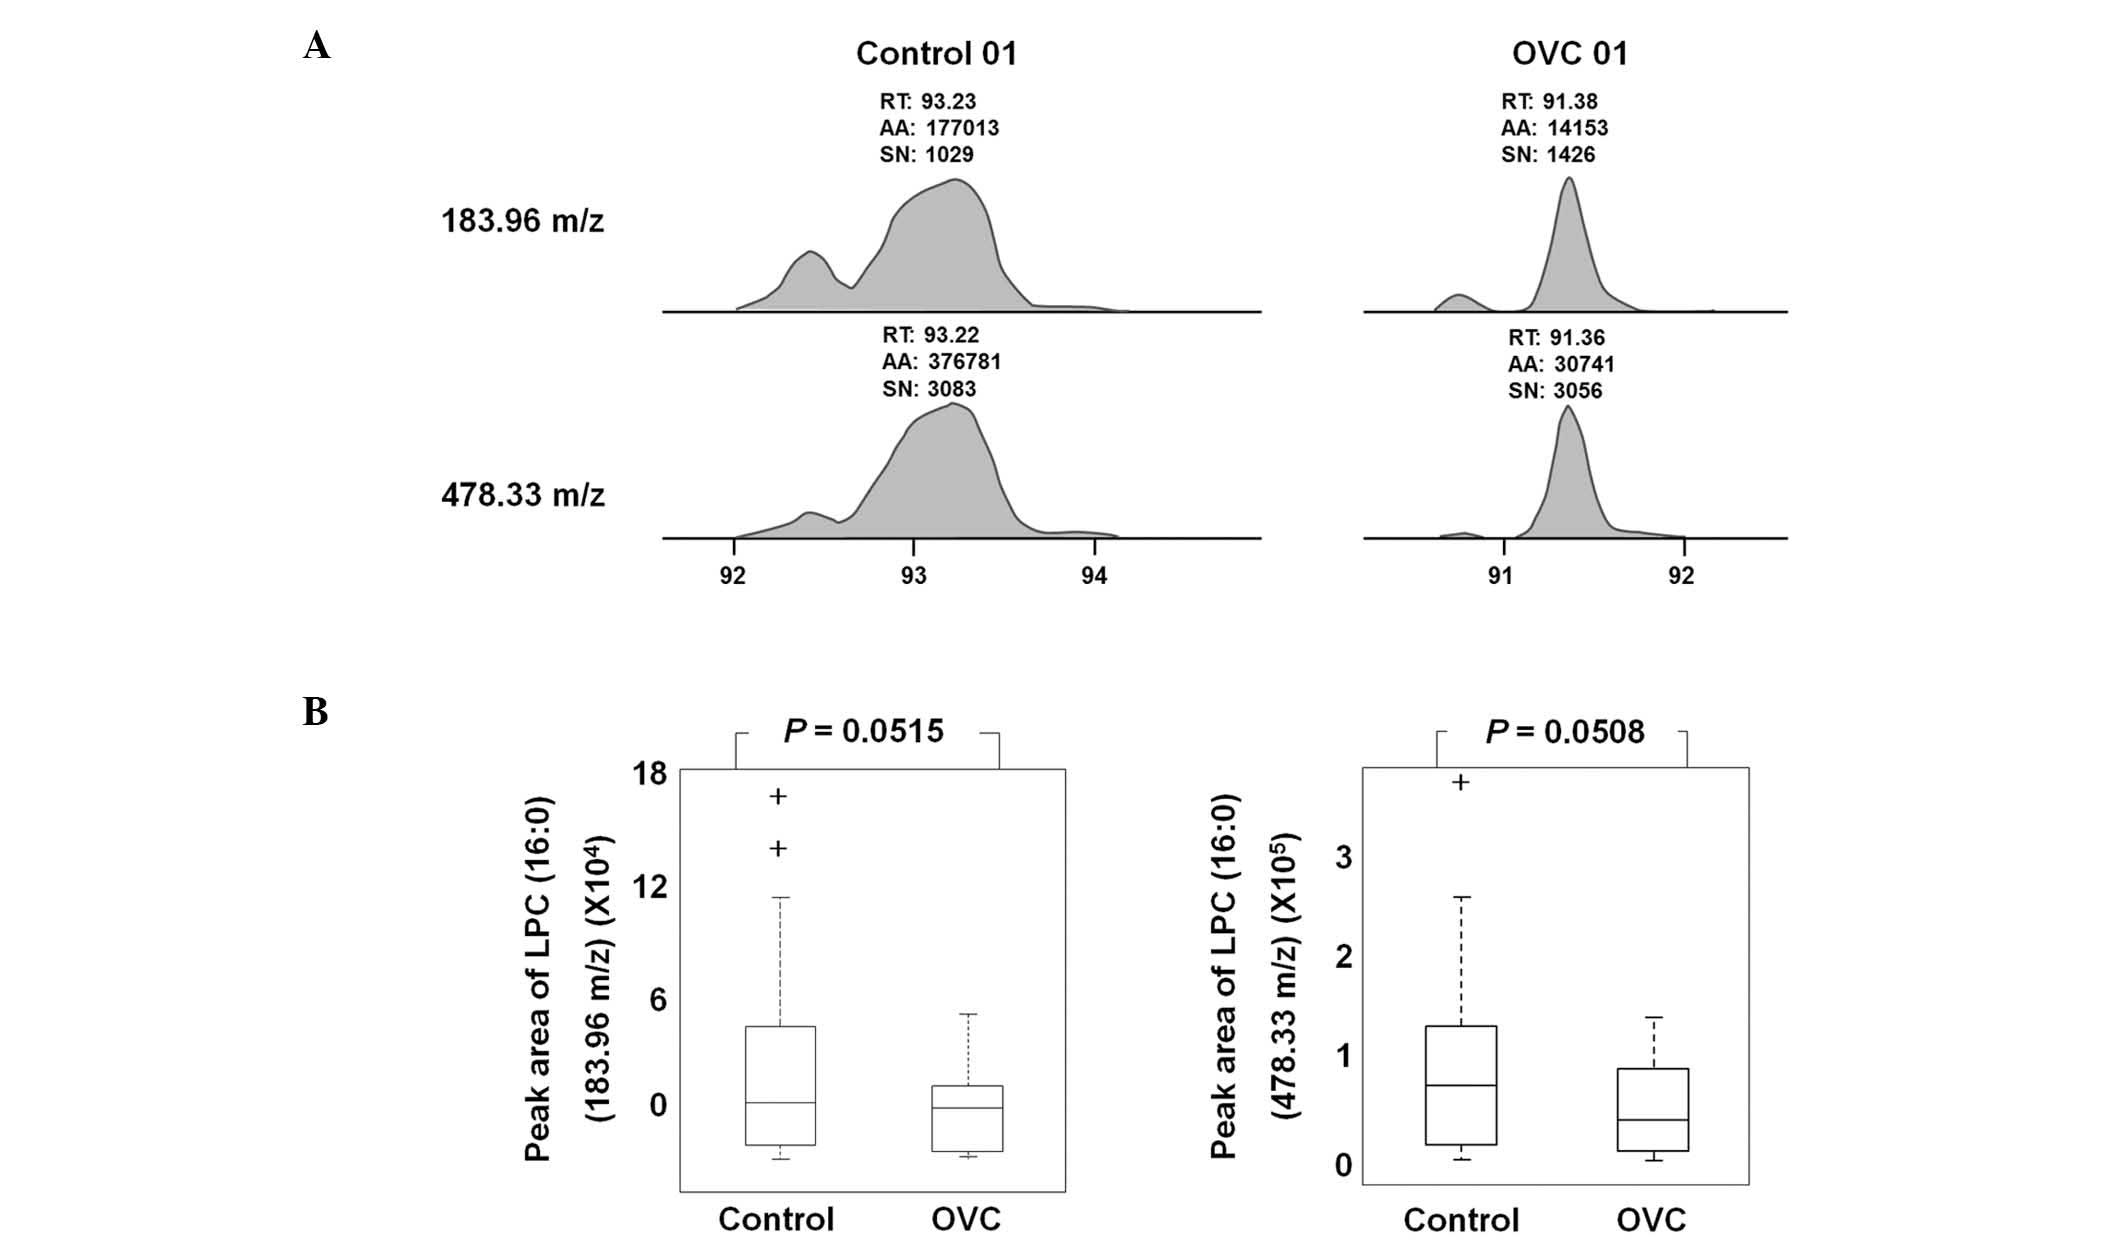
LPC (16:0) was detected as an LMI with either 183.96
or 478.33 m/z in LC-MS/MS analysis (Fig. 5A). A sufficient amount of sera was
obtained from 19 control individuals and 20 patients with OVC to
quantify the level of LPC (16:0) and peak areas of 183.96 and
478.33 m/z were determined (Table
IV). The peak area was variable depending on the individual
samples, but the level of LPC (16:0), represented by peak areas of
183.96 and 478.33 m/z, was observed to be lower in the sera of
patients with OVC compared with that of the controls (P=0.0515 and
0.0508, respectively; Fig. 5B).
| Table IVLevel of peak area in the sera of 19
control participants and 25 patients with OVC. |
Table IV
Level of peak area in the sera of 19
control participants and 25 patients with OVC.
| Control | OVC |
|---|
|
|
|---|
| Sample no. | 183.96 m/z | 478.33 m/z | Sample no. | 183.96 m/z | 478.33 m/z |
|---|
| Control 01 | 177013 | 376781 | OVC 01 | 14153 | 30741 |
| Control 02 | 69756 | 137502 | OVC 02 | 5859 | 13745 |
| Control 03 | 124532 | 272566 | OVC 03 | 7971 | 15462 |
| Control 05 | 25420 | 66997 | OVC 04 | 8396 | 19590 |
| Control 06 | 54801 | 128622 | OVC 05 | 20228 | 53475 |
| Control 07 | 37451 | 84449 | OVC 06 | 16271 | 39552 |
| Control 08 | 83913 | 172936 | OVC 07 | 32559 | 69217 |
| Control 09 | 24680 | 64998 | OVC 08 | 25213 | 60890 |
| Control 10 | 24203 | 53327 | OVC 09 | 12003 | 30286 |
| Control 11 | 154157 | 376840 | OVC 10 | 26121 | 59037 |
| Control 12 | 22627 | 51433 | OVC 11 | 33905 | 51453 |
| Control 13 | 48125 | 102808 | OVC 12 | 51453 | 115718 |
| Control 14 | 52038 | 109721 | OVC 13 | 40846 | 87236 |
| Control 15 | 45143 | 104486 | OVC 14 | 68258 | 149730 |
| Control 16 | 10764 | 24637 | OVC 15 | 49476 | 114076 |
| Control 17 | 4301 | 10910 | OVC 16 | 53280 | 132663 |
| Control 18 | 6538 | 15969 | OVC 17 | 49151 | 109521 |
| Control 19 | 5664 | 8595 | OVC 18 | 40636 | 84156 |
| Control 20 | 1894 | 3979 | OVC 19 | 35516 | 78462 |
| | | OVC 20 | 59084 | 130141 |
| | | OVC 21 | 38533 | 80979 |
| | | OVC 22 | 14389 | 31289 |
| | | OVC 23 | 7779 | 15915 |
| | | OVC 24 | 35065 | 83313 |
| | | OVC 25 | 12879 | 29815 |
Clinicopathological relevance of LPC
(16:0) and HCA in OVC
Increased LPC (16:0) was found to be significantly
correlated with tumor grade (P=0.045). Although not statistically
significant, possibly due to the small number of samples, HCA and
LPC (16:0) were found to be correlated with stage and tumor
histology (data not shown).
Discussion
Despite previous investigations, a diagnostic marker
for the early diagnosis of OVC has yet to be elucidated. Previous
markers which have been used for OVC, including CA125 and HE4, only
detected OVC at the late stages of cancer development and lacked
efficiency during early tumor growth (13,14).
Metabolic compounds are detected as LMIs in mass
spectrometry. Our previous study showed an example of LMI profiling
for cancer screening (15).
However, at present, the dynamic status of metabolic compounds in
the blood is poorly understood. Metabolic compounds in the blood
are capable of showing disease status; therefore, profiling LMIs
may be useful not only for understanding cancer, but also for
identifying biomarkers. Furthermore, recent mass technology,
including MALDI-TOF and liquid chromatography-MS/MS, has been found
to provide extremely precise and accurate data on LMIs. Therefore,
the present study aimed to profile LMIs in serum extracts to assess
whether such profiling is capable of discriminate OVC. PCA-DA
results showed that the profile of LMIs discriminated OVC (Fig. 1). Only one control case was assigned
as OVC over the six experimental repeats (Fig. 1), allowing the LMIs with a
significant effect of discriminating OVC to be selected (Fig. 2). Two metabolic compounds were
identified and quantified: HCA and LPC (16:0) (Figs. 3–5).
HCA has been reported to affect the oxidation of
homocysteinethiolactone to sulfated glycosaminoglycans in cartilage
(16). The free base of
homocysteinethiolactone has been found to induce carcinogenesis in
a mouse model, thus abnormal homocysteine metabolism may be
associated with carcinogenesis (16). Dysregulated levels of HCA have not
been reported in cancers, although markedly increased HCA has been
detected in the cerebrospinal fluid of patients with lymphoma
treated with methtrexate (17,18).
In the present study, the profiling of LMIs revealed that the level
of HCA was different in the serum of patients with OVC compared
with healthy control individuals, which was shown through the
quantification of HCA in the sera of the controls and the patients
with OVC (Fig. 4 and Table III). HCA was not detected in the
majority of the control participants, but many of the patients with
OVC (16/25) showed significantly higher HCA levels (Table III). At the cutoff of 10 nmol/ml,
the sensitivity and specificity of HCA were 64.0 and 96.9%,
respectively. The biological implications of upregulated HCA in the
sera of patients with OVC has yet to be elucidated and the level of
HCA in other types of cancer has yet to be reported. However, the
present study found that HCA has strong potential for OVC
screening.
The level of LPC in the blood of patients with
cancer varies depending on the type of cancer, with LPC found to be
decreased in breast cancer (19)
and increased in hepatocellular carcinoma (20). In the present study, LPC (16:0) was
observed to be decreased in the serum of patients with OVC
(Fig. 5). LPC acts as a bioactive
mediator in wound healing and inflammation (21), but also has a role in the
progression of OVC (22) and lung
cancer (23). LPC has many
subtypes, and each subtype has a different length of carbon chain.
Although the role of each LPC subtype has yet to be elucidated, in
the present study, LPC (16:0) was found to be correlated with tumor
grade in patients with OVC (P=0.045).
In conclusion, the present study demonstrated that
LMI profiling may be a powerful tool to obtain valuable data on
metabolic compounds, as well as to identify biomarkers for cancer
screening. Despite the lack of explanation for the pathological
changes in HCA and LPC (16:0) in the sera of patients with OVC, the
findings of the present study demonstrate that HCA is a powerful
serological biomarker for OVC screening. In the present study, LPC
alone was not helpful to increase the discriminating power of HCA;
however, with the identification of other candidate metabolites in
the future, HCA has the potential to be used in multi-biomarker OVC
screening.
Acknowledgements
The present study was supported by a grant from the
Korean Health Technology R&D Project (Ministry of Health and
Welfare, Korea; grant no. HI12C0050) and the Ewha Global Top 5
Grant 2011 of Ewha Womans University.
References
|
1
|
Toss A, De Matteis E, Rossi E, Casa LD,
Iannone A, Federico M and Cortesi L: Ovarian cancer: can proteomics
give new insights for therapy and diagnosis? Int J Mol Sci.
14:8271–8290. 2013.
|
|
2
|
Zhang B, Cai FF and Zhong XY: An overview
of biomarkers for the ovarian cancer diagnosis. Eur J Obstet
Gynecol Reprod Biol. 158:119–123. 2011.
|
|
3
|
Xu YZ, Xi QH, Ge WL and Zhang XQ:
Identification of serum microRNA-21 as a biomarker for early
detection and prognosis in human epithelial ovarian cancer. Asian
Pac J Cancer Prev. 14:1057–1060. 2013.
|
|
4
|
Zhang B, Barekati Z, Kohler C, Radpour R,
Asadollahi R, Holzgreve W and Zhong XY: Proteomics and biomarkers
for ovarian cancer diagnosis. Ann Clin Lab Sci. 40:218–225.
2010.
|
|
5
|
Zhang Z, Bast RC Jr, Yu Y, et al: Three
biomarkers identified from serum proteomic analysis for the
detection of early stage ovarian cancer. Cancer Res. 64:5882–5890.
2004.
|
|
6
|
Jacobs I, Davies AP, Bridges J, et al:
Prevalence screening for ovarian cancer in postmenopausal women by
CA 125 measurement and ultrasonography. BMJ. 306:1030–1034.
1993.
|
|
7
|
Goswamy RK, Campbell S and Whitehead MI:
Screening for ovarian cancer. Clin Obstet Gynaecol. 10:621–643.
1983.
|
|
8
|
Sarojini S, Tamir A, Lim H, et al: Early
detection biomarkers for ovarian cancer. J Oncol.
2012:7090492012.
|
|
9
|
Jacobs IJ, Skates S, Davies AP, et al:
Risk of diagnosis of ovarian cancer after raised serum CA 125
concentration: a prospective cohort study. BMJ. 313:1355–1358.
1996.
|
|
10
|
Anderson GL, McIntosh M, Wu L, et al:
Assessing lead time of selected ovarian cancer biomarkers: a nested
case-control study. J Natl Cancer Inst. 102:26–38. 2010.
|
|
11
|
Bast RC Jr, Boyer CM, Jacobs I, et al:
Cell growth regulation in epithelial ovarian cancer. Cancer. 71(4
Suppl): 1597–1601. 1993.
|
|
12
|
Moradi MM, Carson LF, Weinberg B, Haney
AF, Twiggs LB and Ramakrishnan S: Serum and ascitic fluid levels of
interleukin-1, interleukin-6, and tumor necrosis factor-alpha in
patients with ovarian epithelial cancer. Cancer. 72:2433–2440.
1993.
|
|
13
|
Luo LY, Katsaros D, Scorilas A, et al: The
serum concentration of human kallikrein 10 represents a novel
biomarker for ovarian cancer diagnosis and prognosis. Cancer Res.
63:807–811. 2003.
|
|
14
|
Milojkovic M, Hrgovic Z, Hrgovic I, Jonat
W, Maass N and Buković D: Significance of CA 125 serum level in
discrimination between benign and malignant masses in the pelvis.
Arch Gynecol Obstet. 269:176–180. 2004.
|
|
15
|
Yoo BC, Kong SY, Jang SG, et al:
Identification of hypoxanthine as a urine marker for non-Hodgkin
lymphoma by low-mass-ion profiling. BMC Cancer. 10:552010.
|
|
16
|
McCully KS: Chemical pathology of
homocysteine. III Cellular function and aging. Ann Clin Lab Sci.
24:134–152. 1994.
|
|
17
|
Becker A, Vezmar S, Linnebank M, Pels H,
Bode U, Schlegel U and Jaehde U: Marked elevation in homocysteine
and homocysteine sulfinic acid in the cerebrospinal fluid of
lymphoma patients receiving intensive treatment with methotrexate.
Int J Clin Pharmacol Ther. 45:504–515. 2007.
|
|
18
|
Quinn CT, Griener JC, Bottiglieri T,
Hyland K, Farrow A and Kamen BA: Elevation of homocysteine and
excitatory amino acid neurotransmitters in the CSF of children who
receive methotrexate for the treatment of cancer. J Clin Oncol.
15:2800–2806. 1997.
|
|
19
|
Qiu Y, Zhou B, Su M, et al: Mass
spectrometry-based quantitative metabolomics revealed a distinct
lipid profile in breast cancer patients. Int J Mol Sci.
14:8047–8061. 2013.
|
|
20
|
Ressom HW, Xiao JF, Tuli L, et al:
Utilization of metabolomics to identify serum biomarkers for
hepatocellular carcinoma in patients with liver cirrhosis. Anal
Chim Acta. 743:90–100. 2012.
|
|
21
|
Sakai M, Miyazaki A, Hakamata H, et al:
Lysophosphatidylcholine plays an essential role in the mitogenic
effect of oxidized low density lipoprotein on murine macrophages. J
Biol Chem. 269:31430–31435. 1994.
|
|
22
|
Fang X, Gaudette D, Furui T, et al:
Lysophospholipid growth factors in the initiation, progression,
metastases, and management of ovarian cancer. Ann NY Acad Sci.
905:188–208. 2000.
|
|
23
|
Guo Y, Wang X, Qiu L, et al: Probing
gender-specific lipid metabolites and diagnostic biomarkers for
lung cancer using Fourier transform ion cyclotron resonance mass
spectrometry. Clin Chim Acta. 414:135–141. 2012.
|