Introduction
Renal cell carcinoma (RCC) is one of the most common
malignant diseases of the kidney, which accounts for 2–3% of cases
among all types of cancer (1). In
Western countries, RCC has risen by ~2% in the last two decades
(2). In 2016, kidney cancer accounted
for an estimated 62,700 new cancer diagnoses and 14,240 cases of
mortality in the USA (3). To date,
the main treatment for RCC is complete or partial surgical
resection combined with chemotherapy or radiotherapy. Metastatic
RCC displays a poor response to chemotherapy and radiotherapy, due
to systemic toxicity and increased expression of multidrug
resistance genes; this is responsible for the high mortality rate
of advanced RCC (4,5). The 5-year overall survival rate of
patients with metastatic RCC is <10% and the median survival
time is only 1.5 years (6). In
addition, 20–25% of patients with RCC have already reached the
metastatic phase upon initial diagnosis (7). Therefore, there is an urgent need to
explore novel molecules involved in the progression of RCC, in
order to identify therapeutic targets for patients with RCC.
Hepatocyte nuclear factor-4α (HNF-4α) is one of the
major transcription factors that regulate liver cell
differentiation. The expression of HNF-4α is tissue-specific, and
it is highly expressed in the liver, kidneys, intestines and
pancreas (8). In the liver, HNF-4α
regulates the expression of a series of genes involved in the
metabolism of amino acids, lipids, carbohydrates and cholesterol,
the transport of ions, blood coagulation and cell proliferation
(9–11). In addition, HNF-4α is involved in cell
differentiation and maintenance of epithelial morphology in certain
cell types (12,13). At present, research into HNF-4α in
cancer has primarily focused on liver cancer. The transcriptional
activity of HNF-4α is decreased or completely lost in ~70% of
patients with liver cancer, and the prognosis of patients with low
expression of HNF-4α is poor (14).
In addition, HNF-4α has been reported to be associated with the
malignancy of liver cancer in mouse models; in a previous study,
upregulation of HNF-4α expression was able to transform invasive
liver cancer into a less malignant phenotype (15). These data are indicative of an
important role of HNF-4α inactivation in the progression of liver
cancer. The loss of functional activity of HNF-4α has also been
described in RCC (16); therefore, it
is of interest to analyze whether HNF-4α has a functional role in
RCC tumorigenesis and progression.
Tumor metastasis is an important factor in
evaluating prognosis and predicting therapeutic response.
Epithelial to mesenchymal transition (EMT) is an important process
during cellular transformation, by which epithelial tumor cells
lose their polarity, rearrange cytoskeletal elements, and display
reduced intercellular adhesion and increased motility, endowing
cancer cells with invasive and metastatic properties (17). A critical molecular feature of EMT is
the downregulation of E-cadherin, which is a cell adhesion molecule
present in the majority of normal epithelial cell membranes.
E-cadherin is considered to act as a tumor suppressor inhibiting
metastasis in various types of cancer, including hepatocellular
carcinoma, head and neck carcinoma, squamous cell carcinoma of the
skin and esophagus, and melanoma (18). Re-expression of E-cadherin is
sufficient to reduce the aggressiveness of tumor cells. Conversely,
E-cadherin depletion leads to mesenchymal morphology, and increased
cell migration and invasion (19).
The present study aimed to investigate whether
HNF-4α may serve as a molecular marker for RCC migration and
invasion. In the present study, reduced expression of HNF-4α
promoted tumor migration and invasion by regulating E-cadherin in
RCC. The present results highlighted the potential role of HNF-4α
as a therapeutic target for the treatment of RCC.
Materials and methods
Cell culture and treatment
Human RCC cell lines A498 and OS-RC-2, and the
normal kidney cell line HK2 were obtained from the Cell Bank of the
Chinese Academy of Sciences. 293T cells were obtained from Dr Yong
Zhang (Rui-Jin Hospital). The cells were cultured in Dulbecco's
modified Eagle's medium (Sigma-Aldrich; Merck KGaA) supplemented
with 10% fetal bovine serum (Gibco; Thermo Fisher Scientific,
Inc.). All cell lines were cultured in a humidified atmosphere
containing 5% CO2/95% air at 37°C.
Clinical tissue samples
A total of 30 primary RCC tissues, 18 metastatic
tissues and 22 adjacent normal tissues were obtained from primary
RCC patients, which were histopathologically diagnosed between June
2015 and August 2018. The patients were aged between 56 and 77
years old (mean age, 68.5 years), and included 27 men and 21 women.
All samples obtained were primary tumors and patients were
untreated prior to surgery. Tissues were collected from the
Shanghai Tenth People's Hospital Affiliated to Tongji University
School of Medicine. The present study was approved by the Medical
Ethical Committee of Shanghai Tenth People's Hospital. All patients
provided written informed consent prior to participation and agreed
to publication of the present study.
RNA-sequencing analysis
The mRNA expression data of HNF-4α and E-cadherin
were obtained from The Cancer Genome Atlas (TCGA); these data were
obtained from 1,019 tumor tissues and 139 adjacent normal tissues
from patients with RCC. TCGA dataset used in this study was
retrieved from the Genomic Data Commons (GDC) Data Portal
(portal.gdc.cancer.gov). The identifiers of the
cases included in this study are listed in Table SI. All data used in this study are
readily accessible via these identifiers on the GDC Data Portal
website. To segregate patients with RCC according to high or low
expression, the median expression was calculated. If expression was
under the median value, patients were included in the low group,
and vice versa.
Immunohistochemistry (IHC)
Briefly, tissue samples (length, <3 mm) were
fixed with 4% paraformaldehyde for 24 h at room temperature,
dehydrated through a graded alcohol series and embedded in
paraffin. Tissue slides (4 µm) were then deparaffinized at 60°C,
followed by treatment with 100% xylene for 20 min and a graded
series of ethanol at room temperature. The slides were incubated in
a 3% hydrogen peroxide solution for 15 min at room temperature,
followed by incubation in 10 mM sodium citrate buffer at 95°C for
10 min. Subsequently, the slides were rinsed in PBS and incubated
with 5% BSA (Sigma-Aldrich; Merck KGaA) for 30 min at room
temperature. The slides were then incubated with primary antibodies
at 4°C overnight. The following antibodies were used: HNF-4α (1:50,
cat. no. ab201460; Abcam) and E-cadherin (1:100, cat. no. 24E10;
Cell Signaling Technology, Inc.). The slides were visualized using
the standard avidin-biotinylated peroxidase complex method.
Briefly, biotinylated secondary antibody (100 µl, 1:2,000, cat. no.
ab6720; Abcam) was applied to the sections on the slides and the
slides were incubated in a humidified chamber at room temperature
for 30 min A DAB Substrate kit (cat. no. JM3363; Shanghai Youyu
Biotech Co., Ltd.) was used for staining, according to the
manufacturer's protocol. Finally, 10% hematoxylin was used for
counterstaining at 37°C for 3 min and morphological images were
observed under an Olympus BX51 microscope. All staining was blindly
scored by two pathologists according to the intensity of staining:
No staining, 0; weak staining, 1; moderate staining, 2; strong
staining, 3, and the area of stained cells: 0%, 0; 1–24%, 1;
25–49%, 2; 50–74%, 3; 75–100%, 4. The final immunoreactive score
was determined by multiplying the intensity score with the area of
stained cells; scores ranged between 0 (the minimum score) and 12
(the maximum score).
Reverse transcription-quantitative
polymerase chain reaction (RT-qPCR)
Total RNA was isolated using TRIzol®
reagent (Invitrogen; Thermo Fisher Scientific, Inc.) and treated
with RNase-free DNase (Promega Corporation). RT was performed using
PrimeScript 1st Strand cDNA Synthesis kit (Takara Biotechnology
Co., Ltd.) according to the manufacturer's protocol. qPCR was
carried out with SYBR-Green PCR Master Mixture Reagent (Applied
Biosystems; Thermo Fisher Scientific, Inc.) using an ABI 7500
Detection system (Applied Biosystems; Thermo Fisher Scientific,
Inc.). Thermocycling conditions were as follows: An initial cycle
at 95°C for 10 min, followed by 35 cycles of denaturation at 95°C
for 30 sec, annealing at 60°C for 30 sec and extension at 72°C for
30 sec, and a final extension step at 72°C for 10 min to complete
the amplification. The fluorescence threshold value was calculated
using 7500 software v2.0.6 (Applied Biosystems; Thermo Fisher
Scientific, Inc.). The final quantification was determined using
the 2−ΔΔCq method (20).
Experiments were repeated at least three times with similar
results. A list of qPCR primers is presented in Table SII.
Plasmids, short hairpin (shRNA) and
viral infection
Human HNF-4α and E-cadherin cDNA amplified from 293T
cells were cloned and inserted into a pLVX-Puromycin lentiviral
expression vector (Clontech Laboratories, Inc.). Complementary
shRNA oligonucleotides against HNF-4α and E-cadherin were
synthesized, annealed and ligated into pSIREN-RetroQ, according to
the manufacturer's protocol (Clontech Laboratories, Inc.). The
sequence for E-cadherin shRNA was 5′-AAGATAGGAGTTCTCTGATGC-3′ and
the sequence for HNF-4α shRNA has been described previously
(5). These plasmids (500 ng) were
co-transfected into 293T cells (5×10⁵ cells/well) using
4 µl FuGene 6 (Roche Diagnostics) with packaging plasmids,
including psPAX2 and pMD2G for the lentivirus or VSV-G and gag-pol,
the retrovirus, for 20 min at room temperature. The packaging
plasmids were obtained from Dr Shaoming Shen (Shanghai Jiaotong
University). After transfection for 48 h, the viral supernatant
(1.5 ml/well) was collected, filter-sterilized and added to cells
in a 6-well plate (1.5×10⁵ cells/well) containing
polybrene (4 µg/ml); puromycin (1 µg/ml) was added to select the
stably infected cells after another 48 h. The multiplicity of
infection of viruses ranged between 10 and 50 PFU/cell. In the
control groups, cells were infected with empty vector (EV) or a
non-specific control (NC). The sequence for NC shRNA was
5′-TTCTCCGAACGTGTCACG-3′. Selection was stopped as soon as the
non-infected control cells died off.
Western blotting
Western blotting was performed as described
previously (21). The following
antibodies were used: Rabbit antibodies against HNF-4α (cat. no.
ab201460; Abcam), E-cadherin (cat. no. 24E10; Cell Signaling
Technology, Inc.), N-cadherin (cat. no. 13116; Cell Signaling
Technology, Inc.), β-catenin (cat. no. 8480; Cell Signaling
Technology, Inc.), phosphorylated (P)-p65 (cat. no. 3033; Cell
Signaling Technology, Inc.), p65 (cat. no. 8242; Cell Signaling
Technology, Inc.), P-STAT3 (cat. no. ab76315; Abcam), P-AKT (cat.
no. ab38449; Abcam), AKT (cat. no. ab8805; Abcam) and β-actin
monoclonal antibody (cat. no. HRP-60008; Proteintech Group, Inc.);
mouse antibodies against STAT3 (cat. no. ab119352; Abcam).
Cell proliferation assay
Cell proliferation was evaluated using the Cell
Counting kit-8 (CCK-8) assay (WST-8; Dojindo Molecular
Technologies, Inc.). Briefly, 100 µl cells were seeded into 96-well
plates at a density of 2,000 cells/well on days 1, 2 and 3.
Subsequently, 10 µl WST-8 was added and cells were incubated at
37°C for 3 h. Absorbance was measured at a wavelength of 450 nm
using a Synergy H4 Hybrid Microplate Reader (BioTek Instruments,
Inc.).
Wound-healing assay. Cells (2×10⁵
cells/well) were seeded in 6-well plates. After starving overnight
in medium supplemented with 1% FBS, the >90% confluent
monolayers were scraped with a 200-µl pipette tip to create a
linear wound. Plates were washed with PBS and cultured with
complete medium for 24 h. Images of the wounds were captured with a
phase contrast light microscope (Olympus Corporation) and the
horizontal distance between the edges of the wound was measured.
This assay was performed in triplicate.
Transwell migration and invasion
assay
For the Transwell migration assay, cells
(2×10⁴ cells/well) were suspended in 200 µl serum-free
Dulbecco's modified Eagle's medium (DMEM, Sigma-Aldrich; Merck
KGaA) and plated on 8 µM Transwell filters (Corning, Inc.) in
24-well plates containing 500 µl DMEM supplemented with 10% FBS.
For the Transwell invasion assay, cells (5×10⁴
cells/well) were suspended in 200 µl serum-free DMEM and seeded on
the upper chamber of Transwell filters in 24-well plates containing
500 µl DMEM supplemented with 10% FBS, which was coated with
Matrigel (BD Biosciences). The lower chamber was filled with 600 µl
complete DMEM. After 36 h at 37°C, non-migratory or non-invasive
cells on the upper side of the membrane were removed with a cotton
swab, whereas cells on the lower side of the membrane were fixed
with 100% methanol for 20 min and stained with 1% crystal violet
for 15 min at 37°C. Images of the cells were captured and counted
in five random fields under a dissecting microscope. This assay was
performed in triplicate.
Luciferase assay
Sequences in the E-cadherin promoter (2,000 bp) were
amplified by PCR from the genomic DNA of 293T cells and subcloned
into a pGL3-Basic vector (Promega Corporation) to construct
luciferase reporter plasmids. For the luciferase assay, 293T cells
(5×10⁵ cells/well) were seeded in a 6-well plate, and
co-transfected with HNF-4α expression vector (500 ng), luciferase
reporter plasmids driven by promoter fragments of E-cadherin (500
ng), and pRLSV40-Renilla (50 ng) using 4 µl FuGene 6 (Roche
Diagnostics). A total of 36 h post-transfection, cells were lysed
and analyzed using the Dual-Luciferase Assay system (cat. no.
E1910; Promega Corporation) according to the manufacturer's
protocol.
Statistical analysis
All experiments were repeated at least three times.
All statistical analyses were evaluated using the GraphPad Prism
6.0 software (GraphPad Software, Inc.). The Kaplan-Meier method was
used to analyze overall survival and comparisons were analyzed by
log-rank test. The Pearson's χ2 test was used to
evaluate associations. Spearman's rank correlation was used to
evaluate the correlation between HNF-4α and E-cadherin mRNA
expression in different grades of RCC. One-way ANOVA followed by
Bonferroni post hoc test was used for multiple comparisons. Unless
otherwise described, comparisons between two groups were analyzed
by Student's t-test (unpaired, two-tailed). P<0.05 was
considered to indicate a statistically significant difference.
Results
HNF-4α is downregulated and associated
with a poor prognosis in RCC
Immunohistochemical analysis of RCC and normal
adjacent tissues demonstrated that there was a significant decrease
in HNF-4α protein expression in RCC tissues compared with in normal
tissues adjacent to the tumor tissues (Fig. 1A and B). In addition, HNF-4α
expression was significantly lower in metastatic tissues compared
with in primary tumors (Fig. 1C).
Furthermore, downregulation of HNF-4α mRNA expression and the
negative association between HNF-4α expression and pathological
grade was confirmed in 1,158 RCC samples using TCGA database
(Fig. 1D and E).
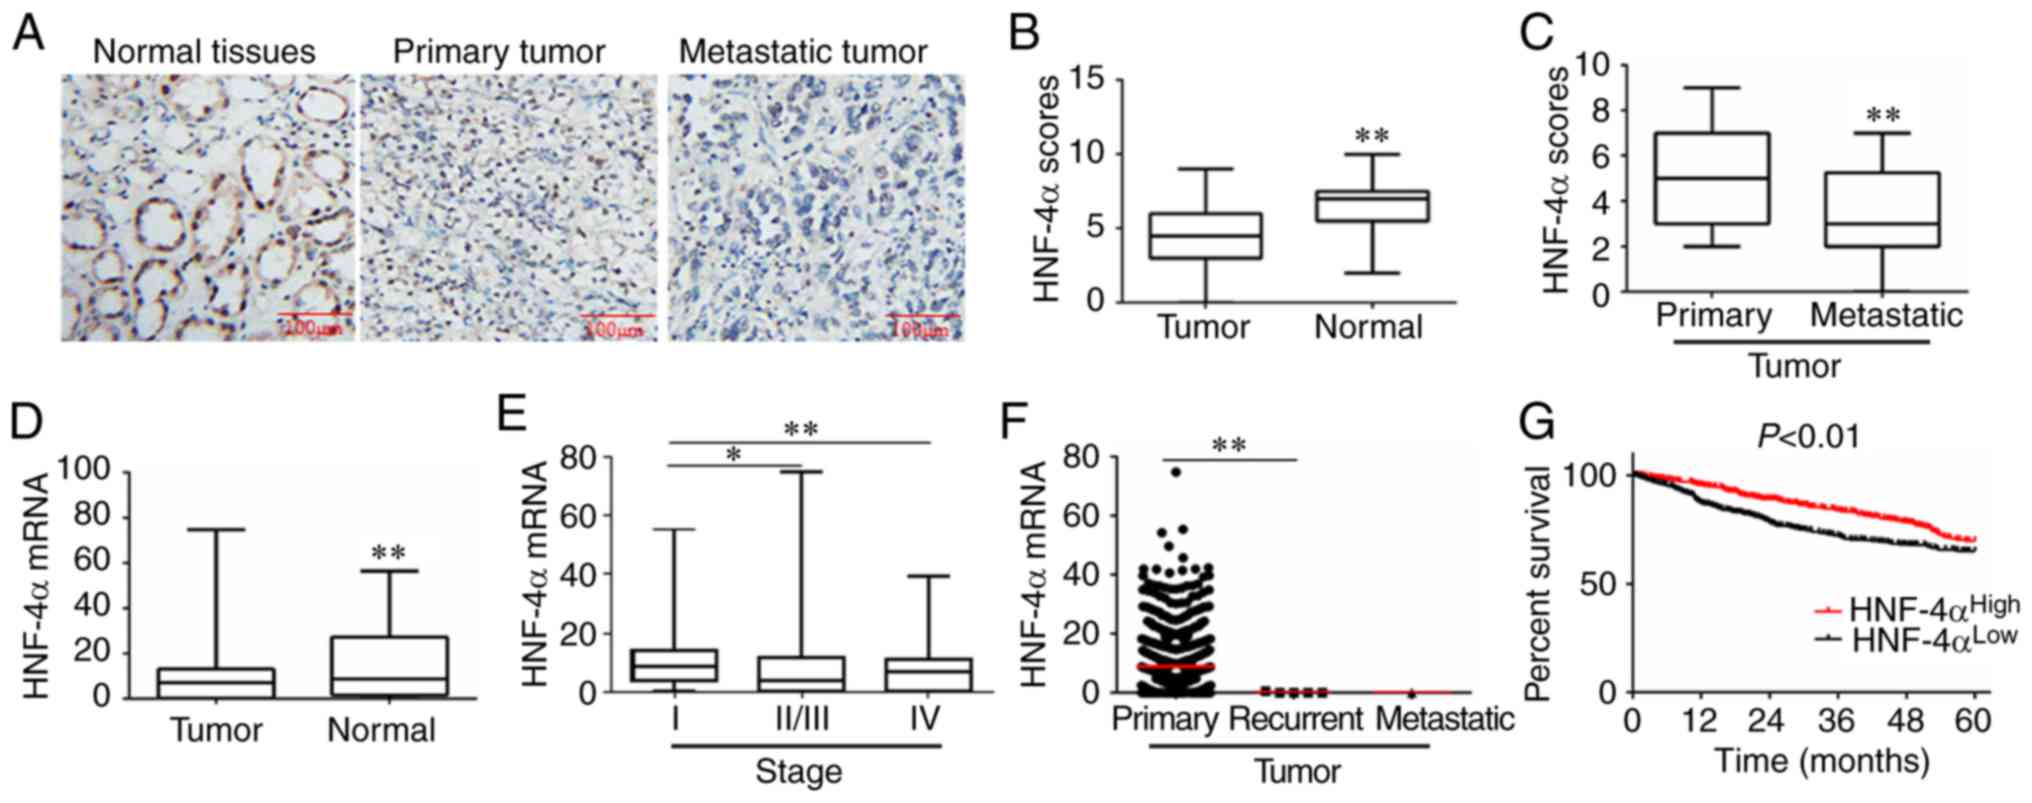 | Figure 1.HNF-4α is downregulated and associated
with a poor prognosis in RCC. (A) Representative
immunohistochemistry images of RCC samples for the expression of
HNF-4α protein. (B and C) HNF-4α expression scores are presented as
box plots, with the horizontal lines representing the median. The
plots range between the minimum and maximum. RCC tissues (n=48)
with adjacent normal tissues (n=22), and primary (n=30) and
metastatic (n=18) RCC tissues were compared. P-values were
calculated via Student's t-test. Information on HNF-4α expression
in different pathological types and grades of RCC was derived from
TCGA database. (D) Tumor (n=1,019) and normal (n=139) tissues were
compared and analyzed using Student's t-test. (E) Stage I (n=473),
II/III (n=390) and IV (n=117) RCC were compared and analyzed using
one-way ANOVA followed by Bonferroni post hoc test. (F) Primary
(n=1,013), recurrent (n=5) and metastatic (n=1) RCC tissues were
compared and analyzed using one-way ANOVA followed by Bonferroni
post hoc test. (G) Kaplan-Meier analysis of the association between
HNF-4α expression and survival time in patients with RCC; data were
derived from TCGA database. Cases were classified into low and high
expression groups. Results were analyzed by log-rank test.
*P<0.05, **P<0.01. HNF-4α, hepatocyte nuclear factor-4α; RCC,
renal cell carcinoma; TCGA, The Cancer Genome Atlas. |
The present study further investigated whether
HNF-4α expression was associated with RCC patient prognosis. The
results indicated that downregulation of HNF-4α was significantly
associated with tumor recurrence and metastasis in RCC (Fig. 1F). The association of HNF-4α
expression with overall survival in patients with RCC was analyzed
using TCGA database. The results revealed that patients with RCC
with lower HNF-4α expression had a relatively reduced 5-year
survival compared with those with higher HNF-4α expression,
according to TCGA database (Fig. 1G).
Taken together, these results suggested that HNF-4α may serve as a
prognostic marker of RCC progression.
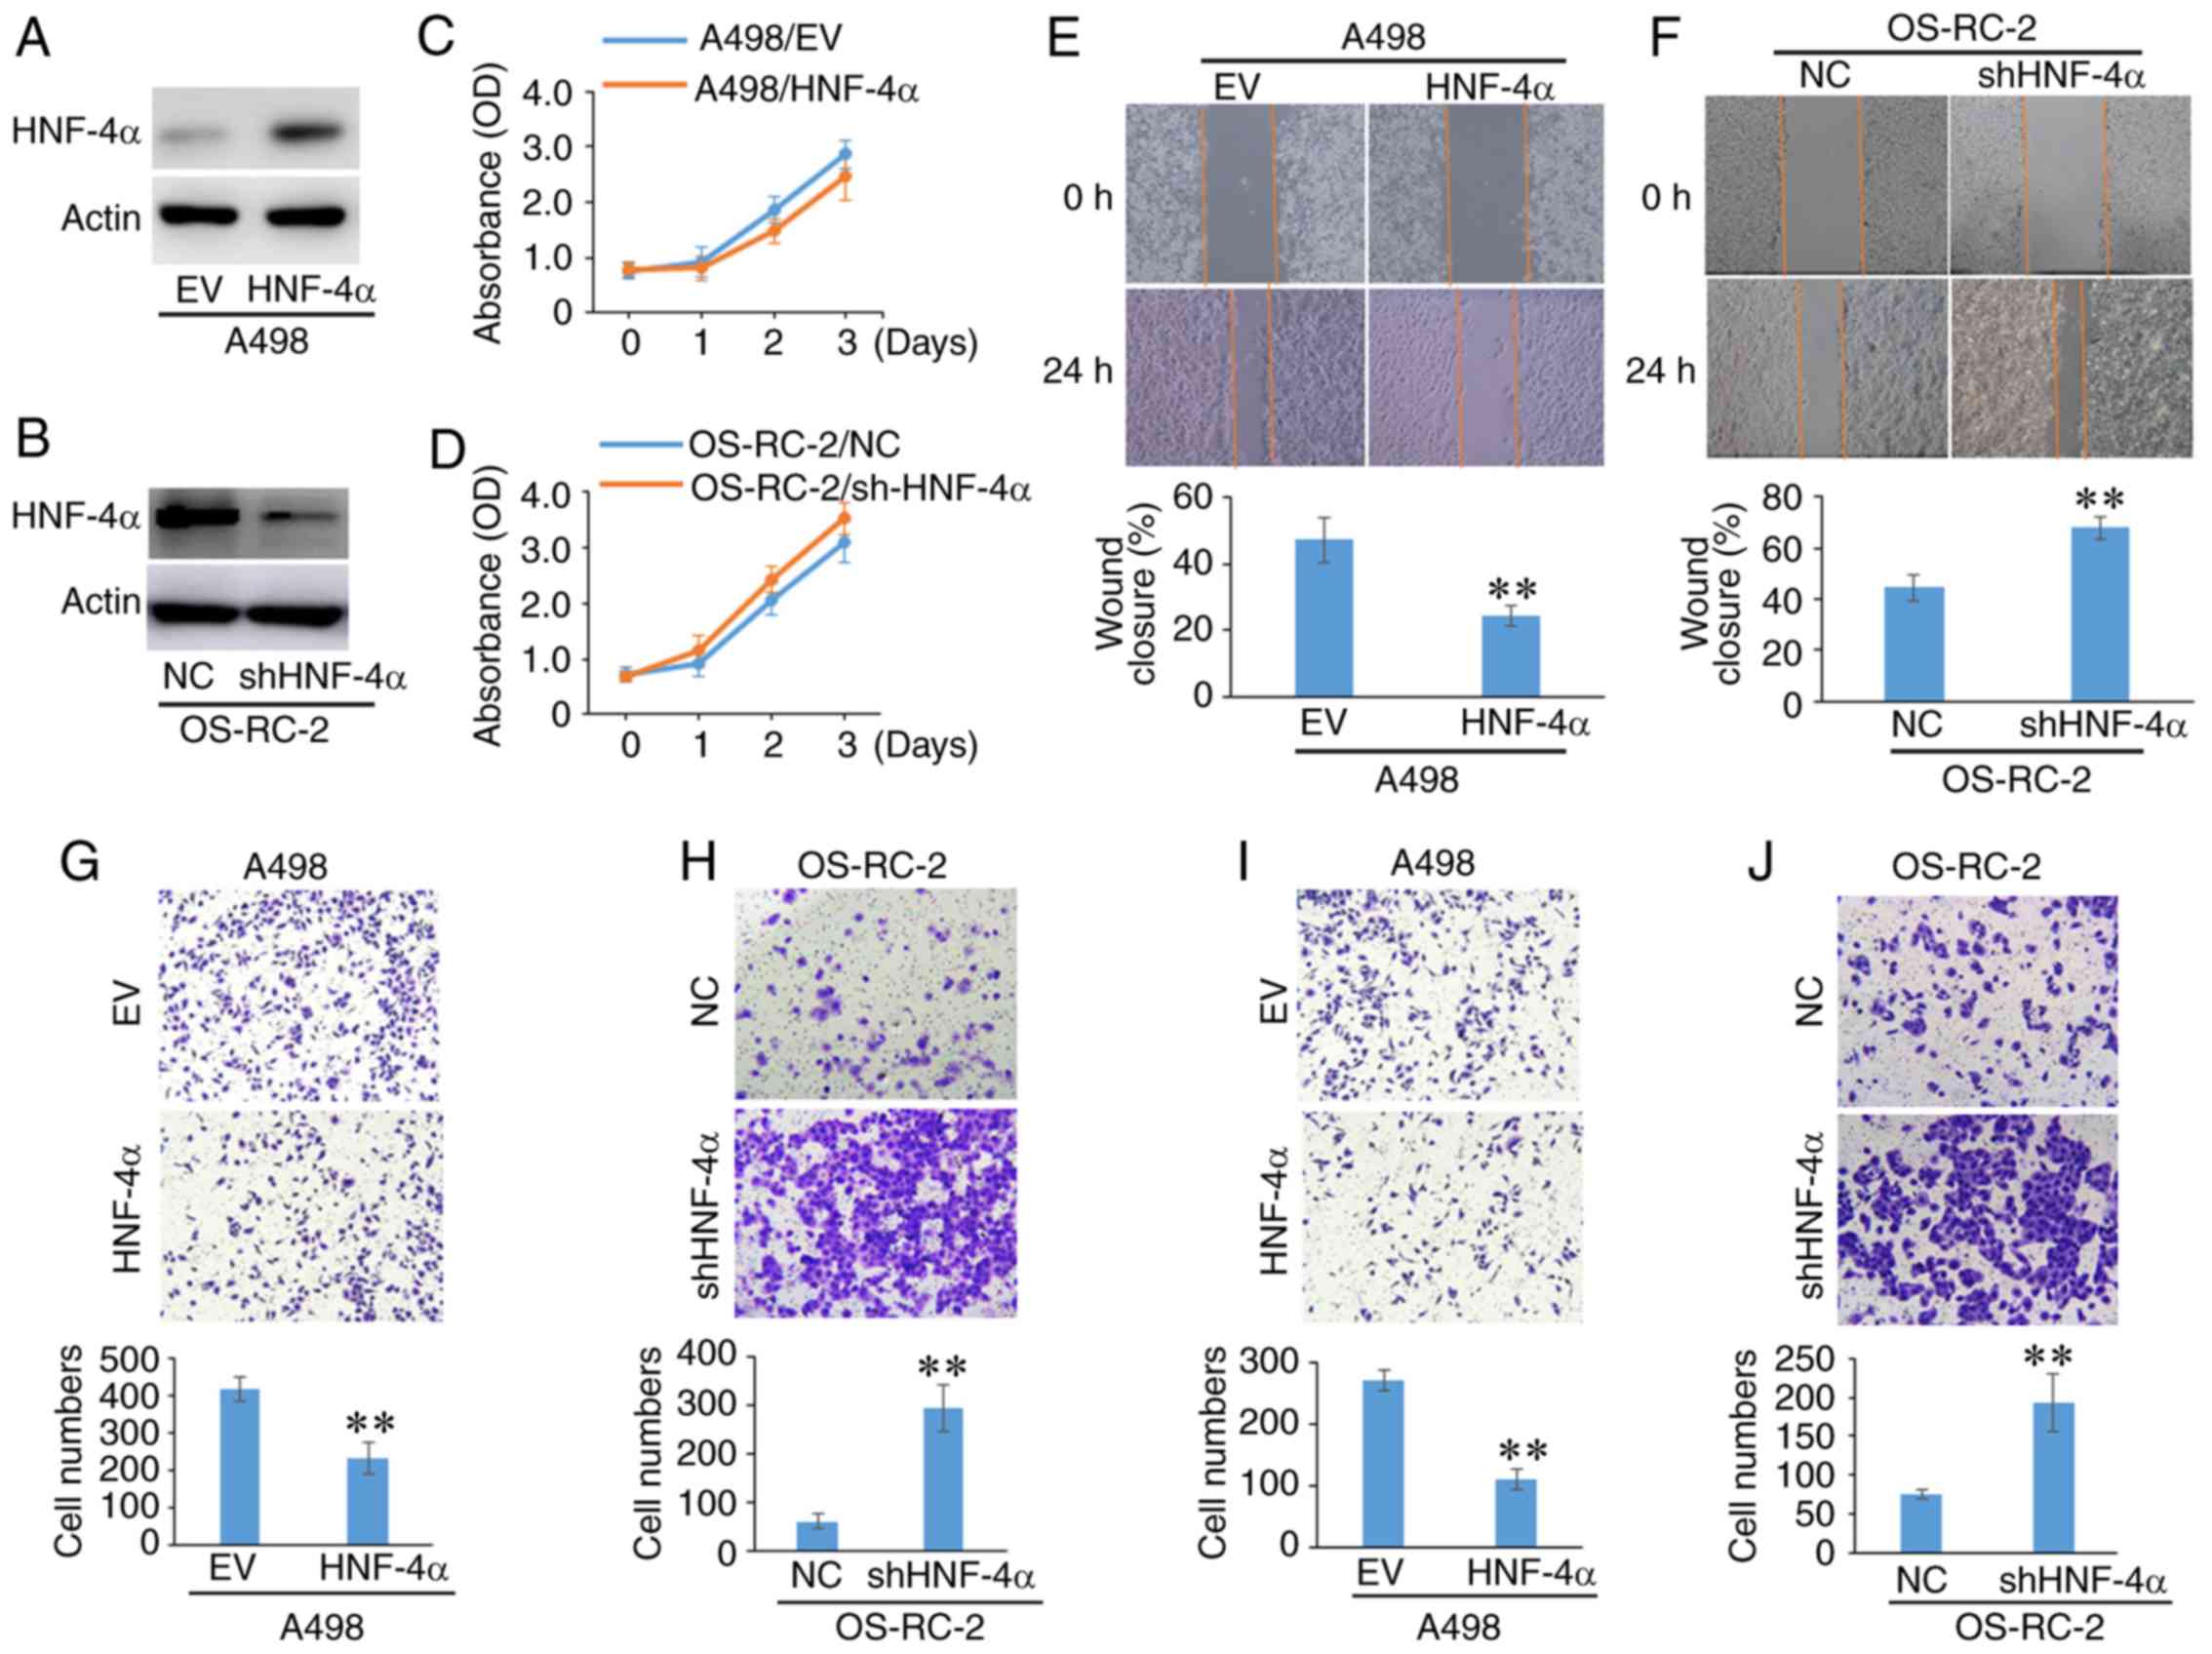
HNF-4α negatively regulates the
migration and invasion of RCC cells
Tumor metastasis is an important indicator for
evaluating the prognosis of patients. The present study
investigated the effect of HNF-4α on RCC cell migration and
invasion. Since HNF-4α is positively regulated by von Hippel-Lindau
(VHL) (14), HNF-4α was overexpressed
in VHL-deficient A498 cells and downregulated in VHL-proficient
OS-RC-2 cells (Fig. 2A and B). The
results revealed that the differences in HNF-4α expression had
little effect on the proliferation of RCC cells (Fig. 2C and D). In addition, silencing HNF-4α
in HK2, which is a proximal tubular cell line derived from normal
kidney, did not affect cell proliferation (Fig. S1A).
Data from the wound-healing assay indicated that
overexpression of HNF-4α significantly inhibited the migration of
A498 cells, whereas HNF-4α knockdown promoted OS-RC-2 cell
migration (Fig. 2E and F). The
results of the Transwell assay also indicated that HNF-4α
overexpression markedly suppressed A498 cell migration and invasion
(Fig. 2G and I). Conversely,
downregulation of HNF-4α significantly promoted the migration and
invasion of OS-RC-2 cells (Fig. 2H and
J). Furthermore, the Transwell migration assay revealed that
HK2 cells did not migrate, even when the expression of HNF-4α was
silenced under the same experimental conditions as tumor cells
(Fig. S1B). These results suggested
that HNF-4α negatively regulated the migration and invasion of RCC
cells.
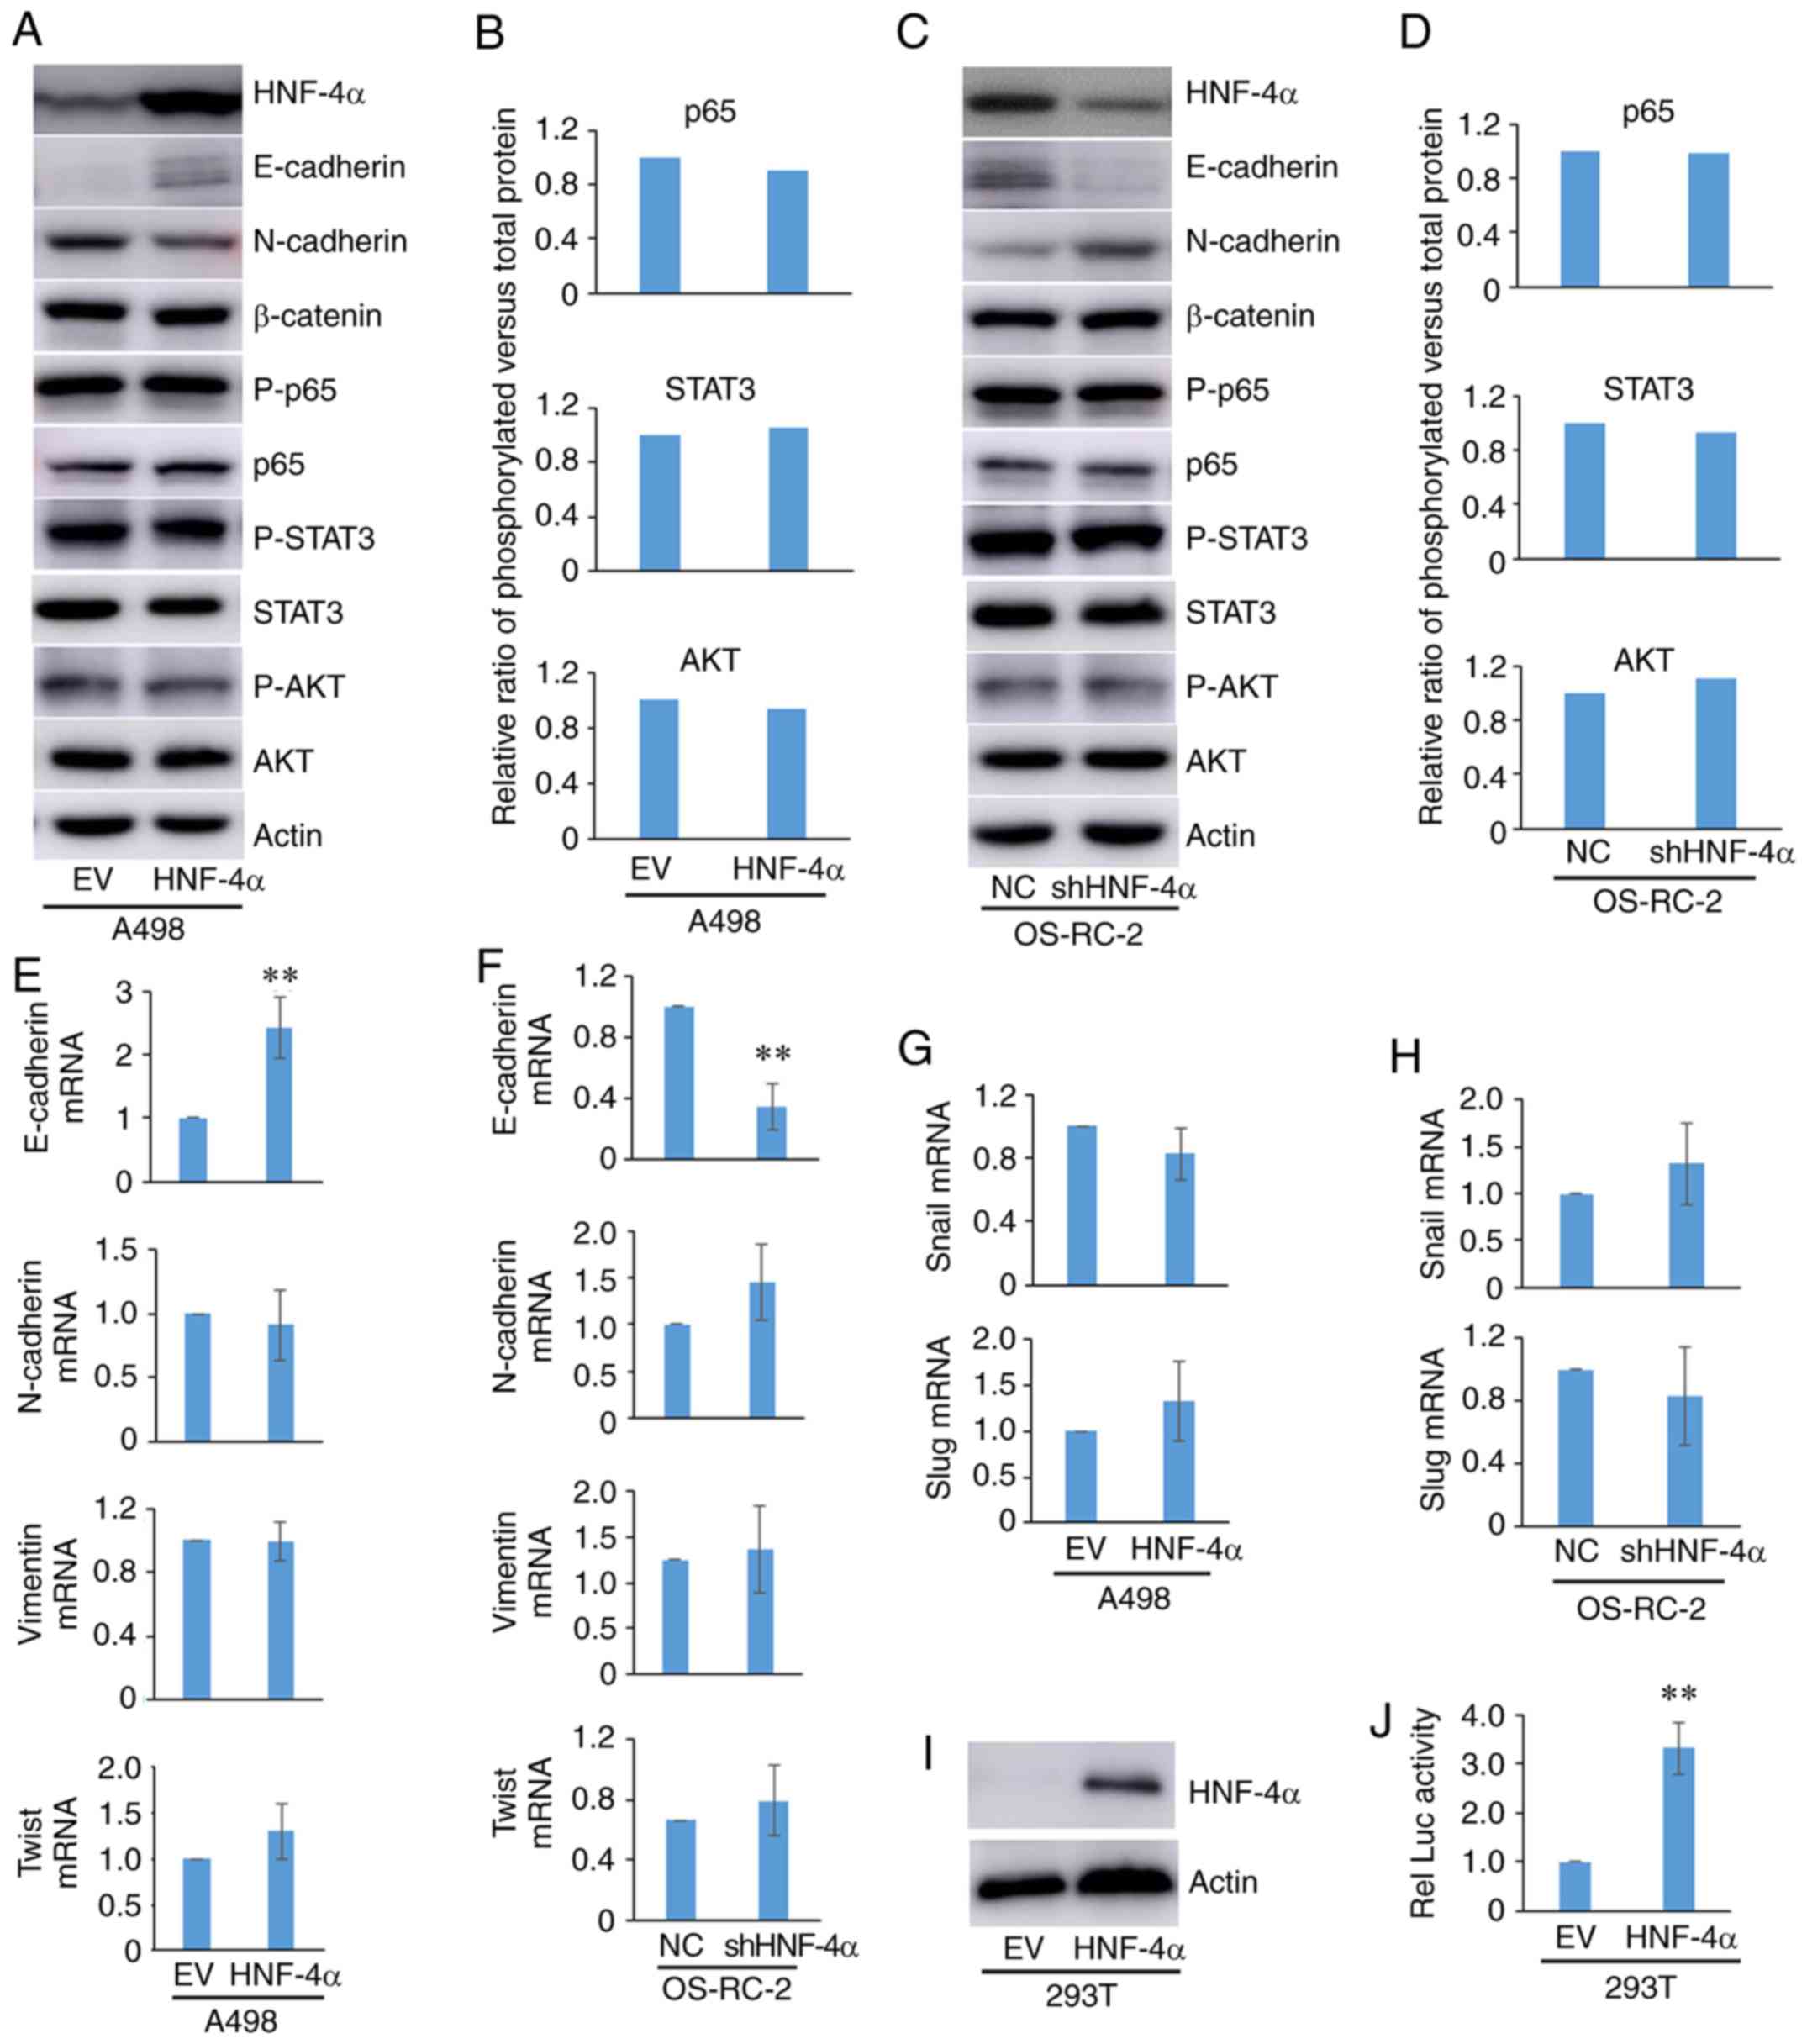
HNF-4α regulates the migration and
invasion of RCC cells by E-cadherin
Tumor migration and invasion is regulated by various
genes involved in different signaling pathways, including the EMT,
JNK-STAT, NF-κB, WNT/β-catenin and PI3K/AKT pathways (22–25). To
explore whether HNF-4α regulates cell invasion and migration via
these known proteins and signaling pathways, the expression of a
number of proteins that serve important roles in tumor migration-
and invasion-related signaling pathways was assessed in cells with
overexpression or knockdown of HNF-4α. It was observed that HNF-4α
was able to regulate the expression of E-cadherin and N-cadherin,
which are involved in the EMT process, but had little effect on
other proteins, including β-catenin, P-p65/p65, P-STAT3/STAT3 and
P-AKT/AKT (Fig. 3A-D). Furthermore,
it was confirmed that HNF-4α was able to transcriptionally regulate
the expression of E-cadherin, but not N-cadherin, Vimentin and
Twist in the EMT process (Fig. 3E and
F).
Snail and Slug are known transcription factors that
regulate E-cadherin. HNF-4α did not transcriptionally regulate the
expression of Snail and Slug in RCC cells (Fig. 3G and H). These results suggested that
HNF-4α may directly regulate the expression of E-cadherin. A 2 kb
DNA fragment upstream of the transcriptional start site of
E-cadherin was subcloned into the luciferase reporter vector
pGL3-basic, which was subsequently co-transfected into 293T cells
alongside a HNF-4α expression vector plasmid and the internal
control Renilla. Luciferase activity of the E-cadherin
promoter was activated by ectopic expression of HNF-4α (Fig. 3I and J). These results suggested that
HNF-4 may bind to the promoter of E-cadherin to regulate its
transcription.
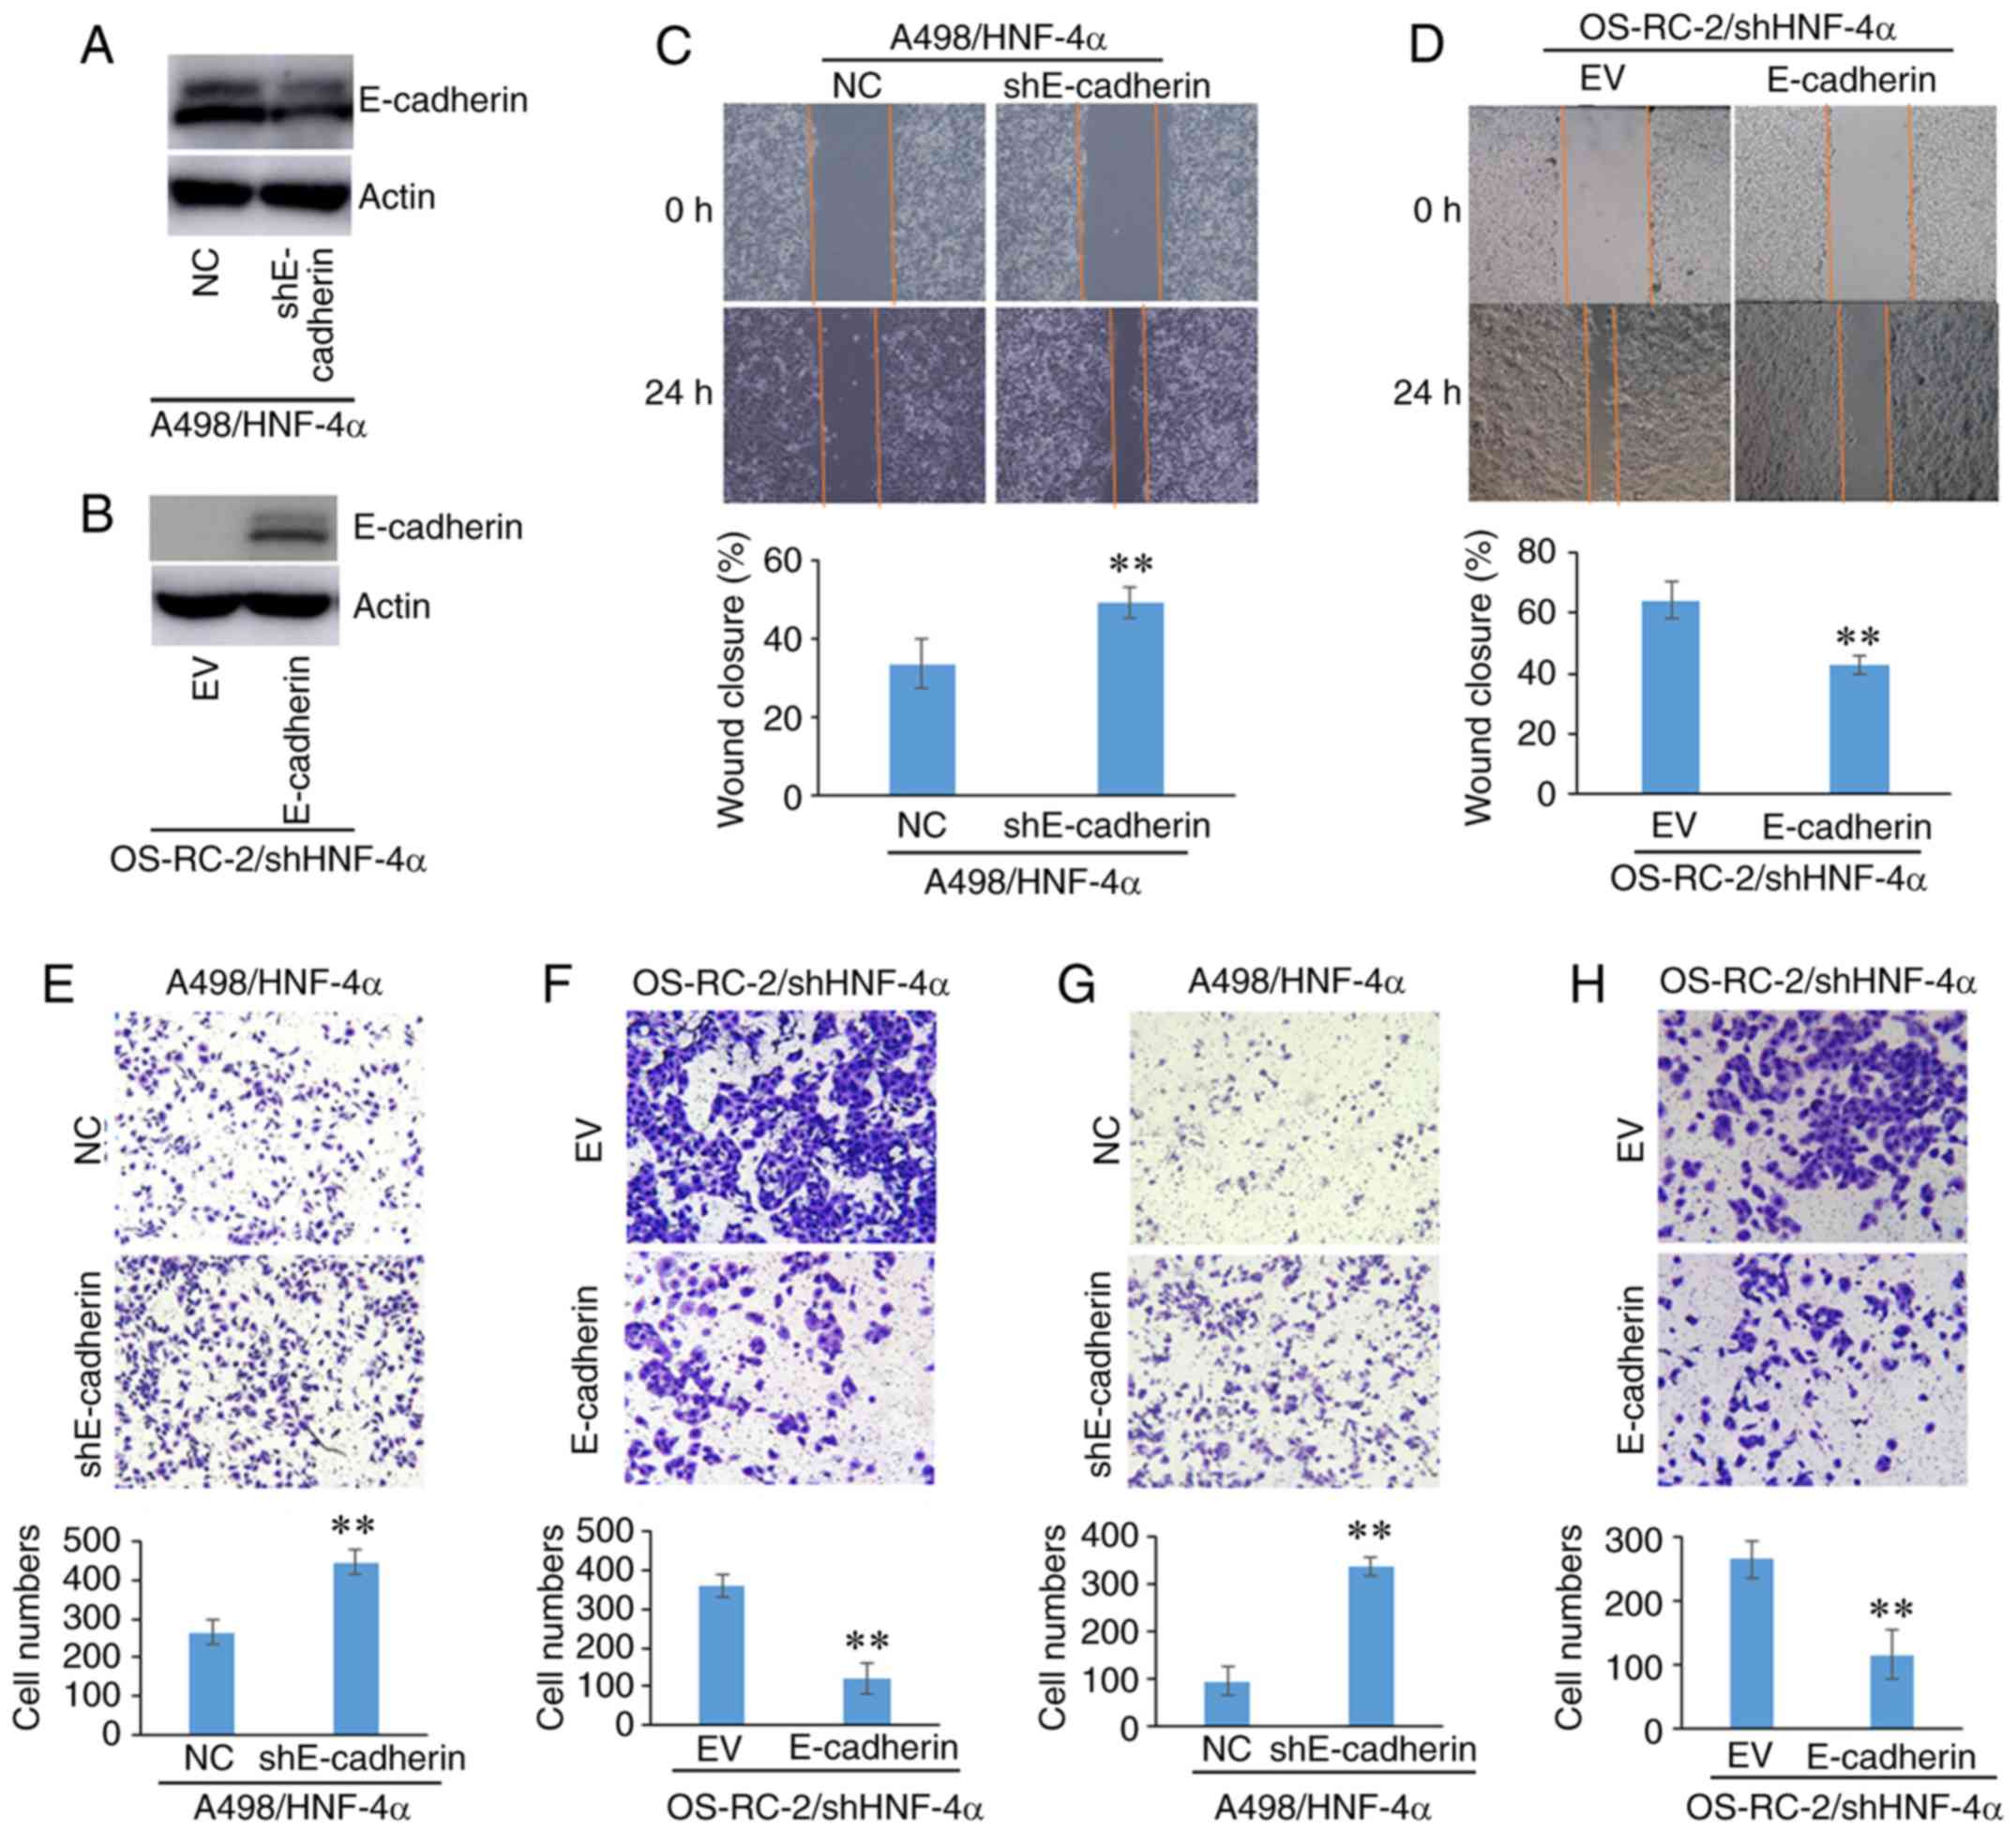
The present study verified whether HNF-4α was able
to regulate cell migration and invasion via E-cadherin (Fig. 4). The expression of E-cadherin was
knocked down in HNF-4α-overexpressing cells, and it was
demonstrated that cell migration and invasion were promoted by
E-cadherin knockdown (Fig. 4A, C, E and
G). In addition, E-cadherin was overexpressed in
shHNF-4α-transfected cells, and cell invasion and migration were
suppressed by E-cadherin overexpression (Fig. 4B, D, F and H). These experiments
demonstrated that HNF-4α may regulate cell migration and invasion
through E-cadherin.
HNF-4α and E-cadherin expression is
positively correlated in RCC samples
The present study further explored whether the
association between HNF-4α and E-cadherin existed in clinical
samples from patients with RCC. As determined by
immunohistochemical analysis, E-cadherin expression was detected in
RCC tumor and adjacent tissues. E-cadherin expression was
significantly reduced in tumor tissues compared with in
corresponding adjacent tissues (Fig. 5A
and B). In addition, lower expression of E-cadherin was
demonstrated in metastatic tissues compared with in primary tumors
(Fig. 5C). Furthermore, reduced
HNF-4α expression was frequently associated with lower E-cadherin
expression, and vice versa (Fig.
5D).
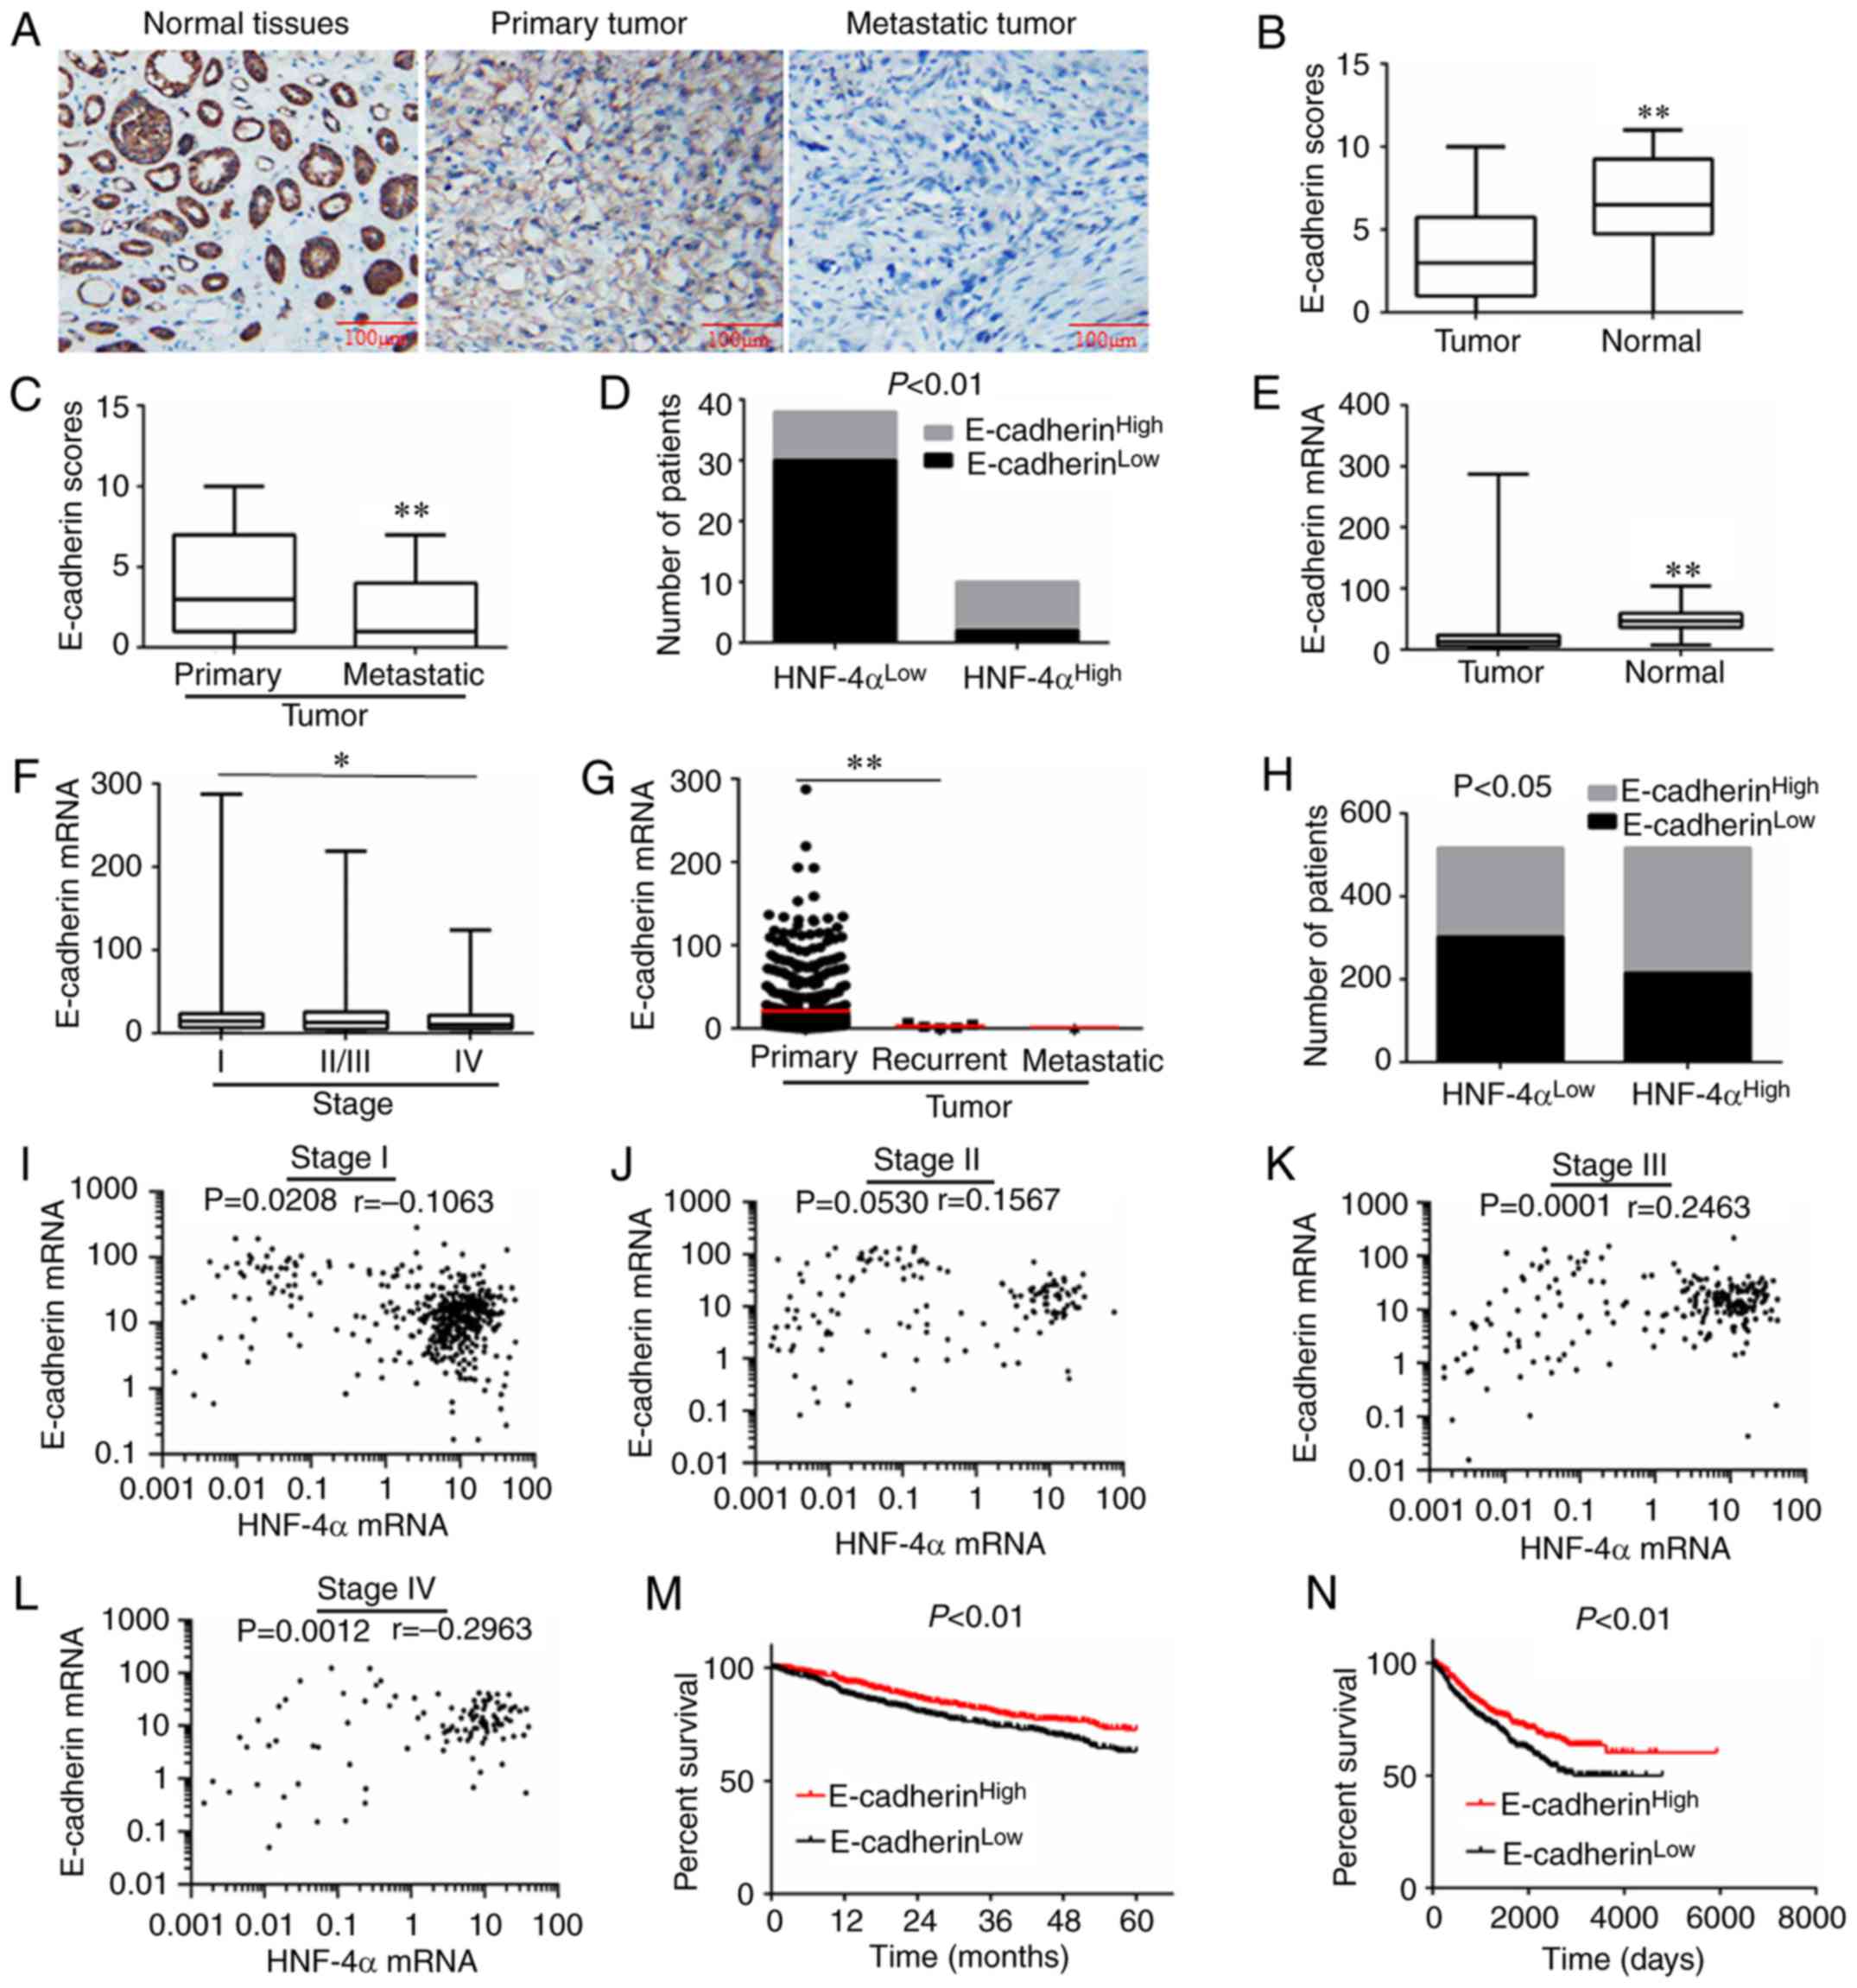 | Figure 5.Expression of E-cadherin and
correlation analysis in RCC. (A) Representative IHC images of RCC
for E-cadherin expression. (B and C) E-cadherin expression scores
are illustrated as box plots. (D) Analysis of HNF-4α and E-cadherin
protein expression, calculated via Pearson's χ2 test.
(E-G) E-cadherin expression in different pathological types and
grades of RCC, derived from TCGA database. (E) Tumor (n=1,019) and
normal tissues (n=139) were compared and calculated via Student's
t-test. (F) Stage I (n=473), II/III (n=390) and IV (n=117) RCC
tissues were compared and calculated via one-way ANOVA followed by
Bonferroni post hoc test. (G) Primary (n=1,013), recurrent (n=5)
and metastatic (n=1) RCC tissues were compared and calculated via
one-way ANOVA followed by Bonferroni post hoc test. (H) Analysis of
HNF-4α and E-cadherin mRNA expression, calculated via Pearson's
χ2 test. (I-L) Correlation analysis of HNF-4α and
E-cadherin mRNA expression in different grades of RCC, calculated
via Spearman's rank correlation. (M) Association between E-cadherin
expression and 5-year survival rate of patients with RCC, according
to TCGA database. Data were analyzed using log-rank test,
P<0.01. (N) Overall survival of patients with RCC with high or
low expression of E-cadherin; data were derived from TCGA database.
Data were analyzed using log-rank test, P<0.01. *P<0.05,
**P<0.01. HNF-4α, hepatocyte nuclear factor-4α; RCC, renal cell
carcinoma; TCGA, The Cancer Genome Atlas. |
Furthermore, 1,158 cases of patients with RCC in
TCGA database were used to verify the association between HNF-4α
and E-cadherin. As shown in Fig. 5E,
the mRNA expression levels of E-cadherin were decreased in tumor
tissues compared with in normal tissues adjacent to tumor tissues.
E-cadherin expression was also reduced in high-grade and
recurrent/metastatic tumors (Fig. 5F and
G). In addition, there was a positive association between
HNF-4α and E-cadherin mRNA (Fig. 5H).
Compared with low-grade (I/II) RCC, HNF-4α and E-cadherin
expression exhibited a stronger positive correlation in high-grade
(III/IV) RCC (Fig. 5I-L). Notably,
low E-cadherin expression also predicted a poor prognosis in RCC
(Fig. 5M and N).
Discussion
HNF-4α is a liver-enriched transcription factor,
which belongs to the nuclear hormone receptor superfamily. It is
considered to be one of the central components of the HNF
regulatory network in hepatic cells. Substantial evidence has
revealed that HNF-4α is downregulated in human hepatocellular
carcinoma (HCC) tissues compared with in adjacent noncancerous
tissues, and that restoration of HNF-4α function may induce
differentiation of hepatoma cells into hepatocytes (8). Recently, HNF-4α introduction was
revealed to not only be able to attenuate liver fibrosis and
cirrhosis, but also completely block hepatocarcinogenesis (26). Furthermore, downregulation of HNF-4α
in HCC results in loss of epithelial morphology, dedifferentiation,
and acquirement of the ability to invade and metastasize, which
implies that HNF-4α may be a novel therapeutic target for HCC
(8). The present study revealed that
HNF-4α was downregulated in RCC and its downregulation was
associated with a poor prognosis in patients with RCC. In addition,
knockdown of HNF-4α expression significantly promoted the migration
and invasion of RCC cells. These results suggested that HNF-4α may
function as a tumor suppressor in the development of RCC. There is
no doubt that inactivation or downregulation of HNF-4α, which
confers a number of selective advantages to the tumor, is a
frequent event during tumor progression and is associated with a
more malignant tumor phenotype. These findings suggested that
HNF-4α may be considered a candidate tumor suppressor in tissue
types where it normally serves an important role. Whether HNF-4α
can be used as a prognostic indicator or a drug target is worth
further exploration.
E-cadherin expression may be regulated by various
transcription factors, including Snail and Slug, which belong to
the Snail family. Snail and Slug are able to bind to the promoter
and directly inhibit the transcription of E-cadherin (27–29).
Recently, the oncogenic serine/threonine kinase AKT has been
reported to suppress transcription of E-cadherin (24). Furthermore, E-cadherin may be a direct
transcriptional target of HNF-4α in HCC (30). The present results confirmed that
downregulation of E-cadherin in RCC may be mediated by HNF-4α.
Notably, a strong correlation was determined between the expression
of HNF-4α and E-cadherin in high-grade RCC cases, suggesting that
regulation of E-cadherin by HNF-4α may be closely associated with
the malignancy of RCC. As a transcription factor, whether HNF-4α
serves other roles in the occurrence, progression and treatment of
RCC, and its molecular mechanism are also worthy of further
study.
In conclusion, the present results demonstrated that
HNF-4α was downregulated and associated with a poor prognosis in
RCC. Low HNF-4α expression promoted cell invasion and migration in
RCC. In addition, E-cadherin may serve an important role in the
process through which HNF-4α regulates tumor invasion and
migration. Unfortunately, we failed to establish a mouse model of
RCC metastasis; further studies are required to explore whether
HNF-4α regulates tumor metastasis in vivo. Taken together,
the present findings provided a novel insight into the tumor
suppressor role of HNF-4α in RCC progression and thus may help
identify novel approaches for the treatment of RCC.
Supplementary Material
Supporting Data
Supporting Data
Acknowledgements
The authors would like to thank Dr Yong Zhang
(Rui-Jin Hospital) and Dr Shaoming Shen (Shanghai Jiaotong
University) for providing cells and vectors.
Funding
This work was supported by the National Natural
Science Foundation of China (grant nos. 81502197, 81472501 and
81772849) and the Fundamental Research Funds for the Central
Universities (grant no. 2016KJ050).
Availability of data and materials
The datasets used and/or analyzed during the current
study are available from the corresponding author on reasonable
request.
Authors' contributions
QW and XY designed the experiments and wrote the
manuscript. YG, YY, JG and QZ performed the majority of the
experiments and conducted the data analysis. DB, FW, ZC and LL
participated in sample collection and other experiments.
Ethics approval and consent to
participate
The present study was approved by the Medical
Ethical Committee of Shanghai Tenth People's Hospital. All patients
provided written informed consent prior to participation in the
present study based on the guidelines of the Medical Ethical
Committee of Shanghai Tenth People's Hospital prior to
participating in the present study.
Patient consent for publication
All patients provided written informed consent
before participation and agreed to publication of the present
study.
Competing interests
The authors declare that they have no competing
interests.
References
|
1
|
Erickson LA: Clear cell renal cell
carcinoma. Mayo Clin Proc. 93:813–814. 2018. View Article : Google Scholar : PubMed/NCBI
|
|
2
|
Ljungberg B, Bensalah K, Canfield S,
Dabestani S, Hofmann F, Hora M, Kuczyk MA, Lam T, Marconi L,
Merseburger AS, et al: EAU guidelines on renal cell carcinoma: 2014
update. Eur Urol. 67:913–924. 2015. View Article : Google Scholar : PubMed/NCBI
|
|
3
|
Siegel RL, Miller KD and Jemal A: Cancer
statistics, 2016. CA Cancer J Clin. 66:7–30. 2016. View Article : Google Scholar : PubMed/NCBI
|
|
4
|
Kaelin WG Jr: Treatment of kidney cancer:
Insights provided by the VHL tumor-suppressor protein. Cancer. 115
(Suppl 10):S2262–S2272. 2009. View Article : Google Scholar
|
|
5
|
Gao YH, Wu ZX, Xie LQ, Li CX, Mao YQ, Duan
YT, Han B, Han SF, Yu Y, Lu HJ, et al: VHL deficiency augments
anthracycline sensitivity of clear cell renal cell carcinomas by
down-regulating ALDH2. Nat Commun. 8:153372017. View Article : Google Scholar : PubMed/NCBI
|
|
6
|
Ljungberg B, Campbell SC, Choi HY, Jacqmin
D, Lee JE, Weikert S and Kiemeney LA: The epidemiology of renal
cell carcinoma. Eur Urol. 60:615–621. 2011. View Article : Google Scholar : PubMed/NCBI
|
|
7
|
Chen S, Wang Q, Wang L, Chen H, Gao X,
Gong D, Ma J, Kubra S, Yao X, Li X, et al: REGgamma deficiency
suppresses tumor progression via stabilizing CK1epsilon in renal
cell carcinoma. Cell Death Dis. 9:6272018. View Article : Google Scholar : PubMed/NCBI
|
|
8
|
Lazarevich NL and Fleishman DI:
Tissue-specific transcription factors in progression of epithelial
tumors. Biochemistry (Mosc). 73:573–591. 2008. View Article : Google Scholar : PubMed/NCBI
|
|
9
|
Morimoto A, Kannari M, Tsuchida Y, Sasaki
S, Saito C, Matsuta T, Maeda T, Akiyama M, Nakamura T, Sakaguchi M,
et al: An HNF4alpha-microRNA-194/192 signaling axis maintains
hepatic cell function. J Biol Chem. 292:10574–10585. 2017.
View Article : Google Scholar : PubMed/NCBI
|
|
10
|
Battle MA, Konopka G, Parviz F, Gaggl AL,
Yang C, Sladek FM and Duncan SA: Hepatocyte nuclear factor 4alpha
orchestrates expression of cell adhesion proteins during the
epithelial transformation of the developing liver. Proc Natl Acad
Sci USA. 103:8419–8424. 2006. View Article : Google Scholar : PubMed/NCBI
|
|
11
|
Wang Z and Burke PA: Hepatocyte nuclear
factor-4alpha interacts with other hepatocyte nuclear factors in
regulating transthyretin gene expression. FEBS J. 277:4066–4075.
2010. View Article : Google Scholar : PubMed/NCBI
|
|
12
|
Stegmann A, Hansen M, Wang Y, Larsen JB,
Lund LR, Ritié L, Nicholson JK, Quistorff B, Simon-Assmann P,
Troelsen JT and Olsen J: Metabolome, transcriptome, and
bioinformatic cis-element analyses point to HNF-4 as a central
regulator of gene expression during enterocyte differentiation.
Physiol Genomics. 27:141–155. 2006. View Article : Google Scholar : PubMed/NCBI
|
|
13
|
Hayhurst GP, Strick-Marchand H, Mulet C,
Richard AF, Morosan S, Kremsdorf D and Weiss MC: Morphogenetic
competence of HNF4 alpha-deficient mouse hepatic cells. J Hepatol.
49:384–395. 2008. View Article : Google Scholar : PubMed/NCBI
|
|
14
|
Lazarevich NL, Shavochkina DA, Fleishman
DI, Kustova IF, Morozova OV, Chuchuev ES and Patyutko YI:
Deregulation of hepatocyte nuclear factor 4 (HNF4) as a marker of
epithelial tumors progression. Exp Oncol. 32:167–171.
2010.PubMed/NCBI
|
|
15
|
Lazarevich NL, Cheremnova OA, Varga EV,
Ovchinnikov DA, Kudrjavtseva EI, Morozova OV, Fleishman DI,
Engelhardt NV and Duncan SA: Progression of HCC in mice is
associated with a downregulation in the expression of hepatocyte
nuclear factors. Hepatology. 39:1038–1047. 2004. View Article : Google Scholar : PubMed/NCBI
|
|
16
|
Sel S, Ebert T, Ryffel GU and Drewes T:
Human renal cell carcinogenesis is accompanied by a coordinate loss
of the tissue specific transcription factors HNF4 alpha and HNF1
alpha. Cancer Lett. 101:205–210. 1996. View Article : Google Scholar : PubMed/NCBI
|
|
17
|
van Staalduinen J, Baker D, Ten Dijke P
and van Dam H: Epithelial-mesenchymal-transition-inducing
transcription factors: New targets for tackling chemoresistance in
cancer? Oncogene. 2018.(Epub ahead of print). View Article : Google Scholar : PubMed/NCBI
|
|
18
|
Devlin JR and Verschuren EW: More than a
tumor suppressor: E-cadherin loss drives lung cancer metastasis. Am
J Respir Cell Mol Biol. 59:141–142. 2018. View Article : Google Scholar : PubMed/NCBI
|
|
19
|
Kourtidis A, Lu R, Pence LJ and
Anastasiadis PZ: A central role for cadherin signaling in cancer.
Exp Cell Res. 358:78–85. 2017. View Article : Google Scholar : PubMed/NCBI
|
|
20
|
Livak KJ and Schmittgen TD: Analysis of
relative gene expression data using real-time quantitative PCR and
the 2(-Delta Delta C(T)) method. Methods. 25:402–408. 2001.
View Article : Google Scholar : PubMed/NCBI
|
|
21
|
Shen SM, Guo M, Xiong Z, Yu Y, Zhao XY,
Zhang FF and Chen GQ: AIF inhibits tumor metastasis by protecting
PTEN from oxidation. EMBO Rep. 16:1563–1580. 2015. View Article : Google Scholar : PubMed/NCBI
|
|
22
|
Yu D, An X, Fan W, Wang X, He Y and Li B:
PNUTS mediates ionizing radiation-induced CNE-2 nasopharyngeal
carcinoma cell migration, invasion, and epithelial-mesenchymal
transition via the PI3K/AKT signaling pathway. Onco Targets Ther.
12:1205–1214. 2019. View Article : Google Scholar : PubMed/NCBI
|
|
23
|
Min HJ, Lee Y, Zhao XF, Park YK, Lee MK,
Lee JW and Kim S: TMPRSS4 upregulates uPA gene expression through
JNK signaling activation to induce cancer cell invasion. Cell
Signal. 26:398–408. 2014. View Article : Google Scholar : PubMed/NCBI
|
|
24
|
Li X, Bao C, Ma Z, Xu B, Ying X, Liu X and
Zhang X: Perfluorooctanoic acid stimulates ovarian cancer cell
migration, invasion via ERK/NF-κB/MMP-2/-9 pathway. Toxicol Lett.
294:44–50. 2018. View Article : Google Scholar : PubMed/NCBI
|
|
25
|
Yao HH, Zhao YJ, He YF, Huang DB and Wang
W: Knockdown of AGGF1 inhibits the invasion and migration of
gastric cancer via epithelial-mesenchymal transition through
Wnt/beta-catenin pathway. Cancer Cell Int. 19:412019. View Article : Google Scholar : PubMed/NCBI
|
|
26
|
Chang Z, Cai C, Han D, Gao Y, Li Q, Feng
L, Zhang W, Zheng J, Jin J, Zhang H and Wei Q: Anoctamin5 regulates
cell migration and invasion in thyroid cancer. Int J Oncol.
51:1311–1319. 2017. View Article : Google Scholar : PubMed/NCBI
|
|
27
|
Batlle E, Sancho E, Franci C, Domínguez D,
Monfar M, Baulida J and García De Herreros A: The transcription
factor snail is a repressor of E-cadherin gene expression in
epithelial tumour cells. Nat Cell Biol. 2:84–89. 2000. View Article : Google Scholar : PubMed/NCBI
|
|
28
|
Prokop JW, Liu Y, Milsted A, Peng H and
Rauscher FJ III: A method for in silico identification of
SNAIL/SLUG DNA binding potentials to the E-box sequence using
molecular dynamics and evolutionary conserved amino acids. J Mol
Model. 19:3463–3469. 2013. View Article : Google Scholar : PubMed/NCBI
|
|
29
|
Moreno-Bueno G, Cubillo E, Sarrio D,
Peinado H, Rodríguez-Pinilla SM, Villa S, Bolós V, Jordá M, Fabra
A, Portillo F, et al: Genetic profiling of epithelial cells
expressing E-cadherin repressors reveals a distinct role for Snail,
Slug, and E47 factors in epithelial-mesenchymal transition. Cancer
Res. 66:9543–9556. 2006. View Article : Google Scholar : PubMed/NCBI
|
|
30
|
Spath GF and Weiss MC: Hepatocyte nuclear
factor 4 provokes expression of epithelial marker genes, acting as
a morphogen in dedifferentiated hepatoma cells. J Cell Biol.
140:935–946. 1998. View Article : Google Scholar : PubMed/NCBI
|