Introduction
Ovarian cancer (OC) is the most prevalent
gynecological cancer worldwide, posing a significant threat to
women's health (1). Globally, the
primary factors contributing to OC-associated mortality include
delayed diagnosis, chemotherapy resistance, high metastasis rates
and heterogeneity (2). Despite the
ongoing development of novel targeted therapies and
chemotherapeutic drugs, the prognosis for OC remains unfavorable
due to resistance and recurrence (2). Therefore, it is imperative to explore
the pathogenic mechanisms of OC and to develop early diagnostic
indicators.
Kinesins are a class of evolutionarily conserved
motor proteins that generate motive force by hydrolyzing ATP and
binding to microtubules, thus serving an important role in various
aspects of intracellular transport and widely participating in
various physiological processes, including embryonic development,
axon transport and cell division (3). Previous studies have shown that most
kinesins are expressed at higher levels in tumors compared with
those in normal tissues (4–12). Kinesins consist of the kinesin heavy
chain and the kinesin light chain (KLC), with KLCs generally
considered to participate in cargo binding and regulation of motor
protein activity. There are four subtypes of KLCs: KLC1, KLC2, KLC3
and KLC4 (13). In lung cancer, it
has been demonstrated that KLC1, KLC2 and KLC4 are associated with
drug resistance and poor prognosis (5–7). In
OC, multiple members of the kinesin family are considered to
promote OC proliferation and migration, while being associated with
poor prognosis (8–12). However, there have been limited
reports on the pathways involved and the precise mechanisms related
to KLC3 in OC occurrence.
PI3K/AKT is an important intracellular signaling
pathway, which is involved in cell cycle regulation, proliferation,
glycation, epithelial-mesenchymal transition (EMT), cancer
development, tumor recurrence and drug resistance (14). The development and application of
small molecule inhibitors targeting this pathway have shown
promising clinical efficacy (15).
Publicly available data have indicated that ~70% of patients with
OC exhibit activation of the PI3K/AKT pathway. In addition, there
is strong preclinical and clinical evidence for potent PI3K/AKT
pathway inhibitors in OC; however, there are currently no Food and
Drug Administration-approved inhibitors for the treatment of OC
(15,16).
The aim of the current study was to investigate the
expression of KLC3 in OC tissue and its role in the proliferation
and migration of OC cells.
Materials and methods
Analysis of KLC3 expression and
prognosis using online databases
The Gene Expression Profiling Interactive Analysis
(GEPIA; http://gepia.cancer-pku.cn/) and Gene
Expression Omnibus (GEO; http://www.ncbi.nlm.nih.gov/geo/) databases were
utilized to assess the mRNA expression levels of KLC3 in OC. The
Cancer Genome Atlas (TCGA) TCGA-OV data (https://www.cancer.gov/ccg/research/genome-sequencing/tcga)
and the Genotype-Tissue Expression normal ovarian tissue data
(https://commonfund.nih.gov/genotype-tissue-expression-gtex)
were obtained from the GEPIA, and the GSE12470 (17) and GSE18520 (18) datasets were obtained from the GEO.
Tumor samples in all databases were not matched to normal samples,
the normal samples were from healthy individuals. Additionally, the
Kaplan-Meier plotter (http://kmplot.com/analysis/) was employed to
investigate the association between KLC3 expression and the
prognosis of patients with OC.
Clinical specimens and cell lines
Five patients with OC who underwent surgery at The
First Hospital of Lanzhou University (Lanzhou, China) between June
2022 and November 2022, along with five normal ovarian samples
(healthy controls), were collected for western blot analysis. The
average age of the healthy control group for western blotting and
IHC was 60 years old, including women aged between 55 and 62 years
old. Ovarian samples were obtained following hysterectomy for
benign gynecological diseases, such as abnormal uterine bleeding,
adenomyosis, uterine fibroids and uterine abscess. Furthermore, 48
OC tissues and 10 normal tissues collected from healthy controls
were obtained between January 2020 and January 2023 were used for
immunohistochemistry (IHC). Table I
provides the basic features of the patients, and International
Federation of Gynecology and Obstetrics staging was used in all
patients (19). All patients were
diagnosed with OC through pathological examination and their
clinical data were recorded. None of the patients had received
targeted therapy, chemotherapy or radiotherapy prior to surgery.
The present study was approved by the Ethics Committee of The First
Hospital of Lanzhou University (approval no. LDYYLL-2019-279), and
all tissues involved in the present study were stored in the
Biobank of The First Hospital of Lanzhou University, where all
samples were stored with the consent of patients. The medical
records were available for the participants, and all participants
provided written informed consent and their samples were
anonymized. The current study was conducted in compliance with the
International Conference on Harmonization guidelines for Good
Clinical Practice (20) and the
2013 Declaration of Helsinki. The SKOV3 and A2780 human OC cell
lines used in the present study were sourced from the Cell Resource
Center, Institute of Basic Medicine, Chinese Academy of Medical
Sciences. All cells were cultured in DMEM (Gibco; Thermo Fisher
Scientific, Inc.) supplemented with 10% FBS, 10 mg/ml streptomycin,
10,000 U/ml penicillin and 25 µg/ml amphotericin B (all from Gibco;
Thermo Fisher Scientific, Inc.) at 37°C and 5% CO2.
 | Table I.Basic characteristics of
patients. |
Table I.
Basic characteristics of
patients.
| Characteristic | Number (n=48) |
|---|
| Age, years | 50.3±8.6 |
| FIGO stage |
|
|
I–II | 21 (43.7%) |
|
III–IV | 27 (56.3%) |
| Lymph node
invasion |
|
|
Yes | 16 (33.3%) |
| No | 32 (66.7%) |
| Histological
grade |
|
| G1 | 4 (8.3%) |
| G2 | 7 (14.6%) |
| G3 | 37 (77.1%) |
Cell transduction and
transfection
The lentivirus design and packaging were provided by
Shanghai GeneChem Co., Ltd. The experimental group was divided into
two groups: The knockdown group and the overexpression group. The
knockdown groups included the short hairpin (sh)RNA negative
control (NC), shKLC3-64#, shKLC3-65# and shKLC3-66# groups, and the
overexpression groups included the Vector (empty vector) and KLC3
groups. All SKOV3 and A2780 cells were cultured in a constant
temperature incubator at 37°C and 5% CO2. According to
the transduction instructions, KLC3 knockdown plasmids with a pPLK
GFP+Puro plasmid backbone were provided by Shanghai GeneChem Co.,
Ltd. The 2nd generation system was used for plasmid packaging. A
total of 1.5 µg knockdown plasmids, 1 µg pCMV–VSV-G and 0.5 µg
pCAG-dR8.9 (both from Beyotime Institute of Biotechnology) were
transfected into 293T cells (The Cell Bank of Type Culture
Collection of The Chinese Academy of Sciences) in 6-well plates
using Lipofectamine® 3000 transfection reagent
(Invitrogen; Thermo Fisher Scientific, Inc.) according to the
manufacturer's instructions at 37°C. Lentiviral particles were
harvested 48 h post-transfection, followed by infection of SKOV3 OC
cells for 24 h. Cells (30% confluence) were seeded in cell culture
dishes and were infected with lentiviral plasmids at multiplicity
of infection (MOI) of 10. At 37°C and screening of the cells for 7
days with medium containing 2 µg/ml puromycin (Beyotime Institute
of Biotechnology). The target sequences of the knockdown lentiviral
plasmids were as follows: shNC, 5′-TGTCGCGGTAAGTGCCTCATA-3′;
shKLC3-64#, 5′-CAACAACTTGGCTGTCCTCTA-3′, shKLC3-65#,
5′-GACCCTGCATAACCTCGTGAT-3′ and shKLC3-66#,
5′-GCCACAGACCTTCTCCATGAT-3′.
In order to construct a plasmid for overexpressing
KLC3, full-length human KLC3 cDNA was first cloned into a p-Enter
plasmid (Shanghai GeneChem Co., Ltd.). The p-Enter-KLC3 construct
was then recombined into a Lenti-CMV expression vector to generate
the final Lenti-CMV-KLC3 plasmid for lentiviral packaging.
Lentiviral particles were produced by co-transfecting the
Lenti-CMV-KLC3 or Lenti-CMV-vector (negative control) plasmids with
the packaging plasmid pSPAX2 and the envelope plasmid pMD2.G into
293T cells (~70% confluence in 6-well plates) using Lipofectamine
3000 at 37°C, according to the manufacturer's protocol. After 6 h
of transfection, the medium was replaced with fresh complete
medium. For lentiviral transfection, the ratio of lentiviral
plasmid to packaging and envelope plasmids was
Lenti-CMV-KLC3/Lenti-CMV-vector: pSPAX2 (packaging plasmid): pMD2G
(envelope plasmid)=1:1:0.5 µg. After 36 h of culture, the virus was
harvested from the supernatant and concentrated with
lenti-X-concentrator (Shanghai GeneChem Co., Ltd.), and then added
to A2780 cells along with 5 µg/ml polybrene (Beyotime Institute of
Biotechnology). Cells (30% confluence) were seeded in cell culture
dishes and were infected with lentiviral plasmids at a MOI of 15 at
37°C. The cells were initially selected with medium containing 2.0
µg/ml puromycin (Beyotime Institute of Biotechnology) for 48 h. The
medium was then replaced with medium containing 5.0 µg/ml
puromycin, which was used for maintenance over a 7-day period to
establish stable cell lines. Western blotting was employed to
verify the infection efficiency, with the Lenti-CMV-vector serving
as the control.
For COL3A1 overexpression, SKOV3 cells were
transfected with a pcDNA3.1 plasmid (2 µg) encoding COL3A1 cDNA,
whereas empty vectors served as the NC group. All plasmids were
synthesized by Beijing Sino Technology Co. Ltd. The SKOV3 cells
were seeded in 6-well plates at a density of 1×10⁶/well
were transfected with the aforementioned plasmids (10 µg) using
Lipofectamine 2000 for 48 h at 37°C according to the manufacturer's
instructions. The cells were collected for subsequent experiments
48 h post-transfection. In addition, in the cells with both KLC3
knockdown and COL3A1 overexpression, SKOV3 cells were transfected
for 48 h with the COL3A1 plasmid after infection with shKLC3. In
addition, western blotting was used to verify the transfection
efficiency.
Reverse transcription-quantitative PCR
(RT-qPCR)
TRIzol® reagent (Invitrogen; Thermo
Fisher Scientific, Inc.) was used to extract total RNA from SKOV3
and A2780 cells, A NanoDrop 2000 spectrophotometer was used to
measure the RNA concentration, and cDNA was synthesized by RT of 1
µg total RNA according to the manufacturer's protocol of the RT kit
(cat. no. R233-01; Vazyme Biotech Co., Ltd.). A qPCR machine was
used to amplify cDNA using the SYBR Green qPCR Mix (cat. no.
Q711-02; Vazyme Biotech Co., Ltd.). The thermocycling conditions
for amplification were as follows: 95°C for 5 min, followed by 40
cycles at 95°C for 10 sec, 60°C for 30 sec and a final step at 95°C
for 15 sec, 60°C for 60 sec and 95°C for 15 sec. GAPDH was used as
an internal control. Subsequently, the 2−ΔΔCq method was
used to analyze the gene expression data (21). β-actin was used as an internal
control. The primer sequences were as follows: β-actin, forward
5′-GCGTGACATTAAGGAGAAGC-3′, reverse 5′-CCACGTCACACTTCATGATGG-3′;
KLC3, forward 5′-CTCAACATCCTGGCGCTGGT-3′, reverse
5′-TCCCGGTAACGCCCACGCTTC-3; CXCL12, forward
5′-TGCCCTTCAGATTGTAGCCC-3′, reverse 5′-CTGTAAGGGTTCCTCAGGCG-3′;
IGFL3, forward 5′-TGCTGTCCCGAGTCTTTTGG-3′, reverse
5′-GTGCCTCCTGTTCCTGGTA-3′; COL3A1, forward
5′-TAAAGGCGAAATGGGTCCCG-3′, reverse 5′-GGCACCATTCTTACCAGGCT-3′;
COL1A2, forward 5′-GAGGAGAGCCTGGCAACATT-3′, reverse
5′TCCACCTTGAACACCCTGTG-3′; TENM2, forward
5′-CAAAGAGTGTCGCTACACAAGC-3′, reverse 5′-TCCTGCTGTCATGGTCATAGG-3′;
CREB3L1, forward 5′-TGGAGAATGCCAACAGGACC-3′, reverse
5′-CCAGCACCAGAACAAAGCAC-3′; MMP13, forward
5′-CAGTTTGCAGAGCGCTACCT-3′, reverse 5′-TTCTCGGAGCCTCTCAGTCA-3′;
IGFBP5, forward 5′-ACAAGAGAAAGCAGTGCAAACC-3′, reverse
5′-CGTCAACGTACTCCATGCCT-3′; SLC14A1, forward
5′-AGCCAGCTAGAGTGGTCTTT-3′, reverse 5′-TCCAAACAGGACCATGACGG-3′;
SPARC, forward 5′-TTCGGCATCAAGCAGAAGGAT-3′, reverse
5′-TTAGCACCTTGTCTCCAGGC-3′.
Xenograft model
A total of 12 4-week-old female BALB/c nude mice
(weight, 15–16 g) were purchased from Beijing Vital River
Laboratory Animal Technology Co., Ltd. The mice were housed in the
animal facility under standard conditions, with a controlled
temperature of 25±2°C and humidity of 55±5%, under a 12-h
light/dark cycle, with free access to water and food. Each mouse
received a subcutaneous injection of 100 µl (5×10⁶) cell
suspension into the right flank with shNC-infected SKOV3 cells,
shKLC3-infected SKOV3 cells, Vector-infected A2780 cells or
KLC3-overexpressing A2780 cells. The study was terminated based on
tumor volume (~1,500 mm3) as the humane endpoint. Mice
injected with shNC-infected SKOV3 cells and shKLC3-infected SKOV3
cells were sacrificed on day 24, whereas mice injected with
Vector-infected A2780 cells and KLC3-overexpressing A2780 cells
were sacrificed on day 21. Notably, no mice succumbed before
reaching the humane endpoint criteria. Tumor volume was measured
twice per week using electronic calipers and the animals were
weighed five times per week. At the end of the study, mice were
euthanized by CO2 asphyxiation (30% vol/min) followed by
cervical dislocation as noted in the IACUC-approved protocol, and
the tumors were excised, weighed and cut in half. No analgesics
were administered during the study since flank tumor studies are
considered painless. Animal experiments were approved by the Animal
Experimental Ethics Committee of The First Hospital of Lanzhou
University (approval no. LDYYLL-2023-495).
IHC
Samples were fixed in 10% neutral formalin fixative
solution (BBI Solutions) embedded in paraffin at room temperature
overnight, and divided into 3-µm sections, which were
deparaffinized with xylene and then rehydrated with a succession of
decreasing alcohol concentrations (100, 95, 85, 70 and 50%
ethanol). Tissue sections were then placed in antigen retrieval
buffer (pH 9.0; Wuhan Servicebio Technology Co., Ltd.) in a
microwave oven on medium power for 8 min until boiling, then cooled
for 8 min and switched to medium-low power for 7 min. After natural
cooling, the slides were placed in PBS (pH 7.4; Wuhan Servicebio
Technology Co., Ltd.) and washed three times on a destaining
shaker. Subsequently, 3% hydrogen peroxide solution was added to
the sample at room temperature for 25 min to block endogenous
peroxidase, followed by blocking with 3% BSA (Sangon Biotech Co.,
Ltd.) at room temperature for 30 min. The histological sections
were then incubated at 4°C overnight with rabbit anti-KLC3 antibody
(1:200; cat. no. ab180523; Abcam) and anti-PCNA antibody (1:200;
cat. no. 10205-2-AP; Proteintech Group, Inc.), and with a
horseradish peroxidase-conjugated goat anti-rabbit IgG secondary
antibody (1:200; cat. no. SA00001-2; Proteintech Group, Inc.) at
37°C for 30 min. Sections were then counterstained with 0.1%
hematoxylin (Boster Biological Technology) at room temperature for
2 min and were stained with the chromogen DAB (Boster Biological
Technology). With an objective magnification of ×200 or ×400,
histological images were captured using a light microscope (cat.
no. AE2000; Motic Incorporation, Ltd.). A total of 10 normal
ovarian tissue samples and 48 OC tissue samples, as well as mouse
tumor tissues were selected for assessing expression levels. The
IHC scores were independently evaluated by two pathologists.
Staining intensity was categorized as 0, no staining; 1, weak
staining; 2, moderate staining; and 3, strong staining. Based on
the extent of brown staining, the stained area was divided into
percentages ranging from 1 to 99%. Finally, the staining intensity
and stained area were each multiplied by 100. The patients were
divided into two groups, high and low expression, according to the
median value.
Cell Counting Kit (CCK)-8 assay
For the CCK-8 assay, wild-type and infected cells
were seeded in 96-well plates and incubated with CCK-8 Reagent
(Shanghai Yeasen Biotechnology Co., Ltd.) for 2 h over 5
consecutive days. The CCK-8 reagent was added for a 2-h incubation
period. Absorbance at 450 nm was subsequently measured using a
microplate reader.
Colony formation assay
Wild-type and infected/transfected cells were seeded
at a density of 500 cells/well in 6-well plates. After 14 days, the
cells were stained with 10% Giemsa (Beijing Biotopped Technology
Co., Ltd.) at room temperature for 10 min after being fixed with
methanol at room temperature for 30 min. To assess the colony
formation capacity of the cells, visible colonies were counted. A
dense conglomerate of cells was regarded as a colony when the
number of cells exceeded 50. ImageJ software [Fiji (https://imagej.net/software/fiji/downloads) (National
Institutes of Health)] was used to count the number of colonies.
This experiment was repeated three times.
Comet assay
Cells were cultured in 6-well plates until they
reached ~30% confluence. The transduced cells were subsequently
trypsinized and collected by centrifugation at 1,200 × g for 5 min
at 4°C, forming a compact pellet. After washing, the cells were
resuspended in 200 µl ice-cold 1X PBS. Subsequently, the cell
suspension was carefully mixed at a ratio of 1:10 with low melting
point agarose maintained at 42°C and was promptly pipetted onto the
designated CometSlide™ area (Shanghai Yeasen Biotechnology Co.,
Ltd.). Slides were incubated in the dark at 4°C for 30 min,
followed by immersion in chilled lysis solution (Trevigen, Inc.;
Bio-Techne) at 4°C for 30 min. The slides were then incubated in
alkaline unwinding buffer (0.3 N NaOH, 1 mM EDTA) at room
temperature for 30 min. The slides were then transferred to a
horizontal electrophoresis chamber and subjected to electrophoresis
using buffer (0.3 N NaOH, 1 mM EDTA) at an electric field strength
of 1 V·cm−1 for 20 min. Following electrophoresis, the
samples were dried and stained with ethidium bromide. The comet
tails were visualized under a DM 2500 fluorescence microscope
(Leica Microsystems GmbH) and were quantified using Komet 5.5
software (Andor Technology Ltd.). A minimum of 50 cells were
analyzed per treatment condition. All experiments were conducted
independently at least three times.
Wound healing assay
Infected/transfected cells were cultured to ~90%
confluence in 12-well plates and a wound was introduced using a
sterile 200-µl pipette tip. After washing twice with PBS, cells
were cultured in DMEM/F12 without FBS for 48 h. Cell images were
obtained using fluorescence microscopy (IX73; Olympus Corporation).
Wound sizes were measured with ImageJ 1.5.2a software and were
calculated as a percentage (from 0 to 24 h).
Transwell migration assay
Transwell migration assays were conducted using
24-well plates fitted with membranes containing 8-µm pores
(Corning, Inc.). Cells were seeded on the upper chamber without
serum at a density of 2×10⁴ cells/well, whereas complete
medium supplemented with 10% FBS, 10 mg/ml streptomycin, 10,000
U/ml penicillin and 25 µg/ml amphotericin B was added to the lower
chamber. After a 24-h incubation period at 37°C, the cells were
removed from the upper chamber using a cotton swab followed by
fixation with 4% formaldehyde at room temperature for 30 min and
staining with Giemsa solution at room temperature for 15 min. The
assessment of migration involved counting cell numbers in 10 random
fields under a light microscope (Leica Microsystems, Inc.); this
process was repeated three times for accuracy and consistency.
Apoptosis assay
For the apoptosis assay, the cells were harvested,
washed with PBS, suspended in binding buffer and sequentially
stained with the Annexin V-FITC Detection Kit (Roche Applied
Science) according to the manufacturer's protocol. Subsequently,
apoptotic cells were detected using a FacsCalibur flow cytometer
(BD Biosciences), and the results were analyzed using CellQuest
version 3.3 software (BD Biosciences). Each experiment was
performed in triplicate.
Western blotting
Total proteins were extracted from cells and tissues
using RIPA lysis buffer and PMSF at a ratio of 1:100 (Beyotime
Institute of Biotechnology). Phosphorylated proteins were extracted
separately with the addition of phosphatase inhibitors (Biosharp
Life Sciences). The protein levels were quantified using a BCA
assay kit. Subsequently, an equal volume of protein mixture (30 µg)
was pipetted into the wells of the gel matrix (containing 30%
acrylamide), and the electrical potential was fixed at 120 volts
for the purpose of conducting gel electrophoresis. After a 30-min
transfer, the PVDF membrane was immersed in a solution of 5%
non-fat milk powder and blocked for 2 h at 25°C. Subsequently,
membranes were washed three times with TBS-0.1% Tween 20 (TBST),
followed by incubation with the primary antibodies overnight at
4°C, three further washes with TBST and incubation with a
HRP-conjugated secondary antibody (anti-rabbit IgG; 1:5,000; cat.
no. GTX213110; GeneTex, Inc.) for 2 h at 25°C. Chemiluminescent
solution was then added for 10 sec for visualization. The following
primary antibodies were used: KLC3 (1:1,000; cat. no. ab180523),
E-cadherin (1:10,000; cat. no. ab40772), N-cadherin (1:10,000; cat.
no. ab76011), Vimentin (1:5,000; cat. no. ab92547), Snail (1:1,000;
cat. no. ab216347), GAPDH (1:5,000; cat. no. ab8245) and α-tubulin
(1:10,000; cat. no. ab7291) (all from Abcam); PALB2 (1:2,000; cat.
no. 14340-1-AP), XRCC1 (1:1,000; cat. no. 21468-1-AP), XRCC2
(1:20,000; cat. no. 20285-1-AP) and COL3A1 (1:1,000; cat. no.
22734-1-AP) (all from Proteintech Group, Inc.); AKT (1:1,000; cat.
no. 9272), PI3K (1:1,000; cat. no. 4292), phosphorylated (p-)AKT
(1:1,000; cat. no. 4060) and p85α (also known as p-PI3K; 1:1,000;
cat. no. 4228) (all from Cell Signaling Technology, Inc.). Protein
visualization was achieved using a highly sensitive ECL substrate
kit (Beyotime Institute of Biotechnology). All results were
normalized to the internal reference proteins GAPDH and tubulin.
Densitometric analysis was carried out using ImageJ 1.5.2a
software.
RNA-sequencing (RNA-seq)
Total RNA was extracted from SKOV3 cells infected
with shKLC3 and shNC using a RNeasy Mini Kit (Qiagen, Inc.), and
RNA quality was assessed using an Agilent Bioanalyzer (Agilent
Technologies, Inc.). Samples with RNA integrity number >7.0 were
used for library preparation. A total of 4 µg DNase-treated RNA
from each sample was used to construct cDNA libraries using the
TruSeq Stranded Total RNA Library Prep Kit (cat. no. 20020597;
Illumina, Inc.), according to the manufacturer's protocol. RNA was
fragmented and subjected to two rounds of cDNA synthesis and
adapter ligation. Libraries were quantified using qPCR
(concentration >2 nM) and qualified using an Agilent 2100
Bioanalyzer. Paired-end 100 bp reads were generated on the Illumina
NovaSeq 6000 and HiSeq X Ten platforms (NovaSeq 6000 S1 Reagent
Kit, 300 cycles; cat. no. 20012863-1; Illumina, Inc.). High-quality
reads were obtained by trimming adapters and filtering low-quality
reads. Read alignment and differential gene expression analysis
were performed using the DESeq2 package (v1.26.0; http://github.com/thelovelab/DESeq2),
and genes with a false discovery rate-adjusted P-value (q-value)
<0.05 were considered significantly differentially
expressed.
Bioinformatics analyses
Multivariate and principal component analyses were
performed using the ClustVis online tool (https://github.com/fw1121/ClustVis). Functional
enrichment analysis was performed using Metascape (https://metascape.org/gp/index.html#/main/step1)
(22). Metascape pathway enrichment
analysis uses Kyoto Encyclopedia of Genes and Genomes (https://www.genome.jp/kegg/kegg_ja.html), Reactome
(https://reactome.org/) and MSigDB (https://www.gsea-msigdb.org/gsea/msigdb). Statistical
significance of gene overrepresentation was assessed using a
hypergeometric test (Fisher's exact test), followed by Bonferroni
correction for multiple comparisons. Heatmaps and volcano plots
were generated using TBtools (v 1.055; http://github.com/CJ-Chen/TBtools/releases).
Co-immunoprecipitation (co-IP)
Cells were lysed with 250 µl NP-40 lysis buffer
(cat. no. P0013F; Beyotime Institute of Biotechnology) for 30 min
on ice and then centrifuged at 16.2 × g and 4°C for 10 min to
remove cell fragments. The protein lysate (200 µl), bound to 25 µl
magnetic beads (cat. no. 88802; Thermo Fisher Scientific, Inc.)
with anti-KLC3 (1:50; cat. no. ab180523; Abcam), anti- COL3A1
(1:50; cat. no. 22734-1-AP; Proteintech Group, Inc.) or IgG (1:200;
cat. no. 10284-1-AP; Proteintech Group, Inc.) antibodies, was
incubated overnight at 4°C. The next day, the magnetic beads were
adsorbed using a magnetic grate and washed with lysis buffer
(Thermo Fisher Scientific, Inc.). The lysis buffer was transferred
to the newly washed column and incubated at 4°C for 2 h. After
incubation, the supernatant was discarded and washed five times
with 500 µl IP-specific lysis buffer (cat. no. 26149; Thermo Fisher
Scientific, Inc.). Finally, KLC3 and COL3A1 levels were analyzed by
western blotting using anti-KLC3 (1:200; cat. no. ab180523; Abcam)
and anti-COL3A1 (1:200; cat. no. 22734-1-AP; Proteintech Group,
Inc.) antibodies.
Statistical analysis
Statistical analysis was conducted using SPSS 20.0
software (IBM Corp.) and GraphPad Prism version 8.0.2 (Dotmatics).
Each experiment was performed in triplicate and continuous data are
presented as the mean ± standard deviation. The differences between
experimental groups were analyzed using one-way ANOVA followed by
Bonferroni's post hoc test or unpaired two-tailed Student's t-test.
Survival analysis was performed using the Kaplan-Meier method and
log-rank test. P<0.05 was considered to indicate a statistically
significant difference.
Results
KLC3 expression and survival analysis
in OC
To assess the relationship between KLC3 and OC, the
present study initially examined the expression of KLC3 in the
GEPIA database, which revealed high mRNA levels of KLC3 in OC
compared with normal tissue (Fig.
1A). Subsequently, the present study investigated the
expression of KLC3 in the GSE12470 and GSE18520 datasets, and its
expression was also significantly elevated in OC tissues compared
with in tissues from healthy controls in these datasets (Fig. 1B and C). The Kaplan-Meier curve
analysis demonstrated that patients with OC and low KLC3 expression
had a better prognosis in different probesets: 1570402_at (HR=1.39,
95% CI 1.13–1.7) and 239853_at (HR=1.52, 95% CI 1.24–1.87)
(Fig. 1D and E). Additionally, the
results of IHC indicated that the expression of KLC3 was higher in
OC tissues than that in normal tissues (Fig. 1F). Western blot analysis of five OC
samples and five normal samples also revealed an elevated
expression of KLC3 in OC (Fig. 1G).
Finally, based on the expression levels of KLC3 in OC, 48 patients
were categorized into high and low expression groups. The results
revealed that patients with OC and high KLC3 expression had a
poorer overall survival rate (Fig.
1H). Based on these findings, it could be hypothesized that
KLC3 serves a notable role in the development and progression of
OC, warranting further investigation into its function.
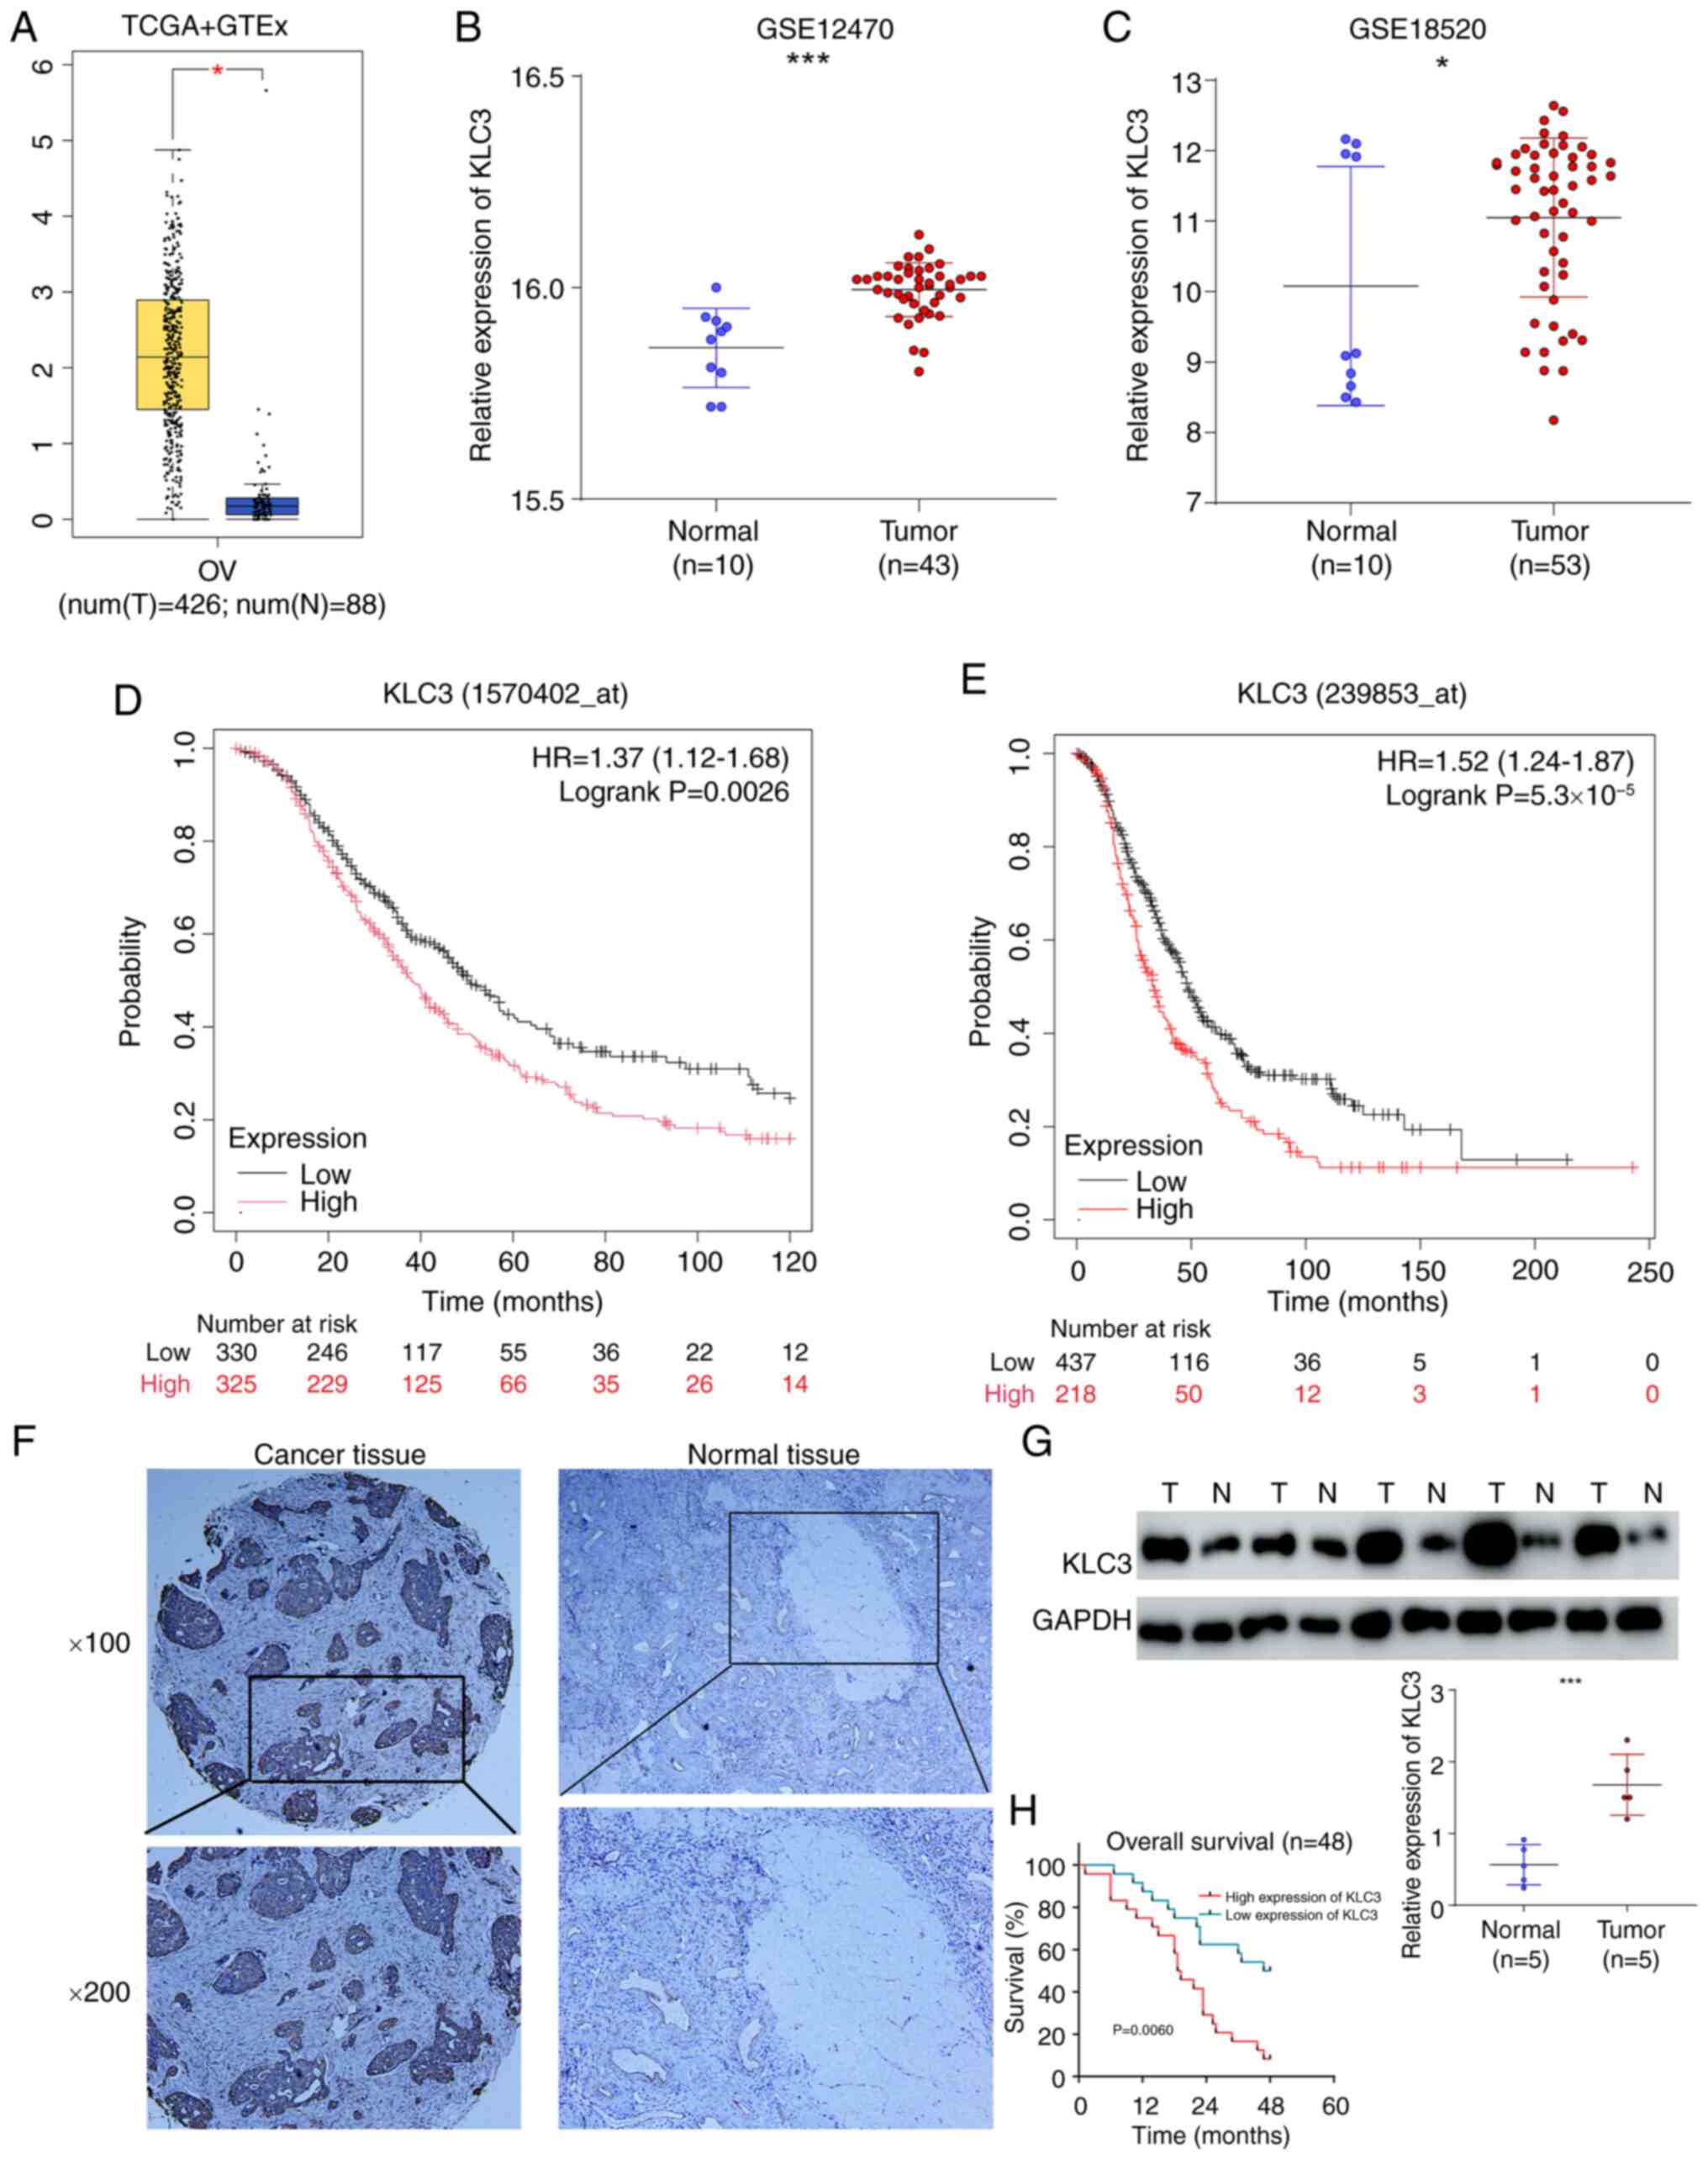 | Figure 1.Bioinformatics analysis shows that
KLC3 is highly expressed in OC tissues and is associated with poor
prognosis. (A) KLC3 mRNA expression levels were determined by Gene
Expression Profiling Interactive Analysis. Boxplot analysis shows
the expression levels in log2 (TPM + 1). KLC3 mRNA levels in OC
tissues and N ovarian tissues in the (B) GSE12470 and (C) GSE18520
datasets. Kaplan-Meier plotter database was used to assess the
overall survival in different probes: (D) 1570402_at (HR=1.39, 95%
CI 1.13–1.7, P=0.0017) and (E) 239853_at (HR=1.52, 95% CI
1.24–1.87, P=5.3×10⁻⁵). (F) Representative
immunohistochemical staining of KLC3 protein expression in OC and N
ovarian tissues. (G) Western blot analysis of the protein levels of
KLC3 in five OC tissues and five ovarian tissue. (H) Overall
survival of all patients in relation to KLC3 expression.
*P<0.05, ***P<0.001. GTEx, Genotype-Tissue Expression; KLC3,
kinesin light chain 3; N, normal; OC, ovarian cancer; T, tumor;
TCGA, The Cancer Genome Atlas. |
Effect of KLC3 alterations on OC cell
proliferation, migration, apoptosis and DNA damage repair
capacity
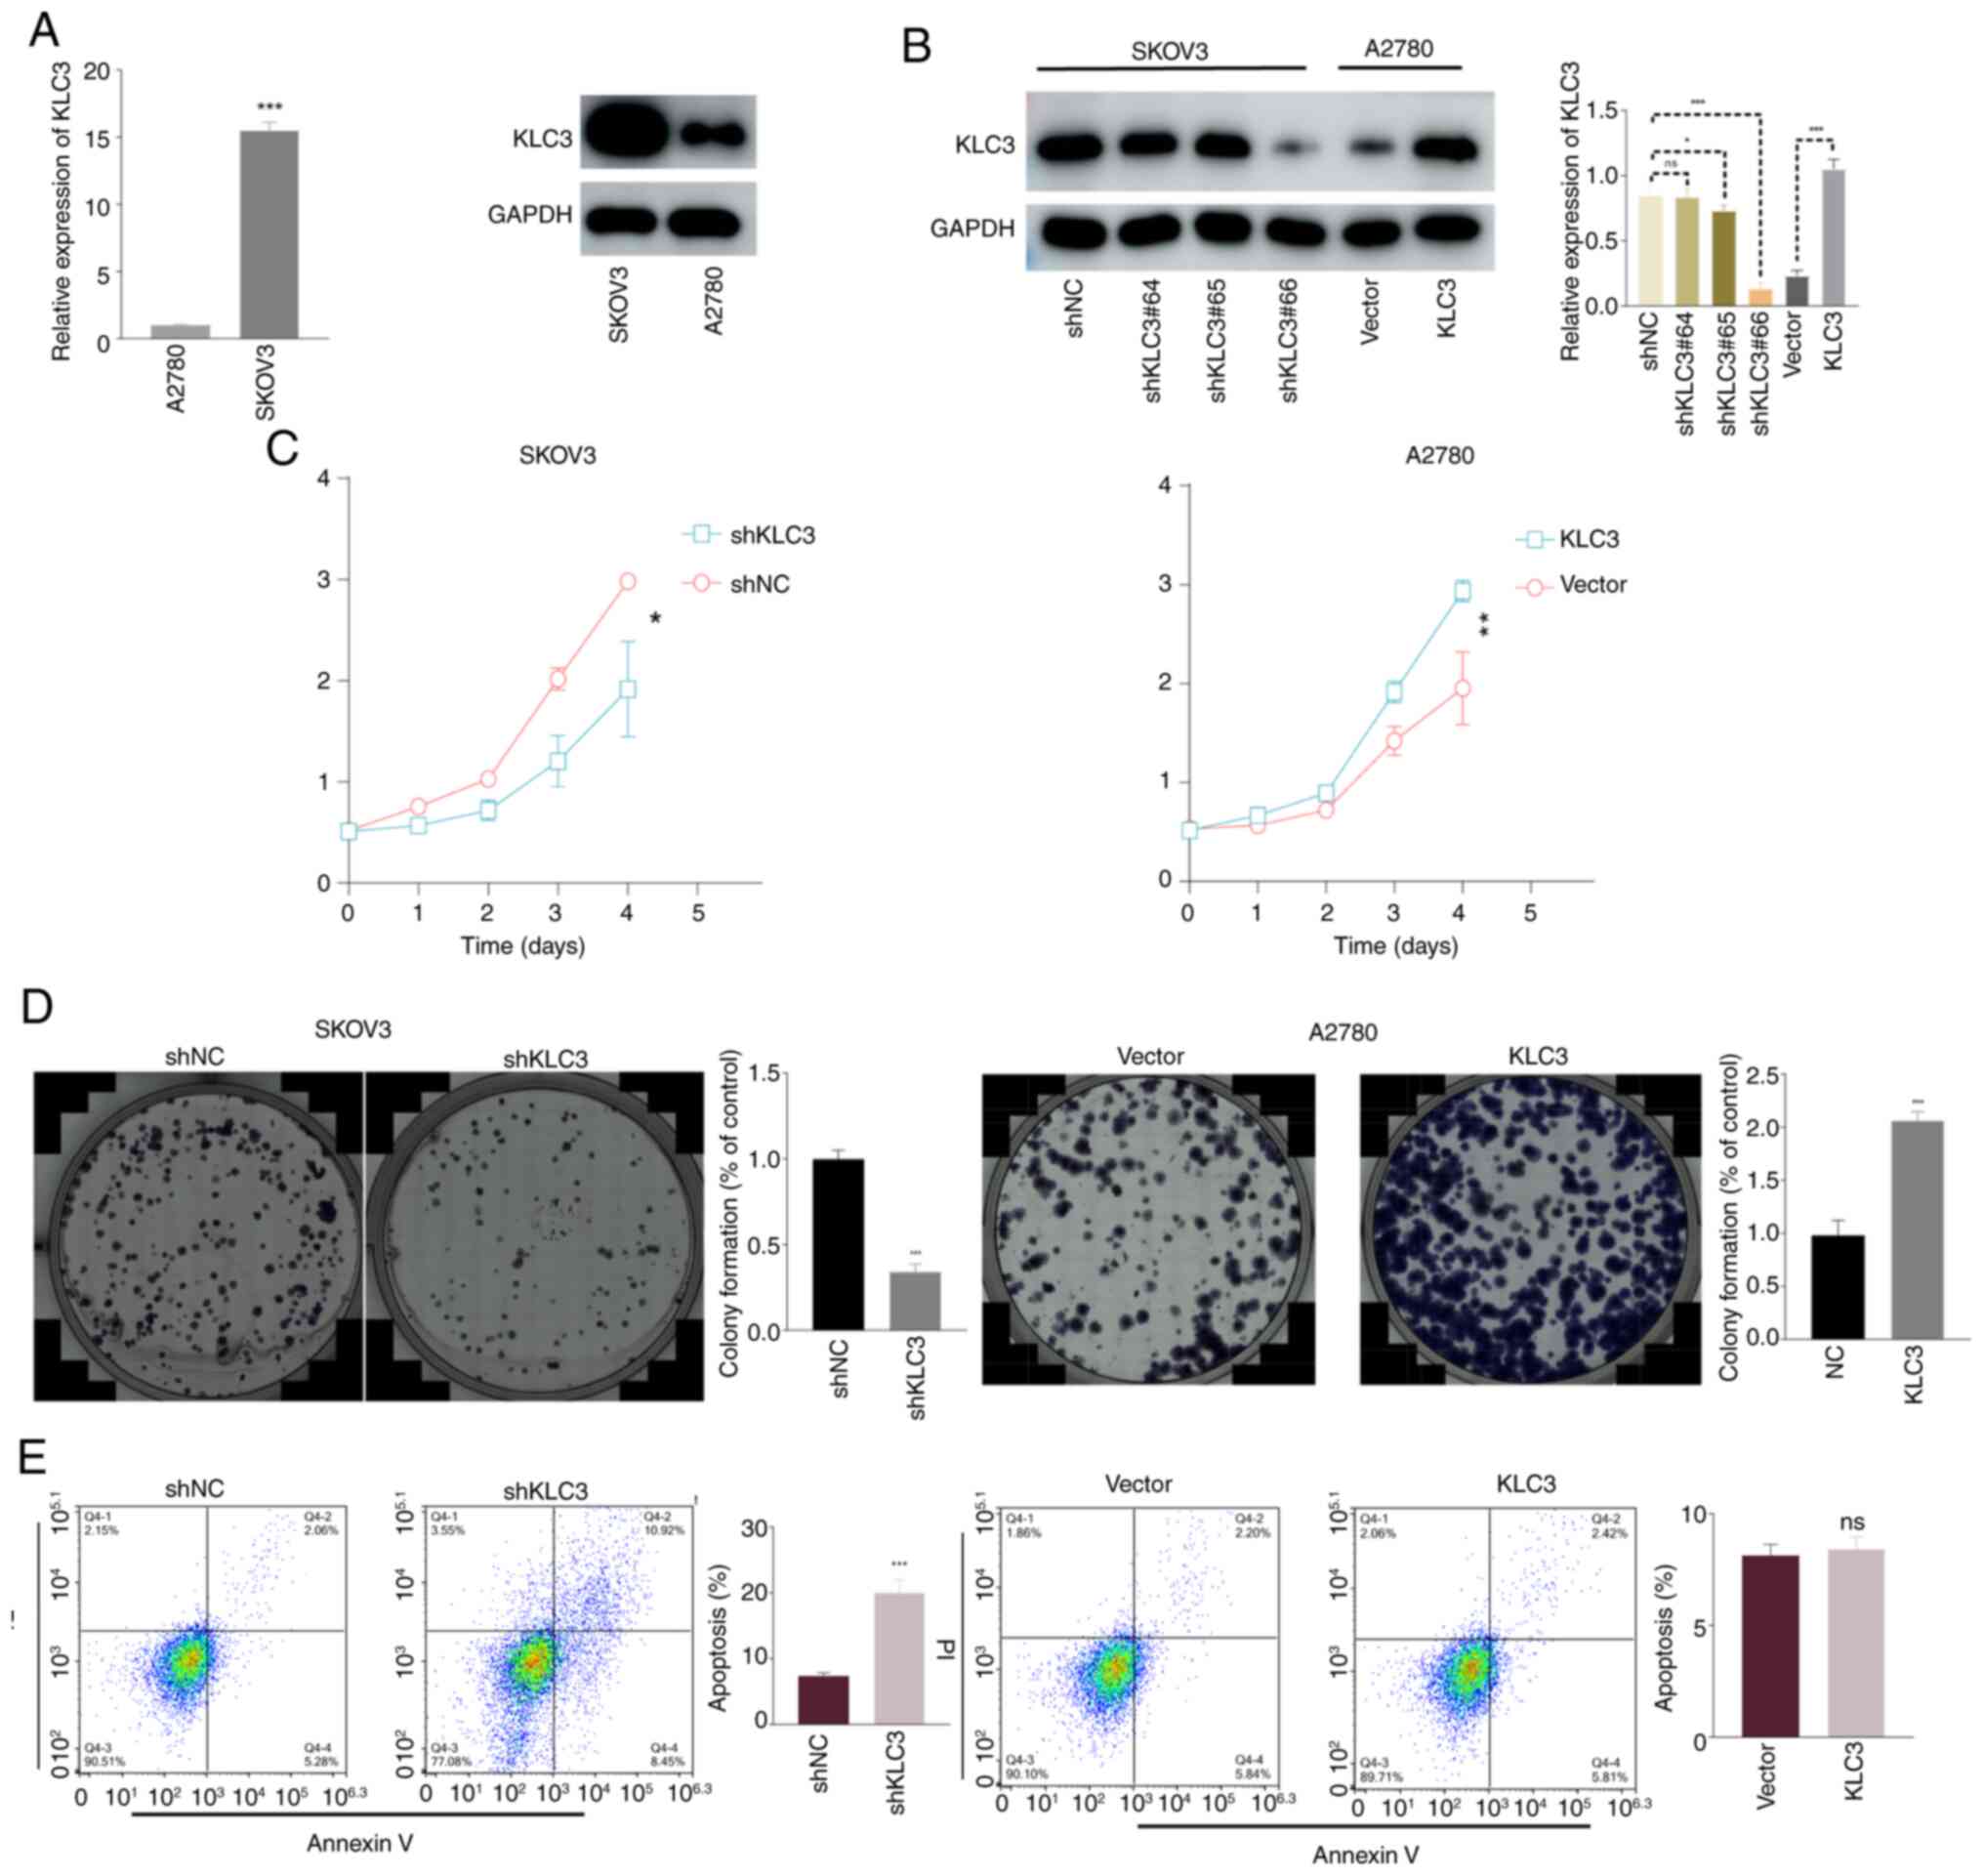
The present study examined the mRNA and protein
expression levels of KLC3 in two OC cell lines, SKOV3 and A2780. As
shown in Fig. 2A, the expression of
KLC3 was significantly higher in SKOV3 cells compared with that in
A2780 cells. To investigate the functional role of KLC3 in OC,
lentiviral knockdown of KLC3 was performed in the SKOV3 cell line
and overexpression of KLC3 was induced in the A2780 cell line.
Notably, shKLC3#66 exhibited optimal knockdown efficiency
(subsequently denoted as shKLC3), achieving a knockdown rate of
80%, and the overexpression vector met the experimental standards
for subsequent analyses (Fig.
2B).
To assess proliferation, the CCK-8 assay was
performed over 5 consecutive days. The results revealed a
significant reduction in proliferation following KLC3 knockdown,
whereas proliferation was enhanced in response to KCL3
overexpression (Fig. 2C). The
colony formation assay demonstrated diminished colony-forming
ability following KCL3 knockdown relative to the control group,
whereas this ability was enhanced post-KCL3 overexpression
(Fig. 2D).
When investigating the relationship between KLC3 and
apoptosis, it was revealed that knocking down KLC3 significantly
increased the apoptosis of OC cells, whereas overexpression of KLC3
did not result in a noticeable change in apoptosis levels (Fig. 2E). Similarly, compared with in the
control group, knockdown of KLC3 weakened the migratory ability of
OC cells in the Transwell assay; however, overexpression of KLC3
did not lead to a significant change in the migratory ability of
A2780 cells (Fig. 3A). In order to
further investigate the underlying mechanisms, changes in
EMT-related proteins, such as E-cadherin, N-cadherin, Snail and
Vimentin, were examined through western blotting. It was observed
that when the expression of KLC3 was knocked down, there was a
corresponding decrease in the expression levels of N-cadherin,
Snail and Vimentin, whereas an increase in E-cadherin expression
was noted. Conversely, when KLC3 expression was increased, there
was a concomitant increase in the expression levels of N-cadherin,
Snail and Vimentin, with a decrease in E-cadherin expression
(Fig. 3B).
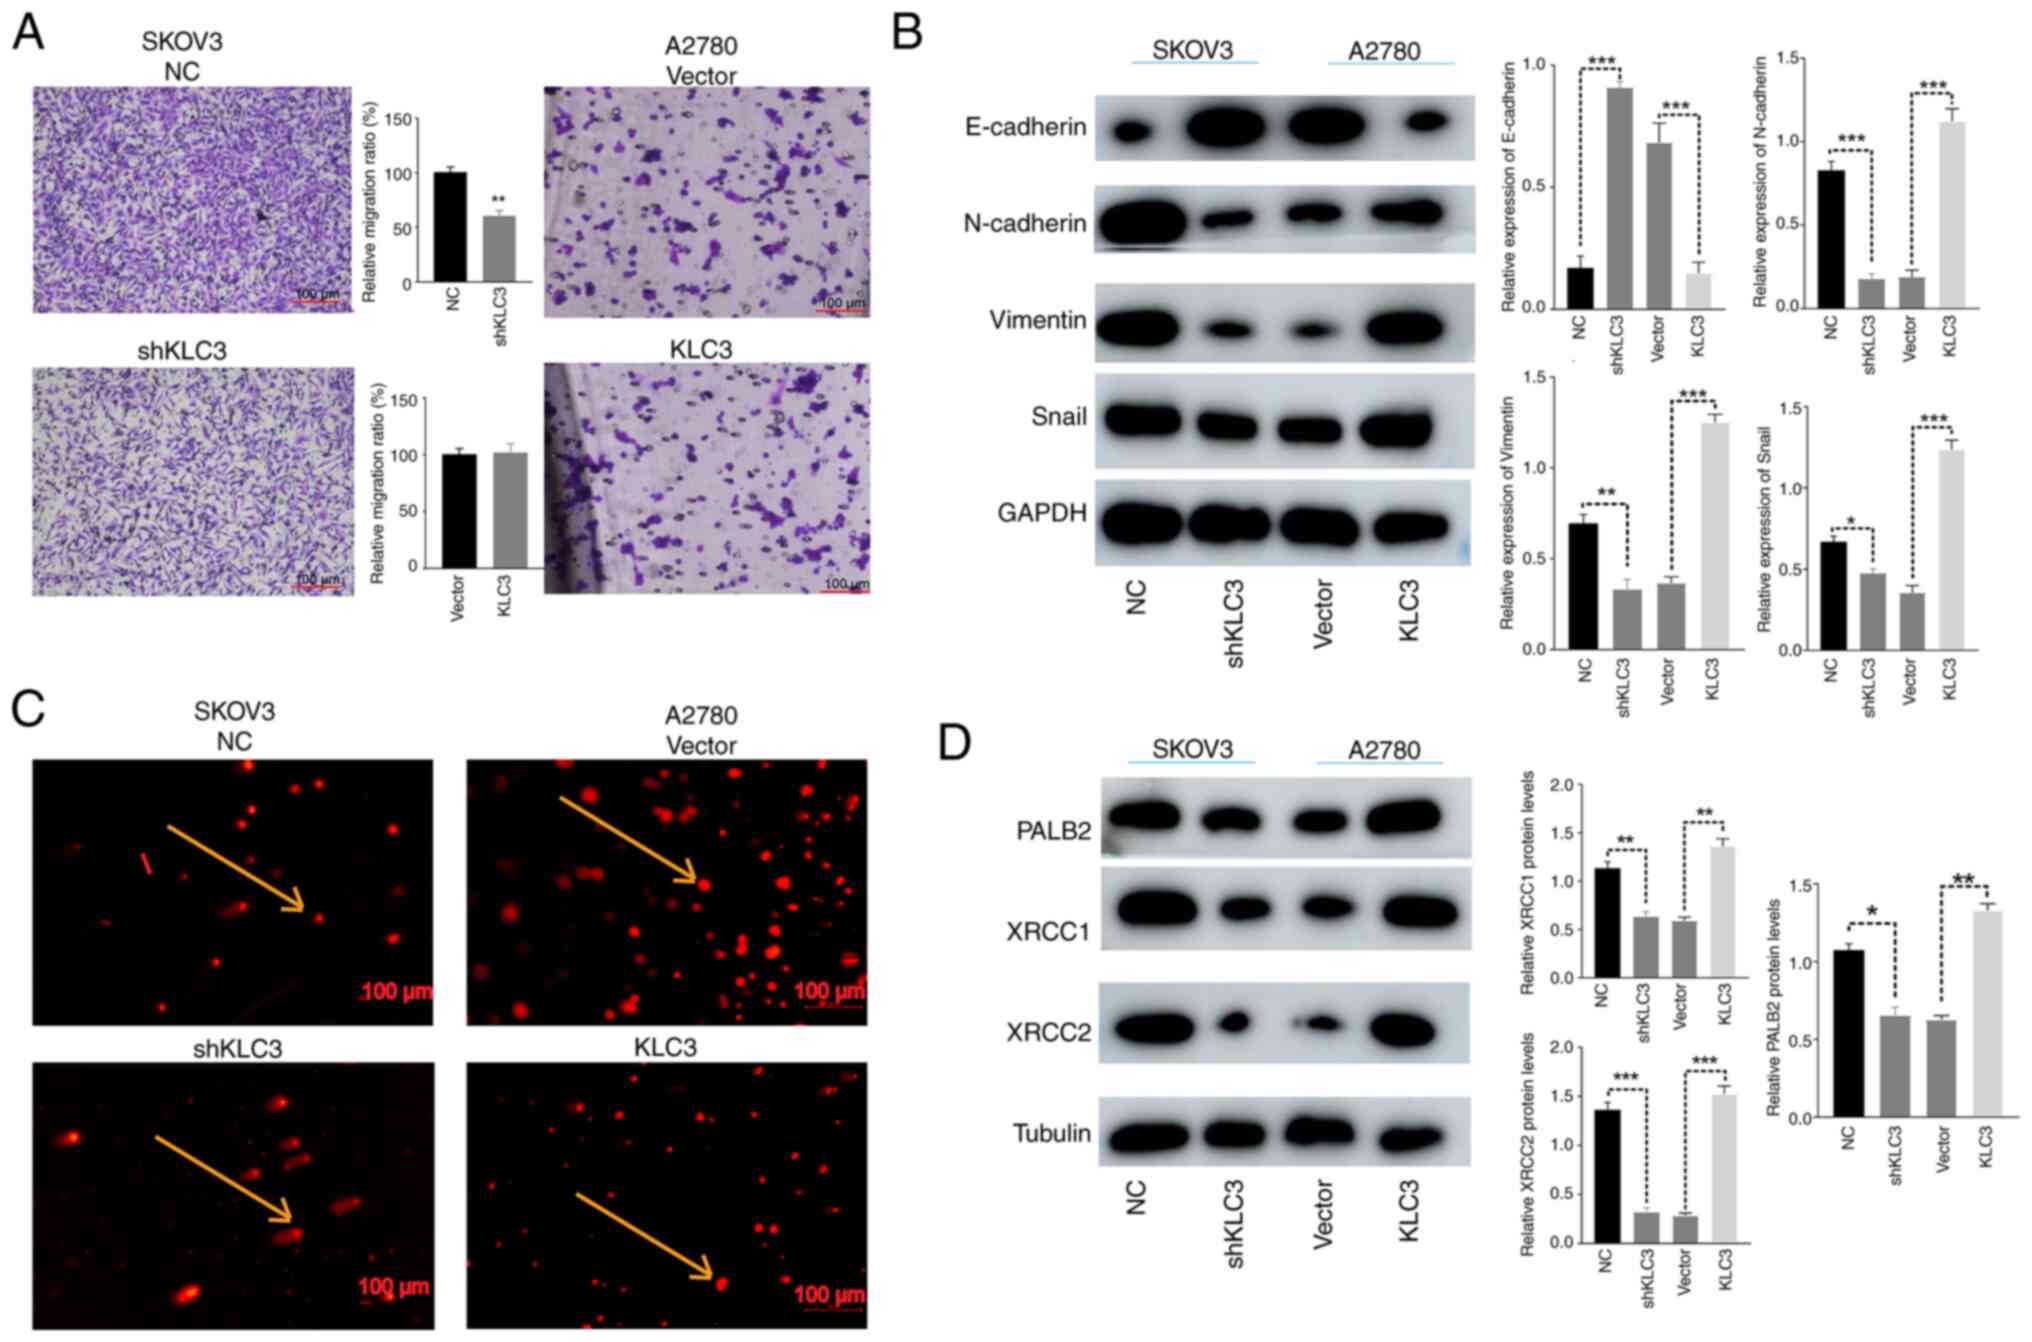 | Figure 3.Effects of KLC3 on the migration and
DNA damage of OC cells. (A) Migration of lung cancer cells was
analyzed using a Transwell assay. Scale bar, 100 µm. (B) Expression
levels of epithelial-mesenchymal transition-associated proteins in
OC cells, detected by western blotting. (C) DNA double-strand
breakage was observed using the comet assay. The cells indicated by
arrows represent intact DNA strands (SKOV3 NC and A2780 Vector) and
broken DNA strands (SKOV3 shKLC3 and A2780 KLC3). Scale bar, 100
µm. (D) Western blot analysis of XRCC1, XRCC2 and PALB2 expression.
The mean grayscale of bands was semi-quantitatively analyzed.
*P<0.05, **P<0.05, ***P<0.001. KLC3, kinesin light chain
3; NC, negative control; OC, ovarian cancer; sh, short hairpin. |
DNA damage is a known instigator in the
transformation of normal cells into tumor cells. In the context of
cancer treatment, augmenting the efficacy of radiotherapy and
chemotherapy involves impeding DNA damage repair in tumor cells
through diverse modalities. The association between KLC3 expression
and resistance to DNA damage in OC was substantiated through the
comet assay. The reduced expression of KLC3 resulted in a marked
increase in uncoiled and damaged DNA strands and fragments, whereas
overexpression of KLC3 exhibited minimal impact on DNA damage
(Fig. 3C). Examination of the DNA
damage-associated proteins XRCC1, XRCC2 and PALB2 revealed that
diminished expression of KLC3 corresponded to reduced expression
levels of XRCC1, XRCC2 and PALB2; conversely, overexpression of
KLC3 was associated with elevated levels of these proteins
(Fig. 3D). These collective
findings indicated that KLC3 may have a pivotal role in various
malignant phenotypes, as well as anti-DNA damage repair mechanisms,
within human OC cell lines.
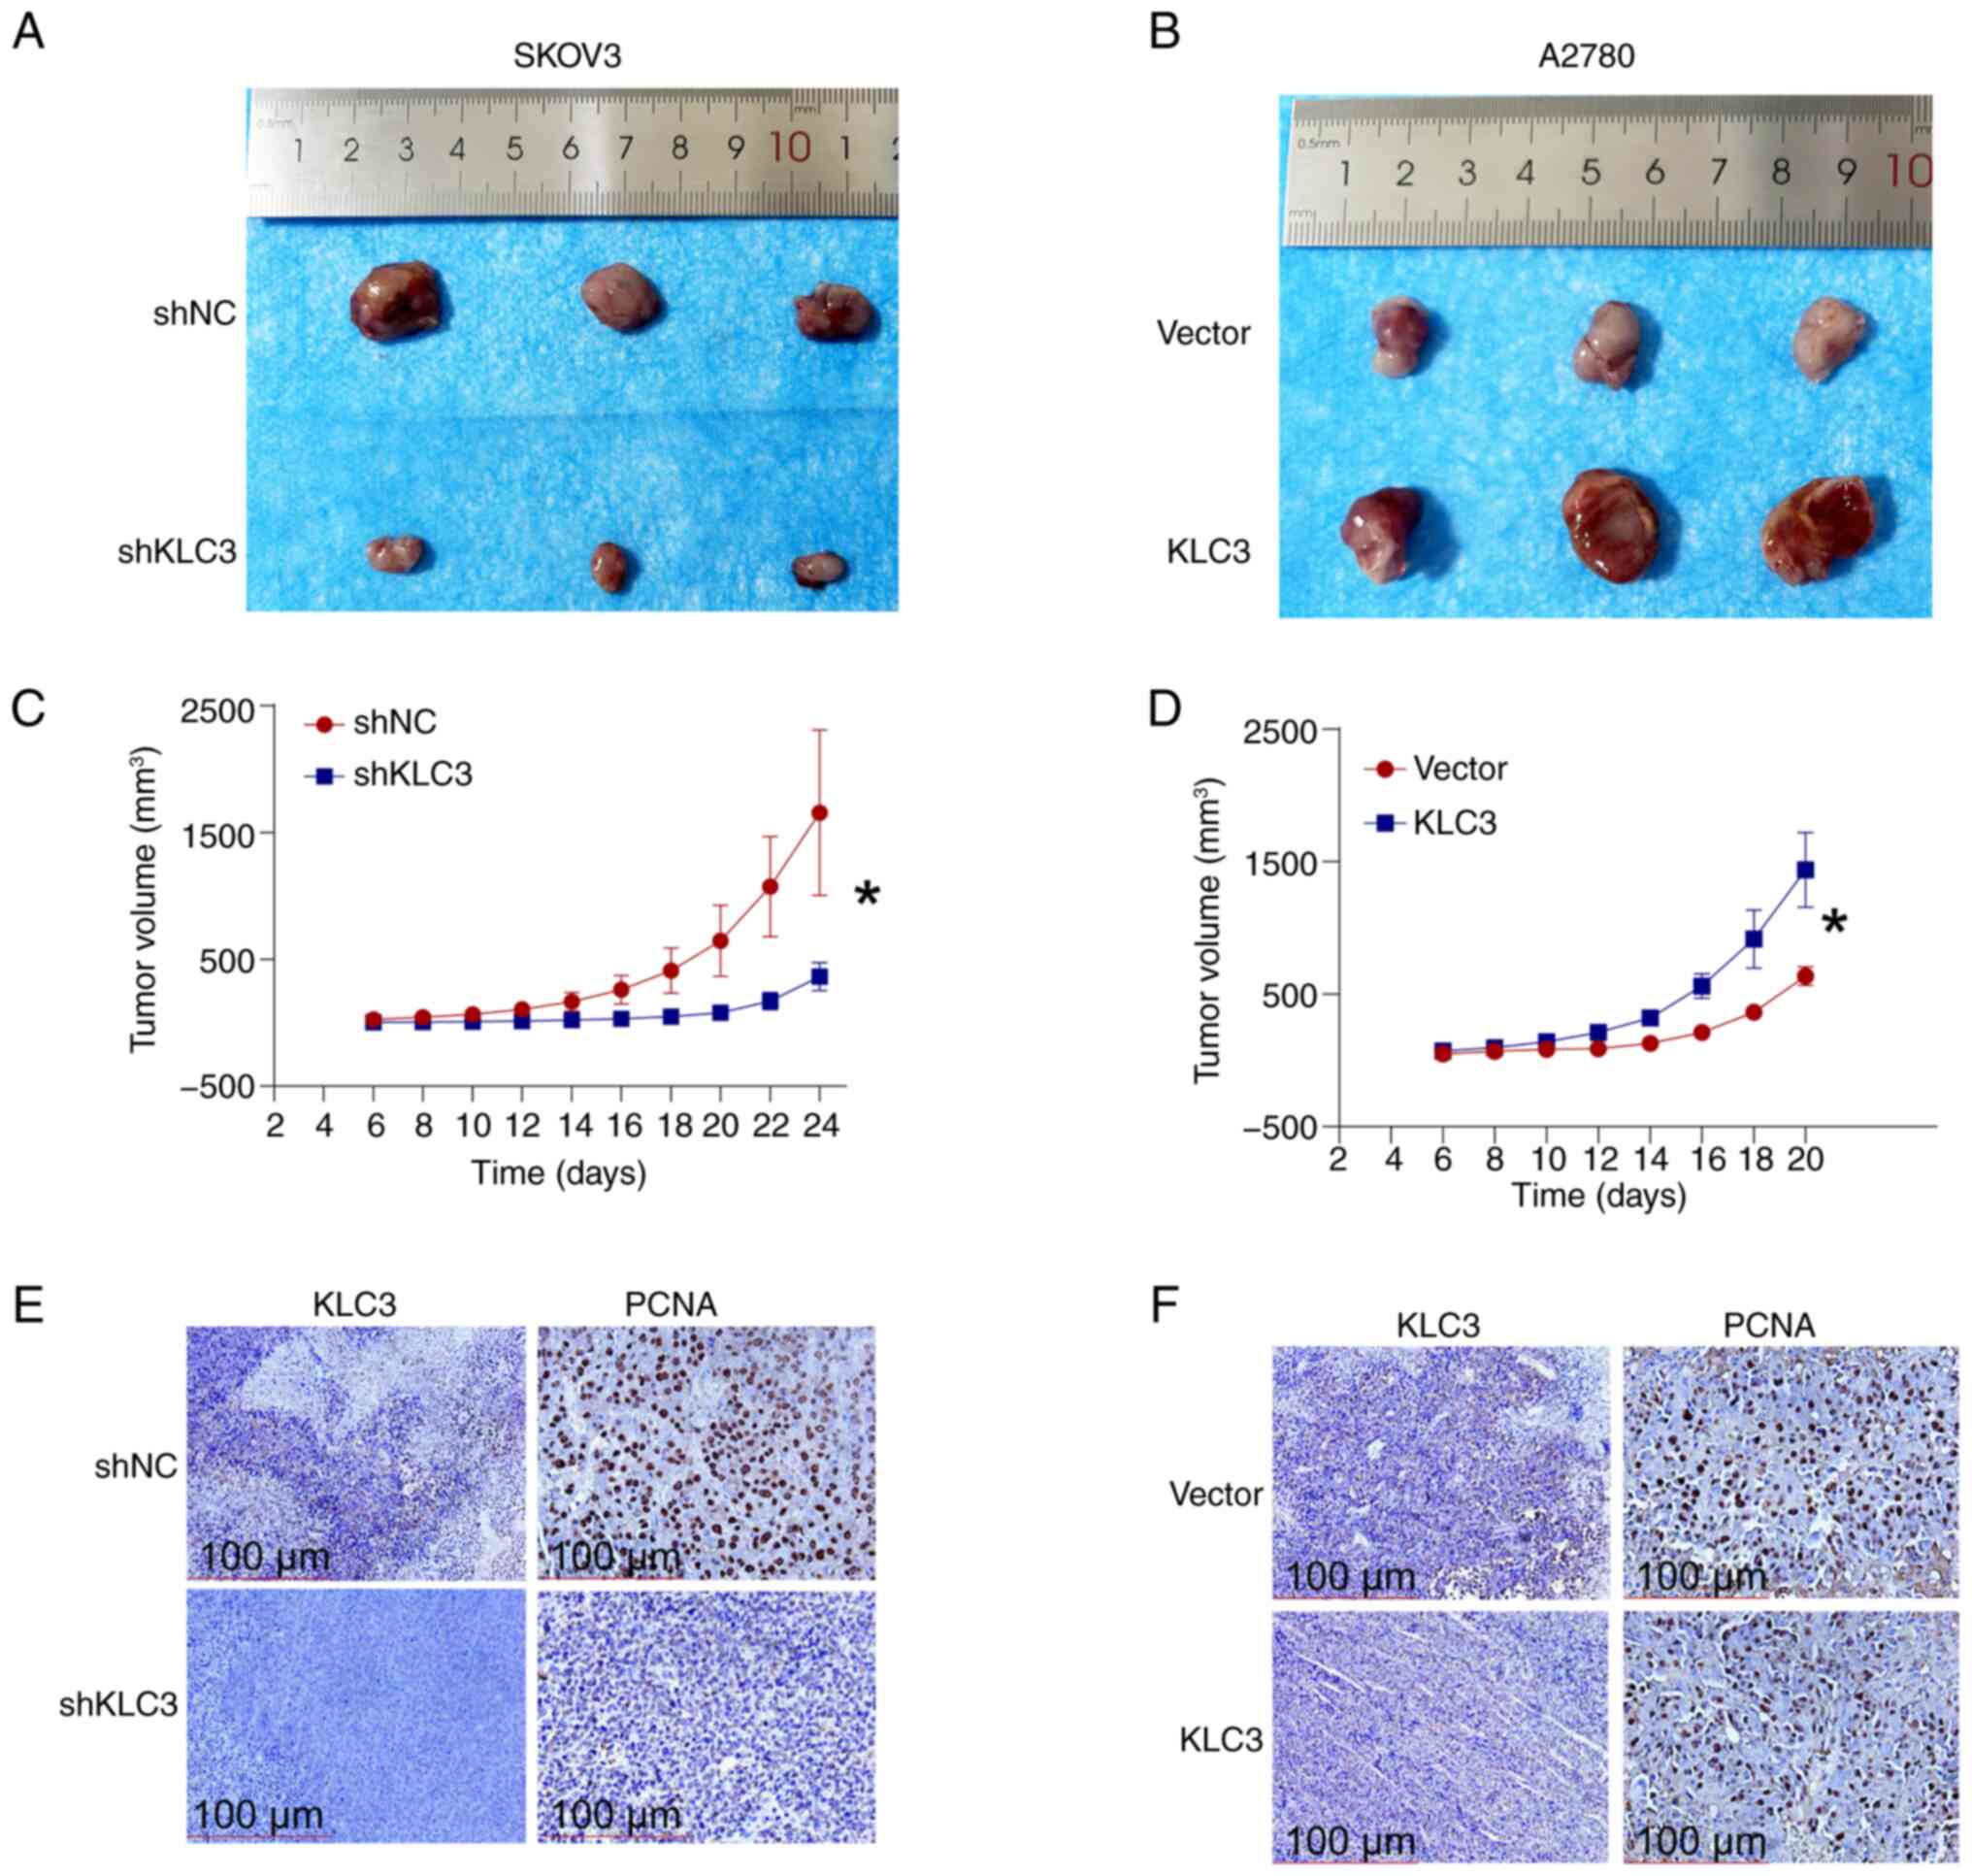
KLC3 knockdown suppresses the in vivo
growth of OC cells
The impact of KLC3 knockdown on tumor growth was
assessed using a nude mouse xenograft model. Compared with in the
control group, KLC3 knockdown impeded tumor growth (Fig. 4A), with a notably reduced growth
rate compared with that in the control group (Fig. 4C). In addition, IHC analysis
revealed decreased expression of KLC3 and its associated
proliferation marker PCNA in the knockdown group (Fig. 4E). By contrast, overexpression of
KLC3 stimulated in vivo tumor cell proliferation (Fig. 4B) and markedly increased tumor
growth rate (Fig. 4D). The results
of IHC indicated no significant difference in the expression levels
of KLC3 and PCNA between the overexpression group and the control
group (Fig. 4F). No difference in
KLC3 expression was found after tumor formation; however, the
overexpression efficiency of all cells was verified by western
blotting before injection. These findings underscore the pivotal
role of KLC3 in OC cell proliferation.
High-throughput sequencing
analysis
According to the high-throughput sequencing
analysis, a total of 13,516 differentially expressed genes were
identified between the SKOV3-NC and SKOV3-shKLC3 groups. The
screening criteria were set at fold change ≥2 and P<0.05,
resulting in 376 differentially expressed genes, with 261
upregulated and 115 downregulated (Fig.
5A and C). The top 10 downregulated genes were validated by
PCR, and it was revealed that seven were significantly decreased
and three showed no change between the shKLC3 and NC groups; COL3A1
exhibited the most significant difference (Fig. 5D). Western blotting results
demonstrated that KLC3 knockdown led to decreased COL3A1 levels
(Fig. 5E). Pathway enrichment
analysis revealed that the ‘PI3K-Akt signaling pathway’ was the
most enriched (8.57%), followed by the ‘TNF signaling pathway’
(7.43%) among others (Fig. 5B). The
western blot analysis results for AKT, PI3K, p-AKT and p85α
confirmed that decreased KLC3 expression did not affect the levels
of AKT and PI3K, whereas it did lead to a decrease in p-AKT and
p38a levels. Conversely, increased KLC3 expression did not impact
the levels of AKT and PI3K, but resulted in an increase in p-AKT
and p38a expression (Fig. 5F).
Therefore, these findings suggested that overexpression of KLC3 may
promote COL3A1 expression and activate the PI3K/AKT signaling
pathway in OC cells.
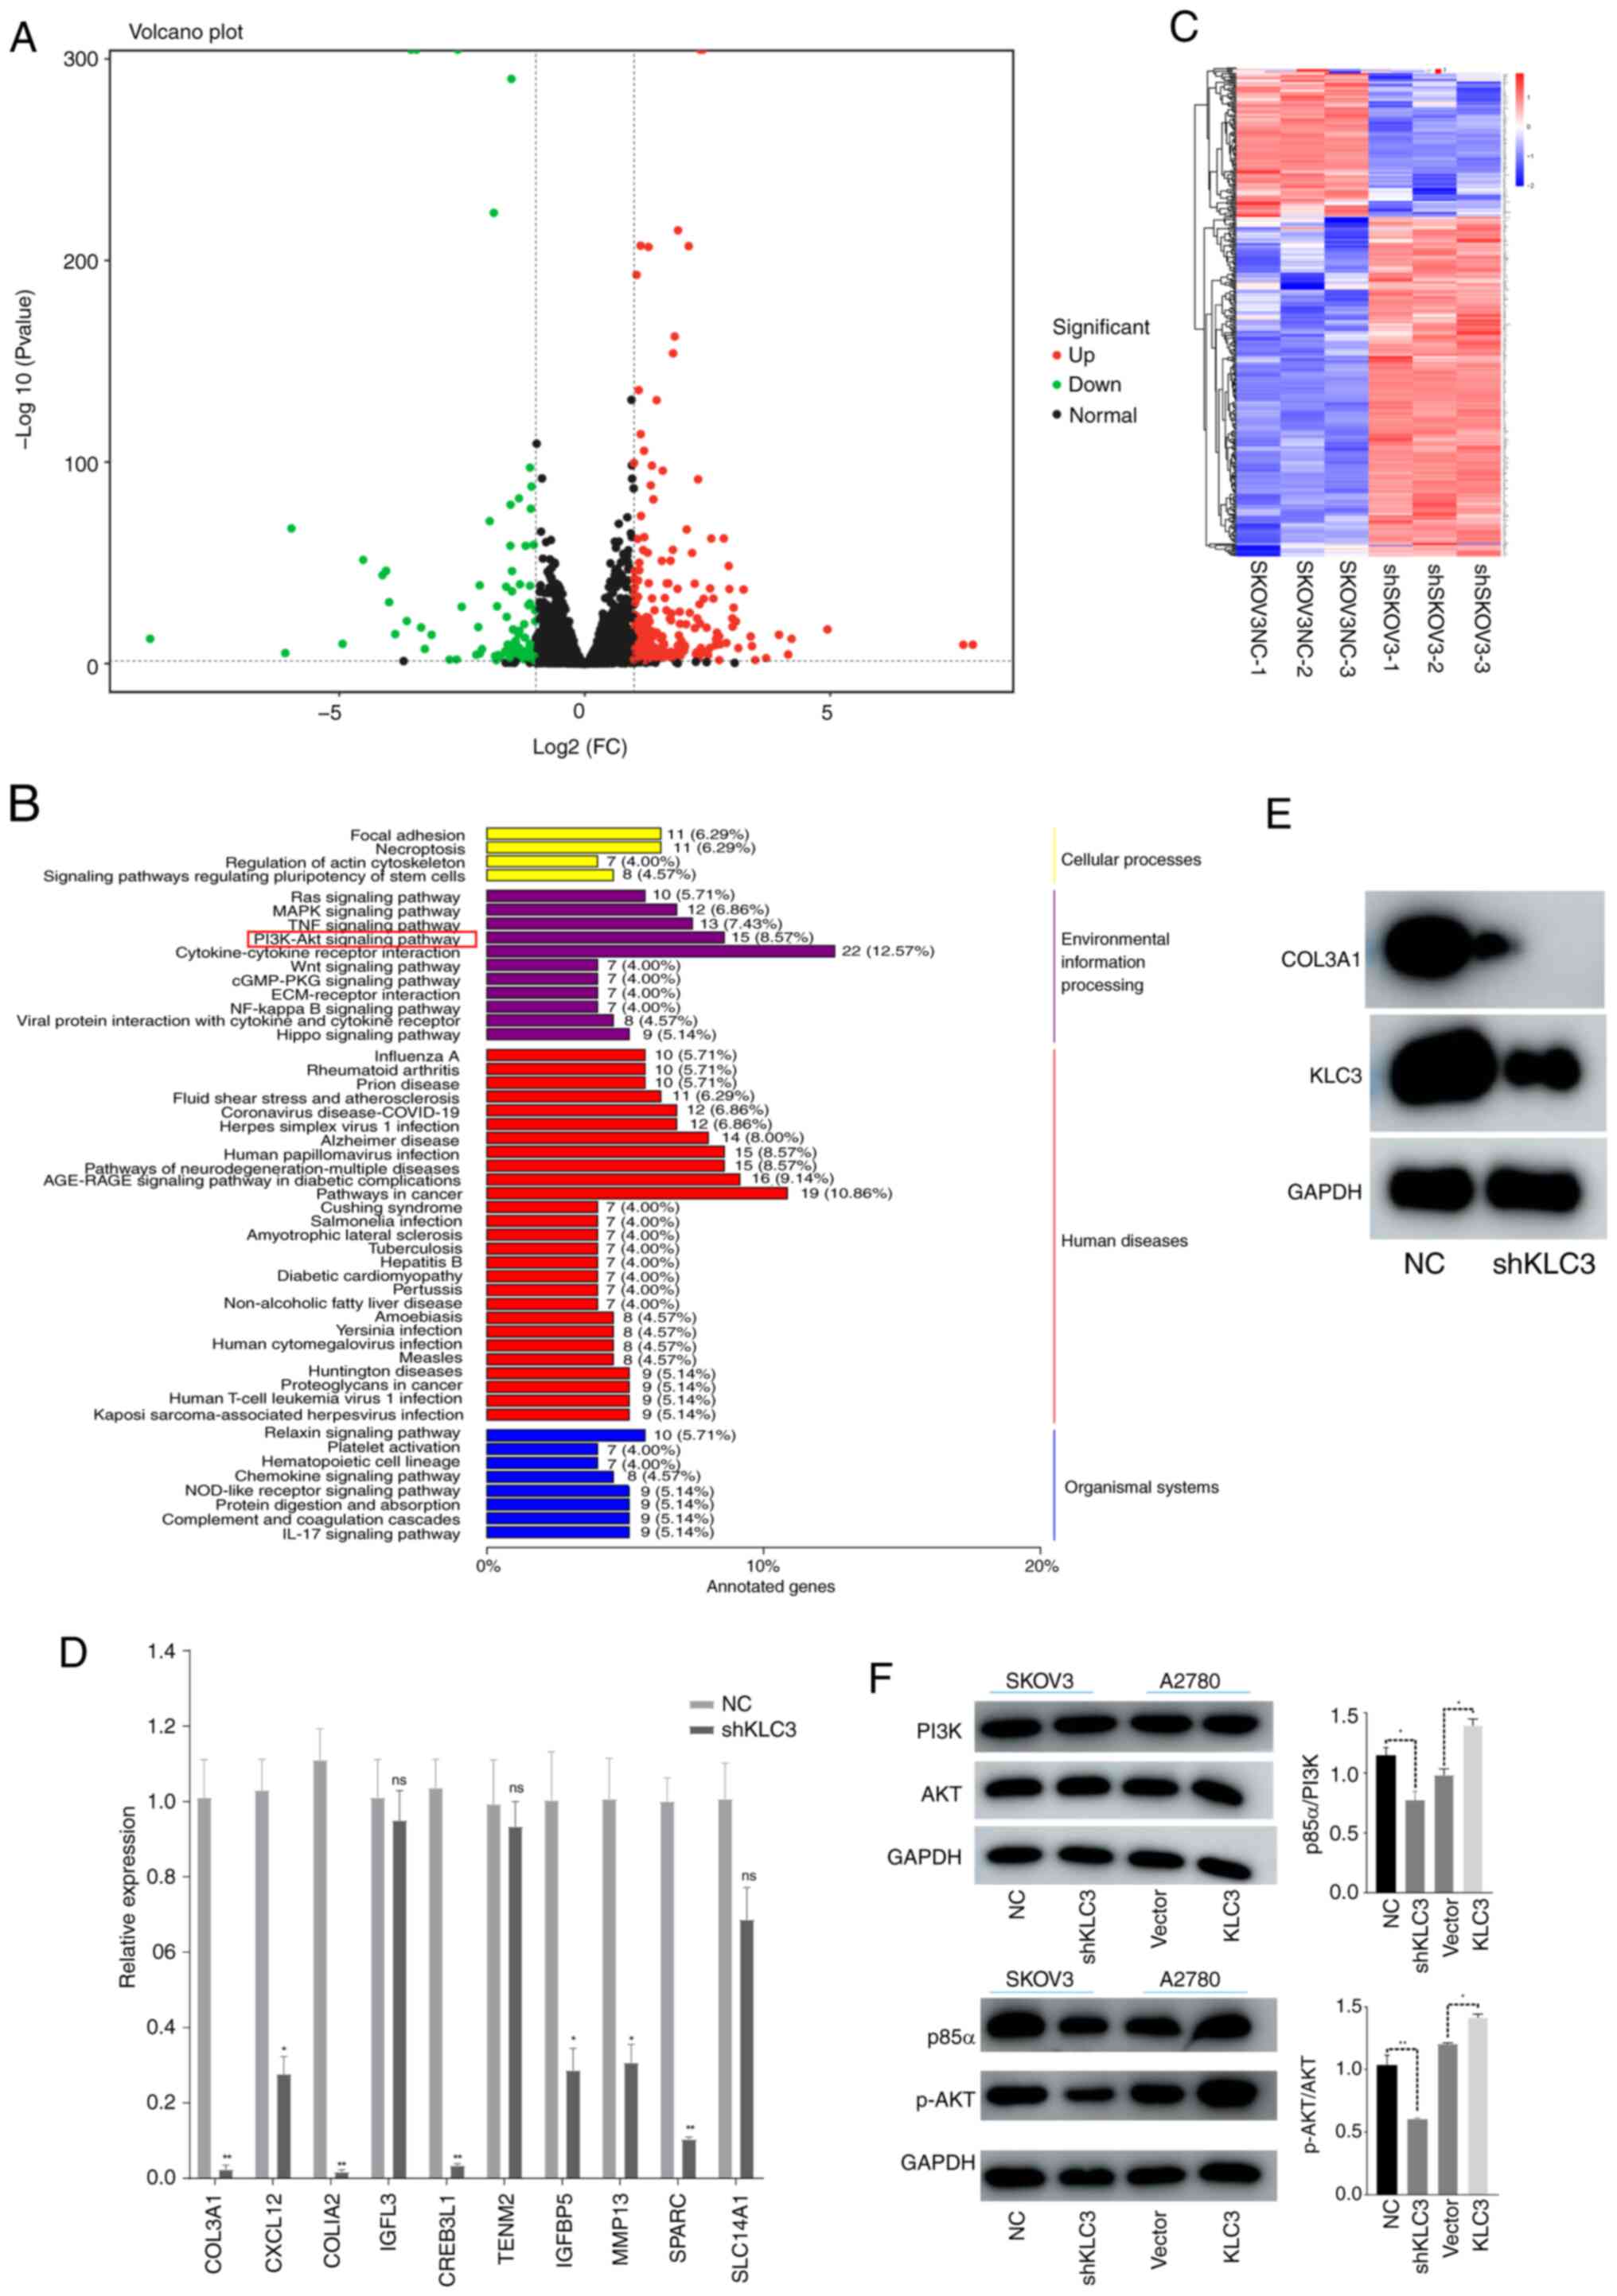 | Figure 5.KLC3 activates the PI3K/AKT pathway
in ovarian cancer. (A) Differential mRNA volcano plot. Green dots
represent downregulated genes, while red dots represent upregulated
genes. The abscissa is the FC. (B) KEGG classification diagram of
differentially expressed genes. (C) Clustering diagram of
differentially expressed genes. The horizontal axis represents
sample names and clustering results, and the vertical axis
represents differentially expressed genes and gene clustering
results. Different columns represent different samples, and
different rows represent different genes. The color represents the
expression level of the gene in the sample. (D) Reverse
transcription-quantitative PCR was used to verify the expression of
the top 10 differentially expressed genes. (E) Western blotting was
used to detect the changes in KLC3 and COL3A1 protein expression in
SKOV3 cells. (F) Western blotting was used to investigate the
changes in PI3K/AKT pathway proteins after KLC3 expression was
altered. *P<0.05, **P<0.05 vs. NC or as indicated. COL3A1,
collagen type III α1; FC, fold change; KEGG, Kyoto Encyclopedia of
Genes and Genomes; KLC3, kinesin light chain 3; NC, negative
control; ns, not significant; p-, phosphorylated; sh, short
hairpin. |
KLC3 promotes activation of the
PI3K/AKT pathway through COL3A1
The aforementioned findings demonstrated that
alterations in KLC3 can lead to changes in COL3A1 and activation of
the PI3K/AKT pathway. To further investigate the mechanism by which
KLC3 promotes the malignant progression of OC cells, the
interaction between KLC3 and COL3A1 was examined using co-IP. The
results revealed that there was an interaction between KLC3 and
COL3A1 in SKOV3 cells (Fig. 6A).
Furthermore, overexpression of COL3A1 in SKOV3 cells and in
shKLC3-infected cells resulted in alterations in the expression of
DNA damage-related genes and EMT-related genes; the expression
levels of XRCC1, XRCC2, PALB2, N-cadherin, Snail and Vimentin were
increased, whereas E-cadherin expression was decreased compared
with in the shKLC3 group (Fig. 6B, C
and E). Following overexpression of COL3A1, similar effects
were observed when comparing it to knocking down KLC3 alone.
Similarly, the overexpression of COL3A1 stimulated activation of
the PI3K/AKT pathway, and overexpression of COL3A1 reversed the
inhibitory effects of shKLC3 (Fig.
6D). The results of clonogenic (Fig. 6F), wound healing (Fig. 6G) and Transwell (Fig. 6H) assays revealed that the migratory
and proliferative capabilities were increased in the shKLC3 +
COL3A1 group compared with those in the shKLC3 group. These
findings suggested that KLC3 may activate the PI3K/AKT pathway by
interacting with COL3A1 and could contribute to the malignant
functions of OC cells.
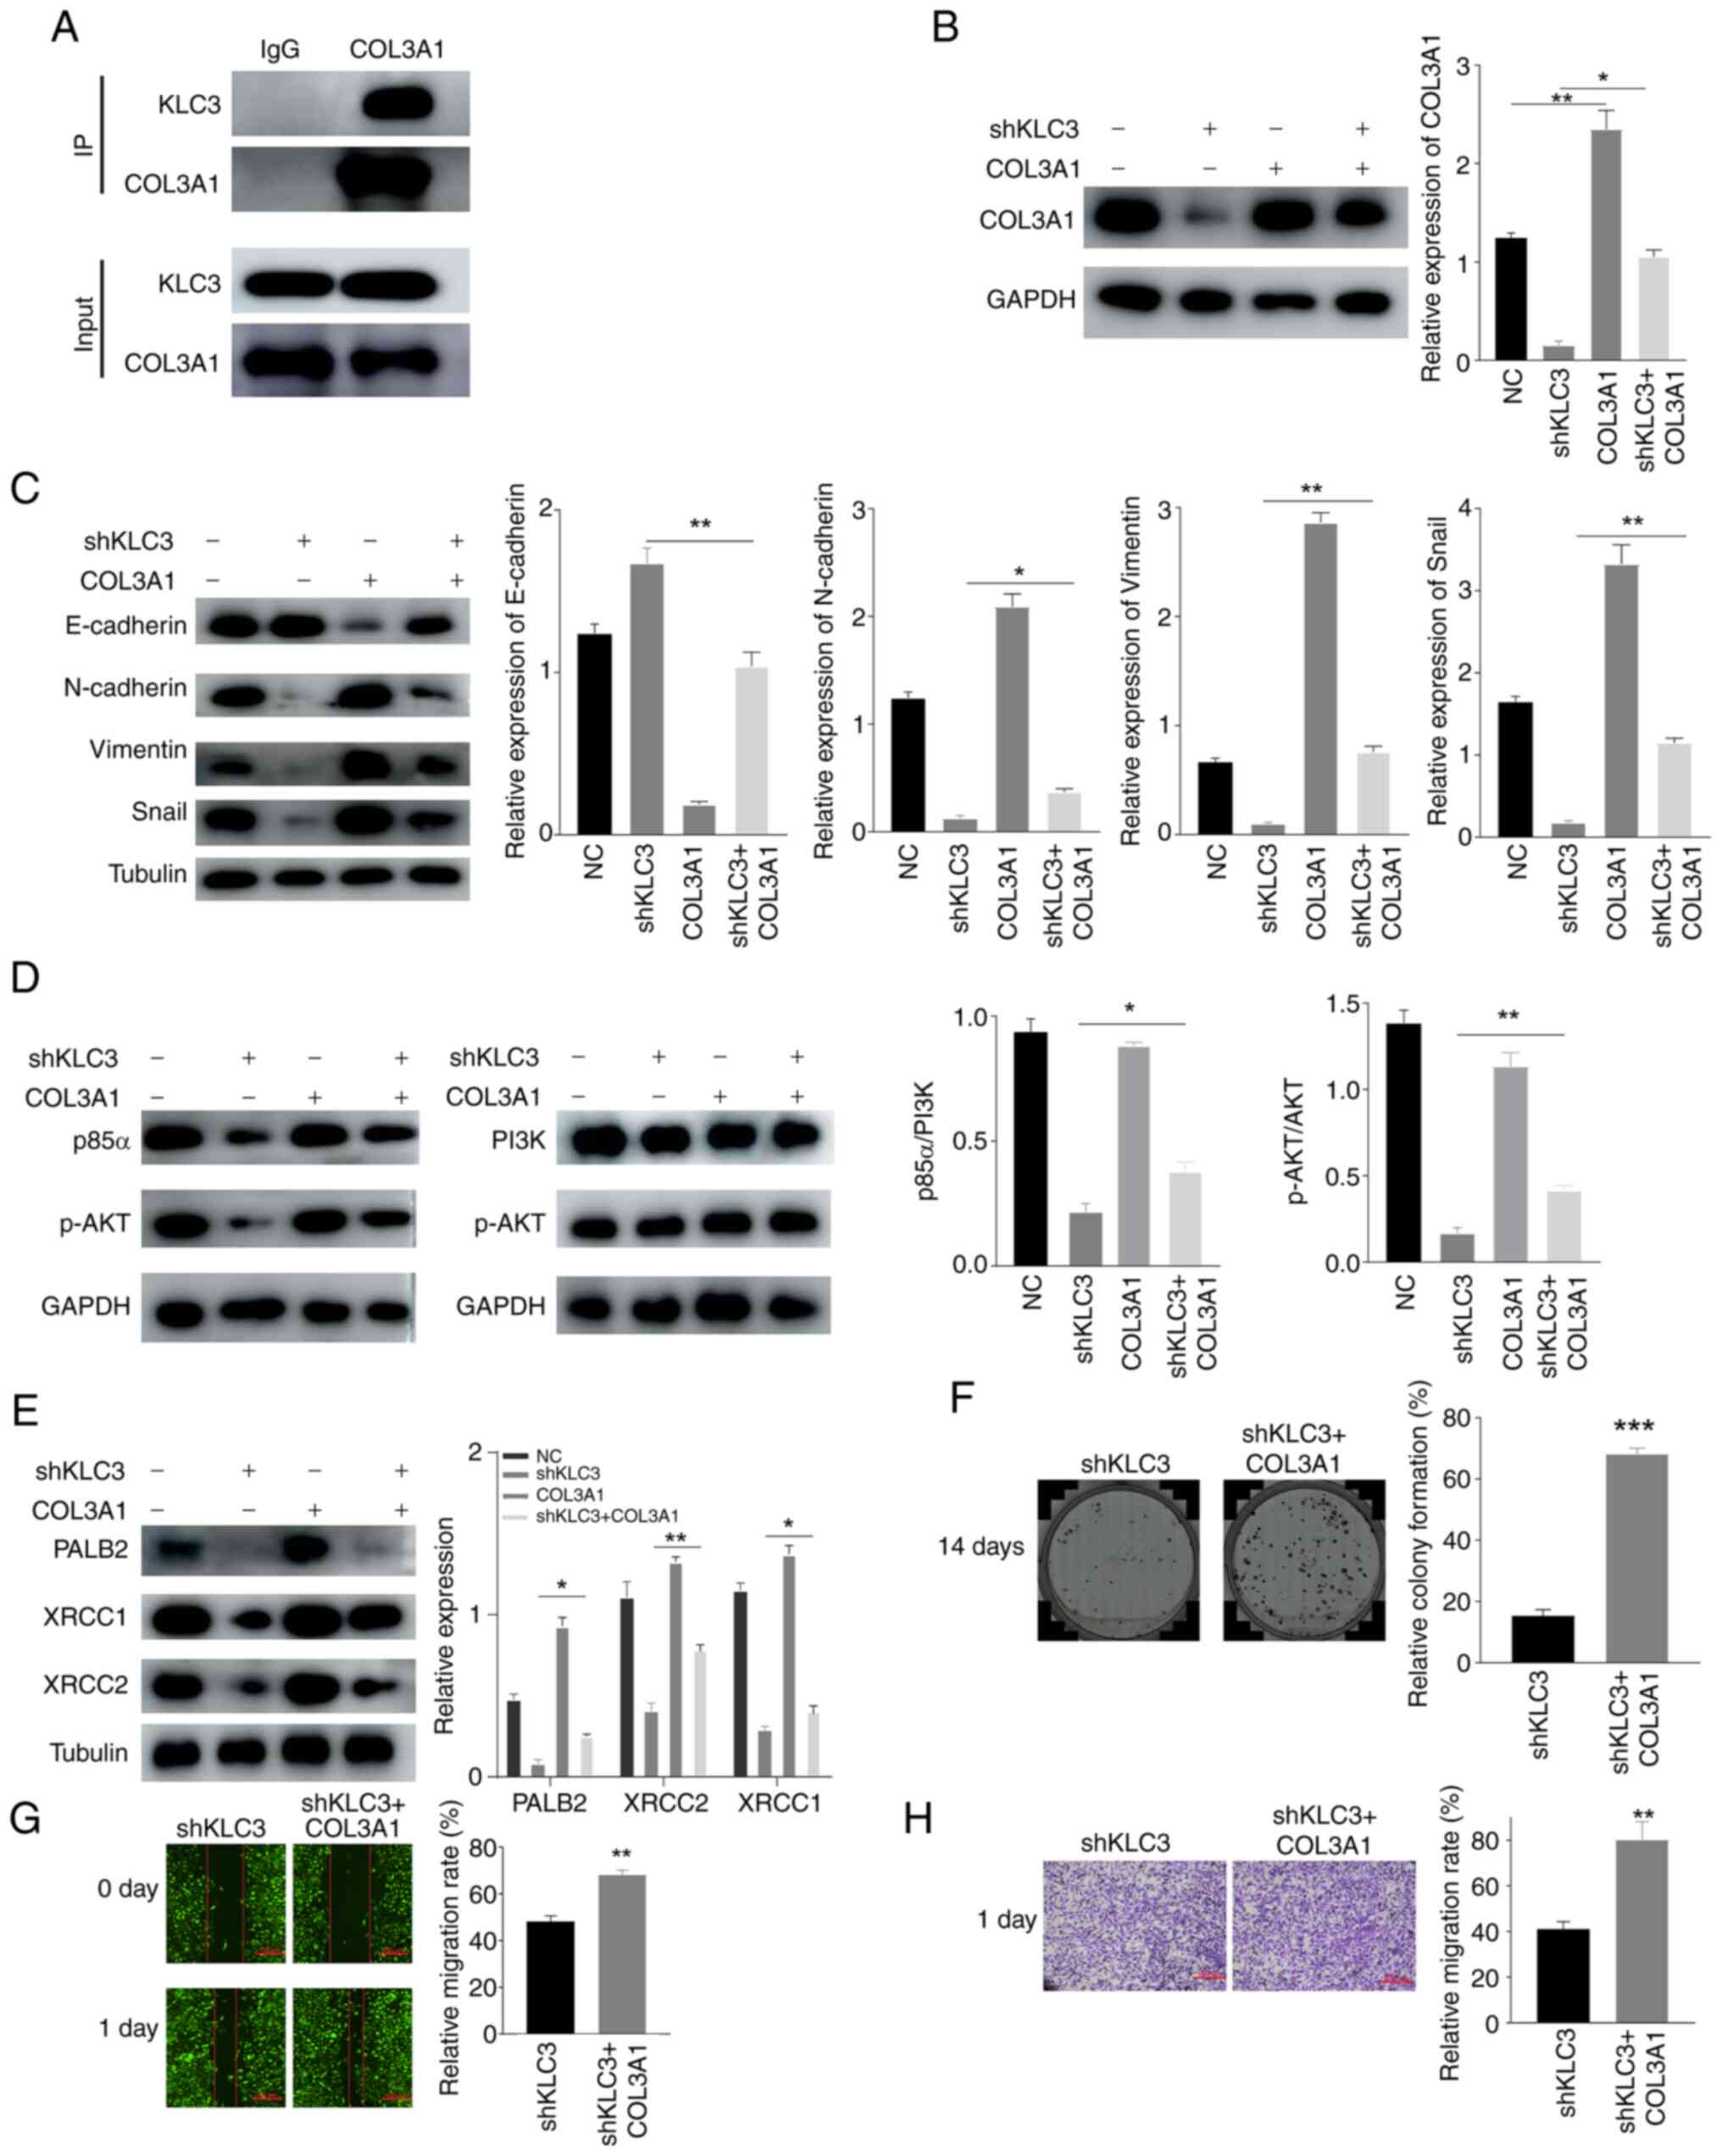 | Figure 6.Effects of KLC3 knockdown on OC cells
can be reversed by COL3A1 overexpression. (A) KLC3 and COL3A1 in
SKOV3 cells can be co-immunoprecipitated. (B) Western blot analysis
of COL3A1 expression. (C) Western blot analysis of
epithelial-mesenchymal transition-related proteins. (D) Western
blot analysis of PI3K/AKT signaling pathway proteins. (E) Western
blot analysis of PALB2, XRCC1 and XRCC2 expression. (F) Recovery
experiment of the changes in proliferation of OC cells after
knocking down KLC3 and overexpressing COL3A1. (G) Recovery of OC
cell migration after knockdown of KLC3 and overexpression of
COL3A1. (H) Migratory ability of OC cells was observed by Transwell
assay. *P<0.05, **P<0.01, ***P<0.001 vs. shKLC3 or as
indicated. COL3A1, collagen type III α1; IP, immunoprecipitation;
OC, ovarian cancer; KLC3, kinesin light chain 3; NC, negative
control; ns, not significant; p-, phosphorylated; sh, short
hairpin. |
Discussion
In eukaryotic cells, the transportation of all
structures to specific locations at precise times relies on
microtubules, with kinesin proteins providing essential energy for
this process (23). Aberrant
expression of kinesin proteins has been reported to be linked to
various types of cancer, including OC, and is associated with
prognosis, proliferation, metastasis and drug resistance (24–27).
Additionally, kinesin proteins serve a pivotal role in diverse
biological processes within tumors by participating in the gene
transcription and translation, and division of tumor cells
(25). In recent years, kinesin
proteins have garnered notable attention as a novel target for
tumor therapy (5–12). However, the association between KLC3
and tumors has been relatively understudied, particularly in
relation to OC. In the present study, data from the GEPIA and GEO
databases revealed high expression levels of KLC3 in OC.
Furthermore, Kaplan-Meier plotter analysis demonstrated that higher
KLC3 expression levels were associated with a poorer prognosis in
patients with OC.
In the present study, western blot analysis was
employed to validate the expression of KLC3 in five normal ovarian
tissue samples and five OC samples. The overall expression of KLC3
was revealed to be significantly higher in OC tissues compared with
that in normal tissues. Subsequently, IHC was utilized to evaluate
the protein expression of KLC3 in OC specimens. The experimental
findings demonstrated an upregulation of KLC3 in OC tissues. Based
on the differential expression levels of KLC3 in OC tissues,
patients were stratified into high and low expression groups.
Patients with lower KLC3 expression exhibited a more favorable
prognosis, which was consistent with the results of bioinformatics
analysis. Unfortunately, owing to the limited availability of OC
samples, the present study was unable to amass a sufficient number
of samples to validate the association between KLC3 expression and
clinical characteristics. Future studies should aim to increase the
sample size to address this limitation. These collective findings
suggested that KLC3 may represent a novel oncogene in OC.
EMT has a crucial role in embryonic morphogenesis,
and confers tumor cells with motility, stemness, drug resistance
and microenvironmental adaptability during cancer progression
(28). Early dissemination is a
hallmark of OC, where metastasizing cancer cells undergo diverse
transformation patterns, such as acquiring mesenchymal
characteristics closely associated with EMT. Furthermore, the
hematogenous and lymphatic spread of advanced-stage OC cells is
intricately linked to EMT (29,30).
Previous research has indicated the involvement of certain members
of the motor protein family in EMT (9). Building on this knowledge, the current
study investigated the association between KLC3 and EMT in OC. The
findings revealed that alterations in KLC3 led to changes in the
expression levels of proteins related to EMT progression, including
N-cadherin, Snail, Vimentin and E-cadherin; thus confirming that
overexpression of KLC3 may enhance the process of EMT in OC
cells.
Enhanced radioresistance of lung cancer cells has
been demonstrated to be associated with the overexpression of KLC2
and KLC4, which is considered to be linked to anti-DNA damage
mechanisms. Additionally, KLC4 deficiency has been shown to trigger
the DNA damage response (6,7). Building on these findings, the present
study investigated the association between KLC3 and DNA damage. The
comet assay results revealed that downregulation of KLC3 led to an
increase in DNA damage in OC cells, thus indicating a notable
association between KLC3 and OC cell resistance to DNA damage.
The COL3A1 protein is predominantly present in
stromal cells and is primarily synthesized by fibroblasts,
contributing to the development of extracellular matrix, cellular
adhesion and tissue remodeling processes (31). Previous research has indicated an
upregulation of COL3A1 mRNA expression in various tumors, such as
breast cancer, lung cancer, gastric cancer, OC and esophageal
cancer (32). Elevated levels of
COL3A1 have been linked to increased proliferation, invasion,
migration and drug resistance in multiple tumor types, including OC
(33–36). RNA-seq technology has been
extensively utilized for fundamental research purposes, as well as
clinical diagnostics and pharmaceutical advancements (37). In the present study, RNA-seq
analysis was employed to identify alterations in gene expression
within the SKOV3 OC cell line following KLC3 downregulation. The
findings were subsequently validated through RT-qPCR analysis and
western blotting, alongside a literature review. Additionally,
co-IP experiments confirmed the interaction between KLC3 and
COL3A1, ultimately establishing COL3A1 as a downstream target of
KLC3. Furthermore, sequencing results highlighted significant
enrichment of the PI3K/AKT pathway. It is well-established that
activation of PI3K/AKT promotes metastasis in OC (38,39),
while also inhibiting apoptosis through DNA repair mechanisms and
promoting drug resistance (40,41).
Building upon this foundation, the present study explored the
relationship between KLC3 and the PI3K/AKT signaling pathway in OC,
and revealed that reduced KLC3 expression did not impact PI3K or
AKT levels but led to decreased p85α and p-AKT expression;
conversely overexpression of KLC4 activated this pathway.
Collectively these findings indicated the involvement of KLC4 in OC
progression with implications for EMT processes and DNA damage.
After knocking down KLC3 and overexpressing COL3A1
in SKOV3 OC cells, an increase in the expression levels of
N-cadherin, Snail and Vimentin was detected compared with in the
knockdown group, whereas E-cadherin expression was decreased.
Additionally, XRCC1, XRCC2 and PALB2 exhibited increased expression
compared with in the knockdown group. These results suggested that
the overexpression of COL3A1 could partially mitigate the weakened
malignant function of OC cells caused by reduced KLC3
expression.
In conclusion, the findings of the present study
indicated that KLC3 may facilitate the PI3K/AKT signaling pathway,
and promote the proliferation and migration of OC cells via COL3A1.
These findings suggested a novel mechanism of action for KLC3 in
the pathogenesis of OC, thus highlighting its potential as a
promising target for OC therapy.
Acknowledgements
Not applicable.
Funding
The present study was supported by The Gansu Province Health
Industry Scientific Research Plan Project (grant no.
GSWSHL2022_34).
Availability of data and materials
The RNA-seq data generated in the present study may
be found in the Sequence Read Archive under accession number
PRJNA1137301 or at the following URL: https://www.ncbi.nlm.nih.gov/sra/?term=PRJNA1137301.
The other data generated in the present study may be requested from
the corresponding author.
Authors' contributions
JY and YL designed the present study. XZ analyzed
the data and wrote the manuscript. ML, XW and XL collected the
data. RH, XL and ML analyzed the data. YL revised the manuscript.
JY and YL confirm the authenticity of all the raw data. All authors
read and approved the final version of the manuscript.
Ethics approval and consent to
participate
The use of patient tissues was approved by the
Institutional Ethics Committee of The First Hospital of Lanzhou
University (approval no. LDYYLL-2019-279). Written informed consent
was obtained from the patients prior to sample collection. In
vivo experiments were conducted with the approval of the Animal
Experimental Ethics Committee of The First Hospital of Lanzhou
University of (approval no. LDYYLL-2023-495).
Patient consent for publication
Not applicable.
Competing interests
The authors declare that they have no competing
interests.
References
|
1
|
Cui W, Rocconi RP, Thota R, Anderson RA,
Bruinooge SS, Comstock IA, Denduluri N, Gassman A, Gralow J, Hutt
KJ, et al: Measuring ovarian toxicity in clinical trials: An
American society of clinical oncology research statement. Lancet
Oncol. 24:e415–e423. 2023. View Article : Google Scholar : PubMed/NCBI
|
|
2
|
Godbole N, Quinn A, Carrion F, Pelosi E
and Salomon C: Extracellular vesicles as a potential delivery
platform for CRISPR-Cas based therapy in epithelial ovarian cancer.
Semin Cancer Biol. 96:64–81. 2023. View Article : Google Scholar : PubMed/NCBI
|
|
3
|
Rayment I: Kinesin and myosin: Molecular
motors with similar engines. Structure. 4:501–504. 1996. View Article : Google Scholar : PubMed/NCBI
|
|
4
|
Zhong M, Gong L, Li N, Guan H, Gong K,
Zhong Y, Zhu E, Wang X, Jiang S, Li J, et al: Pan-cancer analysis
of kinesin family members with potential implications in prognosis
and immunological role in human cancer. Front Oncol.
13:11798972023. View Article : Google Scholar : PubMed/NCBI
|
|
5
|
Qiao S, Jiang Y, Li N and Zhu X: The
kinesin light chain-2, a target of mRNA stabilizing protein HuR,
inhibits p53 protein phosphorylation to promote radioresistance in
NSCLC. Thorac Cancer. 14:1440–1450. 2023. View Article : Google Scholar : PubMed/NCBI
|
|
6
|
Baek JH, Yun HS, Kim JY, Lee J, Lee YJ,
Lee CW, Song JY, Ahn J, Park JK, Kim JS, et al: Kinesin light chain
4 as a new target for lung cancer chemoresistance via targeted
inhibition of checkpoint kinases in the DNA repair network. Cell
Death Dis. 11:3982020. View Article : Google Scholar : PubMed/NCBI
|
|
7
|
Baek JH, Lee J, Yun HS, Lee CW, Song JY,
Um HD, Park JK, Park IC, Kim JS, Kim EH and Hwang SG: Kinesin light
chain-4 depletion induces apoptosis of radioresistant cancer cells
by mitochondrial dysfunction via calcium ion influx. Cell Death
Dis. 9:4962018. View Article : Google Scholar : PubMed/NCBI
|
|
8
|
Feng S, Luo S, Ji C and Shi J: miR-29c-3p
regulates proliferation and migration in ovarian cancer by
targeting KIF4A. World J Surg Oncol. 18:3152020. View Article : Google Scholar : PubMed/NCBI
|
|
9
|
Sheng N, Xu YZ, Xi QH, Jiang HY, Wang CY,
Zhang Y and Ye Q: Overexpression of KIF2A is suppressed by miR-206
and associated with poor prognosis in ovarian cancer. Cell Physiol
Biochem. 50:810–822. 2018. View Article : Google Scholar : PubMed/NCBI
|
|
10
|
Li H, Zhang W, Sun X, Chen J, Li Y, Niu C,
Xu B and Zhang Y: Overexpression of kinesin family member 20A is
associated with unfavorable clinical outcome and tumor progression
in epithelial ovarian cancer. Cancer Manag Res. 10:3433–3450. 2018.
View Article : Google Scholar : PubMed/NCBI
|
|
11
|
Kawai Y, Shibata K, Sakata J, Suzuki S,
Utsumi F, Niimi K, Sekiya R, Senga T, Kikkawa F and Kajiyama H:
KIF20A expression as a prognostic indicator and its possible
involvement in the proliferation of ovarian clear-cell carcinoma
cells. Oncol Rep. 40:195–205. 2018.PubMed/NCBI
|
|
12
|
Han X, Yang L, Tian H and Ji Y: Machine
learning developed a PI3K/Akt pathway-related signature for
predicting prognosis and drug sensitivity in ovarian cancer. Aging
(Albany NY). 15:11162–11183. 2023.PubMed/NCBI
|
|
13
|
Konjikusic MJ, Gray RS and Wallingford JB:
The developmental biology of kinesins. Dev Biol. 469:26–36. 2021.
View Article : Google Scholar : PubMed/NCBI
|
|
14
|
Yu L, Wei J and Liu P: Attacking the
PI3K/Akt/mTOR signaling pathway for targeted therapeutic treatment
in human cancer. Semin Cancer Biol. 85:69–94. 2022. View Article : Google Scholar : PubMed/NCBI
|
|
15
|
Li H, Zeng J and Shen K: PI3K/AKT/mTOR
signaling pathway as a therapeutic target for ovarian cancer. Arch
Gynecol Obstet. 290:1067–1078. 2014. View Article : Google Scholar : PubMed/NCBI
|
|
16
|
Ediriweera MK, Tennekoon KH and Samarakoon
SR: Role of the PI3K/AKT/mTOR signaling pathway in ovarian cancer:
Biological and therapeutic significance. Semin Cancer Biol.
59:147–160. 2019. View Article : Google Scholar : PubMed/NCBI
|
|
17
|
Yoshihara K, Tajima A, Komata D, Yamamoto
T, Kodama S, Fujiwara H, Suzuki M, Onishi Y, Hatae M, Sueyoshi K,
et al: Gene expression profiling of advanced-stage serous ovarian
cancers distinguishes novel subclasses and implicates ZEB2 in tumor
progression and prognosis. Cancer Sci. 100:1421–1428. 2009.
View Article : Google Scholar : PubMed/NCBI
|
|
18
|
Mok SC, Bonome T, Vathipadiekal V, Bell A,
Johnson ME, Wong KK, Park DC, Hao K, Yip DK, Donninger H, et al: A
gene signature predictive for outcome in advanced ovarian cancer
identifies a survival factor: Microfibril-associated glycoprotein
2. Cancer Cell. 16:521–532. 2009. View Article : Google Scholar : PubMed/NCBI
|
|
19
|
O'Shea AS: Clinical staging of ovarian
cancer. Methods Mol Biol. 2424:3–10. 2022. View Article : Google Scholar : PubMed/NCBI
|
|
20
|
Dixon JR Jr: The International conference
on harmonization good clinical practice guideline. Qual Assur.
6:65–74. 1998. View Article : Google Scholar : PubMed/NCBI
|
|
21
|
Livak KJ and Schmittgen TD: Analysis of
relative gene expression data using real-time quantitative PCR and
the 2(−Delta Delta C(T)) Method. Methods. 25:402–408. 2001.
View Article : Google Scholar : PubMed/NCBI
|
|
22
|
Zhou Y, Zhou B, Pache L, Chang M,
Khodabakhshi AH, Tanaseichuk O, Benner C and Chanda SK: Metascape
provides a biologist-oriented resource for the analysis of
systems-level datasets. Nat Commun. 10:15232019. View Article : Google Scholar : PubMed/NCBI
|
|
23
|
Tjioe M, Shukla S, Vaidya R, Troitskaia A,
Bookwalter CS, Trybus KM, Chemla YR and Selvin PR: Multiple
kinesins induce tension for smooth cargo transport. Elife.
8:e509742019. View Article : Google Scholar : PubMed/NCBI
|
|
24
|
Cong S, Fu Y, Zhao X, Guo Q, Liang T, Wu
D, Wang J and Zhang G: KIF26B and CREB3L1 derived from immunoscore
could inhibit the progression of ovarian cancer. J Immunol Res.
2024:48179242024. View Article : Google Scholar : PubMed/NCBI
|
|
25
|
Liu X, Gong H and Huang K: Oncogenic role
of kinesin proteins and targeting kinesin therapy. Cancer Sci.
104:651–656. 2013. View Article : Google Scholar : PubMed/NCBI
|
|
26
|
Li X, Huang W, Huang W, Wei T, Zhu W, Chen
G and Zhang J: Kinesin family members KIF2C/4A/10/11/14/18B/20A/23
predict poor prognosis and promote cell proliferation in
hepatocellular carcinoma. Am J Transl Res. 12:1614–1639.
2020.PubMed/NCBI
|
|
27
|
Liang LY and Li GS: The Roles of KIFC1 in
the development of osteosarcoma: Characterization of potential
therapeutic targets. Comput Math Methods Med. 2022:50391342022.
View Article : Google Scholar : PubMed/NCBI
|
|
28
|
Zhang G, Hou S, Li S, Wang Y and Cui W:
Role of STAT3 in cancer cell epithelial-mesenchymal transition
(Review). Int J Oncol. 64:482024. View Article : Google Scholar : PubMed/NCBI
|
|
29
|
Śliwa A, Szczerba A, Pięta PP, Białas P,
Lorek J, Nowak-Markwitz E and Jankowska A: A recipe for successful
metastasis: Transition and migratory modes of ovarian cancer cells.
Cancers (Basel). 16:7832024. View Article : Google Scholar : PubMed/NCBI
|
|
30
|
Szczerba A, Śliwa A, Pieta PP and
Jankowska A: The role of circulating tumor cells in ovarian cancer
dissemination. Cancers(Basel). 14:60302022.PubMed/NCBI
|
|
31
|
Kuivaniemi H and Tromp G: Type III
collagen (COL3A1): Gene and protein structure, tissue distribution,
and associated diseases. Gene. 707:151–171. 2019. View Article : Google Scholar : PubMed/NCBI
|
|
32
|
Zhang H, Ding C, Li Y, Xing C, Wang S, Yu
Z, Chen L, Li P and Dai M: Data mining-based study of collagen type
III alpha 1 (COL3A1) prognostic value and immune exploration in
pan-cancer. Bioengineered. 12:3634–3646. 2021. View Article : Google Scholar : PubMed/NCBI
|
|
33
|
Januchowski R, Świerczewska M, Sterzyńska
K, Wojtowicz K, Nowicki M and Zabel M: Increased expression of
several collagen genes is associated with drug resistance in
ovarian cancer cell lines. J Cancer. 7:1295–1310. 2016. View Article : Google Scholar : PubMed/NCBI
|
|
34
|
Xu W, Li Z, Zhu X, Xu R and Xu Y: miR-29
family inhibits resistance to methotrexate and promotes cell
apoptosis by targeting COL3A1 and MCL1 in osteosarcoma. Med Sci
Monit. 24:8812–8821. 2018. View Article : Google Scholar : PubMed/NCBI
|
|
35
|
Wang L, Sun Y, Guo Z and Liu H: COL3A1
overexpression associates with poor prognosis and cisplatin
resistance in lung cancer. Balkan Med J. 39:393–400. 2022.
View Article : Google Scholar : PubMed/NCBI
|
|
36
|
Gao YF, Zhu T, Chen J, Liu L and Ouyang R:
Knockdown of collagen α-1(III) inhibits glioma cell proliferation
and migration and is regulated by miR128-3p. Oncol Lett.
16:1917–1923. 2018.PubMed/NCBI
|
|
37
|
Ozsolak F and Milos PM: RNA sequencing:
Advances, challenges and opportunities. Nat Rev Genet. 12:87–98.
2011. View Article : Google Scholar : PubMed/NCBI
|
|
38
|
Wang H, Xu YH and Guo Y: Novel prognostic
marker TGFBI affects the migration and invasion function of ovarian
cancer cells and activates the integrin αvβ3-PI3K-Akt signaling
pathway. J Ovarian Res. 17:502024. View Article : Google Scholar : PubMed/NCBI
|
|
39
|
Li GW, Jin YP, Qiu JP and Lu XF: ITGB2
fosters the cancerous characteristics of ovarian cancer cells
through its role in mitochondrial glycolysis transformation. Aging
(Albany NY). 16:3007–3020. 2024.PubMed/NCBI
|
|
40
|
Ma S, Wang J, Cui Z, Yang X, Cui X, Li X
and Zhao L: HIF-2α-dependent TGFBI promotes ovarian cancer
chemoresistance by activating PI3K/Akt pathway to inhibit apoptosis
and facilitate DNA repair process. Sci Rep. 14:38702024. View Article : Google Scholar : PubMed/NCBI
|
|
41
|
Li W, Zhang K, Wang W, Liu Y, Huang J,
Zheng M, Li L, Zhang X, Xu M, Chen G, et al: Combined inhibition of
HER2 and VEGFR synergistically improves therapeutic efficacy via
PI3K-AKT pathway in advanced ovarian cancer. J Exp Clin Cancer Res.
43:562024. View Article : Google Scholar : PubMed/NCBI
|