Introduction
Bladder cancer (BC) is the sixth most prevalent type
of cancer and the ninth most common cause of cancer mortality in
men, with an estimated 573,000 new cases and 213,000 mortalities
associated with BC worldwide in 2020 (1). Although the current therapeutic
strategies for non-muscular invasive BC are acceptable, there is a
lack of efficient treatment modalities and predictive markers for
advanced BC, which results in poor patient prognosis (2). In addition to surgery,
cisplatin-based and neoadjuvant chemotherapy are the main treatment
choices for advanced BC (3).
Immune checkpoint therapy, which targets proteins including
programmed death-1 (PD-1), programmed death ligand-1 (PD-L1) and
cytotoxic T-lymphocyte-associated protein 4 (CTLA4), has emerged as
a promising treatment for BC in recent years. With therapeutic
benefit, PD-1 and PD-L1 inhibitors have been used as a second-line
treatment for patients with unresectable and metastatic BC, as well
as a first-line treatment for patients with platinum-ineligible and
PD-L1-positive BC (4,5). However, similar to other cancer
types, only a small percentage of individuals may benefit from this
treatment (6). To anticipate the
response and increase the efficacy of therapies for advanced BC,
further in-depth research on new therapeutic targets and biomarkers
is required.
Methylenetetrahydrofolate dehydrogenase 2 (MTHFD2)
is a crucial enzyme in folate metabolism that was identified by
Mejia and MacKenzie in 1985 (7).
MTHFD2 has a dual role as a methylenetetrahydrofolate dehydrogenase
and as a methylenetetrahydrofolate cyclohydrolase, and is important
for cell proliferation and viability (7). MTHFD2 efficiently drives the folate
cycle in embryonic tissue to supply the high nucleotide requirement
needed for cell proliferation. It has also been reported to be
increased in numerous types of cancer where it enhances cell
proliferation by fulfilling the high biosynthetic demand; by
contrast, MTHFD2 depletion may impair aggressive characteristics
and trigger cell death in a variety of malignancies (8). As a result of its specific
expression pattern and prognostic importance, MTHFD2 has attracted
increased interest in cancer research (9-13).
MTHFD2 has been shown to induce carcinogenesis in breast cancer via
activating the AKT signaling pathway (14), and it may promote cell
proliferation, migration and cell cycle entry, while also
suppressing apoptosis in colorectal cancer cell lines (15). Furthermore, MTHFD2 may promote
lung adenocarcinogenesis and metastasis through activating the
AKT/GSK-3β/β-catenin signaling pathway (16). In BC, MTHFD2 can promote cell
proliferation by activating CDK2 (17), and it has been reported to be
strongly associated with poor prognosis and a high level of immune
infiltrates, according to a previous bioinformatics study (18). However, its specific role in BC
remains to be explored.
The present study used a combination of
bioinformatics analysis and experimental validation to
systematically investigate the expression, function and molecular
mechanisms of MTHFD2 in BC. In addition, the present study analyzed
the association between the expression of MTHFD2 and patient
prognosis, immune infiltration and PD-L1 expression. The present
study aimed to determine whether MTHFD2 may be considered a
promising marker and therapeutic target of chemotherapy and
immunotherapy for BC.
Materials and methods
Specimens
A total of 24 pairs of BC and adjacent tissues were
obtained from the Department of Urology, The First Affiliated
Hospital of Nanchang University (Nanchang, China) with ethics
approval. The patients were aged between 45 and 80 years, with a
median age of 74 years. The male to female ratio was 5:1. All
specimens were included in this study after confirmation by two
senior pathologists. Those samples were collected between March
2015 and January 2017 after transurethral resection of bladder
tumors or radical cystectomy, and all of the specimens were
confirmed by pathology. The present study was approved by the
Ethics Committee of The First Affiliated Hospital of Nanchang
University [approval no. (2021)51]. In addition, a tissue
microarray (TMA) including 63 BC tissues and 16 paired adjacent
tissues was purchased from Shanghai Outdo Biotechnology Co., Ltd.
Three pairs of samples failed to detect results. The TMA (cat. no.
HBlaU079Su01) contained information regarding patient outcomes
(median follow-up time, 25.5 months), basic pathological
information of the patients, and immunohistochemical expression of
CD8 and PD-L1. The age of the patients ranged between 42 and 85
years, with a median age of 71 years. The male to female ratio was
5.3:1. The use of the TMA in the present study was approved by the
Ethics Committee of The First Affiliated Hospital of Nanchang
University [approval no. (2021)51]. The TMA was used to perform IHC
analysis of MTHFD2.
Lentiviral construction
A packaging lentivirus (pHBLV-U6-M
CS-CMV-ZsGreen-PGK-PURO) was purchased from Hanheng Biotechnology
(Shanghai) Co., Ltd. The sequences of shRNAs targeting the mRNA
sequence of MTHFD2 and the scrambled control NC were as follows:
MTHFD2 shRNA1, 5′-CGA ATG TGT TTG GAT CAG TAT-3′; MTHFD2 shRNA2,
5′-GCA GTT GAA GAA ACA TAC AAT-3′; MTHFD2 shRNA3, 5′-CGA GAA GTG
CTG AAG TCT AAA-3′; NC shRNA, 5′-TTC TCC GAA CGT GTC ACG TAA-3′.
These shRNA sequences were subcloned into the lentivirus vector
(pHBLV-U6-MCS-CMV -ZsGreen-PGK-PURO). Briefly, the expression
vectors were co-transfected with packaging plasmid psPAX2 (Addgene,
Inc.) and envelope plasmid pMD2.G (Addgene, Inc.) into 293T cells
(American Type Culture Collection) using a second generation
system, according to the manufacturer's protocols [10 µg
pSPAX2, 5 µg pMD2G, 10 µg plasmid and 75 µl
Lipofiter™ (cat. no. HB-TRLF-1000; Hanheng Biotechnology Co.,
Ltd.)]. After transfection for 48 h at 37°C, infectious particles
were harvested and filtered using 0.45-mm cellulose acetate
filters, concentrated by ultracentrifugation and stored at
−80°C.
The T24 and UMUC3 BC cell lines were infected with
lentiviral knockdown MTHFD2 (HBLV-h-MTHFD2shR NA1/2/3-ZsGreen-PURO)
or NC (HBLV-ZsGreen-PURO) constructs using the one-half volume
infection method according to the manufacturer's protocols. Cells
were seeded in 6-well plates at a density of 1×10⁵
cells/well. After an overnight incubation, cell culture medium was
exchanged with one-half volume fresh medium containing Polybrene (4
µg/ml) and lentiviral solution (the virus solution volume
was calculated as V=cell number x MOI/virus titer, MOI=10). A total
of 4 h after infection, another one-half of fresh medium was added.
Infection efficiency of cells was observed under a fluorescence
microscope after 24 h. The stably infected cell lines were screened
with puromycin (2 µg/ml). When the transduction efficiency
was >90%, stable cell lines were used in subsequent
experiments.
Bioinformatics analysis
Data acquisition and processing
Open-access mRNA expression data and clinical
information of patients with BC were downloaded from The Cancer
Genome Atlas (TCGA) database (https://portal.gdc.cancer.gov/; TCGA-BC).
RNA-sequencing (RNA-seq) data and clinical information were
obtained from 414 patients (tumor samples, n=414; normal samples,
n=19). Before analysis, data were preprocessed and normalized as
previously described (19).
Immune cell infiltration analysis
TIMER (https://cistrome.shinyapps.io/timer/) is a web server
that analyzes tumor-infiltrating immune cells based on TCGA data
(20). In the present study,
TIMER was utilized to investigate the pan-cancer expression of
MTHFD2, as well as the association between MTHFD2 expression and
immune cell infiltration or immune checkpoint expression in BC.
CIBERSORT deconvolution (https://cibersort.stanford.edu/) was used to estimate
22 different cell types for immune infiltration analyses. To
calculate ESTIMATE-score, immune-score and stromal-score for
TCGA-BC data, the ESTIMATE algorithm (Verhaak Lab; http://bioinformatics.mdanderson.org/estimate) was
used.
Identification of differentially
expressed genes (DEGs)
The 'limma' package in R software (https://bioconductor.org/packages/limma/) was used to
study the DEGs. For TCGA-BC data, 'adjusted P<0.05 and
fold-change (FC)>2' were defined as the threshold for the
differential expression of mRNA between normal and BC samples,
whereas for RNA-seq (T24-shRNA2 vs. T24-NC) data, 'adjusted
P<0.05 and FC>1.5' were defined as the threshold for the
differential expression of mRNA. Pheatmap package (version 1.0.12,
https://cran.r-project.org/web/packages/pheatmap/index.html)
in R was utilized to perform the hierarchical cluster analysis of
DEGs between the T24-NC and T24-shRNA2.
Gene Set Enrichment Analysis (GSEA)
To better understand the function of MTHFD2 in BC,
the biological differences between patients with low/high MTHFD2
expression in TCGA-BC and T24-shRNA2/T24-NC were evaluated by GSEA
in R, using the packages 'fgsea' (https://bioconductor.org/packages/fgsea) and
'clusterProfiler' (https://bioconductor.org/packages/clusterProfiler/)
respectively. The reference pathway lists used were Gene Ontology
(GO), Kyoto Encyclopedia of Genes and Genomes (KEGG) and Hallmark
(version 7.5.1; https://www.gsea-msigdb.org). R software Gene Set
Variation Analysis (GSVA) package (https://bioconductor.org/packages/release/bioc/html/GSVA.html)
was used to analyze the correlation between MTHFD2 expression and
pathway activation by choosing 'ssgsea' parameter. The correlation
between genes and pathway scores was analyzed by Spearman
correlation. Genes in enriched biological pathways were selected
and Cytoscape version 3.8.1 was used for graphical representations
of the pathways (21).
Drug sensitivity analysis
The chemotherapeutic response for each sample of
TCGA-BC dataset was predicted based on the largest publicly
available pharmacogenomics database, namely the Genomics of Drug
Sensitivity in Cancer (GDSC; https://www.cancerrxgene.org/). The prediction process
was implemented by the R package 'pRRophetic' (https://github.com/paulgeeleher/pRRophetic). The
half-maximal inhibitory concentration (IC50) of the
samples was estimated by ridge regression. All parameters were set
as default values. Using the batch effect correction package
'ComBat' in R software (https://rdrr.io/bioc/sva/man/ComBat.html)and the type
of all tissues, duplicate gene expression was summarized as the
mean value.
Cell culture
Human BC cell lines, including UMUC3, T24, 5637 and
J82, and the SV-HUC-1 (human bladder cell biochemistry Pillon) cell
line were purchased from The Cell Bank of Type Culture Collection
of Chinese Academy of Sciences. T24 cells were cultured in
high-glucose DMEM (Gibco; Thermo Fisher Scientific, Inc.). UMUC3
and J82 cells were cultured in MEM (Gibco; Thermo Fisher
Scientific, Inc.). 5637 cells were cultured in 1640 medium (Gibco;
Thermo Fisher Scientific, Inc.). SV-HUC-1 cells were cultured in
F12k medium (Gibco; Thermo Fisher Scientific, Inc.). All culture
media contained 10% fetal bovine serum (FBS; HyClone; Cytiva), 100
U/ml penicillin and 100 µg/ml streptomycin. T24 and
T24-shRNA2 cells were stimulated with DMSO or 90 µg/ml 740
Y-P (TargetMol) for 48 h at 37°C in order to confirm that MTHFD2
regulates the proliferation of BC cells and PD-L1 expression via
the PI3K/AKT pathway. All of the cells were cultured at 37°C in an
atmosphere containing 5% CO2.
Western blot analysis
Total proteins were extracted from T24 and UMUC3
cells or preserved BC and adjacent tissues, and were stored at
-80°C. Western blot analysis was performed as previously described
(22). Total proteins were
isolated using RIPA lysis buffer (Beyotime Institute of
Biotechnology) and were quantified using a BCA protein Assay kit
(Thermo Fisher Scientific, Inc.). Proteins (20 µg/lane) were
separated by SDS-PAGE on 12% gels and transferred to PVDF
membranes. After blocking for 2 h with 5% skimmed milk at room
temperature, the membranes were incubated with diluted primary
antibodies overnight at 4°C. The primary antibodies and
concentrations used in the present study were as follows: β-actin
(cat. no. 58169; 1:1,000; Cell Signaling Technology, Inc.), MTHFD2
(cat. no. 98116; 1:1,000; Cell Signaling Technology, Inc.),
anti-phosphorylated (p)-PI3K (cat. no. 17366; 1:1,000; Cell
Signaling Technology, Inc.), anti-p-AKT (cat. no. 4060; 1:1,000;
Cell Signaling Technology, Inc.), anti-PI3K (cat. no. 4257;
1:1,000; Cell Signaling Technology, Inc.), anti-AKT (cat. no. 4691;
1:1,000; Cell Signaling Technology, Inc.) and anti-PD-L1 (cat. no.
ab282458; 1:1,000; Abcam). Subsequently, the membranes were
incubated with a horseradish peroxidase-labeled goat anti-rabbit
secondary antibody (cat. no. ab6721; 1:3,000; Abcam) or goat
anti-mouse (cat. no. ab6789; 1:3,000; Abcam) for 1.5 h at room
temperature. BeyoECL Plus (Beyotime Institute of Biotechnology) was
used to visualize the protein bands. ImageJ 1.45 software (National
Institutes of Health) was used to perform densitometric analysis of
each band.
Hematoxylin and eosin (H&E) staining
and immunohisto-chemistry (IHC)
Tumor tissue from nude mice, or BC and adjacent
nontumor tissues from the TMA were fixed with 4% neutral
formaldehyde for <24 h at room temperature, rehydrated in a
graded alcohol series, rendered transparent with xylene, embedded
in paraffin and sectioned (4 µm). The TMA was manufactured
by Shanghai Outdo Biotechnology Co., Ltd. Subsequently, antigen
retrieval was performed with Tris-EDTA (pH 9.0) for 15 min in a
microwave. The sections were then incubated at 37°C in 3%
H2O2 for 10 min and blocked in 10% sheep
serum (Shanghai Yaji Biotechnology Co., Ltd.) for 10 min. The
tissues were incubated with a primary antibody against MTHFD2 (cat.
no. ab151447; 1:200; Abcam) or PD-L1 (cat. no. ab282458; 1:500;
Abcam) overnight at 4°C, followed by incubation with a secondary
antibody (cat. no. ab288151; 1:200; Abcam) for 30 min at room
temperature and staining with DAB (Dako; Agilent Technologies,
Inc.). Slides were then stained with hematoxylin for 5 min at room
temperature and sealed with neutral gum. For H&E staining, the
sections were stained with hematoxylin for 3 min and eosin for 1
min at room temperature. Images was captured under a light
microscope. Images of the TMA were scanned using a Pannoramic SCAN
II (3DHISTECH Ltd.) and analyzed using Quant Center 2.1 software
(3DHISTECH Ltd.).
The cytoplasmic staining results were evaluated by
two independent pathologists based on the percentage of positive
cells and the intensity of staining. The intensity of staining was
scored as 0, no staining; 1, mild staining; or 2, deep staining.
The percentage of positive cells was scored as: 0, no tumor cells
stained; 1, <10% tumor cells stained; 2, 10-50% tumor cells
stained; and 3, >50% tumor cells stained. The results were
calculated as 'intensity x proportion'. A total score of <2 was
defined as negative expression, whereas ≥2 was defined as positive
expression. ImageJ 1.45 software (National Institutes of Health)
was used to determine mean protein expression for IHC.
RNA extraction and reverse
transcription-quantitative PCR (RT-qPCR)
Total RNA was extracted from UMUC3, T24, 5637, J82
and SV-HUC-1 cells and tissues using TRIzol® reagent
(Invitrogen; Thermo Fisher Scientific, Inc.), and the concentration
and purity of the extracted RNA were assessed according to the
optical density (OD)260/OD280 value. cDNA was synthesized using a
Takara PrimeScript RT reagent kit (cat. no. RR037A; Takara Bio,
Inc.) according to the manufacturer's protocol. qPCR was performed
using SYBR Premix EX Taq kit (Takara Bio, Inc.) under the following
thermocycling conditions: Initial denaturation at 95°C for 30 sec,
followed by 40 cycles at 95°C for 5 sec and 60°C for 30 sec for
annealing and elongation. β-actin was used as the internal
reference gene (22). The mRNA
relative expression levels were evaluated using the
2−ΔΔCq method (23).
The primer sequences were as follows: β-actin, forward 5′-TCT CCC
AAG TCC ACA CAG G-3′, reverse 5′-GGC ACG AAG GCT CAT CA-3′; and
MTHFD2, forward 5′-CAG CAG ATC AAG CAG GAA G-3′, reverse 5′-GCA GGA
TTC TCG CCA AC-3′.
Cell Counting Kit-8 (CCK-8) assay
The CCK-8 assay was performed to measure cell
viability. Briefly, ~1×10³ UMUC3 or T24 cells were
seeded into 96-well plates and cultured for 24 h. Subsequently, 10
µl CCK-8 solution (Nanjing KeyGen Biotech Co., Ltd.) was
added to each well at 0, 24, 48 and 72 h. After incubation for 2 h,
the absorbance was measured at 450 nm with a Spark™ 10 M microplate
reader (Tecan Group, Ltd.).
Apoptosis and cell cycle analysis
For the analysis of apoptosis and cell cycle
distribution, ~1×10⁶ UMUC3 or T24 cells were collected
and washed twice in pre-cooled PBS. For apoptosis analysis,
7-aminoactinomycin D (7-AAD) and annexin V-allophycocyanin (APC)
solutions were added for 15 min at 4°C, according to the
instructions of the manufacturer of the apoptosis kit (cat. no.
AP105-100; Hangzhou Lian Ke Biotechnology Co., Ltd.). For cell
cycle analysis, PI and RNase [PI (20X) and RNase A (50X); ratio,
5:2] were added for 10 min at 4°C according to the manufacturer's
instructions (cell cycle kit; cat. no. MA0334; Dalian Meilun
Biotechnology Co., Ltd.). Cells were then measured using flow
cytometry (Accuri C6; BD Biosciences) and analyzed using FlowJo
10.8.1 (FlowJo LLC).
Colony formation assay
UMUC3 or T24 cells (~300 cells/well for T24 and ~400
cells/well for UMUC3) were seeded in 6-well plates, and cultured in
an incubator (37°C, 5% CO2) with 10% FBS-containing
medium for 10-14 days. The culture was terminated when the number
of cells per colony was >50 as observed under a light
microscope, or when the colony was visible under the naked eye.
Cells were fixed with 4% paraformaldehyde for 30 min at room
temperature. The colonies were stained with 0.1% crystal violet for
15 min at room temperature and images were captured. The number of
colonies formed was calculated manually.
Tumor formation in nude mice
Female BALB/c nude mice (age, 4 weeks; weight, 30 g)
were obtained from Hunan Silaike Jingda Laboratory Animal Co., Ltd.
and were housed under a controlled temperature of 22°C, 50%
humidity with a 12-h light/dark cycle, and had ad libitum
access to food and water. A total of 14 mice were divided into two
groups (n=7 mice/group). All animal experimental protocols were
approved by the Animal Care and Use Committee of Nanchang
University [approval no. SYXK (Gan) 2015-0001]. Briefly, T24-NC and
T24-shRNA2 cells at a density of 1×10⁸ cells/ml were
resuspended in 200 µl Matrigel and were injected
subcutaneously into the left flanks of mice. The size of the tumor
was recorded every 3-6 days, and the volume was calculated as V=1/2
× A x B2 (where A is the longest diameter and B is the
shortest diameter). After 4 weeks, the nude mice were euthanized by
cervical dislocation, and tumors were photographed, measured,
weighed and immunohistochemically stained. Death was confirmed by
respiratory arrest. Humane endpoints were used in the present
study, including tumor diameter >20 mm, inability to stand,
weight loss >20% and failure to response to external
stimuli.
RNA-seq
RNA-seq was performed by NovelBio Bio-Pharm
Technology Co., Ltd. Total RNA was extracted from three replicates
of T24-NC and T24-shRNA2 using TRIzol reagent (Invitrogen; Thermo
Fisher Scientific, Inc.). The RNA quality was assessed using an
Agilent 2200 (cat. no. G2965AA; Agilent Technologies, Inc.) and
stored at -80°C. cDNA libraries were constructed for each RNA
sample using the HiSeq X Ten Reagent kit v2.5 (cat. no.
FC-501-2501; Illumina, Inc.) according to the manufacturer's
protocol. The libraries were quality controlled and the
concentration was measured with Agilent 2200, and sequenced by
HiSeq X (cat. no. HiSeq X 10; Illumina, Inc.) on a 150 bp
paired-end run. The loading concentration of the final library was
10 pM. The clean reads were then aligned to the human genome
(GRCh38; National Center for Biotechnology Information) using
Hisat2 (24). HTseq (25) was used to calculate gene counts,
while the Reads Per Kilobase per Million mapped reads method was
used to determine gene expression.
Statistical analysis
GraphPad Prism 8.00 software (GraphPad Software,
Inc.) and R (version 4.0.2, https://www.R-project.org/) were used for data
analysis. The Shapiro-Wilk test was used to determine if the data
had a normal distribution. Paired Student's t-test was used for
expression analysis of paired bladder cancer and adjacent tissues.
Unpaired Student's t-test or one-way ANOVA with post hoc Turkey's
honest significant difference test were used in the case of other
normal distribution. A nonparametric test (Wilcoxon signed-rank or
Kruskal-Wallis with Dunn's post hoc test) was used elsewhere. If
not otherwise specified, quantitative data are expressed as the
mean ± standard deviation. Kaplan-Meier survival curves were
plotted using the 'survival' package (https://CRAN.R-project.org/package=survival) in R
(version 4.0.2) to analyze the association between MTHFD2
expression and the overall survival (OS) of patients with BC. In
the survival analysis, the R package 'maxstat' (maximally selected
rank statistics with several P-value approximations version 0.7-25,
https://CRAN.R-project.org/package=maxstat) was used
to calculate the optimal cut-off value of MTHFD2 expression,
setting the minimum number of grouping samples to be >25%, and
the maximum number of samples to be grouped <75%. The best
cut-off value was obtained as 12.23408 for TCGA-BC and 0.000844 for
TMA. In other analyses, grouped cut-off values were set as the
median MTHFD2 expression. Based on such cut-off values, the
patients were divided into two groups: High and low MTHFD2
expression. Log-rank test was used to determine P-values.
Univariate and multivariate Cox regression analyses were performed
to evaluate the OS of patients in TCGA-BC cohort. The correlation
between the two variables was calculated by Spearman's rank
correlation analysis. P<0.05 was considered to indicate a
statistically significant difference.
Results
MTHFD2 is highly expressed in BC
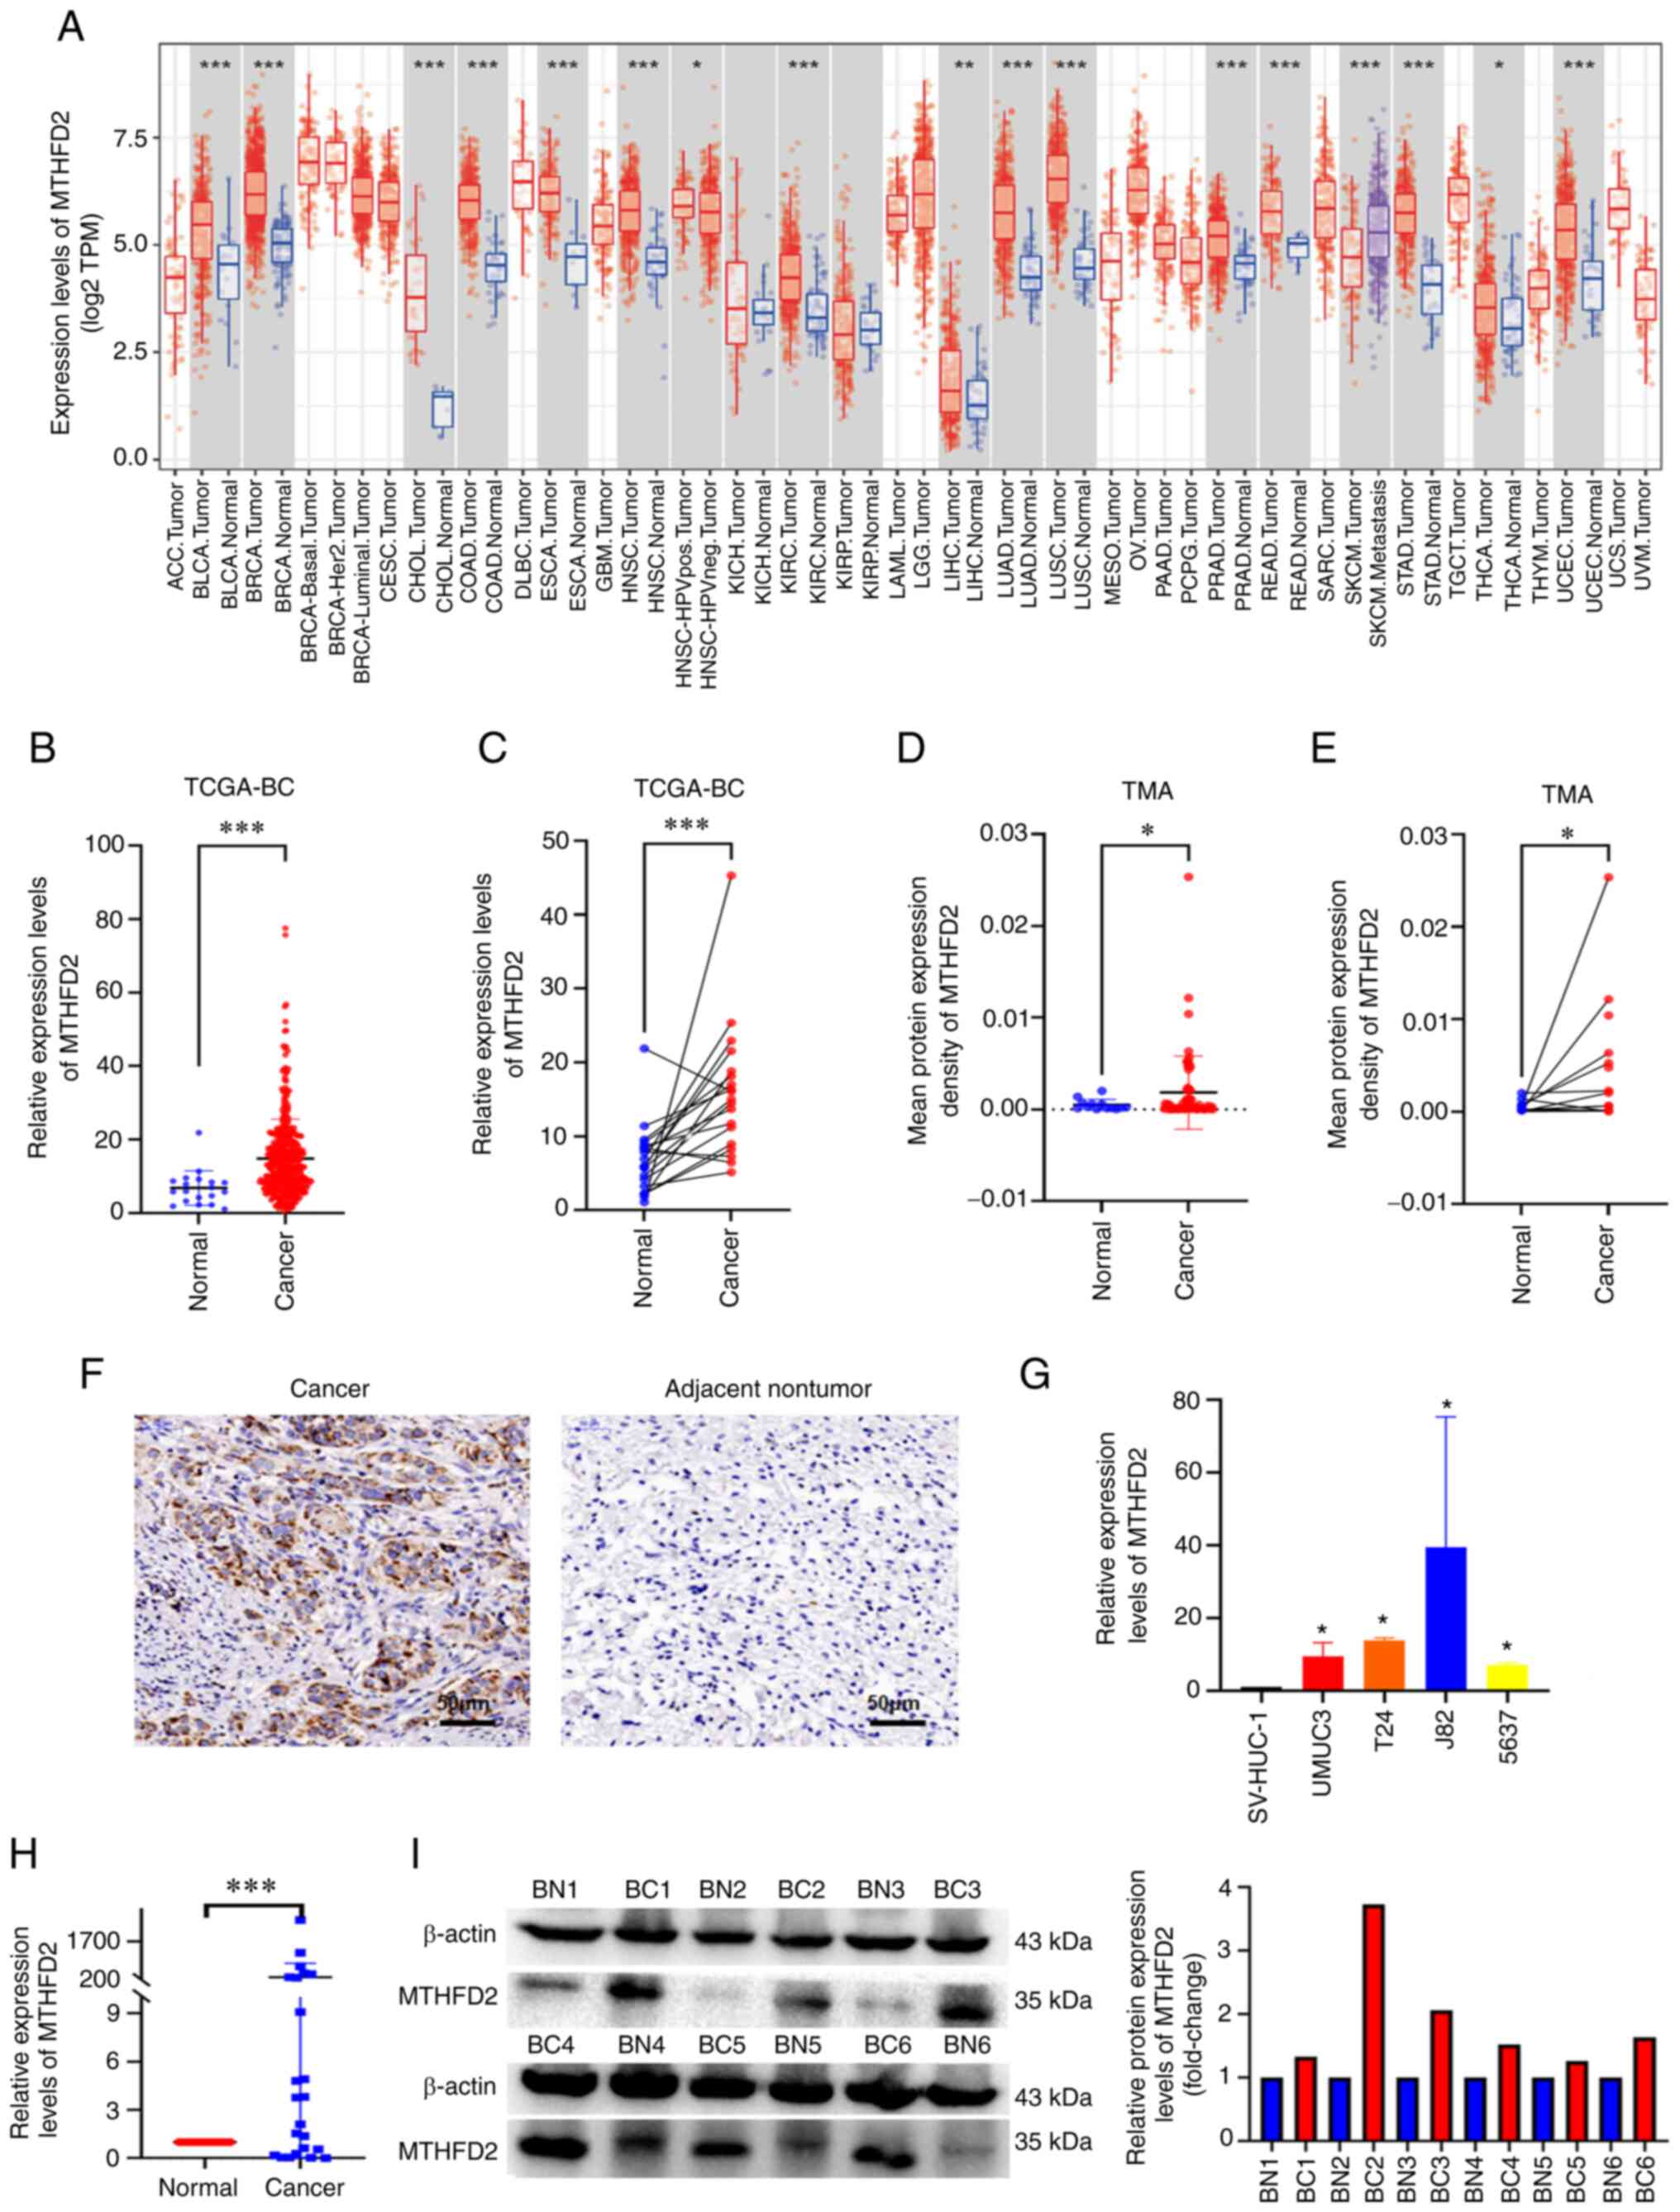
The expression of MTHFD2 in pan-cancer was first
examined using the TIMER online tool. MTHFD2 was highly expressed
in various types of cancer, including Bladder Urothelial Carcinoma
(Fig. 1A). In the analysis of
TCGA-BC data, an unpaired tissue comparison revealed that MTHFD2
expression was significantly increased in BC, when 414 BC samples
were compared with 19 normal bladder tissue samples using RNA-seq
(Fig. 1B). Similar results were
obtained when the 19 BC samples were compared with their matched
normal bladder tissue samples (Fig.
1C). IHC was used to examine the expression of MTHFD2 in BC
tumor and normal tissues in a commercial TMA. BC tumor tissues
exhibited higher MTHFD2 expression than normal tissues (Fig. 1F). Further analysis of the
expression data in the TMA also indicated that MTHFD2 was highly
expressed in BC, both when 60 BC samples were compared with 13
unpaired normal bladder tissue samples (Fig. 1D) and when 13 BC samples were
compared with their matched normal bladder tissue samples (Fig. 1E). To assess the roles of MTHFD2
in BC cells, the mRNA expression levels of MTHFD2 were detected in
SV-HUC-1 cells and in BC cell lines (UMUC3, T24, J82 and 5637)
using RT-qPCR. As shown in Fig.
1G, the mRNA expression levels of MTHFD2 were significantly
higher in BC cells compared with those in SV-HUC-1 cells.
Subsequently, the mRNA expression levels of MTHFD2 were detected in
24 pairs of cancer and adjacent tissues collected at our hospital
by RT-qPCR (Fig. 1H), and MTHFD2
protein expression in six pairs of high-grade BC and adjacent
tissues was detected by western blotting (Fig. 1I). Both mRNA and protein
expression levels of MTHFD2 were significantly higher in BC tissues
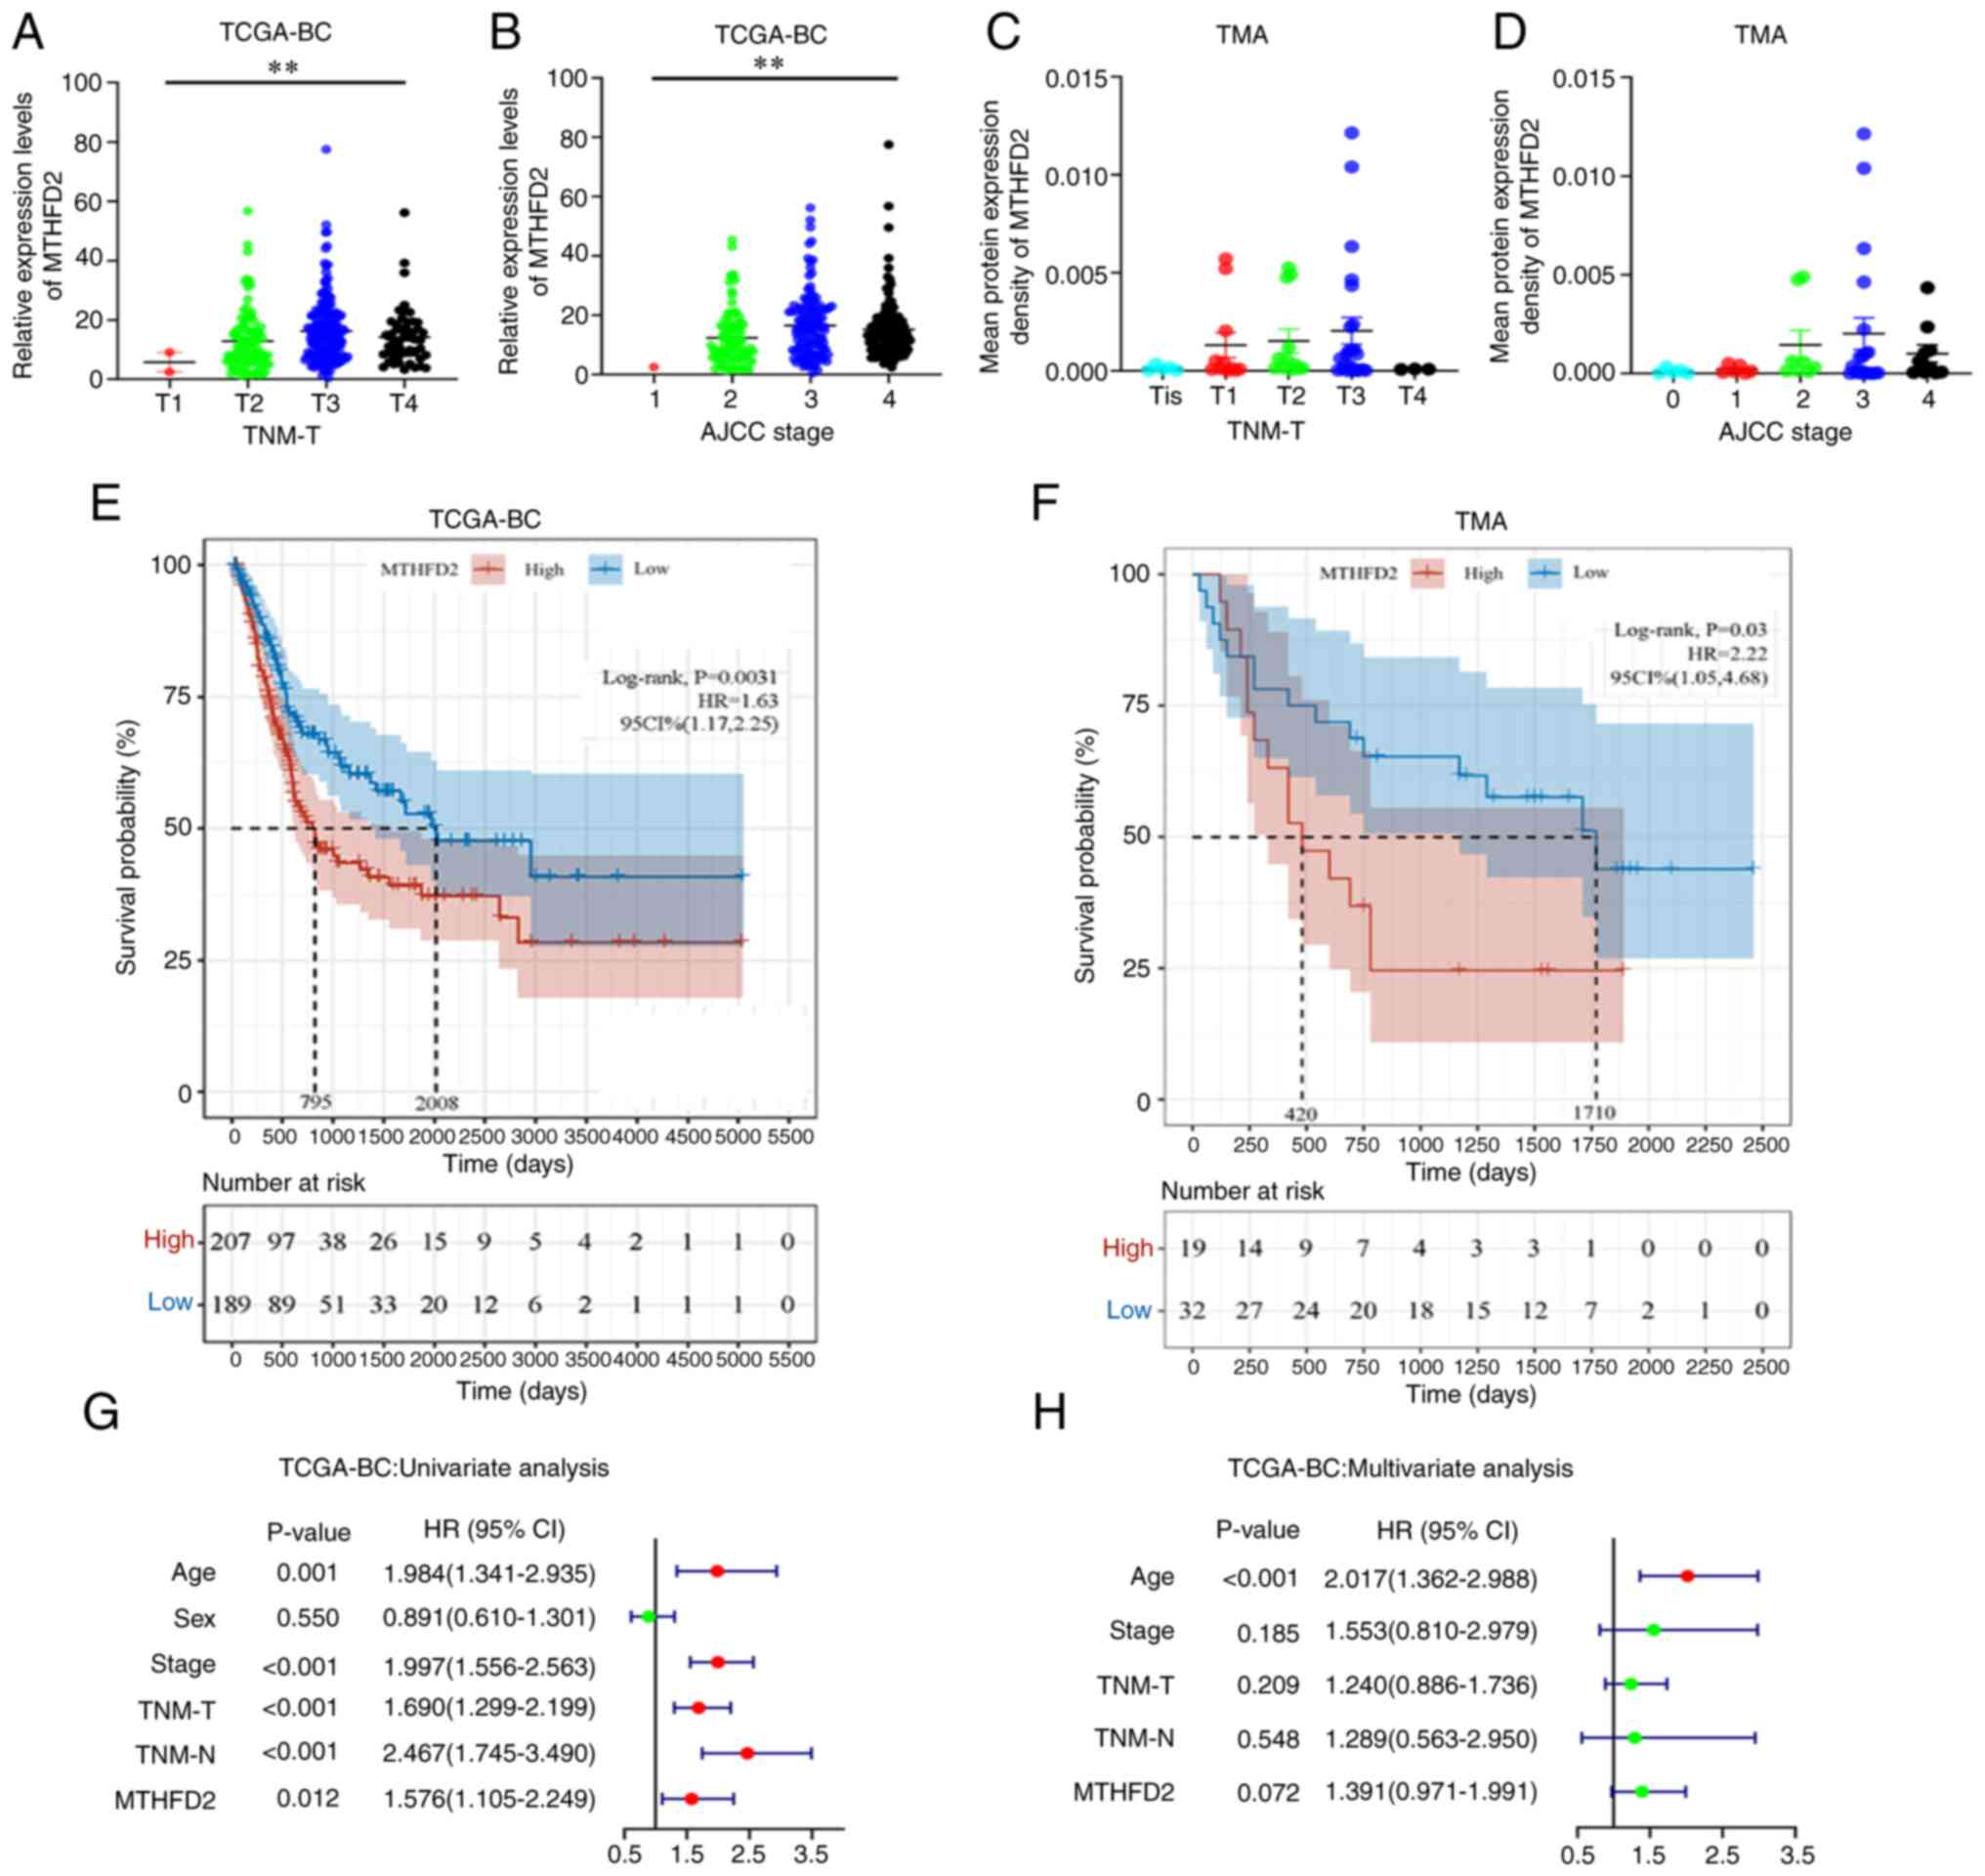
compared with those in adjacent tissues. MTHFD2 expression was also
strongly associated with TNM-T stage (Fig. 2A) and American Joint Committee on
Cancer (AJCC) stage (Fig. 2B) in
TCGA-BC data. In addition, a similar trend was observed in the TMA
data (Fig. 2C and D); however,
the results did not reach statistical significance, possibly due to
the small sample size of the individual groups. Taken together,
these results confirmed that MTHFD2 was highly expressed in BC.
MTHFD2 expression in BC is associated
with poor prognosis
The association between MTHFD2 expression and OS was
analyzed in patients with BC. Patients with elevated MTHFD2 levels
had significantly shorter OS in TCGA-BC cohort (Fig. 2E). A similar result was obtained
for the TMA data (Fig. 2F).
Subsequently, in the univariate Cox regression analysis, age, AJCC
stage, TNM-T stage, TNM-N stage and MTHFD2 expression were
significantly associated with the OS of patients with BC (Fig. 2G). Missing values were removed
from multivariate Cox regression analysis and the remaining samples
were included. In the multivariate Cox regression analysis
(Fig. 2H), only age remained a
significant and independent factor. The expression of MTHFD2
exhibited a trend to associate with patient OS, but it was not
statistically significant, possibly due to the interference of
other clinical features.
MTHFD2 expression is associated with
immune cell infiltration in BC
The association between MTHFD2 expression and immune
cell infiltration in BC was investigated using the TIMER database
(Fig. 3A). It was revealed that
MTHFD2 was negatively correlated with tumor purity (r=-0.211;
P=4.39×10⁻⁵), and was positively correlated with the
infiltration of CD8+ T cells (r=0.364;
P=6.38×10⁻¹³), macrophages (r=0.145;
P=5.49×10⁻³), neutrophils (r=0.269;
P=2.03×10⁻⁷) and dendritic cells (r=0.407;
P=5.62×10⁻¹⁶); however, the correlations with tumor
purity, macrophages and neutrophils were weak. Differences in
immune infiltration between the low- and high-MTHFD2 expression
groups for 22 immune cells were analyzed using CIBERSORT. As shown
in Fig. 3B, the distribution of
memory B cells (P=4.78×10⁻⁴), plasma B cells
(P=1.25×10⁻⁴), CD4+ naive T cells
(P=2.57×10⁻⁴), CD4+ memory-activated T cells
(P=7.72×10⁻¹²), follicular T helper cells
(P=2.53×10⁻²), regulatory T cells
(P=4.20×10⁻⁷), monocytes (P=9.10×10⁻⁶), M0
macrophages (P=3.78×10⁻⁶), M1 macrophages
(P=1.16×10⁻⁹), M2 macrophages (P=3.95×10⁻³),
activated myeloid dendritic cells (P=2.31×10⁻⁵),
activated mast cells (P=3.33×10⁻⁸), resting mast cells
(P=4.21×10⁻⁷) and neutrophils (P=2.22×10⁻²)
was significantly different between the low- and high-MTHFD2
expression groups. In addition, a correlation was identified
between MTHFD2 expression and various immune-related molecules
using the TIMER database, including immune-stimulators,
immune-inhibitors, major histocompatibility complex (MHC)
molecules, chemokines and receptors (Fig. S1). The association between MTHFD2
and immune checkpoint molecules is shown in Fig. 3C. MTHFD2 expression was strongly
associated with the expression of CD274 (P=1.33×10⁻²¹),
CTLA4 (P=2.80×10⁻¹²), HAVCR2 (P=1.39×10⁻¹⁸),
LAG3 (P=9.94×10⁻¹⁹), PDCD1 (P=6.29×10⁻¹²),
PDCD1LG2 (P=1.29×10⁻²²), TIGIT (P=5.76×10⁻¹¹)
and SIGLEC15 (P=3.04×10⁻²²). The tumor mutational burden
(TMB) has been reported to be helpful in predicting the response to
immune checkpoint inhibitor treatment across numerous cancer types
(26). A weak positive
correlation was identified between TMB and MTHFD2 expression in
TCGA-BC cohort (r=0.21; P=2.54×10⁻⁵; Fig. 3D). As shown in Fig. 3E, the tumor microenvironment
(TME)-related scores were compared between the low- and high-MTHFD2
expression groups of TCGA-BC cohort using ESTIMATE. It was observed
that samples with high MTHFD2 expression had higher ESTIMATE,
immune and stromal scores. Furthermore, using the expression data
of CD8 and PD-L1 in the TMA, the correlation between MTHFD2 and
CD8/PD-L1 expression in the TMA cohort was verified. The results
showed that MTHFD2 expression was weakly positively correlated with
CD8 (r=0.29; P=0.02; Fig. 3F) and
PD-L1 (r=0.34; P=7.9×10⁻³; Fig. 3G) expression. Taken together,
these results suggested that there is an association between MTHFD2
expression and immune cell infiltration in BC.
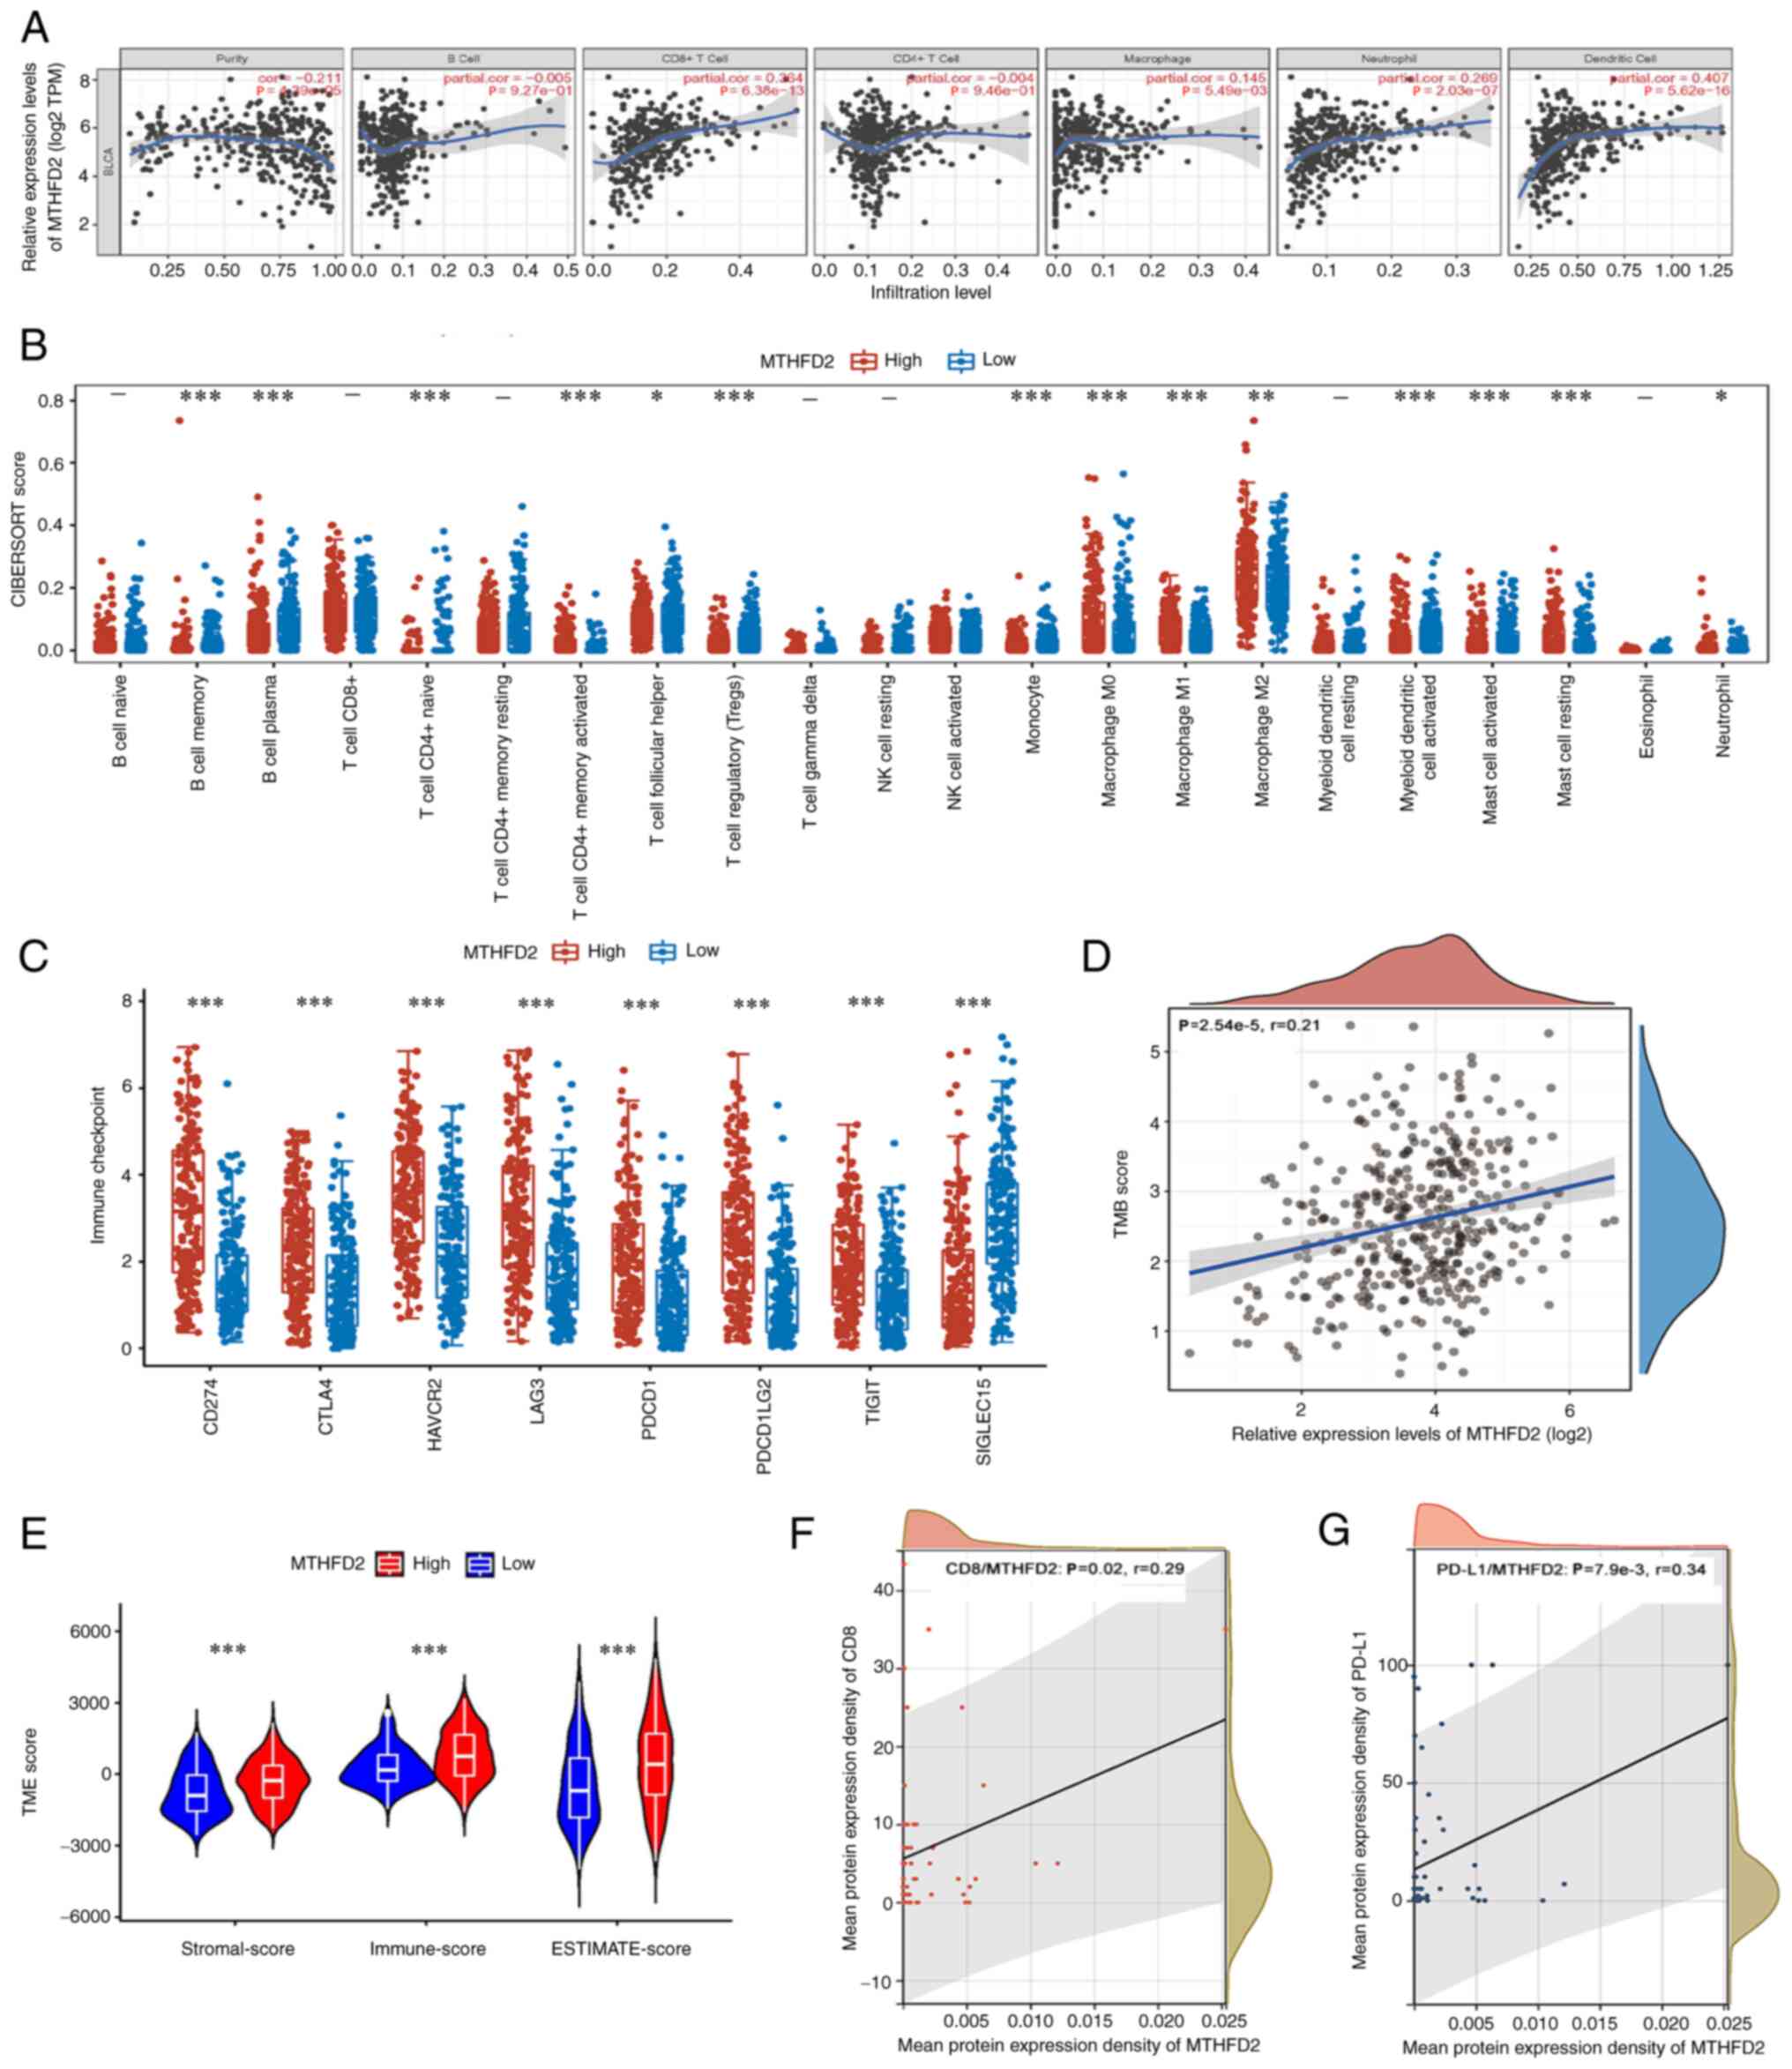 | Figure 3MTHFD2 is associated with immune
infiltration in BC. (A) MTHFD2 expression was negatively correlated
with tumor purity, and positively correlated with the infiltration
of CD8+ T cells, macrophages, neutrophils and dendritic
cells in TCGA-BC dataset, as determined by TIMER analysis. (B)
Association of MTHFD2 expression with several immune cells in
TCGA-BC dataset, as determined using CIBERSORT. (C) MTHFD2
expression was strongly related with the expression of immune
checkpoint molecules CD274, CTLA4, HAVCR2, LAG3, PDCD1, PDCD1LG2,
TIGIT and SIGLEC15 in TCGA-BC dataset. (D) MTHFD2 expression was
significantly positively correlated with TMB in TCGA-BC dataset.
(E) Association of MTHFD2 expression with the TME presented as
ESTIMATE, Immune and Stromal scores in TCGA-BC dataset. MTHFD2
expression was significantly and positively correlated with (F) CD8
and (G) PD-L1 in TMA. *P<0.05,
**P<0.01, ***P<0.001. BC, bladder
cancer; MTHFD2, methylenetetrahydrofolate dehydrogenase 2; PD-L1,
programmed death-ligand 1; TCGA, The Cancer Genome Atlas; TMA,
tissue microarray; TMB, tumor mutational burden; TME, tumor
microenvironment. |
MTHFD2 exerts oncogenic effects on
BC
To further confirm the function of MTHFD2 in BC, T24
and UMUC3 cell lines with stable knockdown of MTHFD2 expression
were constructed. The results of RT-qPCR (Fig. 4A and B) and western blot analysis
(Fig. 4C and D) revealed that the
expression levels of MTHFD2 were significantly decreased in T24 and
UMUC3 cells following lentiviral infection. As the knockdown effect
of shRNA2 was better than that of the other shRNAs, it was used for
further experiments.
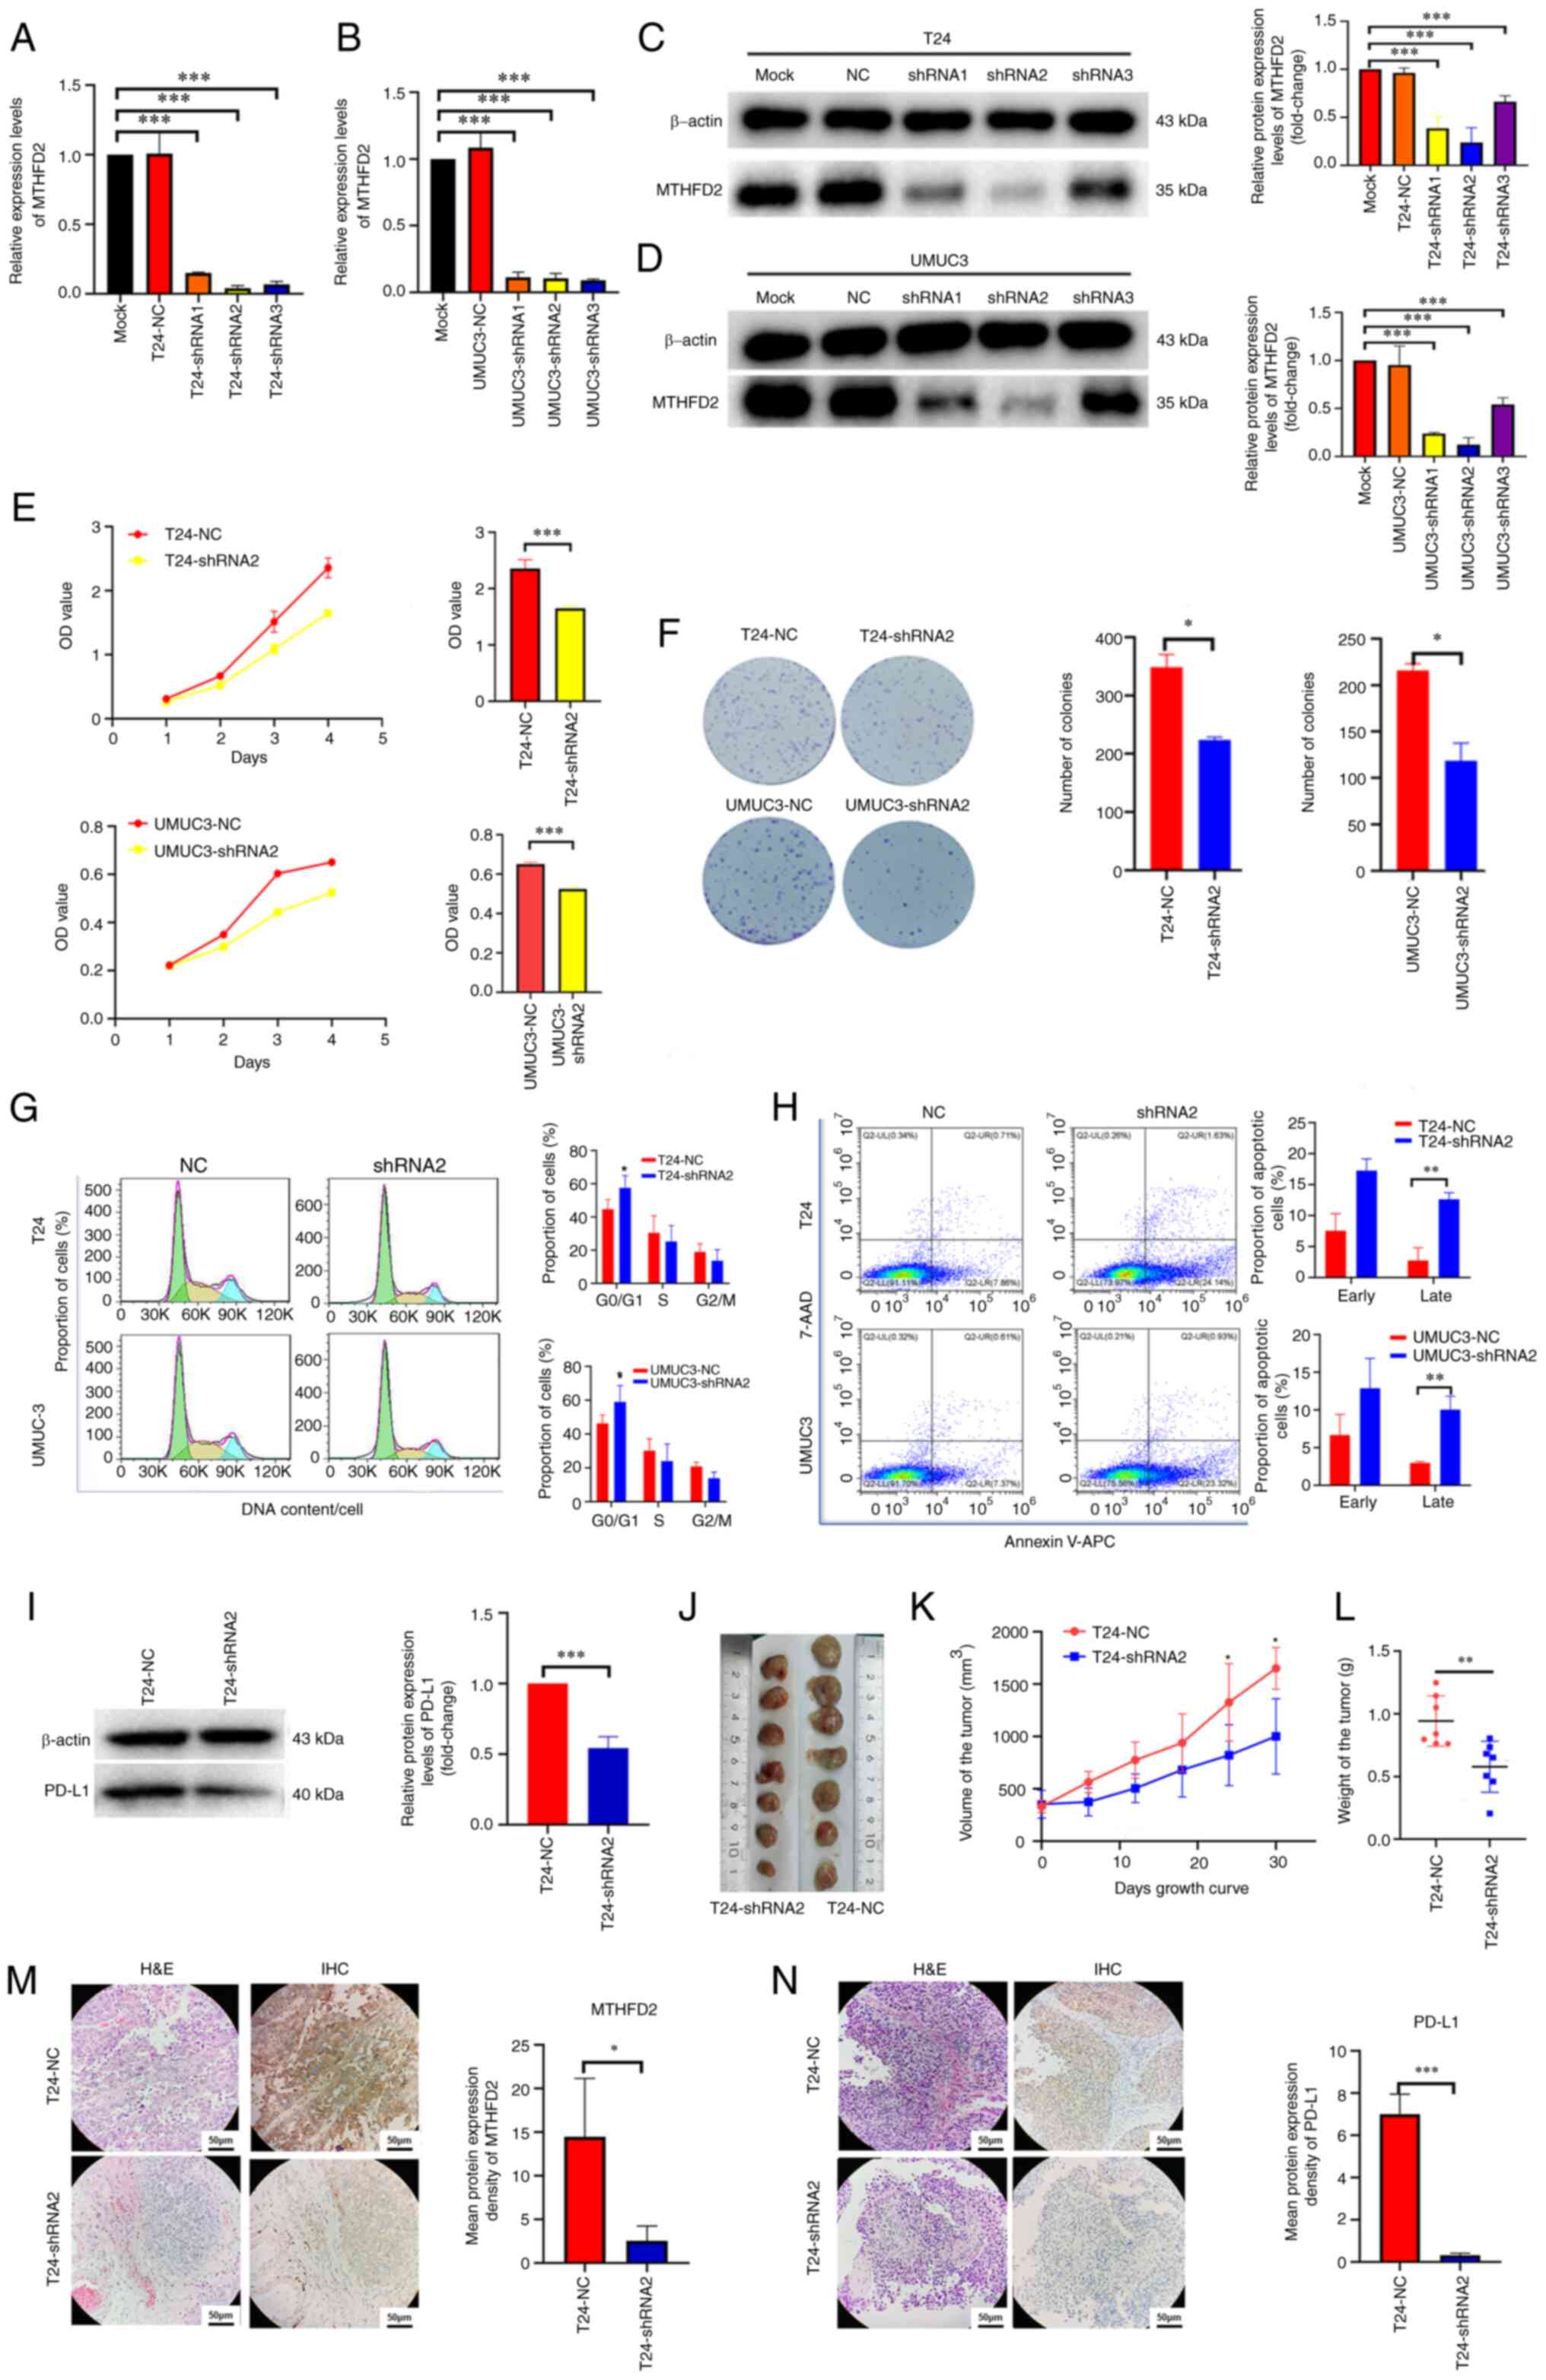 | Figure 4Knockdown of MTHFD2 inhibits the
proliferation of bladder cancer cells. The knockdown efficiency of
MTHFD2-shRNAs was detected by reverse transcription-qPCR in (A) T24
and (B) UMUC3 cells, and by western blotting in (C) T24 and (D)
UMUC3 cells. (E) Cell proliferation was determined by the Cell
Counting Kit-8 assay. The bar charts shown the proliferative
capacity of cells on day 4. (F) Tumorigenic capacity was determined
by colony formation assay. (G) Cell cycle and (H) cell apoptosis
were determined by flow cytometry. (I) Expression levels of PD-L1
were determined by western blotting in T24 cells infected with
MTHFD2 and NC shRNAs. (J) Images of the subcutaneous tumors formed
in the nude mice following injection with T24-shRNA2 and T24-NC
cells. (K) Tumor volume and (L) tumor weight were reduced in the
T24-shRNA2 group compared with those in the T24-NC group. (M and N)
Representative H&E staining, and IHC of (M) MTHFD2 and (N)
PD-L1 in tumor xenograft tissues compared between the two groups.
*P<0.05, **P<0.01,
***P<0.001 as indicated or vs. T24-shRNA2. 7-AAD,
7-aminoactinomycin D; APC, allophycocyanin; IHC,
immunohistochemistry; MTHFD2, methylenetetrahydrofolate
dehydrogenase 2; NC, negative control; OD, optical density; PD-L1,
programmed death-ligand 1; shRNA, short hairpin RNA; Mock,
uninfected T24 or UMUC3 cells. |
CCK-8 (Fig. 4E)
and colony formation (Fig. 4F)
assays were performed to detect the effects of MTHFD2 knockdown on
the proliferation of T24 and UMUC3 cells. The results revealed that
the proliferative ability of T24-shRNA2 and UMUC3-shRNA2 cells was
significantly decreased (P<0.05) compared with that in the NC
groups. To clarify the mechanism underlying the effects of MTHFD2
on BC proliferation, cell cycle progression and apoptosis were
detected following MTHFD2 knockdown by flow cytometry. Through PI
detection of the cell cycle, it was revealed that the number of
cells in G1 phase was increased in the T24-shRNA2 and
UMUC3-shRNA2 groups, indicating that cells were arrested in the
G0/G1 phase (Fig. 4G). Furthermore, 7-AAD and Annexin
V-APC were used to assess the apoptosis of BC cells; the results
suggested that the number of late apoptotic cells was higher in
cells with MTHFD2 knockdown compared with that in the NC groups
(Fig. 4H).
Due to the significant association of MTHFD2 with
PD-L1 observed in previous analyses, PD-L1 protein expression was
examined in T24-shRNA2 cells. As shown in Fig. 4I, upon knockdown of MTHFD2, the
expression levels of PD-L1 were also significantly downregulated.
These findings were verified in vivo. T24-shRNA2 cells were
subcutaneously injected into nude mice, and T24-NC cells were used
as the NC. As shown in Fig. 4J-L,
compared with those in the T24-NC group, the xenografts in the
T24-shRNA2 group were significantly smaller and weighed less.
Consistent with the results in cell lines, the MTHFD2 and PD-L1
expression levels in xenografts detected via IHC were significantly
downregulated in the T24-shRNA2 group (Fig. 4M and N).
Pathway analysis
To identify the signaling pathways regulated by
MTHFD2, the transcriptome data of TCGA-BC cohort were analyzed.
Using the median MTHFD2 expression as the cut-off value, the cohort
was divided into two groups with high or low MTHFD2 expression. As
shown in Fig. 5A, 2,319 upregulated and 639 downregulated
DEGs were found. 'KEGG' (Fig. 5B and
C), 'GO' (Fig. 5D and E) and
Hallmark gene sets were used in the 'GSEA', which revealed that the
function of MTHFD2 was associated with multiple metabolic pathways
and immune regulation, such as 'T-cell activation', 'cytokine
production and interactions', as well as 'DNA replication and cell
cycle regulation'. In terms of signaling pathways, the
PI3K/AKT/mTOR, Myc targets and certain interleukin-regulated
pathways were significantly enriched (Fig. 5F and G). For further verification,
RNA-seq was used to analyze three replicates of T24-shRNA2 and
T24-NC cells. A total of 367 upregulated and 120 downregulated DEGs
were found (Fig. 5I). Enrichment
analysis revealed numerous terms in the enriched functions and
pathways, such as intracellular signal transduction, regulation of
molecular function and blood vessel development (Fig. 5J). The PI3K/AKT signaling pathway
was also significantly enriched when MTHFD2 was knocked down
(Fig. 5K). Using GSVA
(single-sample GSEA) analysis, a weak positive correlation was
observed between MTHFD2 expression and PI3K/AKT pathway activation
(r=0.29; Fig. 5H). The PI3K/AKT
signaling pathway was located at the central node in the network
constructed using the significantly enriched KEGG pathways
(Fig. 5L). Thus, the subsequent
experiments focused on this signaling pathway.
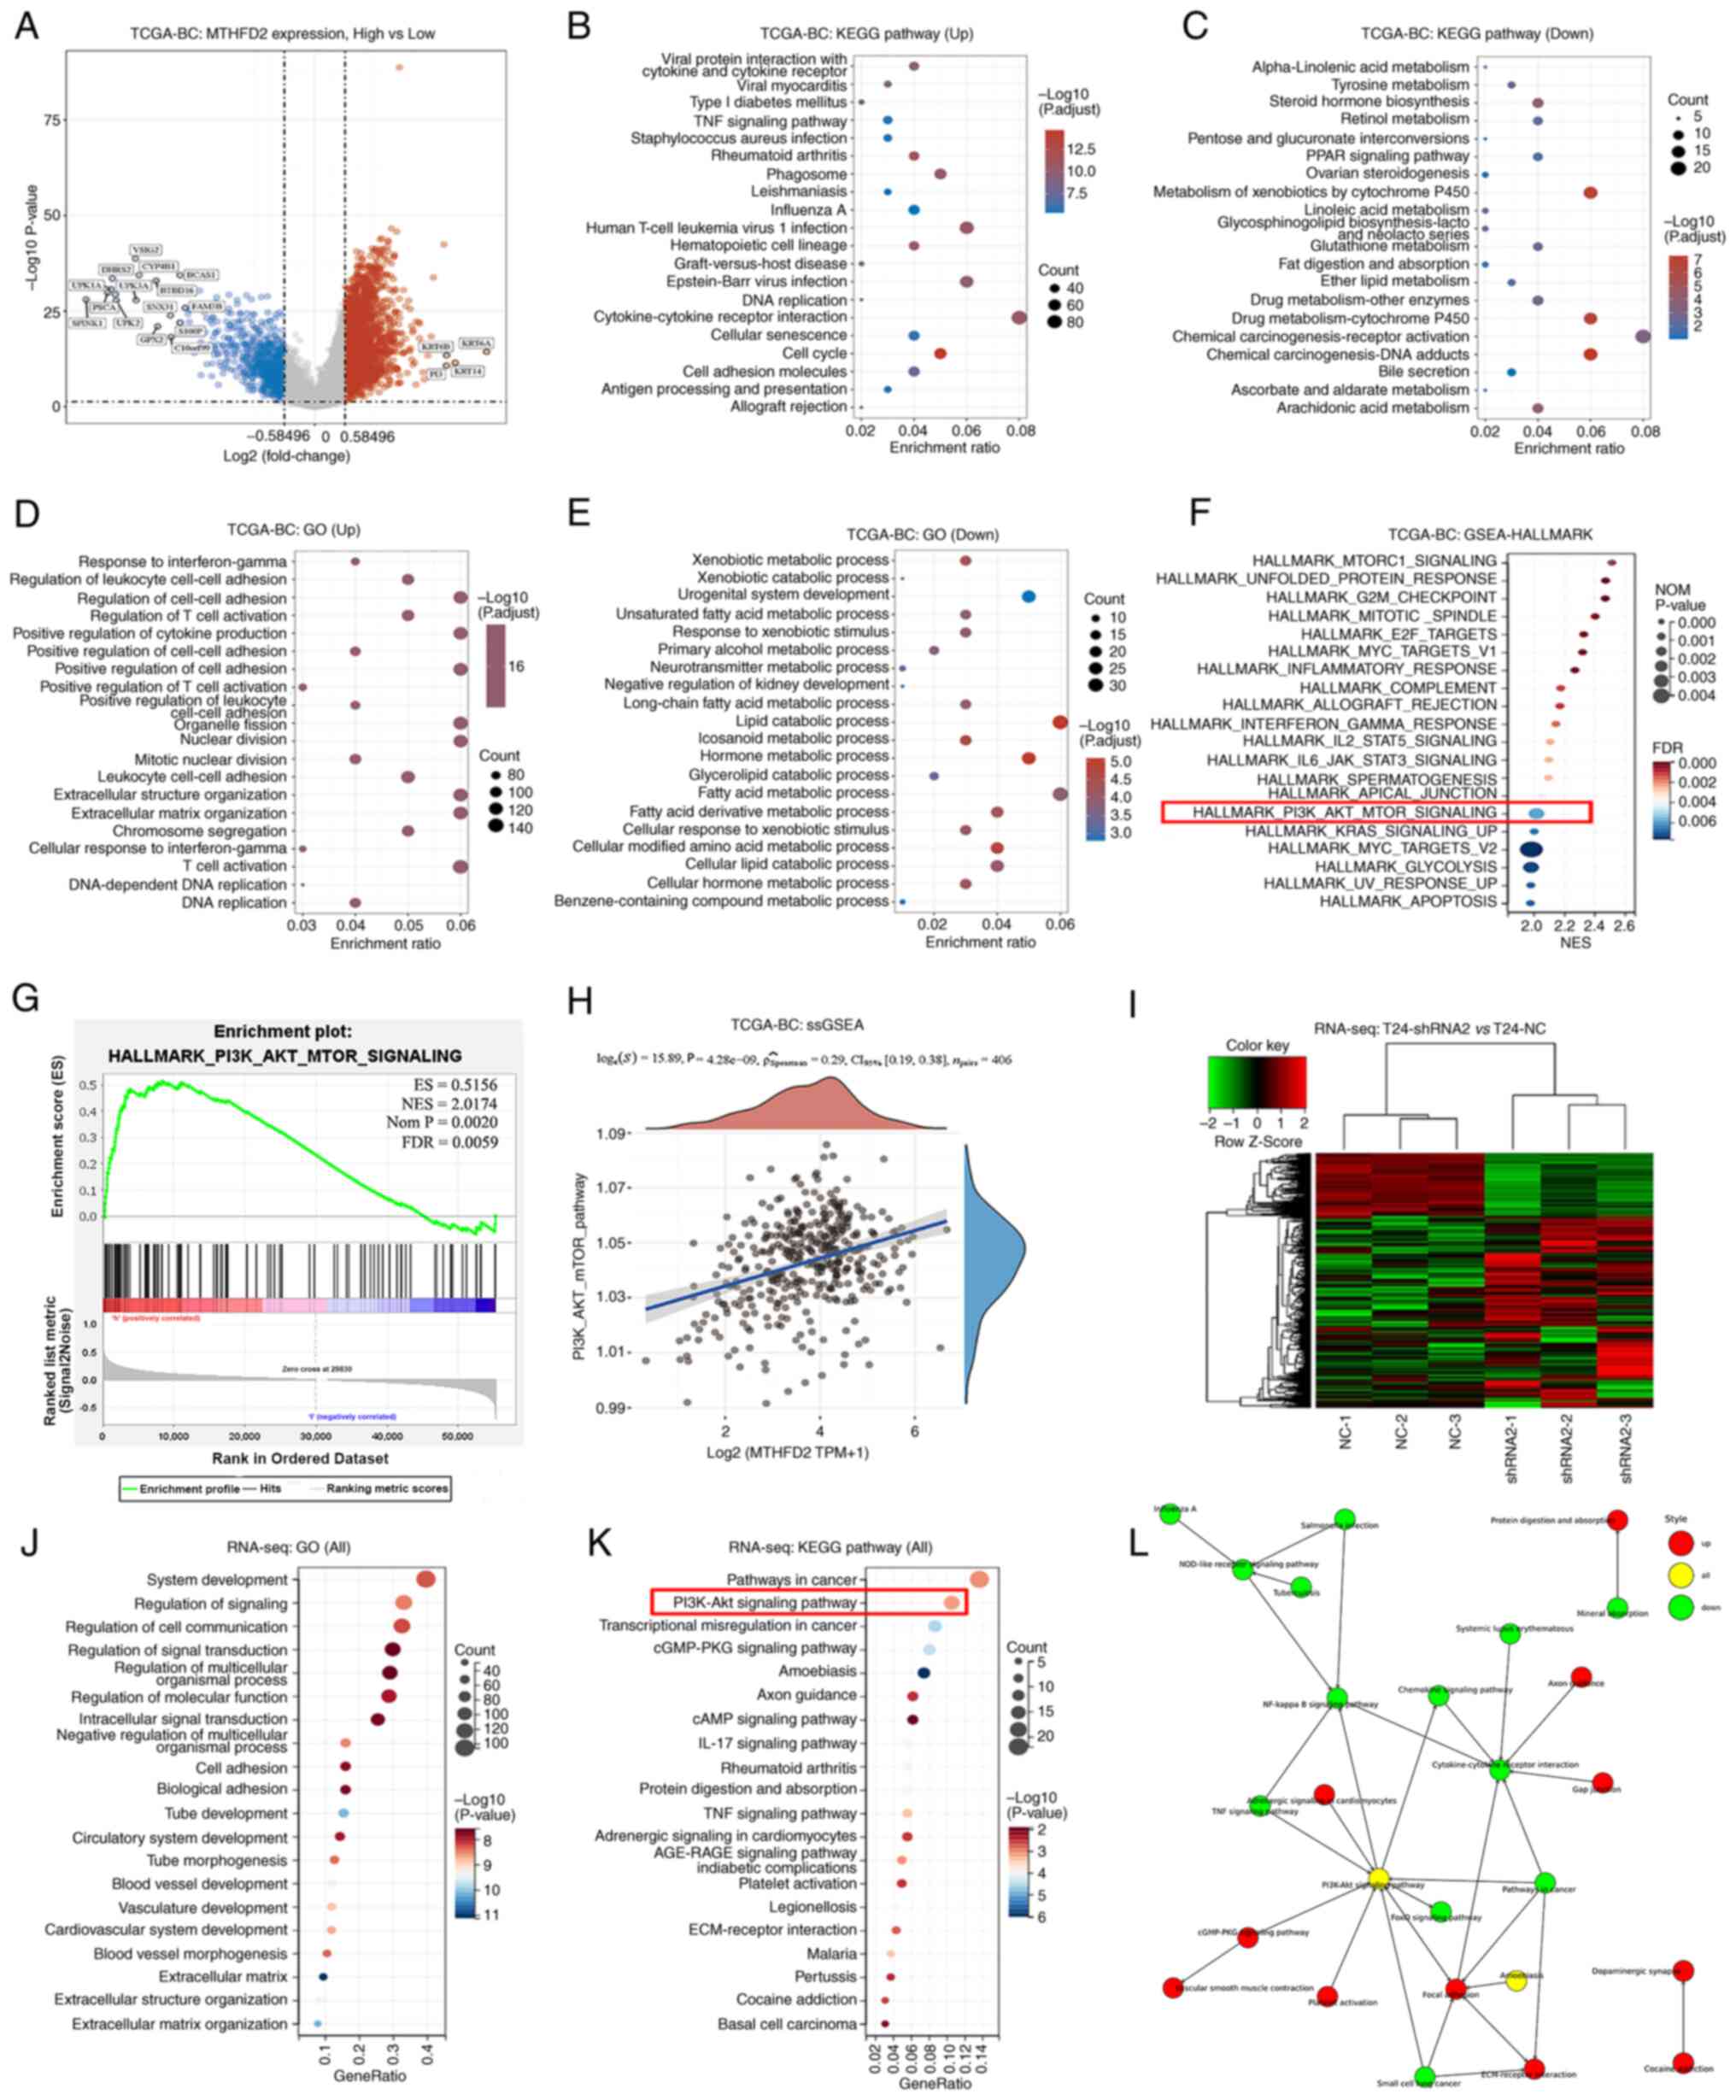 | Figure 5MTHFD2 related pathway analysis in
BC. Analyses between patients with low- and high-MTHFD2 expression
from TCGA-BC cohort: (A) Volcano plot presents DEGs; red dots
indicate upregulated genes, blue dots indicate downregulated genes
and grey dots indicate genes with no significant difference. The
top 20 enriched KEGG pathways in (B) upregulated DEGs and (C)
downregulated DEGs. The top 20 enriched GO functions in (D)
upregulated DEGs and (E) downregulated DEGs. (F) Top 20 enriched
pathways in GSEA using Hallmark gene sets. (G) Enrichment result of
PI3K-AKT-mTOR signaling in GSEA-Hallmark. (H) Correlation between
MTHFD2 and PI3K-AKT-mTOR signaling analyzed by ssGSEA. Analyses of
RNA-seq data between T24-shRNA2 and T24-NC cells: (I) A
heatmappresents DEGs. (J) Top 20 enriched GO functions. (K) Top 20
enriched KEGG pathways. (L) Network of significantly enriched KEGG
pathways presented by Cytoscape. BC, bladder cancer; DEG,
differentially expressed gene; GO, Gene Ontology; GSEA, Gene Set
Enrichment Analysis; KEGG, Kyoto Encyclopedia of Genes and Genomes;
MTHFD2, methylenetetrahydrofolate dehydrogenase 2; NC, negative
control; RNA-seq, RNA-sequencing; shRNA, short hairpin RNA; ssGSEA,
single-sample GSEA; TCGA, The Cancer Genome Atlas. |
Knockdown of MTHFD2 inhibits the
proliferation of BC cells through inactivation of the PI3K/AKT
signaling pathway
To further confirm the mechanism underlying the
effects of MTHFD2 on the proliferation of BC cells, the total and
p-levels of PI3K and AKT proteins were detected by western blot
analysis, and 740Y-P (an agonist of PI3K) was used to stimulate
this signaling pathway. It was observed that the expression levels
of p-PI3K and p-AKT were significantly decreased after silencing
MTHFD2 in T24 cells, whereas no marked differences in total PI3K
and AKT were detected, which resulted in the decreased ratio of
p-PI3K/PI3K and p-AKT/AKT (Fig. 6A
and B). By contrast, when T24-shRNA2 cells were treated with
740Y-P, the expression levels of p-PI3K/PI3K and p-AKT/AKT were
increased in a dose-dependent manner (Fig. 6A). In addition, the change in
p-AKT/AKT was not significant (Fig.
6B), which may be due to the high degree of background
activation. Subsequently, a series of functional recovery
experiments using 740Y-P were conducted. The results demonstrated
that the proliferation and colony-forming abilities were inhibited
by silencing of MTHFD2 in T24-shRNA2 cells, whereas they were
restored following 740Y-P stimulation (Fig. 6C and D). Furthermore, the late
apoptosis induced by silencing of MTHFD2 was partially inhibited
following 740Y-P stimulation (Fig.
6E). The decrease in PD-L1 expression induced by silencing of
MTHFD2 in T24-shRNA2 cells was also partially restored following
740Y-P stimulation (Fig. 6F).
These results suggested that MTHFD2 functions in BC in part through
the PI3K/AKT signaling pathway.
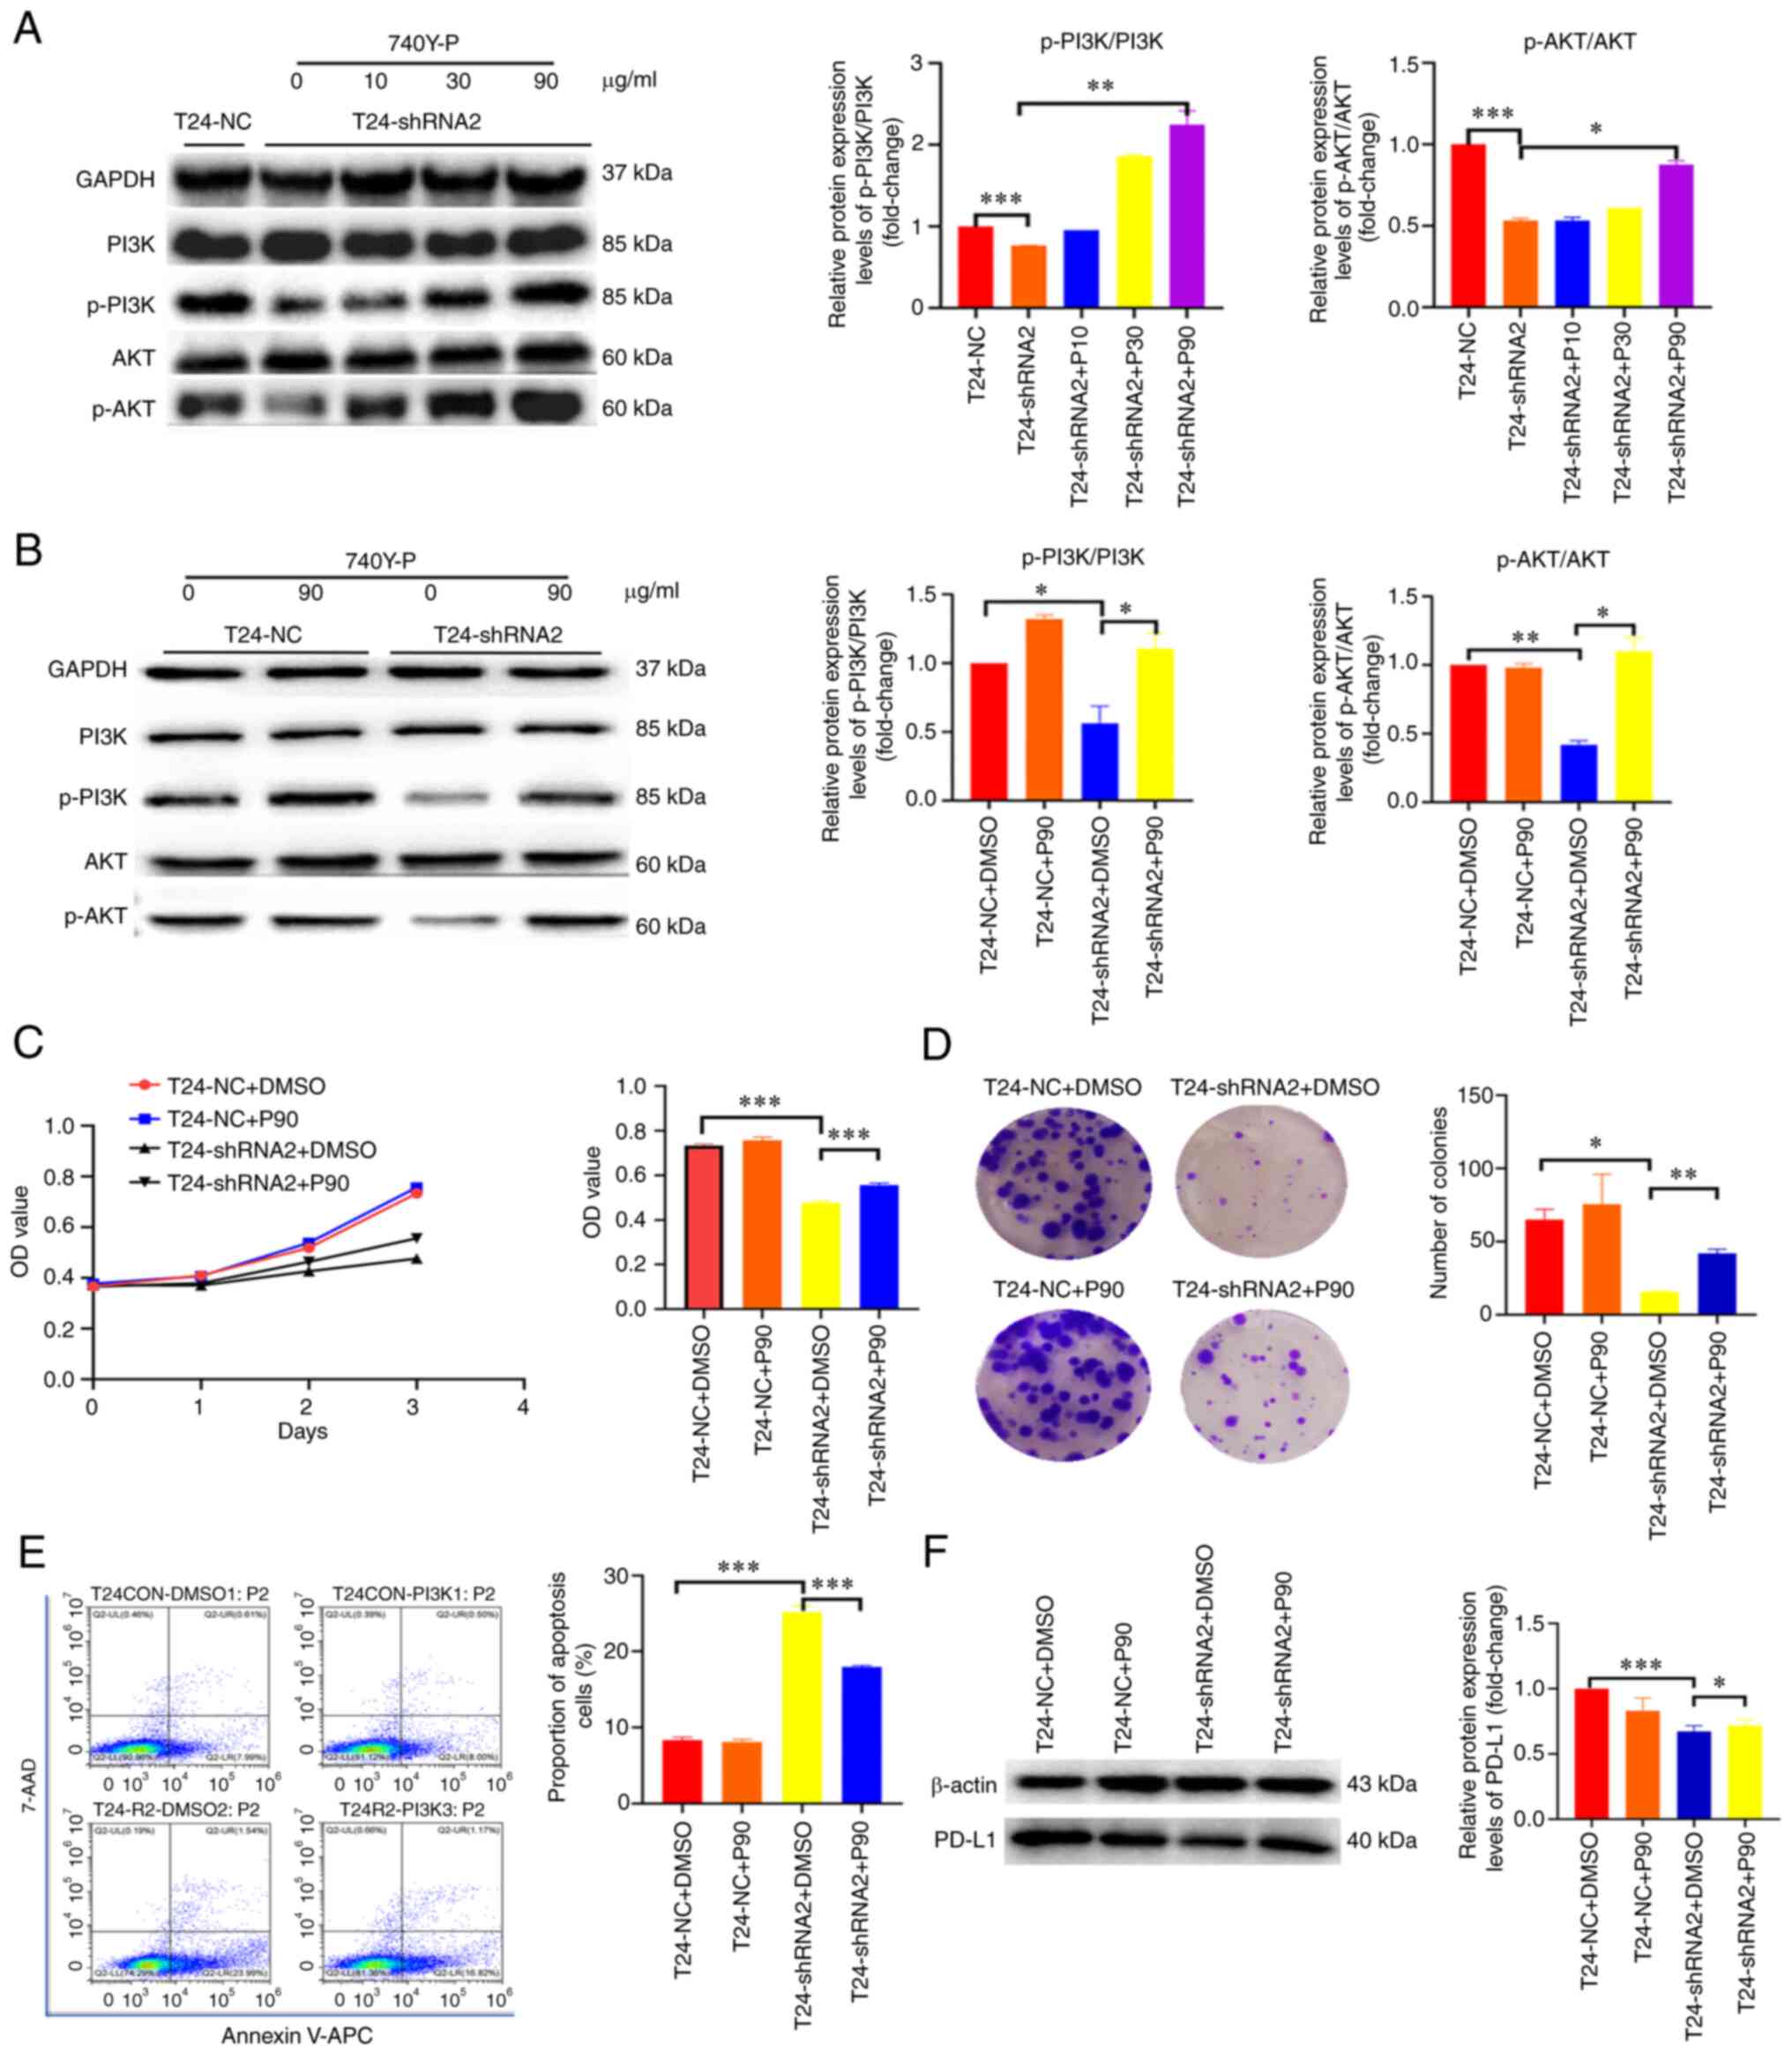 | Figure 6MTHFD2 functions through the PI3K/AKT
signaling pathway in bladder cancer. (A) Western blot analysis of
the activation status of PI3K/AKT signaling under different
concentrations of 740Y-P stimulation in T24-shRNA2 cells. (B)
Comparison of the activation status of PI3K/AKT signaling between
T24-shRNA2 and T24-NC cells with 740Y-P stimulation. Cell
proliferation analyzed by (C) Cell Counting Kit-8 and (D) colony
formation assay. The bar charts show the proliferative and
colony-forming capacity of cells at day 4 and 14, respectively. (E)
Cell apoptosis (sum of early and late apoptotic cells) was analyzed
by flow cytometry in T24-shRNA2 and T24-NC cells with 740Y-P
stimulation. (F) Western blot analysis of PD-L1 expression in
T24-shRNA2 and T24-NC cells with 740Y-P stimulation.
*P<0.05, **P<0.01,
***P<0.001. 7-AAD, 7-aminoactinomycin D; APC,
allophycocyanin; IHC, immunohistochemistry; NC, negative control;
OD, optical density; p-, phosphorylated; PD-L1, programmed
death-ligand 1; shRNA, short hairpin RNA. |
MTHFD2 may be an effective indicator for
chemotherapy and targeted therapy sensitivity of BC
The association between MTHFD2 expression and
multiple drug sensitivity (IC50) in BC was predicted
using the GDSC database. These drugs analyzed fall into two main
categories: i) Those recommended in clinical guidelines for
conventional chemotherapy and ii) those targeting the PI3K/AKT
signaling pathway. As shown in Fig.
7, there was a negative correlation between MTHFD2 expression
and the IC50 of conventional chemotherapy drugs,
including doxorubicin (r=−0.32; P=2.33×10⁻¹¹; Fig. 7A), cisplatin (r=−0.48;
P=7.39×10⁻²⁵; Fig.
7B), methotrexate (r=−0.41; P=1.68×10⁻¹⁷; Fig. 7C), mitomycin C (r=−0.13; P=0.012;
Fig. 7D), 5-fluorouracil
(r=−0.36; P=6.98×10⁻¹⁴; Fig. 7E), camptothecin (r=−0.44;
P=4.35×10⁻²¹; Fig.
7F), vinblastine (r=−0.48; P=4.75×10⁻²⁵; Fig. 7G) and gemcitabine (r=−0.43;
P=2.04×10⁻¹⁹; Fig.
7H). However, the correlations with doxorubicin, mitomycin C
and 5-fluorouracil were weak. There was also a weak negative
correlation between MTHFD2 expression and the IC50 of
drugs that target the PI3K/AKT signaling pathway, including
A.443554 (r=−0.33; P=1.73×10⁻¹¹; Fig. 7I), PF.4708671 (r=−0.28;
P=8.75×10⁻⁹; Fig. 7J),
AZD6482 (r=−0.21; P=1.51×10⁻⁵; Fig. 7K), TGX221 (r=−0.15; P=0.002;
Fig. 7L), PIK-93 (r=−0.20;
P=4.53×10⁻⁵; Fig. 7M)
and YM201636 (r=−0.18; P=2.78×10⁻⁴; Fig. 7O), while a positive correlation
was observed with the AKT inhibitor VIII (r=−0.40;
P=6.5×10⁻¹⁷; Fig. 7N).
A negative correlation between MTHFD2 expression and drug
sensitivity suggested that MTHFD2 may be an effective indicator for
chemotherapy and targeted therapy sensitivity of BC.
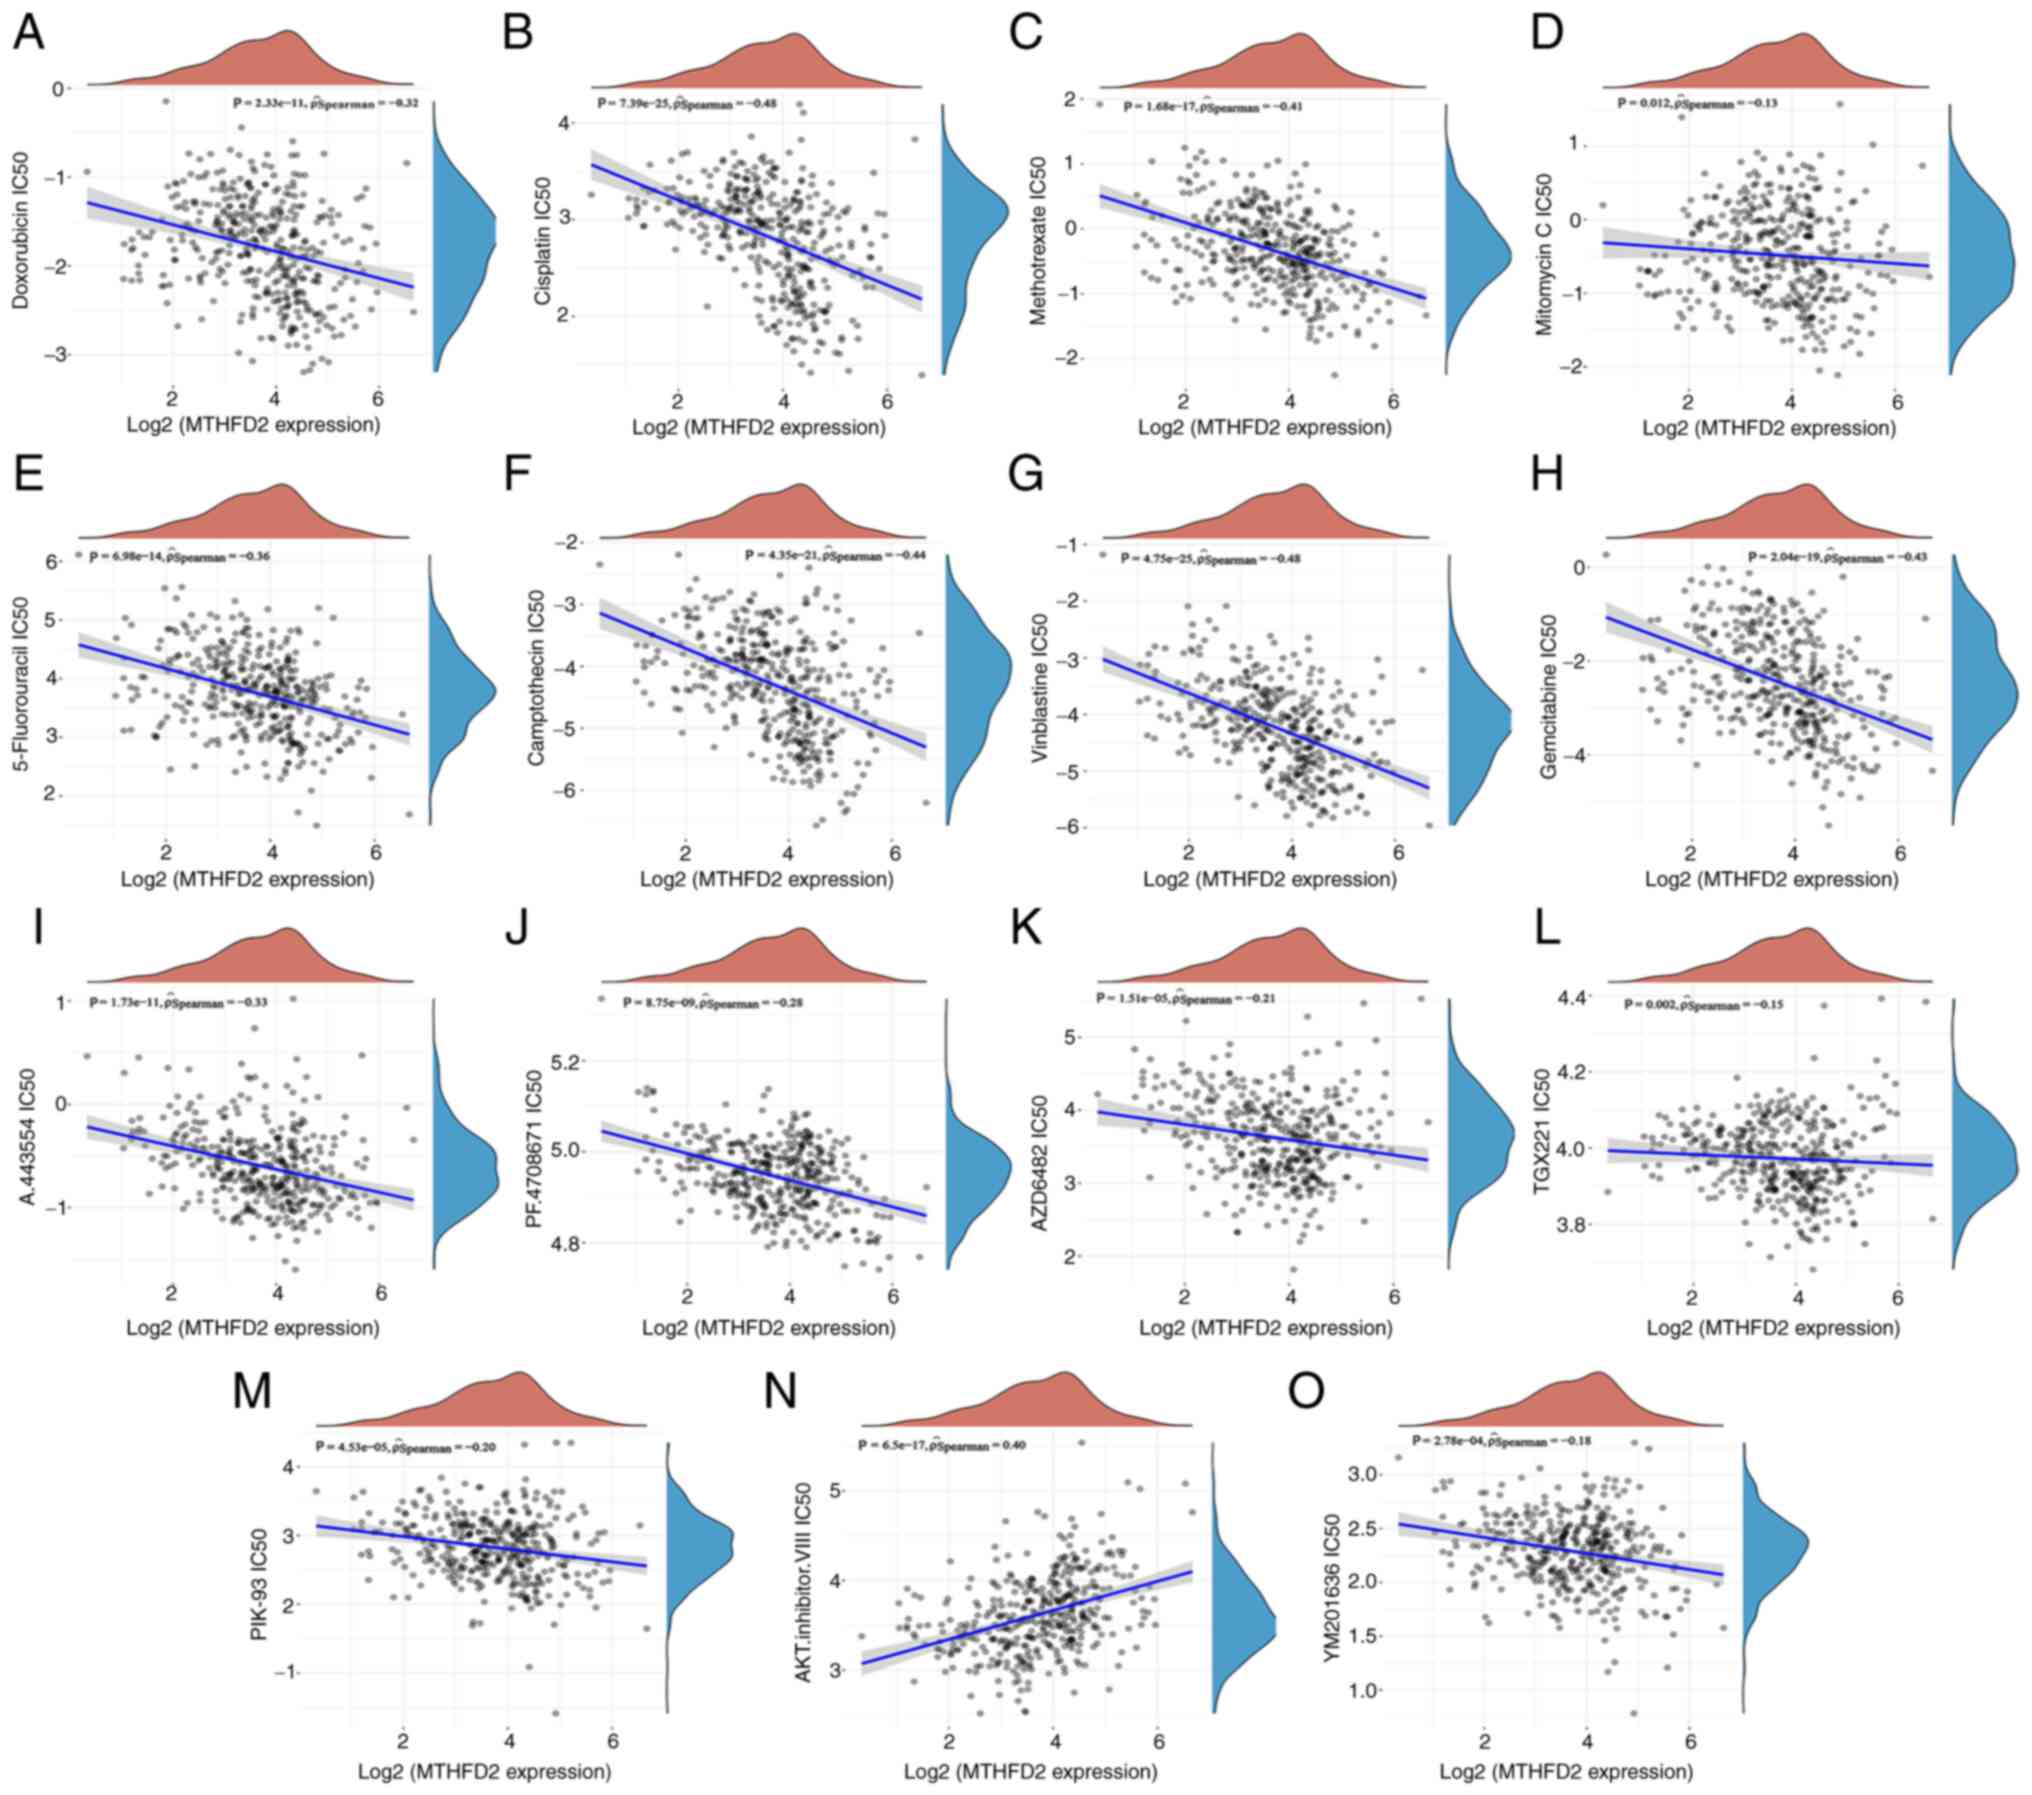 | Figure 7Prediction of association between
MTHFD2 expression and drug sensitivity in GDSC. The correlation
between MTHFD2 expression and the IC50 of conventional
chemotherapy drugs, including (A) doxorubicin, (B) cisplatin, (C)
methotrexate, (D) mitomycin C, (E) 5-fluorouracil, (F)
camptothecin, (G) vinblastine and (H) gemcitabine, and PI3K/AKT
pathway targeting drugs, including (I) A.443554, (J) PF.4708671,
(K) AZD6482, (L) TGX221, (M) PIK-93, (N) AKT.inhibitor.VIII and (O)
YM201636. IC50, half maximal inhibitory concentration;
MTHFD2, methylenetetrahydrofolate dehydrogenase 2. |
Discussion
The treatment of muscle-invasive and metastatic BC
has become a focus of research attention, because of its high
recurrence and mortality rates. For muscle-invasive BC, radical
cystectomy with lymph node dissection remains the recommended
treatment. For metastatic BC, cisplatin-based chemotherapy remains
the first choice. Perioperative immunotherapy can be offered in a
clinical trial setting (3). In
the case of distant metastasis, the 5-year survival rate has been
reported to be reduced to ~10.2% and the mortality rate has not
improved (27). This may be due
to the lack of specific therapeutic targets for BC (28). Therefore, it is necessary to
identify personalized and precise treatment methods for BC,
including exploring the molecular mechanism and identifying novel
targets for the treatment of BC (29).
The present study used a combination of
bioinformatics analysis and experimental validation to
systematically investigate the expression, function and molecular
mechanisms involved in the action of MTHFD2 in BC, and analyzed the
association between its expression and patient prognosis and immune
infiltration, with a focus on its association with PD-L1. Through
analysis of public database-derived expression data and
experimental validation, the present study confirmed the specific
upregulation of MTHFD2 expression and its association with poor
prognosis in BC, which is consistent with its expression in a
variety of tumors (9-13), including BC in other studies
(17,18). Unlike other bioinformatics
reports, the current study not only performed bioinformatics
analysis of data in public databases, but also validated the
results with commercial TMAs and patient samples collected at our
hospital, which ensures the reliability of the conclusions.
In a preclinical experiment (17), MTHFD2 was revealed to be
upregulated in patients with metastatic urothelial cancer and
Mariathasan et al (30)
reported that advanced BC had a good response to an anti-PD-L1
agent (atezolizumab). Therefore, the present study evaluated the
association between MTHFD2 and biomarkers of immune checkpoint
therapy. The correlation between MTHFD2 and immune infiltration
level, TMB, immune checkpoint molecules and TME were investigated.
Notably, MTHFD2 was significantly correlated with all of these
markers, suggesting its potential as a new marker for immune
checkpoint therapy. The present study also identified certain
differences in the immune cell association results between TIMER
and CIBERSORT in immune cell infiltration analysis. This may be due
to the difference in the design of the two algorithms; however, it
does not affect the conclusion that MTHFD2 is highly associated
with immune cell infiltration in BC.
As one of the key enzymes involved in folate
metabolism, MTHFD2 serves a key role in metabolic reprogramming
(31), which fulfills the
cellular bioenergetic and biosynthetic needs that occur in both
cancer and immune cells inside the tumor mass, and may influence
their interaction (32). MTHFD2
has been reported to be a metabolic checkpoint that controls the
fate and function of effector and regulatory T cells (33). Therefore, mechanistically, the
involvement of MTHFD2 in tumor immunity is understandable.
The association between MTHFD2 and PD-L1 was also
investigated in the present study, and it was revealed that MTHFD2
was positively correlated with PD-L1 expression in BC tissues, and
knockdown of MTHFD2 in BC cells resulted in the downregulation of
PD-L1 expression. In a subsequent mechanistic analysis, it was
demonstrated that MTHFD2 regulated PD-L1 expression through the
PI3K/AKT signaling pathway. This finding was consistent with a
recent report in pancreatic cancer (34).
The current study also predicted the association
between MTHFD2 and chemotherapeutic drug sensitivity using the GDSC
database. In addition, MTHFD2 expression was also correlated with
the IC50 of various PI3K/AKT signaling pathway-targeting
drugs, which was consistent with the results of mechanistic
analysis.
There are certain limitations in the present study.
First, due to the small number of TMA and self-sampled cases,
analyses such as Cox regression may be largely affected by bias.
Second, due to financial and time constraints, the mechanism by
which MTHFD2 induces immune escape in bladder cancer via regulating
immune-related molecules has not been determined, and it is our
intention to investigate it in depth in subsequent studies.
In conclusion, the current study used a combination
of bioinformatics analysis and experimental validation to
investigate the expression, function and molecular mechanisms of
MTHFD2 in BC, and analyzed the association between its expression
and patient prognosis and immune infiltration, with a focus on its
association with PD-L1. The present findings suggested that MTHFD2
could be a promising marker and therapeutic target of chemotherapy
and immunotherapy for BC.
Supplementary Data
Availability of data and materials
The RNA-seq data generated and/or analyzed during
the current study are available in the Gene Expression Omnibus
repository under accession number GSE217785 (https://www.ncbi.nlm.nih.gov/geo/query/acc.cgi?acc=GSE217785).
All other datasets used and/or analyzed during the current study
are available from the corresponding author on reasonable
request.
Authors' contributions
BF and WZ designed the project and revised the
manuscript. XD and XL performed the experiments, collected the data
and wrote the manuscript. JL and BH assisted with the experiments
and analyzed the data. XD and XL confirm the authenticity of all
the raw data. All authors read and approved the final
manuscript.
Ethics approval and consent to
participate
The present study was approved by the Research
Ethics Committee of the First Affiliated Hospital of Nanchang
University [approval no. (2021)51] and the Animal Care and Use
Committees of Nanchang University [institutional approval number
for lab animal studies: SYXK (Gan) 2015-0001] and were performed in
accordance with the ethical standards laid down in The Declaration
of Helsinki. The present study was conducted with written informed
consent from all of the patients.
Patient consent for publication
Not applicable.
Competing interests
The authors declare that they have no competing
interests.
Acknowledgments
The authors would like to thank Professor Weidong
Li and Professor Xiaoyuan Xu for their help in the process of
experimental design and operation in the Jiangxi Provincial Key Lab
of System Biomedicine (Jiangxi, China).
Funding
This study was supported by the National Natural Science
Foundation of P.R. China (grant nos. 82260511, 81960512 and
81760457), Jiangxi Provincial 'Double Thousand Plan' Fund Project
(grant no. jxsq2019201027), the Key Project of Natural Science
Foundation of Jiangxi Province (grant no. 20212ACB206013), and the
Youth Project of Natural Science Foundation of Jiangxi Province
(grant no. 20212BAB216037).
References
|
1
|
Sung H, Ferlay J, Siegel RL, Laversanne M,
Soerjomataram I, Jemal A and Bray F: Global cancer statistics 2020:
GLOBOCAN estimates of incidence and mortality worldwide for 36
cancers in 185 countries. CA Cancer J Clin. 71:209–249. 2021.
View Article : Google Scholar : PubMed/NCBI
|
|
2
|
Schmitz-Drager BJ, Droller M, Lokeshwar
VB, Lotan Y, Hudson MA, van Rhijn BW, Marberger MJ, Fradet Y,
Hemstreet GP, Malmstrom PU, et al: Molecular markers for bladder
cancer screening, early diagnosis, and surveillance: The WHO/ICUD
consensus. Urol Int. 94:1–24. 2015. View Article : Google Scholar
|
|
3
|
Witjes JA, Bruins HM, Cathomas R, Compérat
EM, Cowan NC, Gakis G, Hernández V, Espinós EL, Lorch A, Neuzillet
Y, et al: European association of urology guidelines on
muscle-invasive and metastatic bladder cancer: Summary of the 2020
guidelines. Eur Urol. 79:82–104. 2021. View Article : Google Scholar
|
|
4
|
Lopez-Beltran A, Cimadamore A, Blanca A,
Massari F, Vau N, Scarpelli M, Cheng L and Montironi R: Immune
checkpoint inhibitors for the treatment of bladder cancer. Cancers
(Basel). 13:1312021. View Article : Google Scholar : PubMed/NCBI
|
|
5
|
Balar AV, Galsky MD, Rosenberg JE, Powles
T, Petrylak DP, Bellmunt J, Loriot Y, Necchi A, Hoffman-Censits J,
Perez-Gracia JL, et al: Atezolizumab as first-line treatment in
cisplatin-ineligible patients with locally advanced and metastatic
urothelial carcinoma: A single-arm, multicentre, phase 2 trial.
Lancet. 389:67–76. 2017. View Article : Google Scholar
|
|
6
|
Stenehjem DD, Tran D, Nkrumah MA and Gupta
S: PD1/PDL1 inhibitors for the treatment of advanced urothelial
bladder cancer. Onco Targets Ther. 11:5973–5989. 2018. View Article : Google Scholar : PubMed/NCBI
|
|
7
|
Mejia NR and MacKenzie RE: NAD-dependent
methylenetetrahydrofolate dehydrogenase is expressed by immortal
cells. J Biol Chem. 260:14616–14620. 1985. View Article : Google Scholar : PubMed/NCBI
|
|
8
|
Nilsson R, Jain M, Madhusudhan N, Sheppard
NG, Strittmatter L, Kampf C, Huang J, Asplund A and Mootha VK:
Metabolic enzyme expression highlights a key role for MTHFD2 and
the mitochondrial folate pathway in cancer. Nat Commun. 5:31282014.
View Article : Google Scholar : PubMed/NCBI
|
|
9
|
Cui X, Su H, Yang J, Wu X, Huo K, Jing X
and Zhang S: Up-regulation of MTHFD2 is associated with
clinicopathological characteristics and poor survival in ovarian
cancer, possibly by regulating MOB1A signaling. J Ovarian Res.
15:232022. View Article : Google Scholar : PubMed/NCBI
|
|
10
|
Ju HQ, Lu YX, Chen DL, Zuo ZX, Liu ZX, Wu
QN, Mo HY, Wang ZX, Wang DS, Pu HY, et al: Modulation of redox
homeostasis by inhibition of MTHFD2 in colorectal cancer:
Mechanisms and therapeutic implications. J Natl Cancer Inst.
111:584–596. 2019. View Article : Google Scholar :
|
|
11
|
Lin H, Huang B, Wang H, Liu X, Hong Y, Qiu
S and Zheng J: MTHFD2 overexpression predicts poor prognosis in
renal cell carcinoma and is associated with cell proliferation and
vimentin-modulated migration and invasion. Cell Physiol Biochem.
51:991–1000. 2018. View Article : Google Scholar : PubMed/NCBI
|
|
12
|
Liu F, Liu Y, He C, Tao L, He X, Song H
and Zhang G: Increased MTHFD2 expression is associated with poor
prognosis in breast cancer. Tumour Biol. 35:8685–8690. 2014.
View Article : Google Scholar : PubMed/NCBI
|
|
13
|
Liu X, Huang Y, Jiang C, Ou H, Guo B, Liao
H, Li X and Yang D: Methylenetetrahydrofolate dehydrogenase 2
overexpression is associated with tumor aggressiveness and poor
prognosis in hepatocellular carcinoma. Dig Liver Dis. 48:953–960.
2016. View Article : Google Scholar : PubMed/NCBI
|
|
14
|
Huang J, Qin Y, Lin C, Huang X and Zhang
F: MTHFD2 facilitates breast cancer cell proliferation via the AKT
signaling pathway. Exp Ther Med. 22:7032021. View Article : Google Scholar : PubMed/NCBI
|
|
15
|
Wei Y, Liu P, Li Q, Du J, Chen Y, Wang Y,
Shi H, Wang Y, Zhang H, Xue W, et al: The effect of MTHFD2 on the
proliferation and migration of colorectal cancer cell lines. Onco
Targets Ther. 12:6361–6370. 2019. View Article : Google Scholar : PubMed/NCBI
|
|
16
|
Shi Y, Xu Y, Yao J, Yan C, Su H, Zhang X,
Chen E and Ying K: MTHFD2 promotes tumorigenesis and metastasis in
lung adenocarcinoma by regulating AKT/GSK-3β/β-catenin signalling.
J Cell Mol Med. 25:7013–7027. 2021. View Article : Google Scholar : PubMed/NCBI
|
|
17
|
Liu X, Liu S, Piao C, Zhang Z, Zhang X,
Jiang Y and Kong C: Non-metabolic function of MTHFD2 activates CDK2
in bladder cancer. Cancer Sci. 112:4909–4919. 2021. View Article : Google Scholar : PubMed/NCBI
|
|
18
|
Zhu L, Liu X, Zhang W, Hu H, Wang Q and Xu
K: MTHFD2 is a potential oncogene for its strong association with
poor prognosis and high level of immune infiltrates in urothelial
carcinomas of bladder. BMC Cancer. 22:5562022. View Article : Google Scholar : PubMed/NCBI
|
|
19
|
Dillies MA, Rau A, Aubert J,
Hennequet-Antier C, Jeanmougin M, Servant N, Keime C, Marot G,
Castel D, Estelle J, et al: A comprehensive evaluation of
normalization methods for Illumina high-throughput RNA sequencing
data analysis. Brief Bioinform. 14:671–683. 2013. View Article : Google Scholar
|
|
20
|
Li T, Fan J, Wang B, Traugh N, Chen Q, Liu
JS, Li B and Liu XS: TIMER: A web server for comprehensive analysis
of tumor-infiltrating immune cells. Cancer Res. 77:e108–e110. 2017.
View Article : Google Scholar : PubMed/NCBI
|
|
21
|
Shannon P, Markiel A, Ozier O, Baliga NS,
Wang JT, Ramage D, Amin N, Schwikowski B and Ideker T: Cytoscape: A
software environment for integrated models of biomolecular
interaction networks. Genome Res. 13:2498–2504. 2003. View Article : Google Scholar : PubMed/NCBI
|
|
22
|
Liu X, Xu X, Deng W, Huang M, Wu Y, Zhou
Z, Zhu K, Wang Y, Cheng X, Zhou X, et al: CCL18 enhances migration,
invasion and EMT by binding CCR8 in bladder cancer cells. Mol Med
Rep. 19:1678–1686. 2019.
|
|
23
|
Livak KJ and Schmittgen TD: Analysis of
relative gene expression data using real-time quantitative PCR and
the 2(-Delta Delta C(T)) method. Methods. 25:402–408. 2001.
View Article : Google Scholar
|
|
24
|
Kim D, Langmead B and Salzberg SL: HISAT:
A fast spliced aligner with low memory requirements. Nat Methods.
12:357–360. 2015. View Article : Google Scholar : PubMed/NCBI
|
|
25
|
Anders S, Pyl PT and Huber W: HTSeq-a
python framework to work with high-throughput sequencing data.
Bioinformatics. 31:166–169. 2015. View Article : Google Scholar
|
|
26
|
Li Y, Ma Y, Wu Z, Zeng F, Song B, Zhang Y,
Li J, Lui S and Wu M: Tumor mutational burden predicting the
efficacy of immune checkpoint inhibitors in colorectal cancer: A
systematic review and meta-analysis. Front Immunol. 12:7514072021.
View Article : Google Scholar : PubMed/NCBI
|
|
27
|
Grayson M: Bladder cancer. Nature.
551:S332017. View Article : Google Scholar : PubMed/NCBI
|
|
28
|
Hurst CD, Alder O, Platt FM, Droop A,
Stead LF, Burns JE, Burghel GJ, Jain S, Klimczak LJ, Lindsay H, et
al: Genomic subtypes of non-invasive bladder cancer with distinct
metabolic profile and female gender bias in KDM6A mutation
frequency. Cancer Cell. 32:701–715.e707. 2017. View Article : Google Scholar : PubMed/NCBI
|
|
29
|
Kobayashi T, Owczarek TB, McKiernan JM and
Abate-Shen C: Modelling bladder cancer in mice: Opportunities and
challenges. Nat Rev Cancer. 15:42–54. 2015. View Article : Google Scholar :
|
|
30
|
Mariathasan S, Turley SJ, Nickles D,
Castiglioni A, Yuen K, Wang Y, Kadel EE III, Koeppen H, Astarita
JL, Cubas R, et al: TGFβ attenuates tumour response to PD-L1
blockade by contributing to exclusion of T cells. Nature.
554:544–548. 2018. View Article : Google Scholar : PubMed/NCBI
|
|
31
|
Ducker GS, Chen L, Morscher RJ,
Ghergurovich JM, Esposito M, Teng X, Kang Y and Rabinowitz JD:
Reversal of cytosolic one-carbon flux compensates for loss of the
mitochondrial folate pathway. Cell Metab. 23:1140–1153. 2016.
View Article : Google Scholar : PubMed/NCBI
|
|
32
|
Singer K, Cheng WC, Kreutz M, Ho PC and
Siska PJ: Immunometabolism in cancer at a glance. Dis Model Mech.
11:dmm0342722018. View Article : Google Scholar : PubMed/NCBI
|
|
33
|
Sugiura A, Andrejeva G, Voss K, Heintzman
DR, Xu X, Madden MZ, Ye X, Beier KL, Chowdhury NU, Wolf MM, et al:
MTHFD2 is a metabolic checkpoint controlling effector and
regulatory T cell fate and function. Immunity. 55:65–81.e69. 2022.
View Article : Google Scholar :
|
|
34
|
Shang M, Yang H, Yang R, Chen T, Fu Y, Li
Y, Fang X, Zhang K, Zhang J, Li H, et al: The folate cycle enzyme
MTHFD2 induces cancer immune evasion through PD-L1 up-regulation.
Nat Commun. 12:19402021. View Article : Google Scholar : PubMed/NCBI
|