Introduction
According to the World Cancer Report 2020, ovarian
cancer (OV) represents the eighth most common cancer affecting
females worldwide (1). Due to
difficult detection at the early stage, OV has a high fatality
rate, i.e., a 5-year survival rate of ~30%, and poor outcomes in
patients. Despite years of great breakthroughs in diagnosis and
treatment, OV remains the deadliest malignancy in females globally,
and its incidence and death rates generally increase with age
(1,2). OV presents a major therapeutic
challenge due to its high heterogeneity, aggressive nature and lack
of efficient targeted therapies (3). Furthermore, the pathogenesis of OV
is complex and requires a deeper understanding of genetics as well
as potentially modifiable risk factors such as circadian
rhythms.
A large number of organisms possess a biological
clock organizing oscillations in physiological and behavioral
events, which is referred to as circadian rhythms (4–6).
Circadian rhythms are generated by an intracellular clock mechanism
that is involved in long-term biological evolution, representing an
essential feature of life activity (7–9).
Emerging evidence suggests that circadian clock genes (CCGs) and
downstream effectors control multiple cancer-associated biological
events, including metabolism, inflammatory responses, DNA damage
repair and cell cycle (10).
Therefore, studying the association of CCG dysregulation with tumor
progression is critical for developing effective clinical
strategies. Of note, CCG dysregulation was indicated to be tightly
associated with carcinogenesis in multiple cancer types. In
females, disordered circadian rhythms resulting from unfavorable
work shifts or other stressors were observed to induce menstrual
disorders, as well as breast cancer and OV (11,12). Hence, an overall understanding of
CCGs may provide important insight into tumor biology and help
develop effective models for OV prognosis.
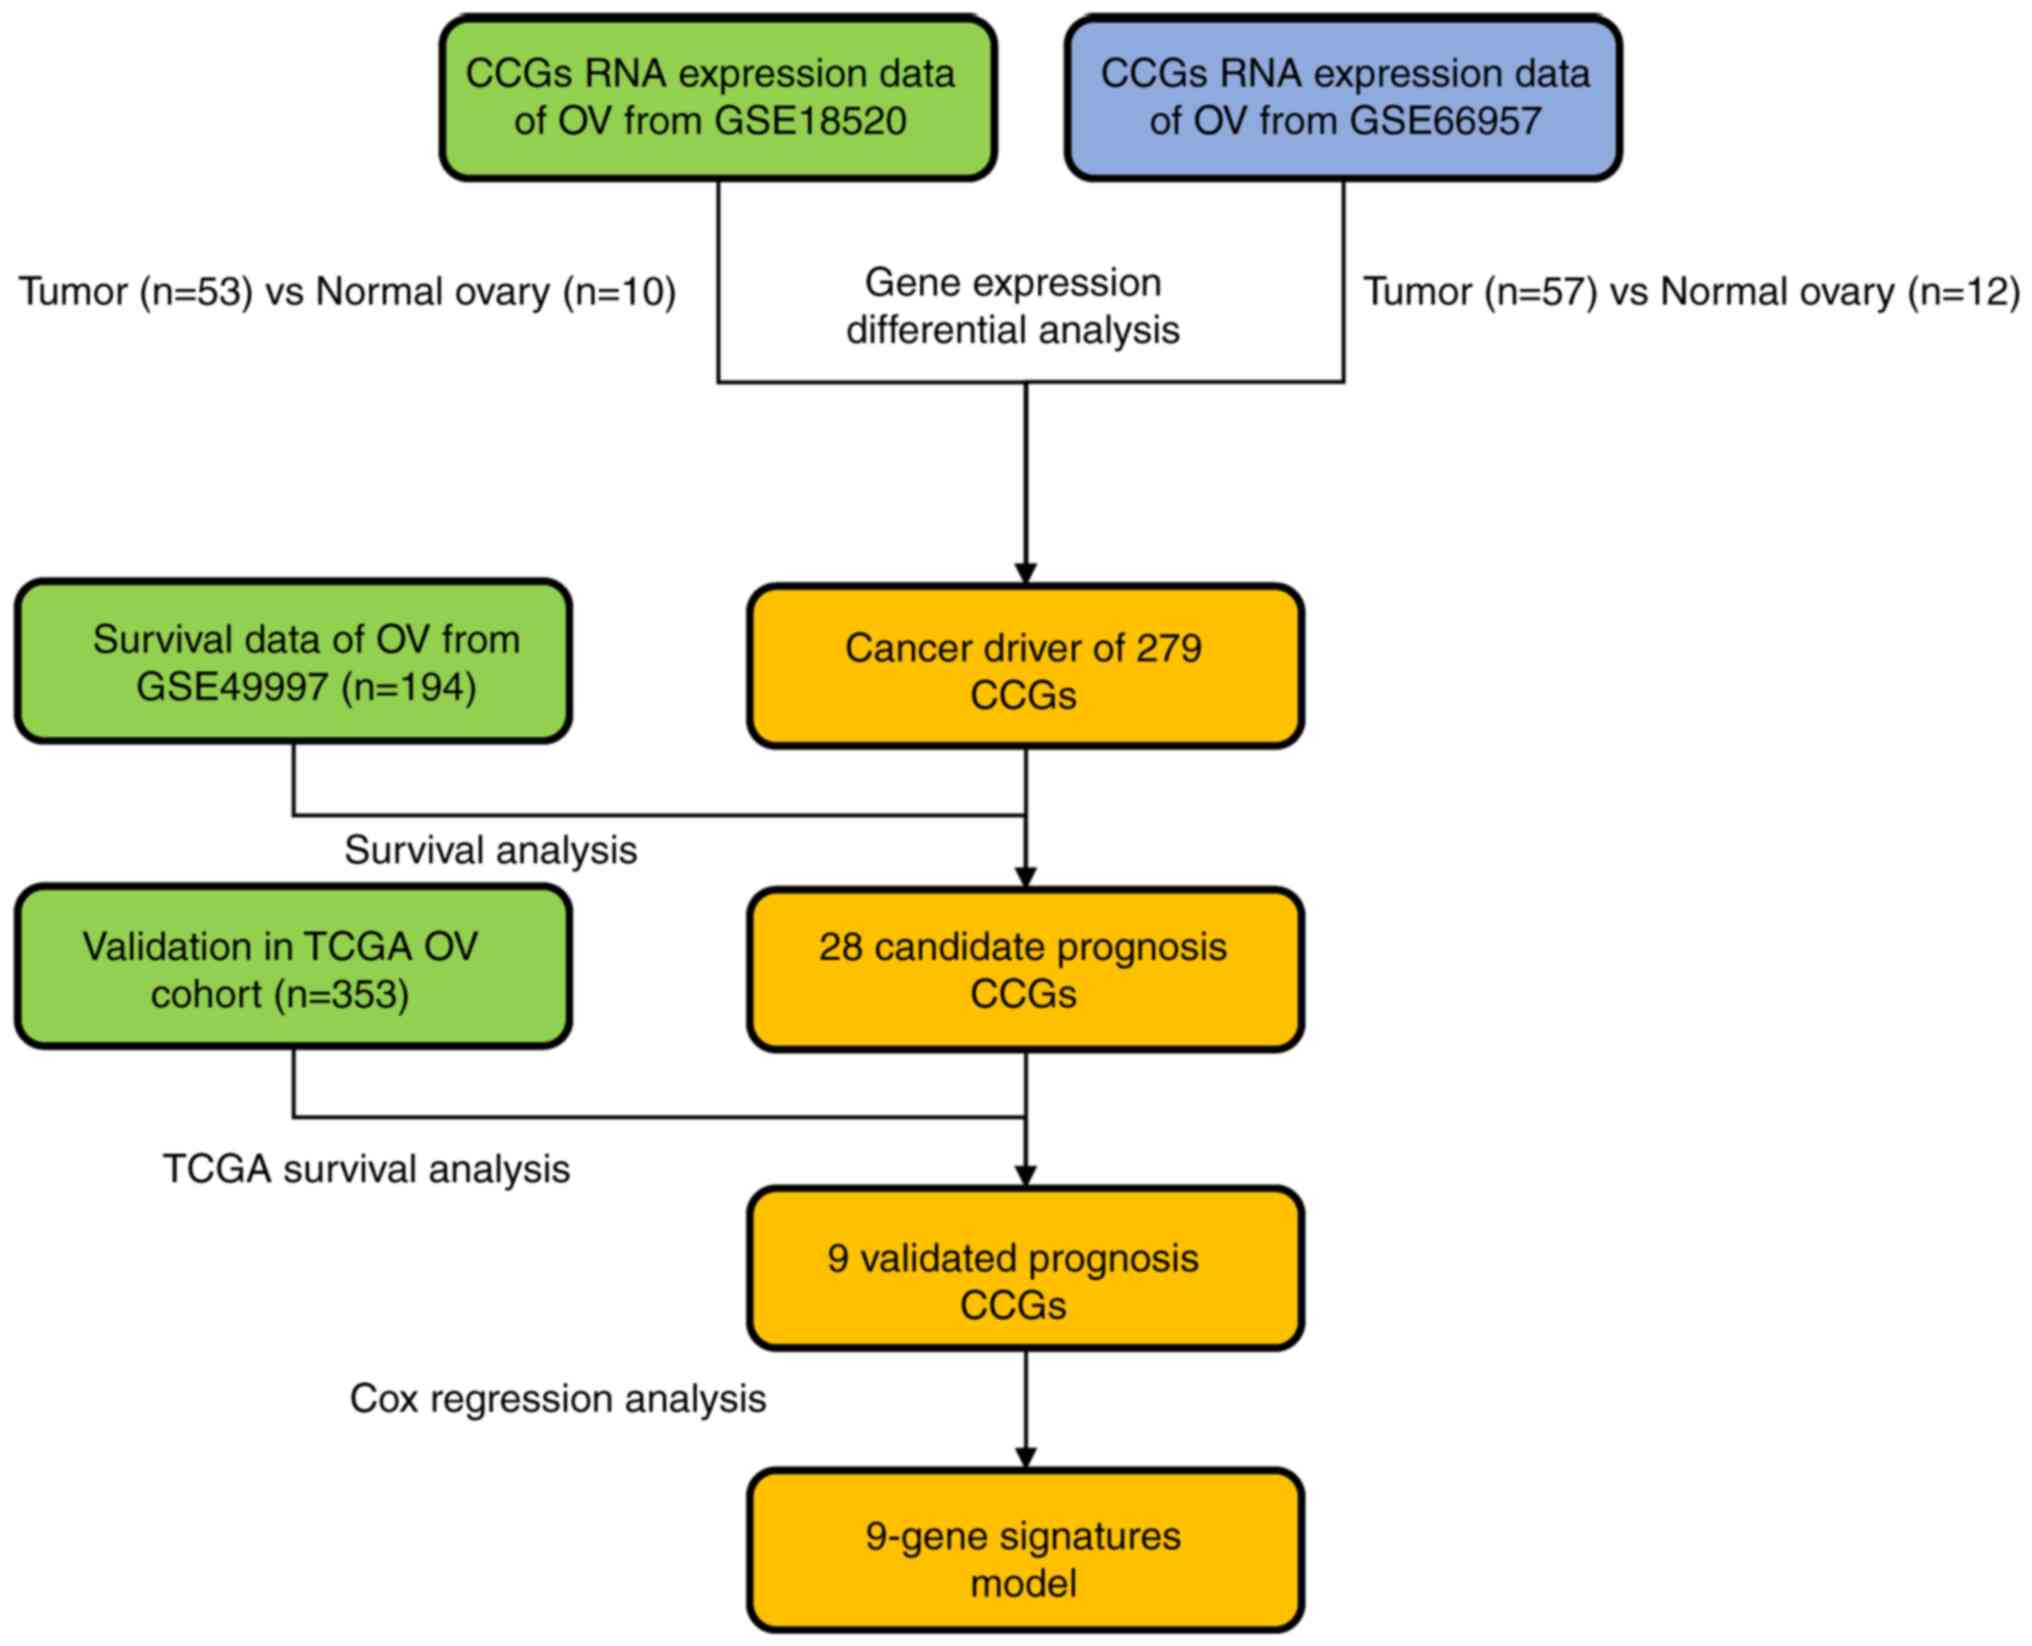
The present study was the first to utilize OV
cohorts from both the Cancer Genome Atlas (TCGA) and Gene
Expression Omnibus (GEO) databases to explore the association of
circadian clock aberrations resulting from imbalanced circadian
rhythm with OV to identify reliable circadian biomarkers and novel
predictive and therapeutic targets. First, CCGs that were able to
predict poor outcome in patients with OV were identified.
Subsequently, reticulon 2 (RTN2) gene expression was assessed in
both normal and OV tissues. A flow chart of the present study is
provided in Fig. 1.
Materials and methods
Data retrieval and curation
A total of 1,409 CCGs were retrieved from the
Circadian Gene DataBase (CGDB), which indicates alterations in mRNA
amounts of these CCGs confirmed by previously published reports by
reverse transcription-quantitative (RT-q)PCR, northern blot and
in situ hybridization (13). Subsequently, gene expression
profiles for 53 OV and 10 normal ovary tissue specimens were
retrieved from GEO (https://www.ncbi.nlm.nih.gov/geo; accession no.
GSE18520). Gene expression analysis was performed with the
Affymetrix Human Genome U133 Plus 2.0 Array (Affymetrix; Thermo
Fisher Scientific, Inc.). Raw data processing utilized the Robust
Multi-Array Average (RMA) method and the ‘Oligo’ package from
Bioconductor (http://www.bioconductor.org) for data normalization
and probe annotation. Another public OV dataset with 57 tumor and
12 normal tissue samples, GSE66957, obtained with the Rosetta/Merck
Human RSTA Custom Affymetrix 2.0 microarray, was downloaded. The
matrix data and GPL10379 files were utilized for generating
normalized data and annotated probes.
Analysis of CCG expression
The R package limma was utilized for differential
expression analysis of CCGs between OV and noncancerous tissue
specimens (14), and genes with
the P-value of the false discovery rate (FDR) <0.05 were defined
as differentially expressed. A Venn diagram containing four lists
of differentially expressed genes was drawn online (https://bioinfogp.cnb.csic.es/tools/venny/index.html)
to identify those genes that were overexpressed in these
datasets.
Survival analysis
The effects of CCGs on survival of patients with OV
were assessed in the GSE49997 dataset and validated in the TCGA OV
cohort. The whole gene expression profile data and associated OV
patient features were obtained from GEO and TCGA (https://cancergenome.nih.gov/). Kaplan-Meier curves
were established for assessing the associations of overall survival
(OS) with CCG expression levels using the log-rank test. The
optimal cutoff of the gene expression value was determined with the
survminer package (v0.4.6,https://github.com/kassambara/survminer/)
based on expression levels, survival time and survival status
(15).
Protein-protein interaction (PPI)
network construction
In total, 217,249 PPI pairs were retrieved from
Reactome (v.2014; http://www.reactome.org) (16), based on BioGrid, the Database of
Interacting Proteins (17), Human
Protein Reference Database (18),
I2D (19), IntACT (20) and MINT (21), in addition to gene co-expression
data generated by high-throughput techniques such as yeast
two-hybrid, mass spectrometry pull-down and DNA microarray assays
(22). A PPI network was
generated with Cytoscape (v.3.2.1; http://www.cytoscape.org) (23).
Pathway enrichment analysis for the
functional interaction network
Reactome FIViz was utilized in Cytoscape for pathway
analysis (24). Cell Map
(http://www.pathwaycommons.org/pc/dbSnapshot.do?snapshot_id=8),
Reactome (16), Kyoto
Encyclopedia of Genes and Genomes (25), Panther Pathways (26), NCI-Pathway Interaction Database
(NCI-PID) (27) and BioCarta
(http://www.biocarta.com/genes/index.asp) were used as
pathway annotation sources, with an FDR of 0.05 as the cut-off
criterion.
Construction of the prognostic
signature and calculation of the risk score
For the 9 validated prognostic CCGs, the Cox
proportional hazard regression model was used to construct
prognostic models using the GSE49997 cohort. An equation was
established for calculating risk score as follows: Risk
score=βULK1 × expressionULK1 +
βCRY2 × expressionCRY2 + βGAS7 ×
expressionGAS7 + βNPTXR ×
expressionNPTXR + βRTN2 ×
expressionRTN2 + βATF3 ×
expressionATF3 + βCSF3R ×
expressionCSF3R + βDAAM2 × expression
DAAM2 + βPPP1R15A × expression
PPP1R15A. β was an equation coefficient. Risk scores
were then determined for all patients in the TCGA OV cohort. With
the median risk score as the cutoff, the cases were assigned to the
high- and low-risk groups. OS times in both risk groups were
analyzed by the Kaplan-Meier method using the log-rank test for
comparison. The area under the curve for the survival receiver
operating characteristic (ROC) curve was determined with the
survival ROC function in R software for validating the performance
of the prognostic signature (28).
Patients and specimens
A total of 42 OV and 20 noncancerous tissue
specimens (from different subjects than the OV group; 8
paracancerous tissues and 12 ‘healthy’ control tissues) were
collected from patients enrolled at Ningbo First Hospital, Zhejiang
University School of Medicine (Ningbo, China) between January 2015
and December 2021. The demographic and clinicopathological
characteristics of the patients with OV are provided in Table SI. All subjects (patients with
and without OV) who had undergone surgery provided written informed
consent. OV samples were obtained from patients with no previous
chemotherapy or radiotherapy prior to surgery. After surgical
removal, tissue samples were frozen immediately in liquid nitrogen
and stored at −80°C. The present study was approved by the Research
Ethics Committee of Ningbo First Hospital (Ningbo, China; no.
2021-R210).
RT-qPCR
Freshly collected and then frozen tissue specimens
were used for total RNA extraction with TRIzol reagent (Invitrogen;
Thermo Fisher Scientific, Inc.). Samples of total RNA with a
260/280 nm absorption ratio between 1.8 and 2.0 were further
analyzed. cDNA was synthesized using a reverse transcription kit
(Takara Bio Inc.) and amplified using a SYBR qRT-PCR Kit (Takara
Bio, Inc.), as directed by the manufacturer. qPCR was performed in
a Cobas z480 real-time PCR system (Roche Diagnostics), the qPCR
reaction was performed at 95°C for 5 min, 60°C for 30 sec, followed
by 40 cycles at 95°C for 30 sec and 58°C for 30 sec (29). The 2−∆∆Cq method
(30) was employed for data
analysis. GAPDH was used as an internal control. The following
primers were used: RTN2 forward, 5′-GACCTGCTGTACTGGAAGGAC-3′ and
reverse, 5′-ACGGACACGATGCTAAAGTGC-3′; GAPDH forward,
5′-AGGTCGGTGTGAACGGATTTG-3′ and reverse,
5′-TGTAGACCATGTAGTTGAGGTCA-3′.
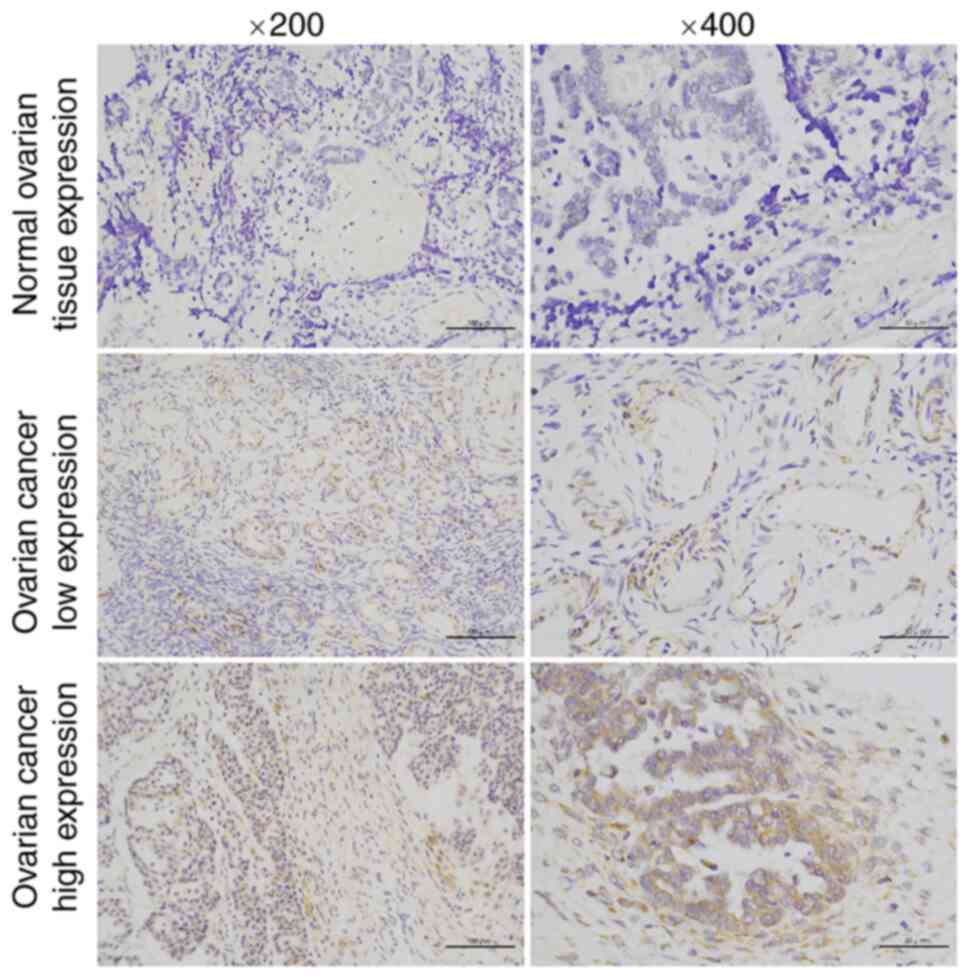
Immunohistochemistry (IHC)
IHC staining was carried out according to standard
procedures described in a previous report. Paraffin-embedded normal
ovarian tissue and OV tissue samples were routinely processed and
then incubated with rabbit primary antibodies against RTN2
overnight at 4°C (cat. no. 11168-1-AP; 1:200 dilution; Proteintech
Group, Inc.). After a 1-h incubation with HRP-linked anti-rabbit
secondary antibodies (cat. no. A0545; 1:4,000 dilution;
MilliporeSigma) at room temperature, the DAB reagent was utilized
for development, followed by hematoxylin counterstaining. A Leica
DM 2000 microscope (Leica Microsystems) was used for analysis.
Positive staining of RTN2 in tumor cells was assessed by IHC signal
intensity. Scoring was conducted according to the ratio and
intensity of positively stained cells: 0–5% scored 0; 6–35% scored
1; 36–70% scored 2; and >70% scored 3. According to the final
score of RTN2 expression, a sample was designated as having
low or high expression as follows: Low expression: Score 0/1; high
expression: Score 2/3.
Statistical analysis
R v3.6.1 was employed for data analysis.
Clinicopathological parameters in the high- and low-expression
groups were compared by the Student's t-, χ2- and
Fisher's exact tests, as appropriate. Univariate and multivariate
Cox regression analyses were performed for determining factors
independently predicting survival. P<0.05 was considered to
indicate statistical significance.
Results
Expression of CCGs in OV
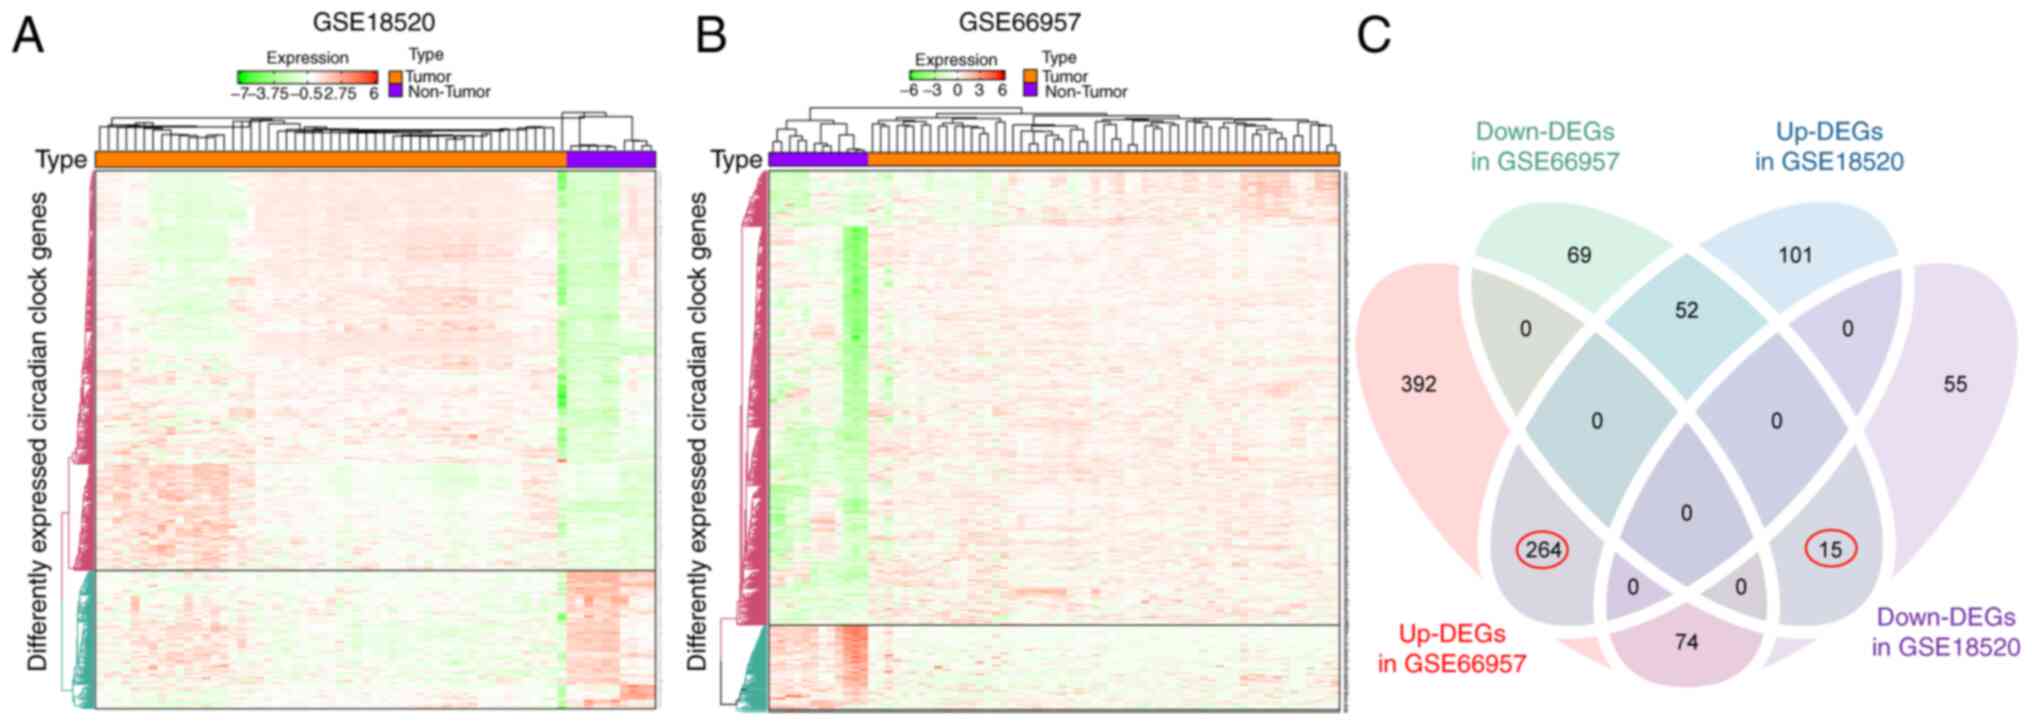
To assess the role of CCGs in OV, the gene
expression profiles of 53 OV tumor samples and 10 normal ovary
tissues from the GSE18520 dataset were compared and another public
OV dataset with 57 tumor and 12 normal tissue samples (GSE66957)
was examined. Heat maps (Fig. 2A and
B) revealed gene expression differences between the tumor and
non-tumor expression groups. Genes with the P-value of FDR <0.05
were considered to have differential expression. A total of 730 and
136 genes were upregulated and downregulated, respectively, in OV
specimens compared with normal specimens in GSE66957. Similarly,
417 and 144 genes were upregulated and downregulated, respectively,
in OV specimens compared with normal specimens in the GSE18520
dataset. Furthermore, Venn diagrams (Fig. 2C) revealed that in the two
datasets, 264 and 15 genes were commonly upregulated and
downregulated DEGs.
Hub CCGs
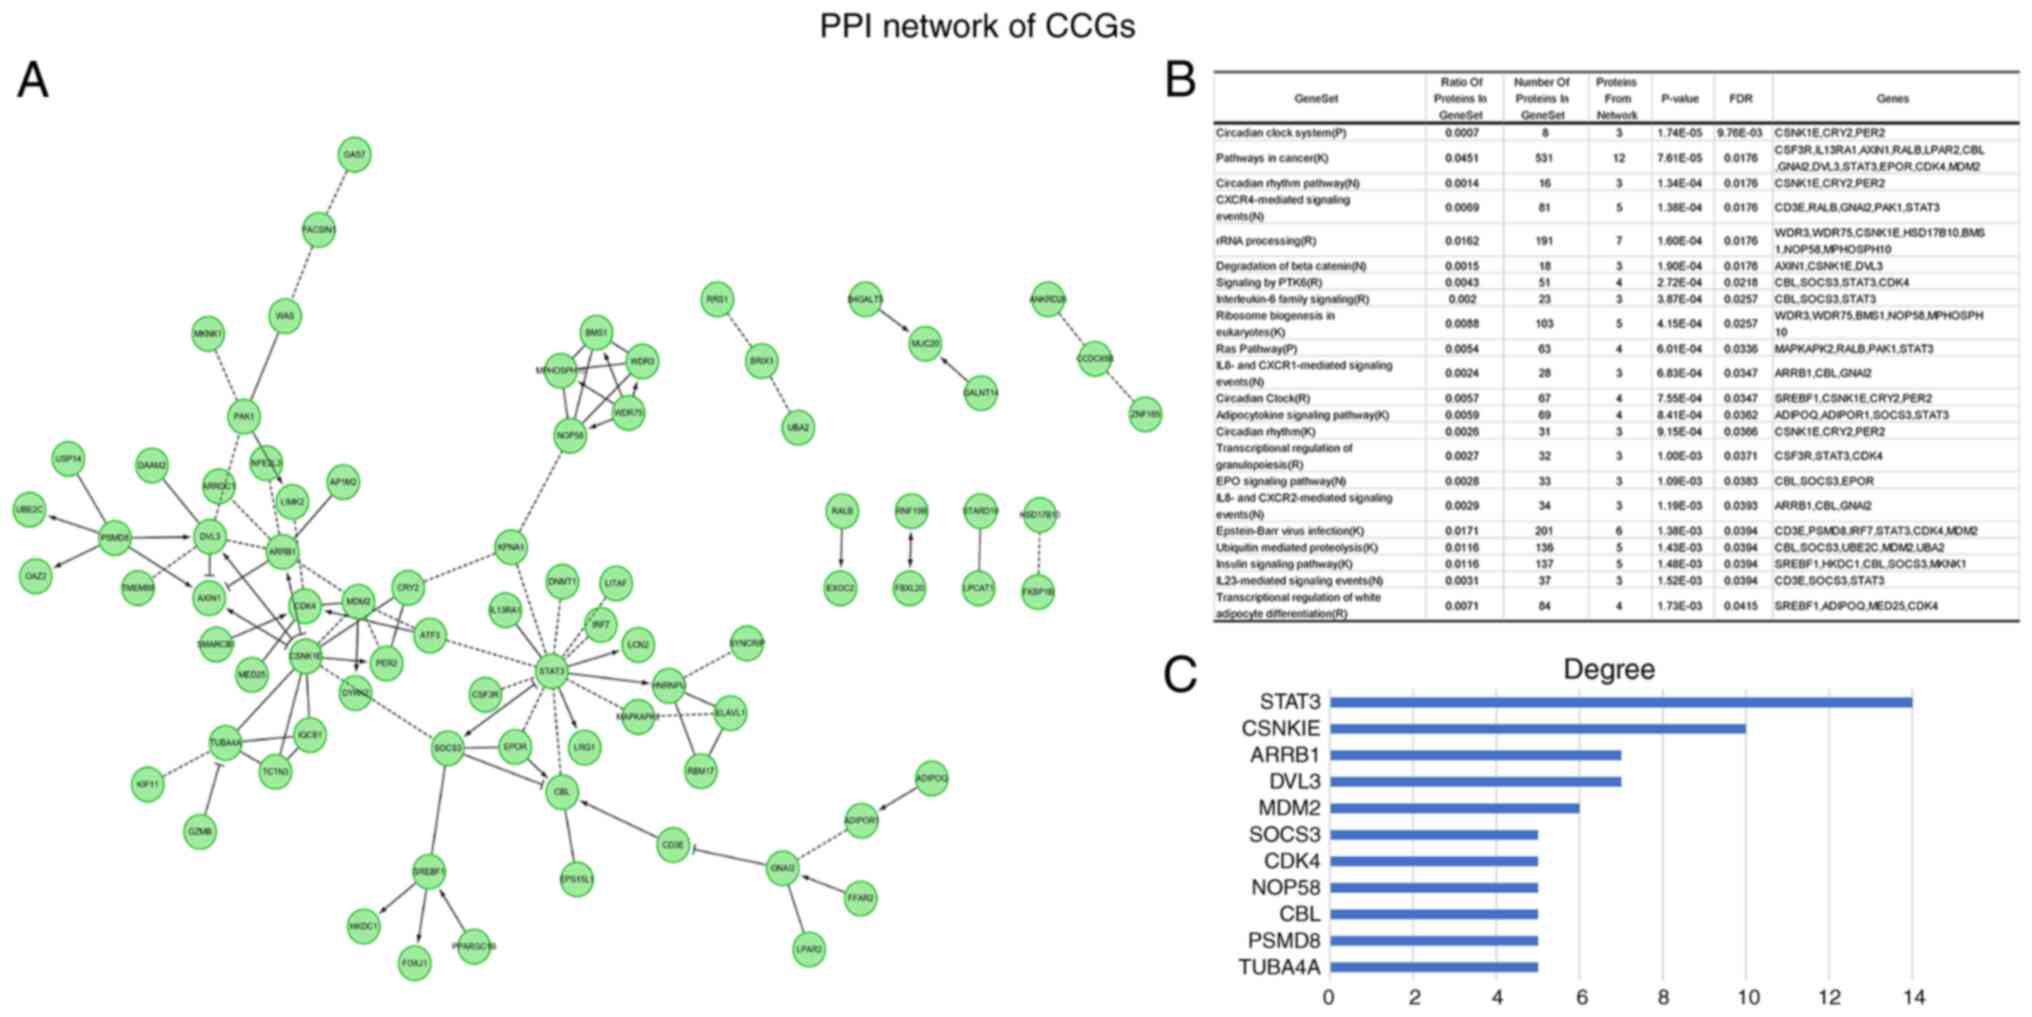
In order to identify CCGs with active participation
in OV carcinogenesis and progression, differentially expressed CCGs
with a significant association with patient outcomes (P<0.05)
were determined. PPI network analysis revealed hub genes in this
dataset (Fig. 3A). Functional
enrichment analysis indicated that the above genes were actively
involved in the pathways such as circadian rhythm, CXCR4-mediated
signaling events and rRNA processing (Fig. 3B). The hub genes were STAT3,
CSNKIE, ARRB1, DVL3, MDM2, SOCS3, CDK4, NOP58, CBL, PSMD8 and
TUBA4A (Fig. 3C). The above major
nodes were associated with other genes, suggesting they may be able
to affect the prognosis of OV.
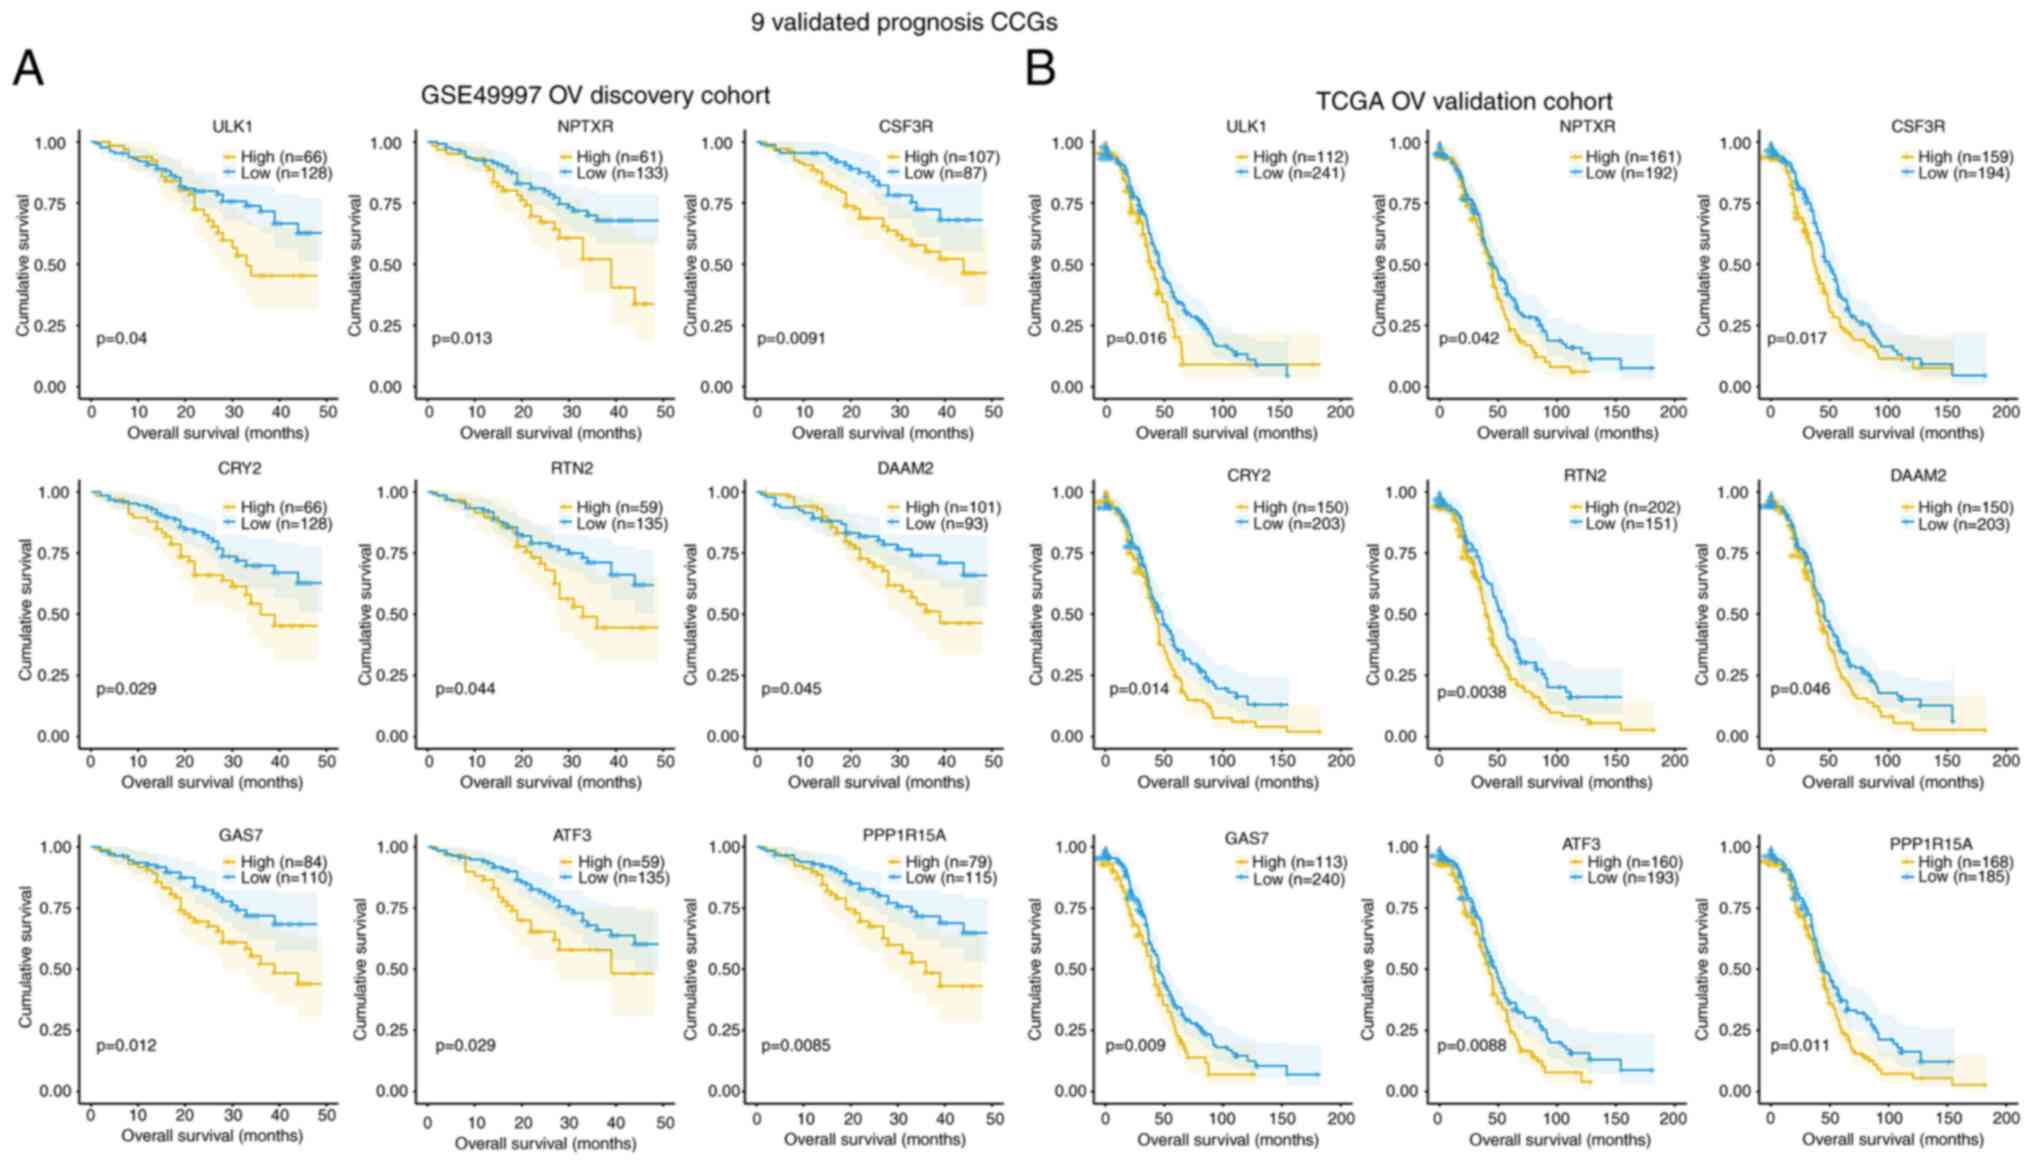
Association of CCGs with survival
In order to explore the prognostic value of
individual DEGs, the associations of CCGs with OS in OV cases in
the GSE49997 and TCGA databases were analyzed. A total of 9
validated prognostic CCGs were found in the GSE49997 OV discovery
cohort and TCGA OV validation cohort, all of which were
upregulated, with significant associations with reduced OS (months)
(log-rank P<0.05), including ULK1, ATF3, CRY2, CSF3R, DAAM2,
GAS7, NPTXR, PPPIR15A and RTN2 (Fig.
4A and B). In the GSE49997 OV discovery cohort, the
associations of various DEGs in OS based on high (yellow line) and
low (blue line) expression levels were confirmed (Fig. 4A). Furthermore, in the TCGA OV
validation cohort, the associations of various DEGs in OS based on
high (yellow line) and low (blue line) gene expression levels were
also confirmed (Fig. 4B).
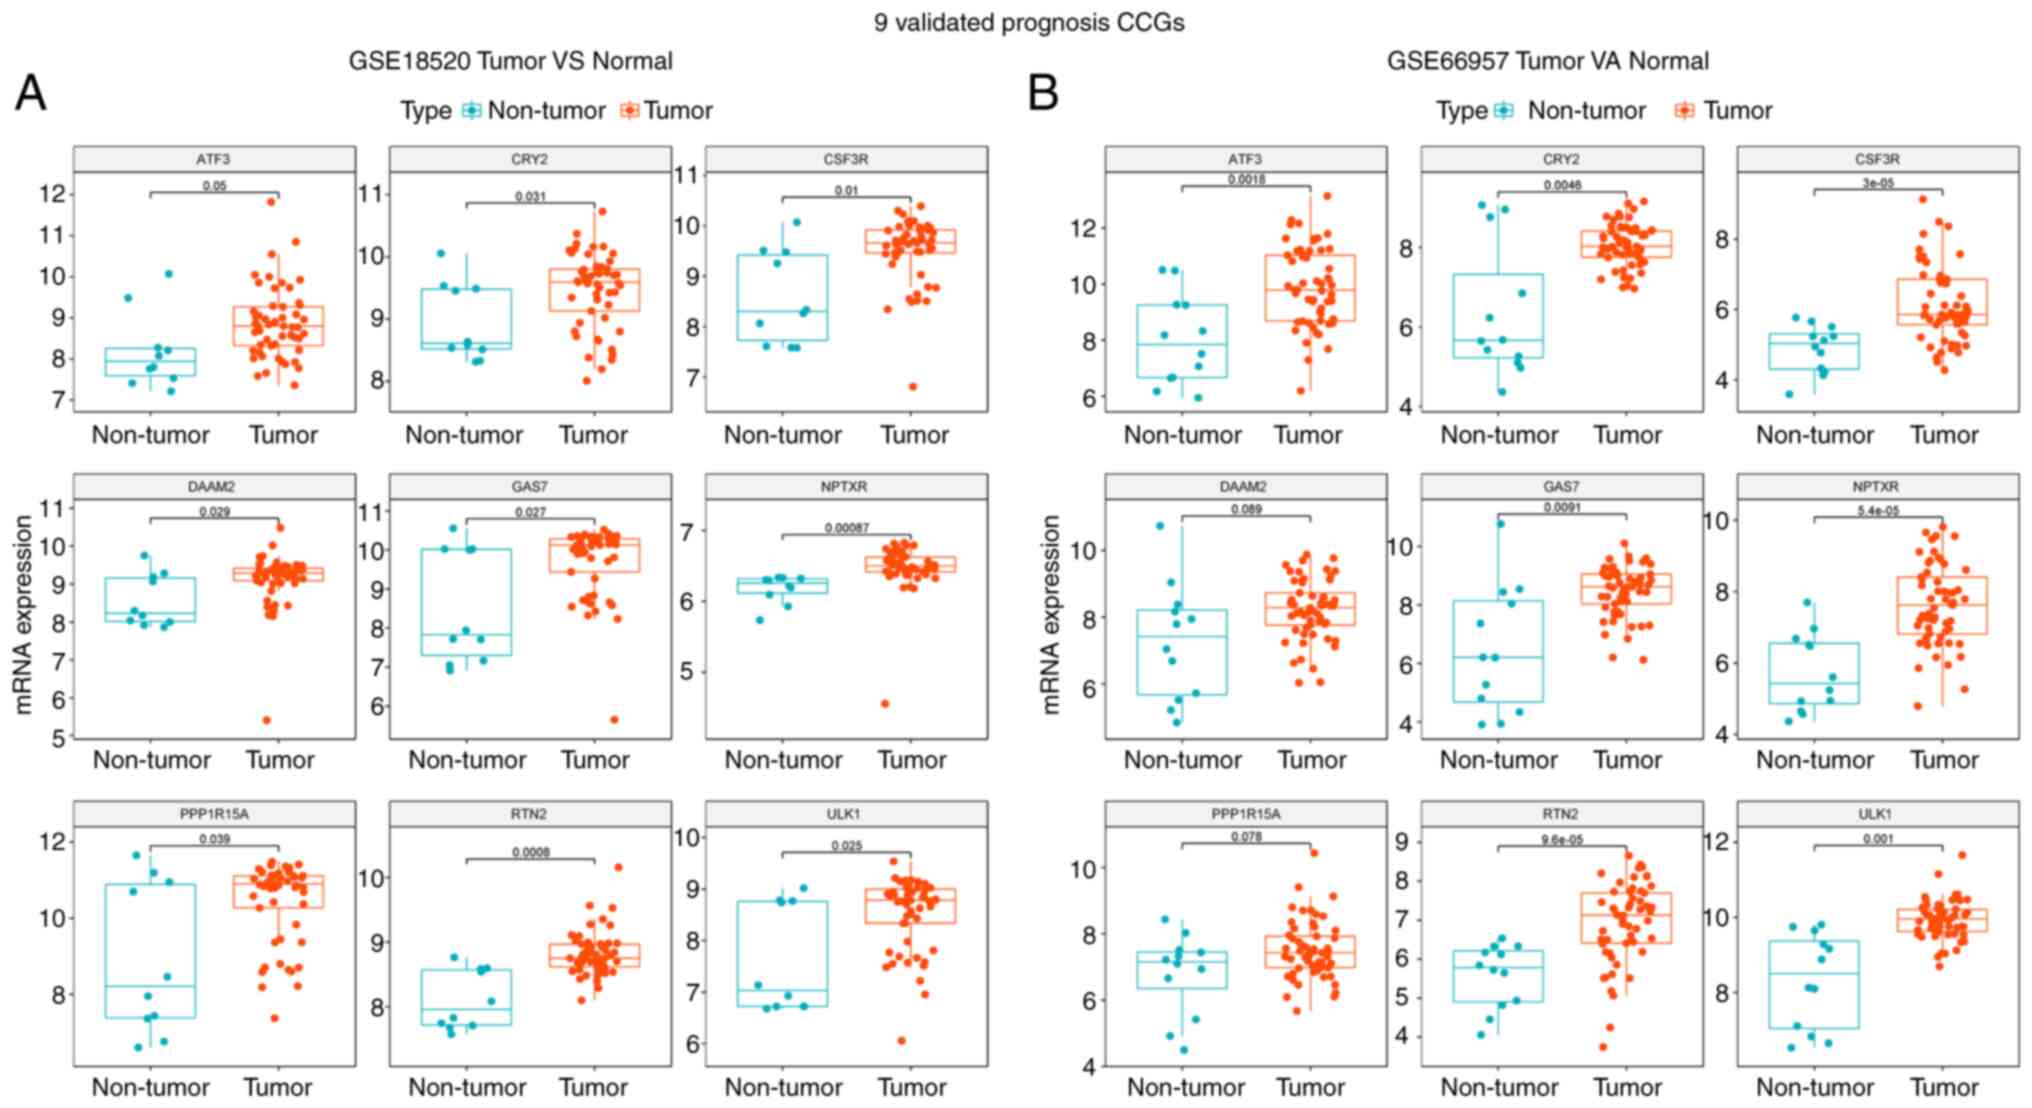
Validation of differentially expressed
CCGs in the GEO cohort
In order to further confirm these data, public
datasets were retrieved from GEO, including GSE18520 and GSE66957.
First, the above 9 genes were examined in 53 OV and 10 noncancerous
ovary tissue specimens in GSE18520. As indicated in Fig. 5A, the levels of ULK1, ATF3, CRY2,
CSF3R, DAAM2, GAS7, NPTXR, PPPIR15A and RTN2 were elevated in OV
samples compared with those in non-malignant tissues (P<0.05).
In addition, the expression of the 9 genes in 57 OV and 12
noncancerous ovary tissue samples in GSE66957 was detected. As
displayed in Fig. 5B, the levels
of ULK1, ATF3, CRY2, CSF3R, DAAM2, GAS7, NPTXR, PPPIR15A and RTN2
were elevated in OV compared with those in the normal group
(P<0.05).
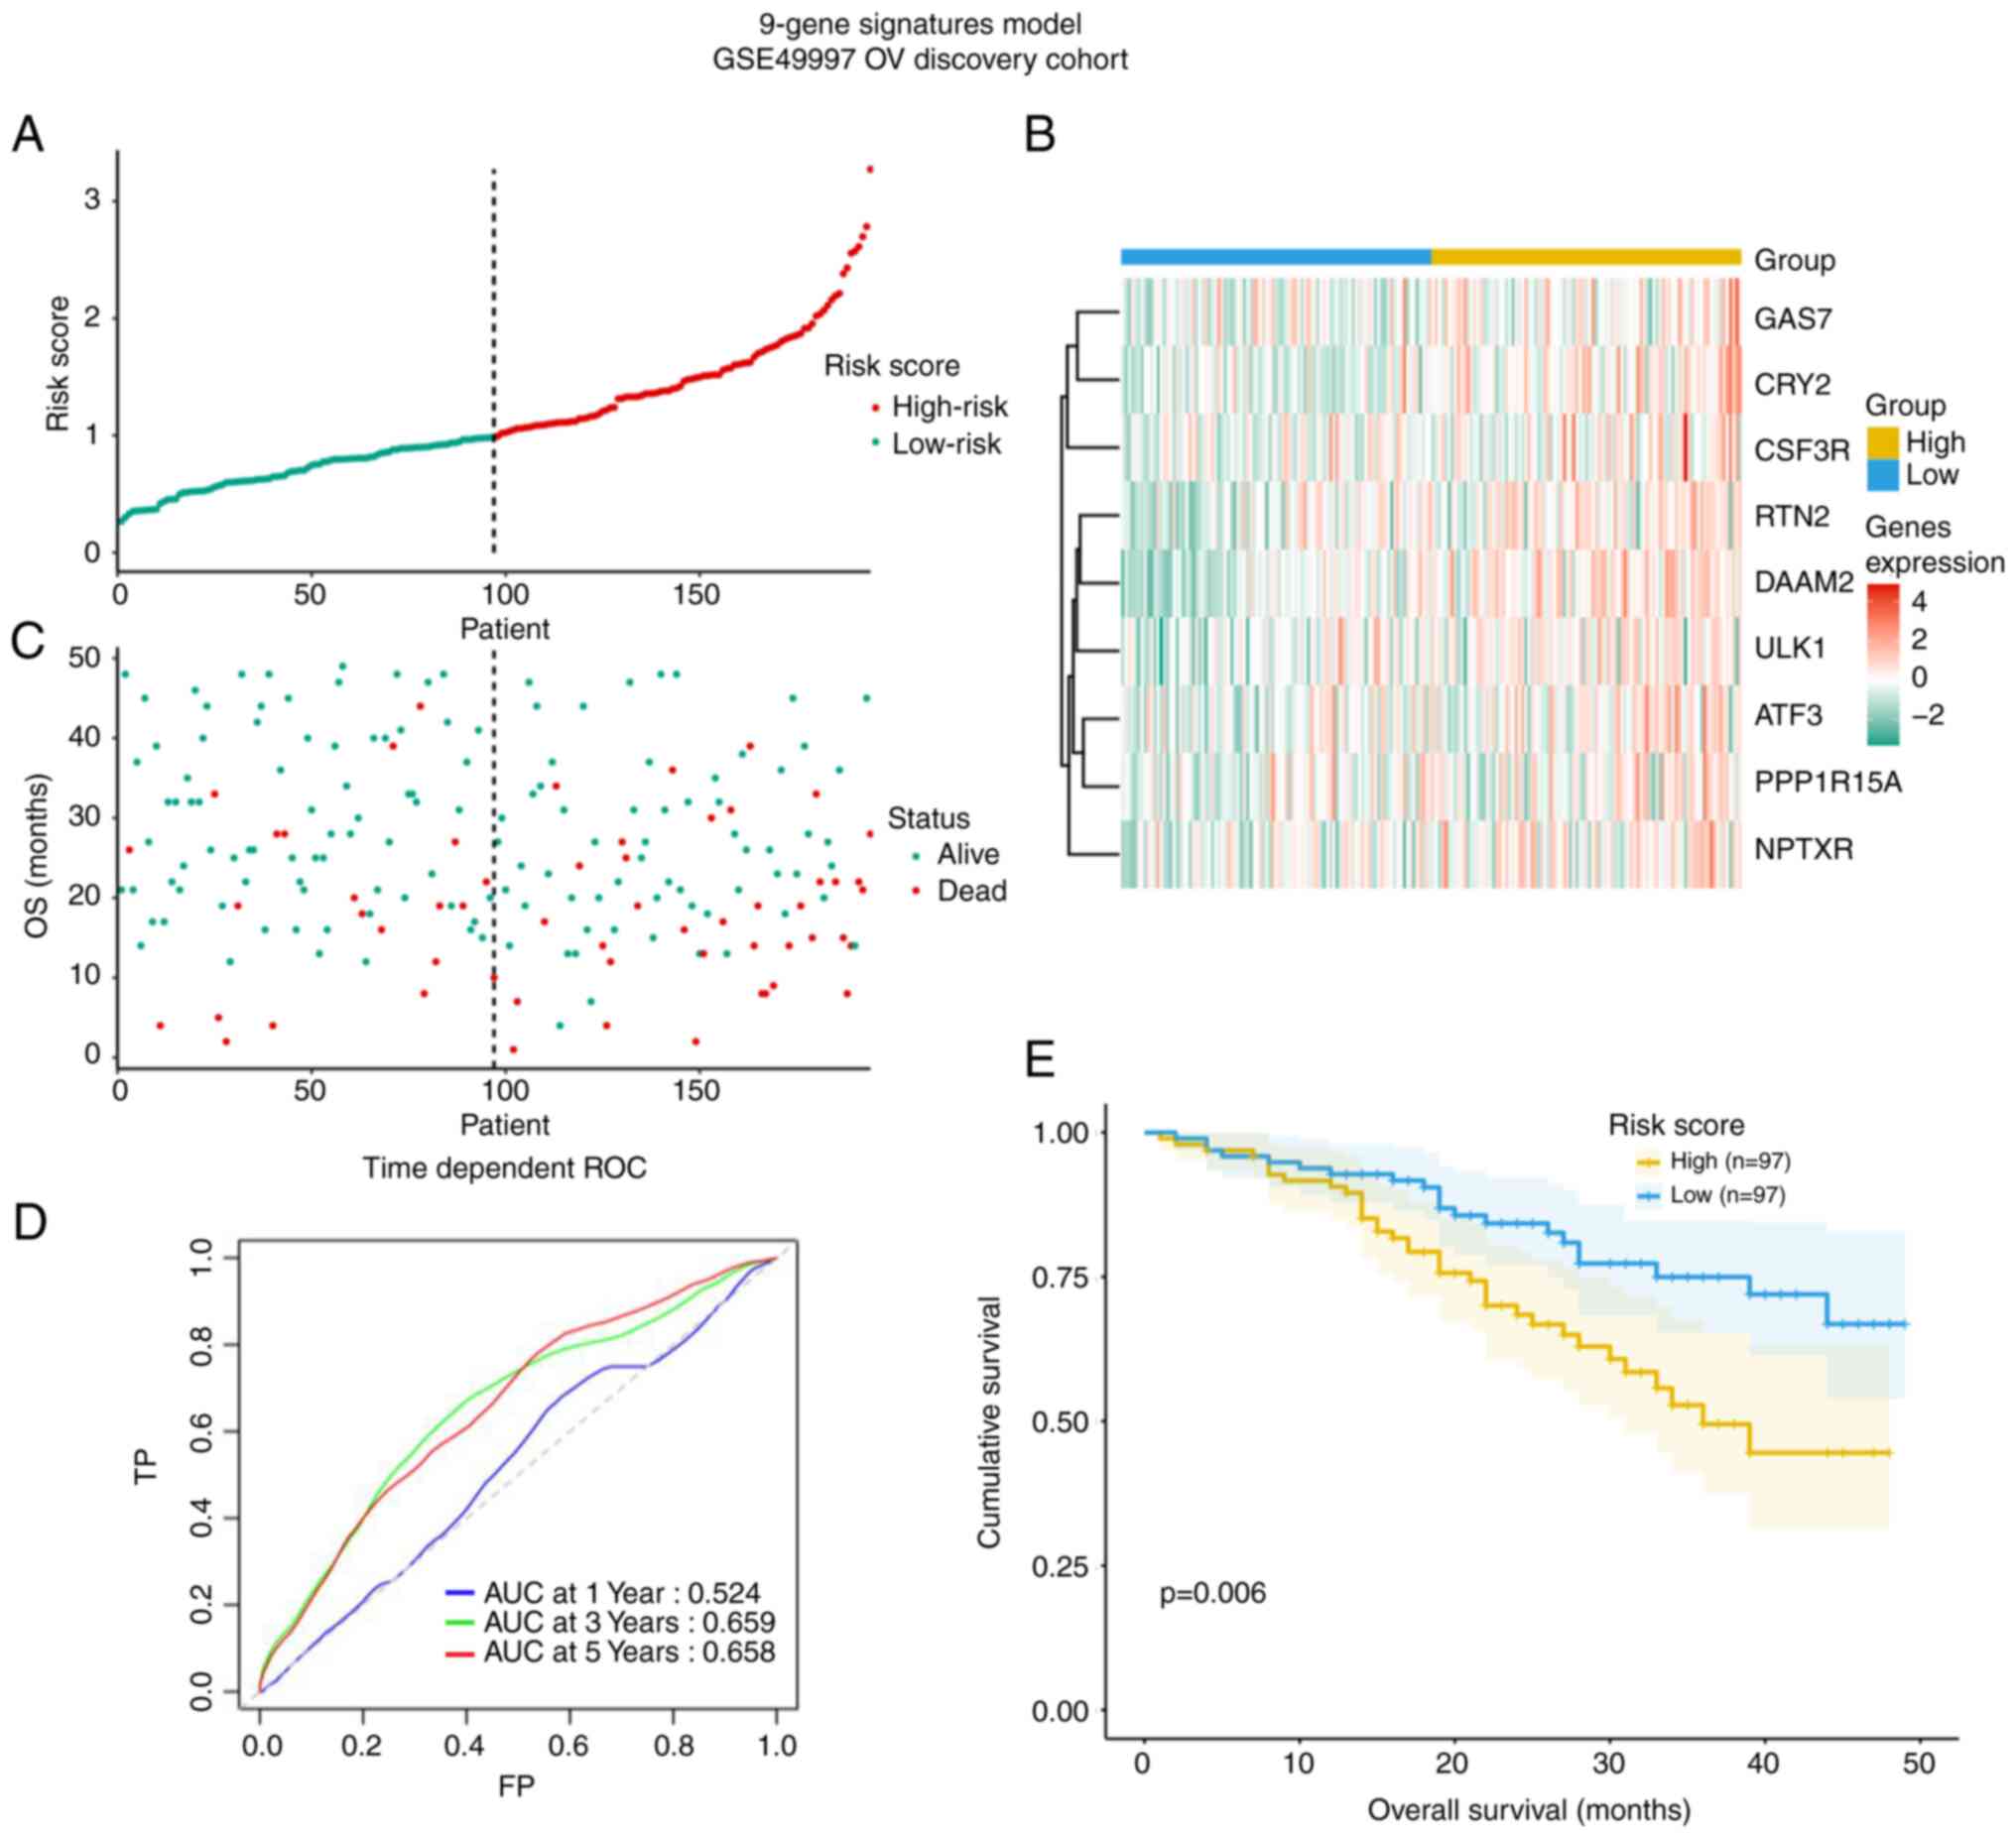
Construction of a prognostic signature
based on the 9 CCGs
From the 9 genes, ULK1, ATF3, CRY2, CSF3R, DAAM2,
GAS7, NPTXR, PPPIR15A and RTN2, a prognostic signature model was
generated, allowing for the calculation of a risk score for each
patient according to the expression levels in the GSE49997 cohort
(Fig. 6). The risk score may be
an important tool for distinguishing among patients with OV based
on potential discrete clinical outcomes (Fig. 6A and B). In Fig, 6C, the survival status of the
patients is presented. The area under curve of the receiver
operating characteristic (ROC) curve at 3-year was 0.66, suggesting
moderate potential for the prognostic signature based on
CCGs in survival monitoring (Fig. 6D). Kaplan-Meier curve revealed
that patients in high-risk group had a shorter OS (P=0.006,
Fig. 6E).
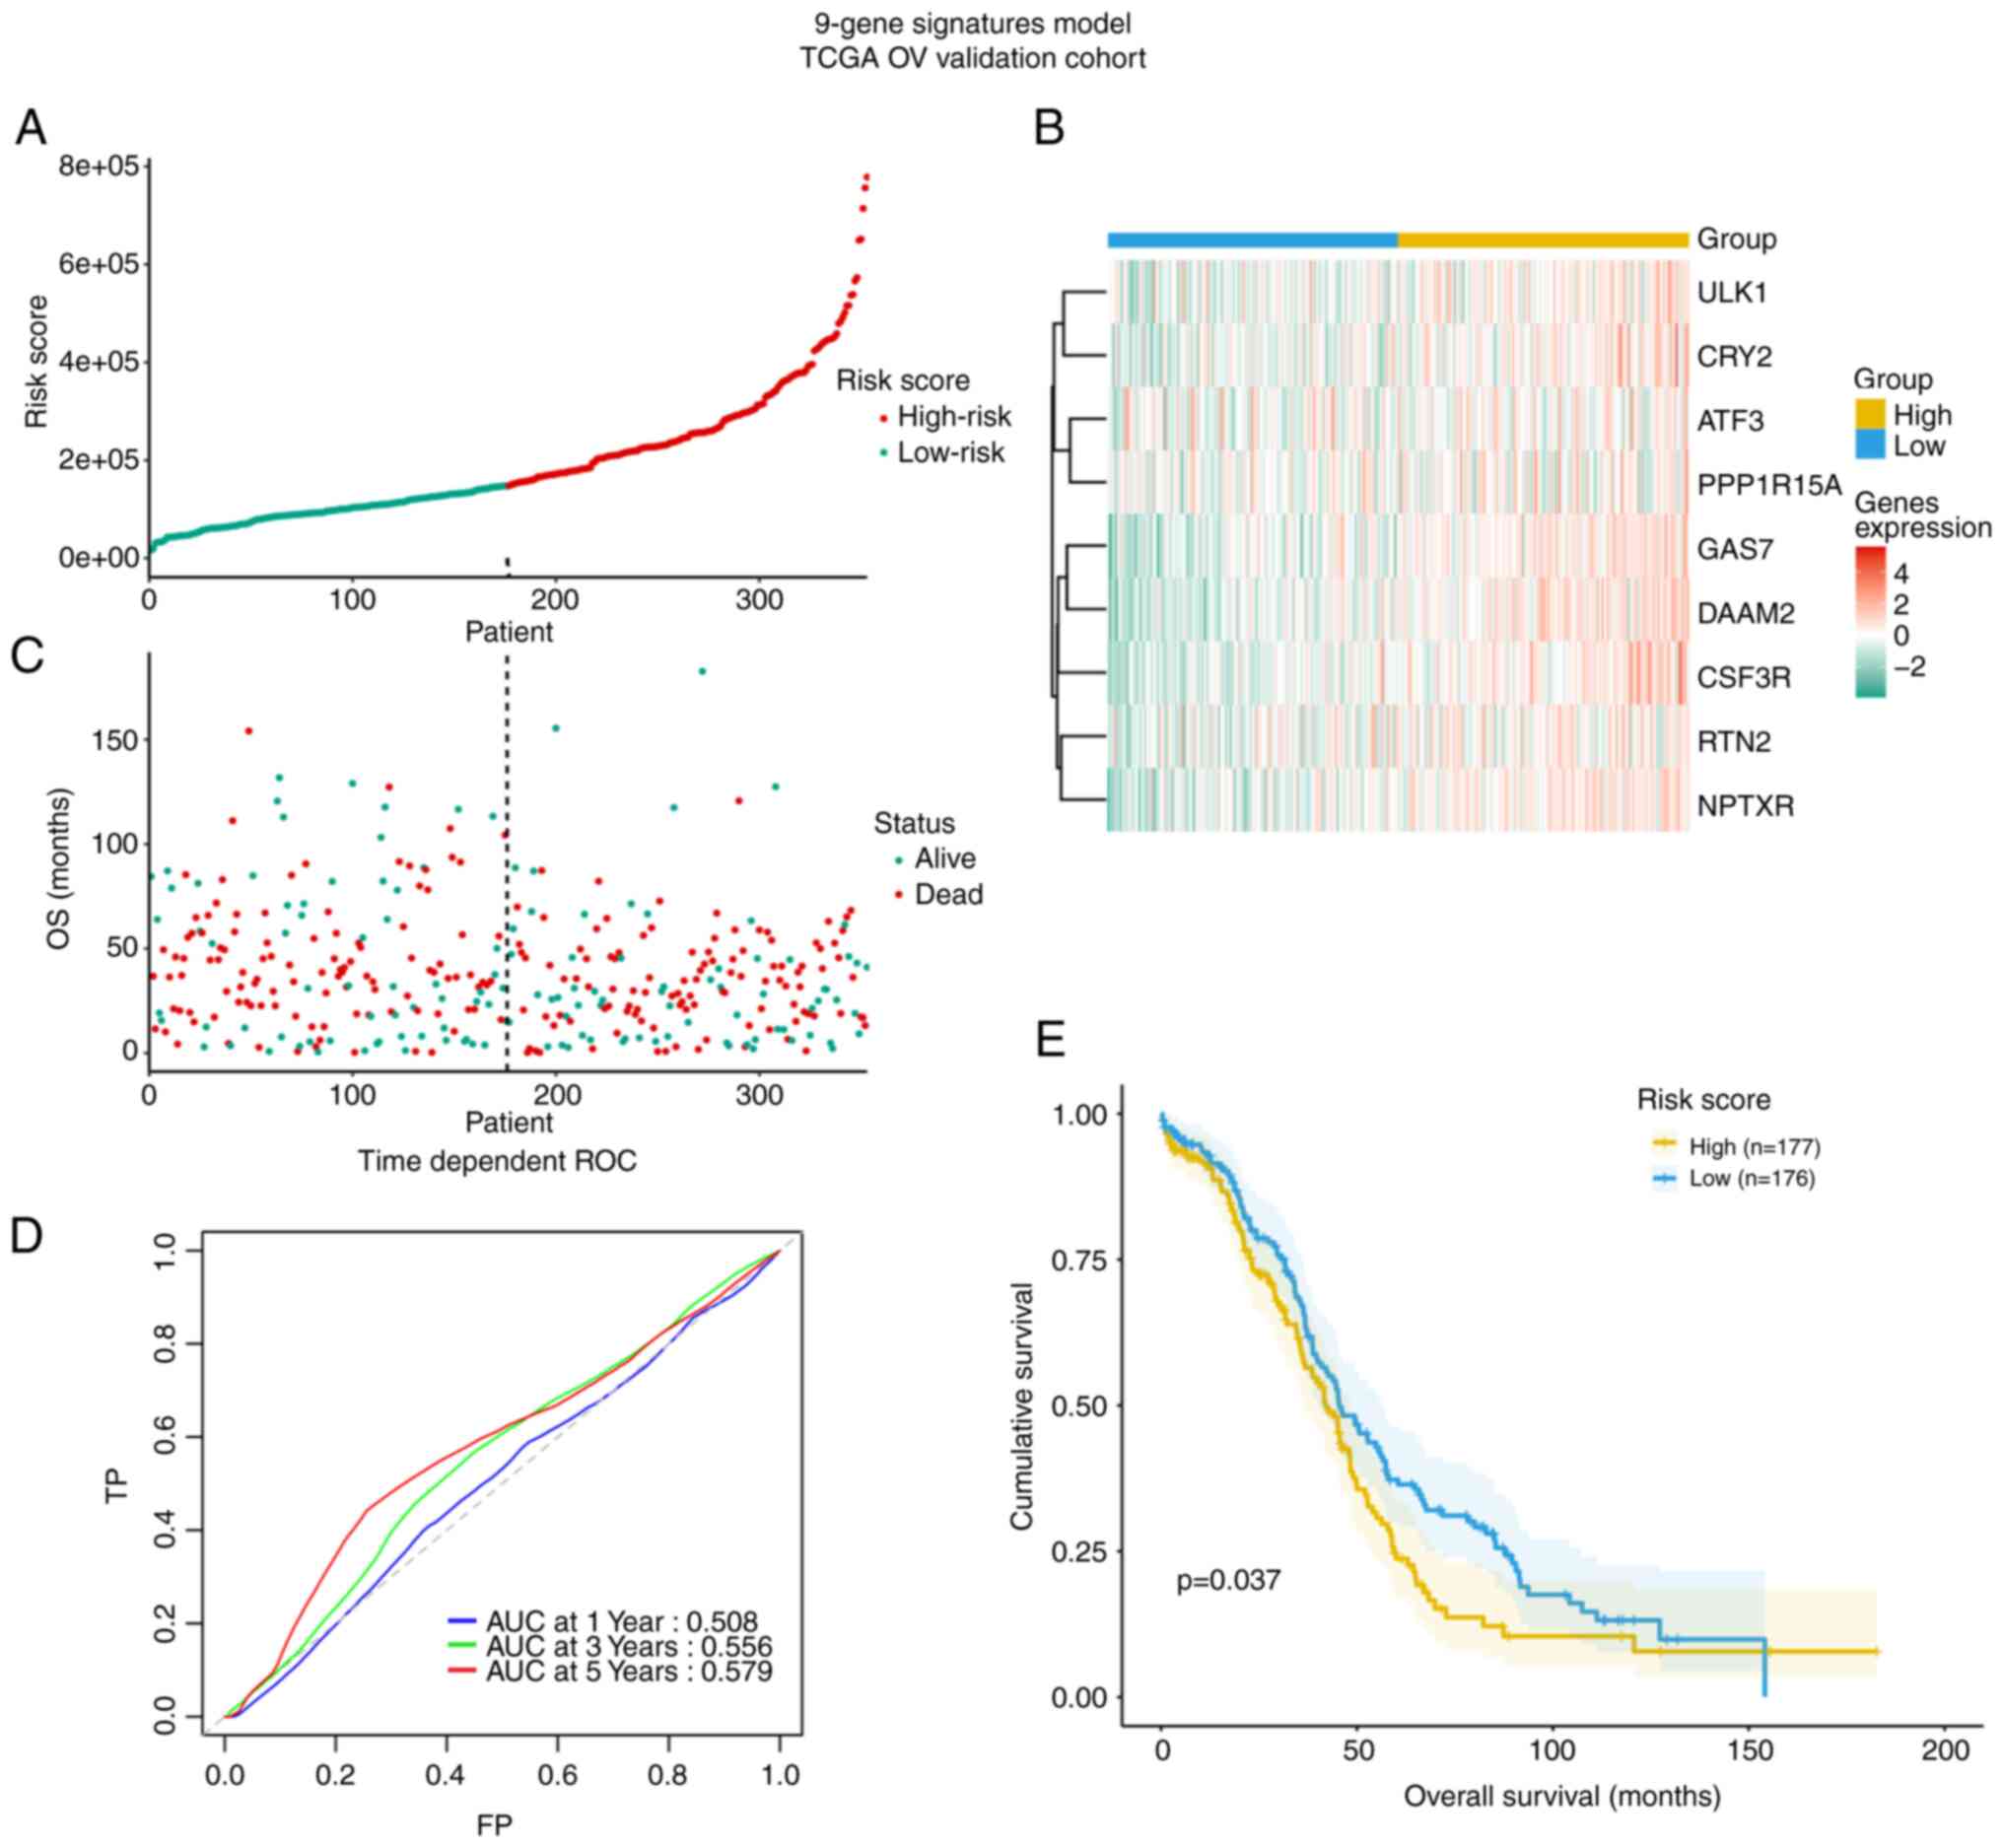
Validation of the model based on 9
circadian clock-related genes in the TCGA dataset
The TCGA cohort with 353 OV patients was used for
validation of the model (Fig. 7).
The risk score also distinguished in TCGA OV cohort based on
potential discrete clinical outcomes (Fig. 7A and B). OS of patients with alive
and dead status is presented in Fig
7C. The area under the ROC curve at 3 years in the TCGA
validation cohort was 0.56 and thus lower than that for the
discovery cohort GSE49997, suggesting the model's external
predictive power was limited (Fig.
7D). However, the Kaplan-Meier curve verified that high-risk
cases among patients with OV had decreased OS (P=0.037, Fig. 7E).
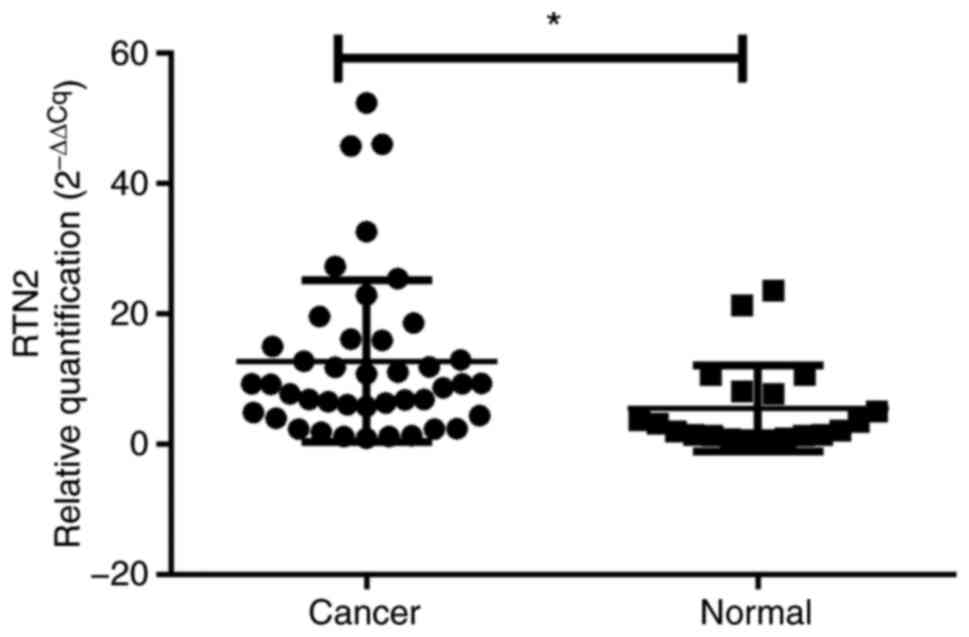
Confirmation by RT-qPCR and IHC
analysis
The differential expression of the key gene RTN2
between OV and normal ovarian tissues was then experimentally
validated in an internal cohort, there was no difference in age or
BMI between the control and OV groups (Table SII). RTN2 mRNA levels were
elevated in 42 OV specimens compared with 20 noncancerous tissue
samples (P<0.05, Fig. 8). More
importantly, compared with their normal counterparts, RTN2
expression determined by IHC was markedly increased in tumor
tissues (P<0.001; Table I;
Fig. 9). These data demonstrated
that RTN2 was upregulated in OV.
 | Table I.Association of RTN2 expression with
OV determined by immunohistochemistry in the internal cohort. |
Table I.
Association of RTN2 expression with
OV determined by immunohistochemistry in the internal cohort.
|
| Expression of
RTN2 |
|
|
|
|---|
|
|
|
|
|
|
|---|
| Group | Low (n=23) | High (n=39) | Total | χ2 | P-value |
|---|
| OV group | 6 | 36 | 42 | 62 | <0.001 |
| Control group | 17 | 3 | 20 |
|
|
Discussion
OV is associated with poor prognosis, high
malignancy and a rapid fatality potential. The reduced survival
results from late presentation, early lymph node metastasis, common
invasion of adjacent organs and poor chemotherapeutic response. The
pathogenesis of OV remains to be fully elucidated and mostly
involves malignant events, including apoptosis blockade,
deregulated proliferation and gene mutation-induced
differentiation, migration, adhesion, invasion and angiogenesis
(2). For prognostic improvement
in OV, effective therapeutic targets and predictive molecular
markers should be developed.
The ovary is an important organ in females, which is
both affected by and produces hormones. Hormone secretion is known
to be strongly associated with OV occurrence and progression
(31,32). Furthermore, female hormones are
controlled by circadian rhythms, whose disruption increases the
cancer risk. With the rapid pace of modern lifestyles, an
increasing number of females, particularly professionals, ignore
their normal biological rhythms in order to satisfy work demands
(33). The ‘biological clock’
controls circadian rhythms in humans and is associated with
multiple events in normal physiology as well as pathology.
Epidemiological analyses suggested that unfavorable work shifts
increase the risk of fatal OV (34,35). Most living organisms are active
during the daytime, while resting at night, due to the biological
24 h rhythms controlled by a regular oscillation of the amounts of
involved genes. Genes involved in circadian rhythms are highly
expressed in the ovary for regulating ovulation, and disrupted
circadian rhythms are associated with multiple risk factors for OV
(36,37). Genomic data from ovarian tumors
indicate that aberrant rhythmic changes may be involved in
malignant biological behaviors (38). Hence, the present study aimed to
examine CCGs and explore the mechanisms underlying tumorigenesis,
and to further explore the associations of these genes for the
development of OV therapies.
Exploring the mechanisms that regulate circadian
rhythms helped identify CCGs, leading to a Nobel Prize award in
2017. In addition to controlling circadian rhythms, CCGs are also
involved in multiple physiological and behavioral events, including
sleep, feeding pattern, body temperature, hormone release and blood
pressure (39,40). Interactions between tumor cells
and disrupted circadian clock significantly contribute to cancer
development (41). CCGs,
particularly master tumor-related genes, are involved in the
initiation, progression and evolution of OV (42,43). Multiple studies have reported that
abnormalities in circadian rhythms are involved in various
malignancies, including prostate (44), breast (42), endometrial (43), colorectal (45), liver (46) and lung (47) cancers, as well as leukemia
(48). Therefore, identifying the
abnormal expression of CCGs in OV is important as a biomarker for
disease management. The analyses of the present study were
performed based on public datasets, with the aim of expanding the
current knowledge on how CCGs have roles in OV. Future studies by
our group will further verify or validate these findings using
in vitro or in vivo experiments.
In the present study, CCGs in OV cases were
systematically assessed in GEO and TCGA datasets. Cancer drivers of
279 CCGs and the built PPI network further demonstrated that the
assessed genes mostly contributed to cancer pathways, circadian
rhythm pathways, CXCR4-mediated signaling events and rRNA
processing. Furthermore, ATF3, CRY2, CSF3R, DAAM2, GAS7, NPTXR,
PPPIR15A, RTN2 and ULK1 were identified as potential CCGs, which
may be biomarkers for OV. Certain genes included in the present
screening results have been previously reported (49–51) and are consistent with the present
results, thus confirming the findings of the present study. For
instance, the impact of ATF3 in tumorigenesis and immune cell
infiltration of ovarian tumors was assessed in a previous
bioinformatics study (49), ULK1
associated with progression-free survival in ovarian cancer,
decreases autophagy and cell viability in high-grade serous ovarian
cancer spheroids (50,51). However, various genes have not
been in detail validated in vivo and in vitro. In the
present study, a small sample validation in internal OV samples and
controls was performed; based on the bioinformatics analyses and
previous literature, RTN2 was expressed highly significantly in
colon adenocarcinoma and gastric cancer (52,53), circadian clock genes were
dysregulated and the expression levels have crucial roles in cancer
(54). RTN2 was selected from the
candidate genes for further experimental verification by RT-qPCR
and IHC in OV samples; the results indicated that the differential
expression was confirmed.
Given that the present study was based on
bioinformatics, it had several limitations. First, it focused on
CCG gene expression levels and their clinical significance.
However, transcriptomics only reflects certain aspects but not all
global alterations. Furthermore, data in various patients may have
been obtained at distinct times, which may confound the analysis.
Hence, whether these novel genes in combination would predict
survival with higher potential in comparison with individual genes
should be examined. Taken together, differentially expressed CCGs
characterize asynchronous circadian rhythms in cancer and may
represent a theoretical basis for chronotherapy.
In conclusion, the current study attempted to
identify CCGs that contribute to OS in OV using the GEO and TCGA
databases. Two independent cohorts were used to identify nine genes
with potential utility in OV prognosis, including an independent OV
discovery cohort and an OV validation cohort. Further investigation
of CCGs controlling ovarian cell functions may help develop novel
therapeutic targets for improving OV prognosis. These findings
provide insight into the expression of the CCG RTN2 in clinical OV
samples, which may provide information for further investigations
of RTN2-associated mechanisms and drug development in OV.
Supplementary Material
Supporting Data
Acknowledgements
Not applicable.
Funding
This work was supported by the Natural Science Foundation of
Zhejiang Province (grant no. LQ21H160011), the Medical and Health
Plan of Zhejiang (grant no. 2021KY990, 2022KY310 and 2022KY1115),
Ningbo Science and Technology Project (grant no. 2019F1003) and the
Natural Science Foundation of Ningbo (grant no. 2019A610306 and
2019A610260).
Availability of data and materials
The datasets used and/or analyzed during the current
study are available from the corresponding author on reasonable
request.
Author's contributions
XJZ, XL, LZ and JC designed the study. XJZ, XL and
YH performed the experiments. XNZ, XL, YH and JC wrote and revised
the manuscript. XL, LZ, JC and YH collected and analyzed the data.
XJZ, LZ and JC confirm the authenticity of all the raw data. XJZ
acquired funding. XNZ conceptualized and supervised the study. All
authors have read and approved the final manuscript.
Ethics approval and consent to
participate
This study was conducted in concordance with the
tenets of the declaration of Helsinki and was approved by the
Research Ethics Committee of Ningbo First Hospital (Ningbo, China;
no. 2021-R210). Prior to enrollment, all patients provided written
informed consent.
Patient consent for publication
Not applicable.
Competing interests
The authors declare that they have no competing
interests.
References
|
1
|
Webb PM and Jordan SJ: Epidemiology of
epithelial ovarian cancer. Best Pract Res Clin Obstet Gynaecol.
41:3–14. 2017. View Article : Google Scholar : PubMed/NCBI
|
|
2
|
Roett MA and Evans P: Ovarian cancer: An
overview. Am Fam Physician. 80:609–616. 2009.PubMed/NCBI
|
|
3
|
Penny SM: Ovarian cancer: An overview.
Radiol Technol. 91:561–575. 2020.PubMed/NCBI
|
|
4
|
Dengler V, Westphalen K and Koeppen M:
Disruption of circadian rhythms and sleep in critical illness and
its impact on innate immunity. Curr Pharm Des. 21:3469–3476. 2015.
View Article : Google Scholar : PubMed/NCBI
|
|
5
|
Huang W, Ramsey KM, Marcheva B and Bass J:
Circadian rhythms, sleep, and metabolism. J Clin Invest.
121:2133–2141. 2011. View
Article : Google Scholar : PubMed/NCBI
|
|
6
|
Vitaterna MH, Takahashi JS and Turek FW:
Overview of circadian rhythms. Alcohol Res Health. 25:85–93.
2001.PubMed/NCBI
|
|
7
|
Chaix A, Zarrinpar A and Panda S: The
circadian coordination of cell biology. J Cell Biol. 215:15–25.
2016. View Article : Google Scholar : PubMed/NCBI
|
|
8
|
Duguay D and Cermakian N: The crosstalk
between physiology and circadian clock proteins. Chronobiol Int.
26:1479–1513. 2009. View Article : Google Scholar : PubMed/NCBI
|
|
9
|
Imamura K, Yoshitane H, Hattori K,
Yamaguchi M, Yoshida K, Okubo T, Naguro I, Ichijo H and Fukada Y:
ASK family kinases mediate cellular stress and redox signaling to
circadian clock. Proc Natl Acad Sci USA. 115:3646–3651. 2018.
View Article : Google Scholar : PubMed/NCBI
|
|
10
|
Masri S, Kinouchi K and Sassone-Corsi P:
Circadian clocks, epigenetics, and cancer. Curr Opin Oncol.
27:50–56. 2015. View Article : Google Scholar : PubMed/NCBI
|
|
11
|
Gehlert S and Clanton M; On Behalf Of The
Shift W and Breast Cancer Strategic Advisory Group, : Shift work
and breast cancer. Int J Environ Res Public Health. 17:95442020.
View Article : Google Scholar : PubMed/NCBI
|
|
12
|
Schwarz C, Pedraza-Flechas AM, Lope V,
Pastor-Barriuso R, Pollan M and Perez-Gomez B: Gynaecological
cancer and night shift work: A systematic review. Maturitas.
110:21–28. 2018. View Article : Google Scholar : PubMed/NCBI
|
|
13
|
Li S, Shui K, Zhang Y, Lv Y, Deng W, Ullah
S, Zhang L and Xue Y: CGDB: A database of circadian genes in
eukaryotes. Nucleic Acids Res. 45:D397–D403. 2017.PubMed/NCBI
|
|
14
|
Ritchie ME, Phipson B, Wu D, Hu Y, Law CW,
Shi W and Smyth GK: limma powers differential expression analyses
for RNA-sequencing and microarray studies. Nucleic Acids Res.
43:e472015. View Article : Google Scholar : PubMed/NCBI
|
|
15
|
Li S, Chen S, Wang B, Zhang L, Su Y and
Zhang X: A robust 6-lncRNA prognostic signature for predicting the
prognosis of patients with colorectal cancer metastasis. Front Med
(Lausanne). 7:562020. View Article : Google Scholar : PubMed/NCBI
|
|
16
|
Croft D, O'Kelly G, Wu G, Haw R, Gillespie
M, Matthews L, Caudy M, Garapati P, Gopinath G, Jassal B, et al:
Reactome: A database of reactions, pathways and biological
processes. Nucleic Acids Res. 39:D691–D697. 2011. View Article : Google Scholar : PubMed/NCBI
|
|
17
|
Salwinski L, Miller CS, Smith AJ, Pettit
FK, Bowie JU and Eisenberg D: The database of interacting proteins:
2004 update. Nucleic Acids Res. 32:D449–D451. 2004. View Article : Google Scholar : PubMed/NCBI
|
|
18
|
Prasad TS, Goel R, Kandasamy K,
Keerthikumar S, Kumar S, Mathivanan S, Telikicherla D, Raju R,
Shafreen B, Venugopal A, et al: Human protein reference
database-2009 update. Nucleic Acids Res. 37:D767–D772. 2009.
View Article : Google Scholar : PubMed/NCBI
|
|
19
|
Brown KR and Jurisica I: Unequal
evolutionary conservation of human protein interactions in
interologous networks. Genome Biol. 8:R952007. View Article : Google Scholar : PubMed/NCBI
|
|
20
|
Orchard S, Ammari M, Aranda B, Breuza L,
Briganti L, Broackes-Carter F, Campbell NH, Chavali G, Chen C,
del-Toro N, et al: The MIntAct project-IntAct as a common curation
platform for 11 molecular interaction databases. Nucleic Acids Res.
42:D358–D363. 2014. View Article : Google Scholar : PubMed/NCBI
|
|
21
|
Licata L, Briganti L, Peluso D, Perfetto
L, Iannuccelli M, Galeota E, Sacco F, Palma A, Nardozza AP,
Santonico E, et al: MINT, the molecular interaction database: 2012
update. Nucleic Acids Res. 40:D857–D861. 2012. View Article : Google Scholar : PubMed/NCBI
|
|
22
|
Wu G, Feng X and Stein L: A human
functional protein interaction network and its application to
cancer data analysis. Genome Biol. 11:R532010. View Article : Google Scholar : PubMed/NCBI
|
|
23
|
Shannon P, Markiel A, Ozier O, Baliga NS,
Wang JT, Ramage D, Amin N, Schwikowski B and Ideker T: Cytoscape: A
software environment for integrated models of biomolecular
interaction networks. Genome Res. 13:2498–2504. 2003. View Article : Google Scholar : PubMed/NCBI
|
|
24
|
Wu G, Dawson E, Duong A, Haw R and Stein
L: ReactomeFIViz: A cytoscape app for pathway and network-based
data analysis. F1000Res. 3:1462014. View Article : Google Scholar : PubMed/NCBI
|
|
25
|
Kanehisa M, Furumichi M, Tanabe M, Sato Y
and Morishima K: KEGG: New perspectives on genomes, pathways,
diseases and drugs. Nucleic Acids Res. 45:D353–D361. 2017.
View Article : Google Scholar : PubMed/NCBI
|
|
26
|
Mi H, Muruganujan A and Thomas PD: PANTHER
in 2013: Modeling the evolution of gene function, and other gene
attributes, in the context of phylogenetic trees. Nucleic Acids
Res. 41:D377–D386. 2013. View Article : Google Scholar : PubMed/NCBI
|
|
27
|
Schaefer CF, Anthony K, Krupa S, Buchoff
J, Day M, Hannay T and Buetow KH: PID: The pathway interaction
database. Nucleic Acids Res. 37:D674–D679. 2009. View Article : Google Scholar : PubMed/NCBI
|
|
28
|
Heagerty PJ, Lumley T and Pepe MS:
Time-dependent ROC curves for censored survival data and a
diagnostic marker. Biometrics. 56:337–344. 2000. View Article : Google Scholar : PubMed/NCBI
|
|
29
|
Zheng X, Hua S, Zhao H, Gao Z and Cen D:
Overexpression of hepatocyte growth factor protects chronic myeloid
leukemia cells from apoptosis induced by etoposide. Oncol Lett.
23:1222022. View Article : Google Scholar : PubMed/NCBI
|
|
30
|
Schmittgen TD and Livak KJ: Analyzing
real-time PCR data by the comparative C(T) method. Nat Protoc.
3:1101–1108. 2008. View Article : Google Scholar : PubMed/NCBI
|
|
31
|
Li J, Yi SQ, Terayama H, Naito M, Hirai S,
Qu N, Wang HX, Yi N, Ozaki N and Itoh M: Distribution of
ghrelin-producing cells in stomach and the effects of ghrelin
administration in the house musk shrew (Suncus murinus). Neuro
Endocrinol Lett. 31:406–412. 2010.PubMed/NCBI
|
|
32
|
Black A, Pinsky PF, Grubb RL III, Falk RT,
Hsing AW, Chu L, Meyer T, Veenstra TD, Xu X, Yu K, et al: Sex
steroid hormone metabolism in relation to risk of aggressive
prostate cancer. Cancer Epidemiol Biomarkers Prev. 23:2374–2382.
2014. View Article : Google Scholar : PubMed/NCBI
|
|
33
|
Harris HR, Rice MS, Shafrir AL, Poole EM,
Gupta M, Hecht JL, Terry KL and Tworoger SS: Lifestyle and
reproductive factors and ovarian cancer risk by p53 and MAPK
expression. Cancer Epidemiol Biomarkers Prev. 27:96–102. 2018.
View Article : Google Scholar : PubMed/NCBI
|
|
34
|
Carter BD, Diver WR, Hildebrand JS, Patel
AV and Gapstur SM: Circadian disruption and fatal ovarian cancer.
Am J Prev Med. 46 (Suppl 1):S34–S41. 2014. View Article : Google Scholar : PubMed/NCBI
|
|
35
|
Sigurdardottir LG, Valdimarsdottir UA,
Fall K, Rider JR, Lockley SW, Schernhammer E and Mucci LA:
Circadian disruption, sleep loss, and prostate cancer risk: A
systematic review of epidemiologic studies. Cancer Epidemiol
Biomarkers Prev. 21:1002–1011. 2012. View Article : Google Scholar : PubMed/NCBI
|
|
36
|
Tao Z, Song W, Zhu C, Xu W, Liu H, Zhang S
and Huifang L: Comparative transcriptomic analysis of high and low
egg-producing duck ovaries. Poult Sci. 96:4378–4388. 2017.
View Article : Google Scholar : PubMed/NCBI
|
|
37
|
Wang F, Xie N, Wu Y, Zhang Q, Zhu Y, Dai
M, Zhou J, Pan J, Tang M, Cheng Q, et al: Association between
circadian rhythm disruption and polycystic ovary syndrome. Fertil
Steril. 115:771–781. 2021. View Article : Google Scholar : PubMed/NCBI
|
|
38
|
Wei W, Dizon D, Vathipadiekal V and Birrer
MJ: Ovarian cancer: Genomic analysis. Ann Oncol. 24 (Suppl
10):x7–x15. 2013. View Article : Google Scholar : PubMed/NCBI
|
|
39
|
Burki T: Nobel prize awarded for
discoveries in circadian rhythm. Lancet. 390:e252017. View Article : Google Scholar : PubMed/NCBI
|
|
40
|
Callaway E and Ledford H: Medicine nobel
awarded for work on circadian clocks. Nature. 550:182017.
View Article : Google Scholar : PubMed/NCBI
|
|
41
|
Wendeu-Foyet MG and Menegaux F: Circadian
disruption and prostate cancer risk: An updated review of
epidemiological evidences. Cancer Epidemiol Biomarkers Prev.
26:985–991. 2017. View Article : Google Scholar : PubMed/NCBI
|
|
42
|
Stevens RG, Brainard GC, Blask DE, Lockley
SW and Motta ME: Breast cancer and circadian disruption from
electric lighting in the modern world. CA Cancer J Clin.
64:207–218. 2014. View Article : Google Scholar : PubMed/NCBI
|
|
43
|
Viswanathan AN, Hankinson SE and
Schernhammer ES: Night shift work and the risk of endometrial
cancer. Cancer Res. 67:10618–10622. 2007. View Article : Google Scholar : PubMed/NCBI
|
|
44
|
Wendeu-Foyet MG, Cénée S, Koudou Y,
Trétarre B, Rébillard X, Cancel-Tassin G, Cussenot O, Boland A,
Olaso R, Deleuze JF, et al: Circadian genes polymorphisms, night
work and prostate cancer risk: Findings from the EPICAP study. Int
J Cancer. 147:3119–3129. 2020. View Article : Google Scholar : PubMed/NCBI
|
|
45
|
Innominato PF, Focan C, Gorlia T, Moreau
T, Garufi C, Waterhouse J, Giacchetti S, Coudert B, Iacobelli S,
Genet D, et al: Circadian rhythm in rest and activity: A biological
correlate of quality of life and a predictor of survival in
patients with metastatic colorectal cancer. Cancer Res.
69:4700–4707. 2009. View Article : Google Scholar : PubMed/NCBI
|
|
46
|
Kettner NM, Voicu H, Finegold MJ, Coarfa
C, Sreekumar A, Putluri N, Katchy CA, Lee C, Moore DD and Fu L:
Circadian homeostasis of liver metabolism suppresses
hepatocarcinogenesis. Cancer Cell. 30:909–924. 2016. View Article : Google Scholar : PubMed/NCBI
|
|
47
|
Wang N, Mi M, Wei X and Sun C: Circadian
clock gene Period2 suppresses human chronic myeloid leukemia cell
proliferation. Exp Ther Med. 20:1472020. View Article : Google Scholar : PubMed/NCBI
|
|
48
|
Puram RV, Kowalczyk MS, de Boer CG,
Schneider RK, Miller PG, McConkey M, Tothova Z, Tejero H, Heckl D,
Järås M, et al: Core circadian clock genes regulate leukemia stem
cells in AML. Cell. 165:303–316. 2016. View Article : Google Scholar : PubMed/NCBI
|
|
49
|
Li X, Liu P, Sun X, Ma R, Cui T, Wang T,
Bai Y, Li Y, Wu X and Feng X: Analyzing the impact of ATF3 in
tumorigenesis and immune cell infiltration of ovarian tumor: A
bioinformatics study. Med Oncol. 38:912021. View Article : Google Scholar : PubMed/NCBI
|
|
50
|
Singha B, Laski J, Valdés YR, Liu E,
DiMattia GE and Shepherd TG: Inhibiting ULK1 kinase decreases
autophagy and cell viability in high-grade serous ovarian cancer
spheroids. Am J Cancer Res. 10:1384–1399. 2020.PubMed/NCBI
|
|
51
|
Quinn MCJ, McCue K, Shi W, Johnatty SE,
Beesley J, Civitarese A, O'Mara TA, Glubb DM, Tyrer JP, Armasu SM,
et al: Identification of a locus near ULK1 associated with
progression-free survival in ovarian cancer. Cancer Epidemiol
Biomarkers Prev. 30:1669–1680. 2021. View Article : Google Scholar : PubMed/NCBI
|
|
52
|
Jiang C, Liu Y, Wen S, Xu C and Gu L: In
silico development and clinical validation of novel 8 gene
signature based on lipid metabolism related genes in colon
adenocarcinoma. Pharmacol Res. 169:1056442021. View Article : Google Scholar : PubMed/NCBI
|
|
53
|
Song S, Liu B, Zeng X, Wu Y, Chen H, Wu H,
Gu J, Gao X, Ruan Y and Wang H: Reticulon 2 promotes gastric cancer
metastasis via activating endoplasmic reticulum Ca(2+)
efflux-mediated ERK signalling. Cell Death Dis. 13:3492022.
View Article : Google Scholar : PubMed/NCBI
|
|
54
|
Liu Z, Yu K, Zheng J, Lin H, Zhao Q, Zhang
X, Feng W, Wang L, Xu J, Xie D, et al: Dysregulation, functional
implications, and prognostic ability of the circadian clock across
cancers. Cancer Med. 8:1710–1720. 2019. View Article : Google Scholar : PubMed/NCBI
|