Introduction
Acute myeloid leukemia (AML) is a life-threatening
hematological cancer involving the myeloid cells generated by bone
marrow (1). Furthermore, AML is a
genetically heterogeneous clonal disorder, characterized by the
accumulation of somatic modifications in hematopoietic progenitor
cells that affect their normal self-renewal, proliferation and
variation, all of which are involved in hematopoiesis (2). Hematopoietic stem cells also
contribute to hematopoiesis via these processes (3). A clinical study demonstrated that
allogeneic hematopoietic stem cell grafting was an effective
therapeutic option for patients with secondary AML (4).
Microarray data obtained using high-throughput
platforms are helpful for the identification of genes with
significant changes in expression and epigenetic modifications
during carcinogenesis, as well as for appraising the diagnostic and
prognostic effectiveness of biomarkers (5). A previous study identified
differentially methylated genes (DMGs) in cancers, including lung
squamous cell carcinoma, oral squamous cell carcinoma, and head and
neck squamous cell carcinoma (6).
Nevertheless, such available studies on AML are limited, to the
best of our knowledge.
Recently, it was reported that abnormal methylation
of DNA can affect the incidence and development of cancer by
influencing the chromatin structure, which modulates oncogenic or
tumor suppressor genes (TSGs) at the transcriptional level
(7,8). DNA methylation is an important
epigenetic mechanism in cancer, which has been widely researched
regarding its role in DNA injury repair, cell cycle control,
apoptosis and angiogenesis, all of which are associated with the
methylation of CpG islands (9) in
the promoter regions of genes (10). Aberrant methylation can influence
gene expression, particularly by reducing the expression of TSGs,
leading to the occurrence and development of AML (11). Research has identified emerging
groups of genes that are hypermethylated and downregulated, or
hypomethylated and upregulated in AML (12); however, the general profiles and
pathways of the interacting proteins identified using microarrays
remains poorly understood.
A limited number of studies have combined weighted
correlation network analysis with competing endogenous RNA network
construction (11) and used gene
expression and methylation profile microarrays to research the
development of AML (12,13). In the present study, four gene
expression profiles, one gene methylation profile, an oncogene list
and TSG list were comprehensively and scientifically evaluated
using bioinformatics analysis. This included the identification of
differentially expressed genes (DEGs) and DMGs using R software,
and using Venn diagrams to identify the intersecting DEGs, DMGs,
oncogenes and TSGs. Enrichment analyses were also conducted using
the Gene Ontology (GO) and Kyoto Encyclopedia of Genes and Genomes
(KEGG) databases (13). In
addition, protein-protein interaction (PPI) networks (14) were constructed, and the microarray
results for expression and methylation were validated in patient
samples. The present study aimed to detect the aberrantly
methylated DEGs between AML and control samples and identify the
related GO terms (15) and KEGG
pathways to determine the molecular mechanisms that underlie
tumorigenesis in AML (16).
Additionally, the study aimed to identify the abnormally methylated
DEGs that were also oncogenes or TSGs, which may function as
biomarkers and treatment targets for precise AML diagnosis and
treatment in the future.
Materials and methods
Microarray data
The present study used four gene expression profile
datasets (GSE109179, GSE142699, GSE49665 and GSE14772) and a gene
methylation profile dataset (GSE42042) from the US National Center
for Biotechnology Information (NCBI) Gene Expression Omnibus (GEO)
database (http:, www.ncbi.nlm.nih.gov/geo/). The GSE109179 data were
generated using the GPL15207 platform (Affymetrix
PrimeView™ Human Gene Expression Array) and included
whole blood samples from 9 patients with AML and 4 healthy controls
(17). The GSE142699 data were
generated using the GPL26945 platform [nanoString
nCounter® Human microRNA (miRNA)] (18) and included whole blood samples from
24 patients with AML and 24 healthy donors. The GSE49665 data were
generated using the GPL17547 platform (TU Graz miRNA array) and
included whole blood samples from 52 patients with AML and 5
healthy donors (18). The GSE14772
data were generated using the GPL9081 platform (Agilent-016436
Human miRNA Microarray 1.0 G4472A; miRNA ID version) and included
whole blood samples from 2 patients with AML and 7 normal controls
(19). The GSE42042 data were
derived from the GPL8490 platform [Illumina HumanMethylation27
BeadChip (HumanMethylation27 270596 v.1.2; Thermo Fisher
Scientific)] and included 13 whole blood samples from patients with
AML and 4 whole blood samples from healthy donors (20).
Identification of DEGs and DMGs
The abovementioned datasets were processed using R
software (version 3.4.3; R Core Team). They were standardized using
the wateRmelon (version 2.2.0; http://bioconductor.org/packages/wateRmelon/) and
limma (version 3.52.2; http://bioconductor.org/biocLite.R) packages to
identify DEGs and DMGs. The cut-off criteria for the DEGs and DMGs
were P<0.05 and |log fold change (FC)|>1.5. The computer code
used was as previously described (http:www.mdpi.com/1422-0067/19/6/1698/s1). The
wANNOVAR tool (https://wannovar.wglab.org/) was used to convert the
DMG identifiers into gene names. A list of oncogenes was obtained
from the ON Gene database (http:ongene.bioinfo-minzhao.org/), and a list of TSGs
was obtained from the TS Gene database (https:bioinfo.uth.edu/TSGene/index.html). An online
Venn diagram tool (http:bioinfogp.cnb.csic.es/tools/venny/) was then
employed to visualize the intersecting DEGs, DMGs, oncogenes and
TSGs. Briefly, the upregulated hypomethylated oncogenes were
identified as those in the overlap among hypomethylated genes,
upregulated genes and oncogenes, while the downregulated
hypermethylated TSGs were identified as those in the overlap among
hypermethylated genes, downregulated genes and TSGs.
GO and KEGG enrichment analyses
The Database for Annotation, Visualization and
Integrated Discovery (DAVID; http://david.abcc.ncifcrf.gov/) was used to perform GO
and KEGG enrichment analyses. The lists of genes, comprising 45
upregulated hypomethylated genes and 60 downregulated
hypermethylated genes were uploaded onto DAVID. P<0.05 was
considered to indicate a statistically significant difference for
both analyses. The biological process (BP) GO terms were ordered
according to P-value, and the terms with the lowest P-values
associated with the upregulated hypomethylated genes and
downregulated hypermethylated genes were selected and visualized
using bubble diagrams. The significantly enriched pathways in the
KEGG analysis were visualized using the pathview package
(https://pathview.uncc.edu/). The top 10
KEGG pathways associated with the upregulated hypomethylated genes
and downregulated hypermethylated genes were selected and
visualized using bubble diagrams. FunRich 3.0 software (https://www.funrich.org/) was used to visualize the
pathways associated with the genes of interest (21).
PPI network construction and module
analysis
Construction of PPI networks enables the
clarification and visualization of potential molecular mechanisms
that are pivotal in oncogenesis. The STRING database (https:string-db.org/) and FunRich software were used
to construct PPI networks. In addition, functional enrichment
analysis of the five downregulated hypermethylated TSGs was
performed using FunRich software, and the top five pathways in each
analysis were selected. Notably, no upregulated hypomethylated
oncogenes were identified.
Validation of selected genes
To confirm the integrated bioinformatics
analyses-based findings, 15 DEGs (Table I), i.e., 10 downregulated
hypermethylated genes [transcription factor 7 (TCF7), charged
multivesicular body protein 7 (CHMP7),
phosphatidylinositol-4,5-bisphosphonate 3-kinase catalytic subunit
α (PIK3CA), solute carrier family 39 member 8 (SLC39A8), cytochrome
B-245 β chain (CYBB), inhibitor of DNA binding 3, HLH protein
(ID3), calcium/calmodulin dependent protein kinase IV (CAMK4), SUFU
negative regulator of Hedgehog signaling (SUFU), pleckstrin
homology domain containing O1 (PLEKHO1) and BCL2 interacting
protein 3 like (BNIP3L)] and five upregulated hypomethylated genes
[vinculin (VCL), Z-DNA binding protein 1 (ZBP1), transcription
factor Dp-1 (TFDP1), integrin α M (ITGAM) and adrenoceptor β 2
(ADRB2)] were randomly selected for validation using reverse
transcription-quantitative polymerase chain reaction (RT-qPCR).
Additionally, next-generation sequencing-based bisulfite
sequencing/PCR was used to validate the methylation status in the
promoters of six of the aforementioned genes (CAMK4, ITGAM, CYBB,
SLC39A8, SUFU and VCL). Targeted bisulfite sequencing (TBS) was
applied to analyze the methylation status. Validation of the
selected genes was fulfilled using blood samples from five patients
with AML, and five healthy controls. The samples were collected by
Guangzhou Twelfth People's Hospital (Guangzhou, China) between
January 2019 and December 2020. Information on the patients with
AML is presented in Table II.
Inclusion criteria for selecting the patients with AML were as
follows: Histologically confirmed AML with >20% blasts; AML
refractory to or relapsed after initial treatment, with no more
than three prior lines of therapy; age ≥18 years; and Eastern
Cooperative Oncology Group performance status ≤2. The exclusion
criteria were: Treatment-related AML or acute promyelocytic
leukemia; active malignancies within 12 months, excluding those
with a negligible risk of metastasis or death; clinical evidence of
active central nervous system leukemia at the time of screening.
Independent t-tests were used to calculate P-values to determine if
the differences between the AML and control groups were significant
for the 15 DEGs. Genes with P<0.05 and the absolute value of FC
>2.0 were considered as DEGs.
 | Table I.List of the 15 differentially
expressed genes. |
Table I.
List of the 15 differentially
expressed genes.
| Gene |
log2FC | P-value | q-value |
|---|
| TCF7 | −1.200 | 0.003 | 0.239 |
| CHMP7 | −1.233 | 0.004 | 0.170 |
| PIK3CA | −0.784 | 0.011 | 0.361 |
| SLC39A8 | −0.611 | 0.002 | 0.225 |
| CYBB | −0.677 | 0.016 | 0.399 |
| ID3 | −1.238 | 0.003 | 0.254 |
| CAMK4 | −1.266 | 0.026 | 0.462 |
| VCL | 0.617 | 0.031 | 0.487 |
| ZBP1 | 0.877 | 0.005 | 0.274 |
| TFDP1 | 0.867 | 0.005 | 0.279 |
| ITGAM | 2.487 | 0.002 | 0.232 |
| ADRB2 | 0.885 | 0.012 | 0.365 |
| SUFU | −0.672 | 0.002 | 0.219 |
| PLEKHO1 | −1.045 | 0.013 | 0.376 |
| BNIP3L | −0.761 | 0.019 | 0.420 |
| Table II.Clinical data of patients with acute
myeloid leukemia (n=5). |
Table II.
Clinical data of patients with acute
myeloid leukemia (n=5).
| Characteristic | Cases (n) |
|---|
| Age <60
years | 5 |
| Sex |
|
|
Female | 3 |
|
Male | 2 |
| Neoadjuvant
treatment |
|
|
Yes | 3 |
| No | 2 |
| Survival
status |
|
|
Alive | 5 |
|
Dead | 0 |
RT-qPCR
Total RNA was extracted from 300 µl blood using
TRIzol® reagent (Invitrogen; Thermo Fisher Scientific,
Inc.) according to the manufacturer's protocol, and placing at 4°C
for 5 min, then adding 0.24 ml chloroform, shaking violently for 15
sec and standing at 4°C for 3 min. The mixture was then centrifuged
at 4,000 × g at 4°C for 15 min, and the upper aqueous phase was
transferred to a new tube. An equal volume of isopropyl alcohol was
added, mixed in and left to stand at −20°C for 20 min. The
supernatant was removed by centrifugation at 4,000 × g for 15 min
at 4°C, and the precipitate was washed with 1 ml 75% DEPC alcohol,
centrifuged at 8,000 rpm for 5 min at 4°C and the liquid discarded.
After drying at room temperature, 30 µl DEPC-treated
ddH2O was added to the residue to dissolve the RNA.
After determining the concentration of 1.5 µl sample solution using
an ultra-micro ultraviolet analyzer, the RNA was frozen at −80°C
for future use. Using 2 µg total RNA as template in a total system
volume of 10 µl, RT-qPCR was performed using a Bestar™
qPCR RT Kit (DBI Bioscience) according to the manufacturer's
instructions. The following thermocycling conditions were used for
qPCR amplification: 95°C for 2 min, 94°C for 20 sec, 58°C for 20
sec and 72°C for 20 sec, for 40 cycles. Melting curve analysis was
performed at 94°C for 30 sec, 65°C for 30 sec and 94°C for 30 sec.
The primer sequences used are listed in Table III. GAPDH was used as the
reference gene. The analysis of each sample was repeated three
times using the 2−∆∆Cq method (22).
| Table III.Sequences of the primer pairs for
analysis of differentially expressed genes by reverse
transcription-quantitative PCR. |
Table III.
Sequences of the primer pairs for
analysis of differentially expressed genes by reverse
transcription-quantitative PCR.
| Gene | Forward
(5′-3′) | Reverse
(5′-3′) |
|---|
| GAPDH |
TGTTCGTCATGGGTGTGAAC |
ATGGCATGGACTGTGGTCAT |
| TCF7 |
TTGATGCTAGGTTCTGGTGTACC |
CCTTGGACTCTGCTTGTGTC |
| CHMP7 |
AAGCCTCTCAAGTGGACTCTT |
ACAGACGATACACCTCCTCAG |
| PIK3CA |
AGTAGGCAACCGTGAAGAAAAG |
GAGGTGAATTGAGGTCCCTAAGA |
| SLC39A8 |
ATGCTACCCAAATAACCAGCTC |
ACAGGAATCCATATCCCCAAACT |
| CYBB |
ACCGGGTTTATGATATTCCACCT |
GATTTCGACAGACTGGCAAGA |
| ID3 |
AAATCCTACAGCGCGTCATC |
AAAGCTCCTTTTGTCGTTGGA |
| CAMK4 |
AGTTCTTCTTCGCCTCTCACA |
CATCTCGCTCACTGTAATATCCC |
| VCL |
CTCGTCCGGGTTGGAAAAGAG |
AGTAAGGGTCTGACTGAAGCAT |
| ZBP1 |
GAAGAGCAAAGTCAGCCTCA |
TGATGTTCCCGTGTCCAATC |
| TFDP1 |
AATTGAAGCCAACGGAGAACTC |
CGGTCTCTGAGGCGTACCA |
| ITGAM |
ACTTGCAGTGAGAACACGTATG |
TCATCCGCCGAAAGTCATGTG |
| ADRB2 |
GCCTGTGCTGATCTGGTCAT |
AATGGAAGTCCAAAACTCGCA |
| SUFU |
GCCTGAGTGATCTCTATGGTGA |
TCTCTCTTCAGACGAAAGGTCAA |
| PLEKHO1 |
GGGACCAGCTCTACATCTCTG |
TGGAGTGGGCAAGAGTAAACT |
| BNIP3L |
ATGTCGTCCCACCTAGTCGAG |
TGAGGATGGTACGTGTTCCAG |
TBS-PCR
The TBS-PCR amplification primer pool
(including upstream primer pool A and downstream primer pool B,
with primer lengths between 26 and 36 bases, annealing temperatures
of 55–65°C and amplicon length 150–250 bp) was designed using
Acegen Targeted Methyl Panel, (a multi-targeted PCR primer
designing software system for bisulfite sequencing; http://symech.fgg.uni-lj.si/). The sequences of the
primer pairs are listed in Table
IV. Firstly, 1 µg genomic DNA was converted using an ZYMO EZ
DNA Methylation-Gold Kit (Zymo Research Corp.) and 5% of the
elution products were used as templates for 35 cycles of PCR
amplification with a KAPA HiFi Hot Start Uracil+ Ready Mix PCR Kit
(Kapa Biosystems; Roche Diagnostics). The following thermocycling
conditions were used for qPCR amplification: 98°C for 2 min,
followed by 98°C for 15 sec, 63°C for 2 min and 72°C for 30 sec,
then 72°C for 1 min and hold at 4°C. The amplification products
were purified using 1X magnetic beads (Agencourt AMPure XP; Beckman
Coulter) to remove contaminants, and the recovered products were
used for DNA library preparation. The specific target band was
detected for the success of library construction through
electrophoresis. For each sample, the bisulfite PCR amplification
products of multiple genes were pooled equally and then
5′-phosphorylated, 3′-dA-tailed and ligated to a barcoded adapter
(VAHTS DNA Adapters set3-set6 for Illumina N808; Vazyme Biotech,
Co., Ltd.) using T4 DNA ligase (cat no. M0202L; New England
Biolabs, Inc.). The prepared library (34.5 ng/µl; 30 µl) was
quantified using a Qubit™ 3.0 fluorometer (Thermo Fisher
Scientific, Inc.) and Agilent 2100 Bioanalyzer (Agilent
Technologies, Inc.). The sequencing strategy (NovaSeq Reagent Kit;
PE150; Illumina Inc.) was paired-ended (PE) index sequencing with a
sequencing reads length of PE150 performed using an Illumina
platform (Novaseq 6000; Agilent Technologies, Inc.). Differentially
methylated regions were identified based on comparison of the
methylation levels of cytosines between samples from the two groups
using the Mann-Whitney U-test. A mean methylation difference
>0.05 and P<0.05 were considered statistically significant.
The statistical analyses were performed using R.
| Table IV.Sequences of the primer pairs used
for analysis of differentially expressed genes using targeted
bisulfite sequencing. |
Table IV.
Sequences of the primer pairs used
for analysis of differentially expressed genes using targeted
bisulfite sequencing.
| Amplicon | Left primer | Right primer |
|---|
| CAMK4-1 |
GGTTAGTTGGTGTTA | CTTTCTCTCTCCC |
|
| GGTGGGAGGGA | AAACTATAACTACC |
| CAMK4-2 |
GGATTATTGGATYGA | CCTAAATAAAAAT |
|
|
YGGTTTTAATAGGGATG |
TAACTCTCTCTCAAAACACT |
| CYBB |
GTTTTAGTTTTTTTTGAGT |
CCAATAATAAACCACAT |
|
|
AGTTGGGATTATAGGTGT |
ATATAACAATAATCCCAT |
| ITGAM |
GGAAATATTTGAGAGTT | CCAATAATAAACCA |
|
| GTATAGGAAGGAA | AATTATACAAAAAC |
| SLC39A8-1 |
GGGGTTATTTTGGTTT |
TCCCCCTTTATCCTCTT |
|
|
GGGTTTTTTTTTGAGGGT |
TATCTCAAACTCTCCA |
| SLC39A8-2 |
GTTTTTTATAAATAAG |
CTCCATTTCAACAAATT |
|
|
GGGAGGAGGGTTTTG |
AATTTCATCAAAATCAC |
| SUFU-1 |
GAGTTTYGGAAGTTAATTT | CCAAACCAATCCT |
|
|
TTATAGTTTTGGAGTA |
TAAACCCTTAACTCT |
| SUFU-2 |
GGATTATGTGATAAG |
CCCCAAAAAAAAAAATT |
|
| GGGAGGAAGGA |
CCTCTACCATAAAATCCT |
| VCL-1 |
GTGTGAAGGGAAAAG | CCCCTCCCCCATT |
|
| TTGAGGAGGGGA |
CCTAAAAAAAAAACCT |
| VCL-2 |
GAGTATTTYGAAAAG |
CATTATCACCAAATAAA |
|
|
GGATTAGTAGGAGTGG |
AAATCTACTATACCACC |
Survival analysis
SPSS software (IBM Corp.) was used to perform a
survival analysis to determine the association between patient
survival rates and DEGs. The data on 140 patients with AML were
acquired from The Cancer Genome Atlas (TCGA). The patients were
divided into high and low expression groups according to the median
value of each gene. Kaplan-Meier survival curves were drawn.
Additionally, Cox regression analysis (23) was used to calculate hazard ratio
(HR) values for the Kaplan-Meier plots and the log-rank test was
used to calculate P-values.
Cell culture and transfection
HL60 AML cells (Shanghai EK-Bioscience) were
sustained in minimum elementary RPMI-1640 (C11875500BT; Gibco;
Thermo Fisher Scientific, Inc.) containing 10% fetal bovine serum
(cat. no. 04-001-1A; Biological Industries) and 1% penicillin and
streptomycin (15140-122; Gibco; Thermo Fisher Scientific, Inc.).
The HL60 cells was maintained in a humidity incubator with 5%
CO2 at 37°C. LV003-TCF7, LV003-ITGAM, LV003-CAMK4,
LV003, small interfering (si)-homo-TCF7, si-homo-ITGAM,
si-homo-CAMK4 and negative control (siRNA-NC) sequences were
transfected into the HL60 cells using EndoFectin™-Max
(EF004; GeneCopoeia, Inc.) according to the manufacturer's
protocol. The overexpression vectors were designed by Anhui GENERAL
BIOL and the interference fragments were designed by Suzhou
GenePharma, Co., Ltd. The overexpression vectors were based on an
LV003 lentiviral vector plasmid backbone (Forevergen Bioscoences
Co., Ltd.). The sequences of the siRNAs are listed in Table V. DNA-Lipofectamine 2000 complexes
(500 µl) were added to each well containing cells and medium. This
was mixed gently by rocking the plate back and forth. The cells
were incubated at 37°C in a CO2 incubator for 24–72 h
until they were ready to assay for transgene expression. It was not
necessary to remove the complexes or change the medium; however,
the growth medium was replaced after 4–6 h without loss of
transfection activity. After transfection for 48 h, total RNA was
extracted and the relative mRNA expression levels were
analyzed.
| Table V.siRNA sequences. |
Table V.
siRNA sequences.
|
| Sequence |
|---|
|
|
|
|---|
| siRNA | Sense (5′-3′) | Antisense
(5′-3′) |
|---|
|
si-homo-ITGAM-479 |
GCATCATCCCACATGACTT |
AAGTCATGTGGGATGATGC |
|
si-homo-ITGAM-1123 |
GCTGGTGGAGTCTTTCTAT |
ATAGAAAGACTCCACCAGC |
|
si-homo-ITGAM-2931 |
GCTGAACCAGACTGTCATA |
TATGACAGTCTGGTTCAGC |
|
si-TCF7-homo-152 |
TCAAGTCGTCGCTCGTGAA |
TTCACGAGCGACGACTTGA |
|
si-TCF7-homo-276 |
GAGACTCTTCCCGGACAAA |
TTTGTCCGGGAAGAGTCTC |
|
si-TCF7-homo-671 |
GCGGATATAGACAGCACTT |
AAGTGCTGTCTATATCCGC |
|
si-CAMK4-homo-1204 |
AGUUAAAGGUGCAGAUAUAAA |
UUUAUAUCUGCACCUUUAACU |
|
si-CAMK4-homo-365 |
GGAGGAGAACUGUUUGAUAGG |
CCUAUCAAACAGUUCUCCUCC |
|
si-CAMK4-homo-172 |
CAUUGUGUACAGAUGCAAACA |
UGUUUGCAUCUGUACACAAUG |
| si-NC |
UUCUCCGAACGUGUCACGUTT |
ACGUGACACGUUCGGAGAATT |
Cell counting kit-8 (CCK-8) assay
The CCK-8 assay was used to evaluate the
proliferation of the HL60 AML cells. In brief, HL60 cells
(3×10⁴/well) were cultured in a 96-well plate with
triplicate wells for each group. The cells were then transfected
with LV003-ITGAM, LV003-TCF7, LV003-CAMK4, LV-003, si-ITGAM-1123,
si-TCF7-152, si-CAMK4-365 and siRNA-NC sequences using
EndoFectin™-Max (EF004; GeneCopoeia, Inc.) according to
the manufacturer's protocol. Following transfection for 24 h, 100
µl culture solution containing 10 µl CCK-8 reagent (Beyotime
Institute of Biotechnology) was added to each well in the absence
of light and sustained in a humidity incubator at 37°C for 24, 48
and 72 h. Subsequently, a microplate reader was used to acquire the
optical density of each well at 450 nm.
Detection of cell apoptosis
The detection of HL60 AML cell apoptosis was
detected using flow cytometry (Cytoflex; Beckman Coulter, Inc.).
Transfected HL60 cells (1×10⁶) were resuspended in 100
µl binding buffer, followed by the addition of 5 µl
fluorochrome-conjugated Annexin V (KGA1022) and 7 µl
7-aminoactinomycin D staining solution (cat. no. 00-6993-50;
eBioscience; Thermo Fisher Scientific, Inc.). A
fluorescence-activated cell sorting flow cytometer (FACSAria;
Becton, Dickenson and Company) and FlowJo 10.7 software (FlowJo
LLC) were used to evaluate the cells and calculate the percentage
of apoptotic cells.
Statistical analysis
SPSS software version 20.0 (IBM Corp.) was used to
perform the analyses. Volcano plot analysis was used to evaluate
DEGs as mean (AML)-mean (normal). Independent t-tests were used to
calculate P-values to determine if the differences between the AML
and control groups were significant for the 15 DEGs. σ2-values were
determined using the unpaired t-tests. Differentially methylated
regions were identified based on comparison of the methylation
levels of cytosines between samples from the two groups using the
Mann-Whitney U-test. Associations between characteristics and
overall survival were evaluated by Cox proportional hazard models,
while HR and 95% confidence interval values were described as per
1% DEG. Kaplan-Meier survival curves were drawn and compared among
subgroups using log-rank tests.
Results
Identification of DEGs and DMGs in
AML
Expression profile data were obtained from the
GSE109179, GSE142699, GSE49665 and GSE14772 datasets, involving 87
AML samples and 40 normal samples. Following data processing,
quality evaluation and analysis in R, a total of 1,101 DEGs
(P<0.05 and |log FC|>1.5) were obtained, comprising 578
downregulated genes and 523 upregulated genes. The DEGs are
presented in a volcano plot and a hierarchically cluster heatmap,
respectively in Fig. 1A and B.
Additionally, using the GSE42042 dataset, differentially methylated
probe data were used to compare the AML and normal samples, as
shown in the heatmap in Fig. 1C. A
total of 1,187 hypomethylated and 1,551 hypermethylated genes were
identified.
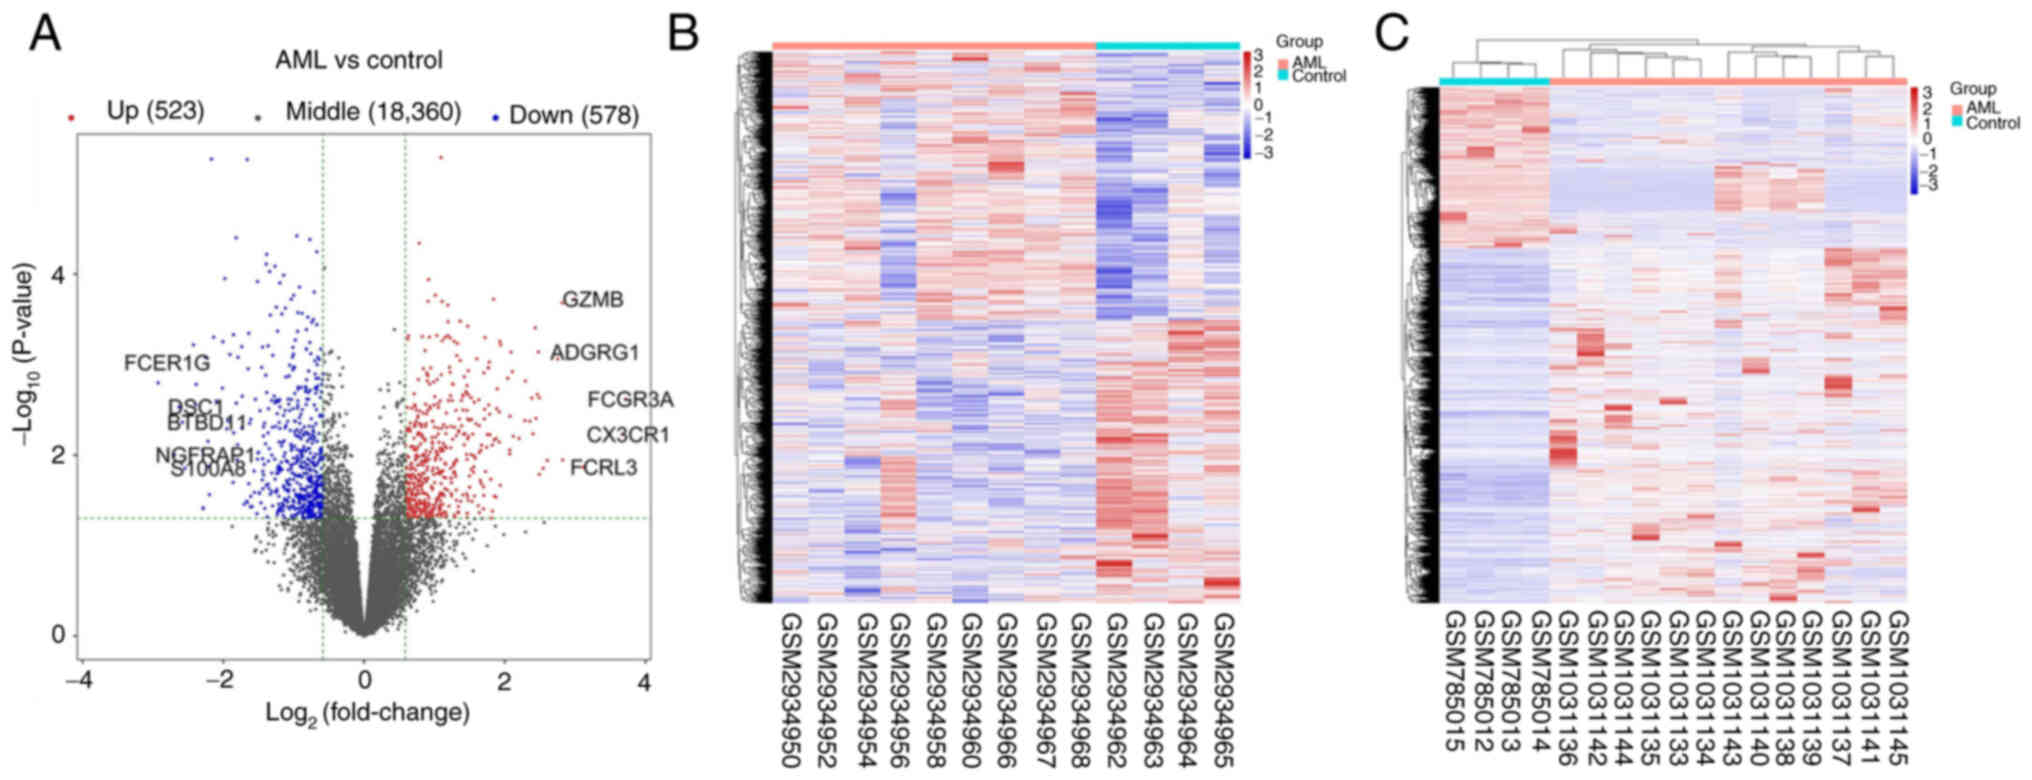 | Figure 1.Comparisons of DEGs in GSE109179,
GSE142699, GSE49665 and GSE14772 and DMGs in GSE42042 between AML
and control samples. (A) Volcano plot of the DEGs. The right and
left dotted vertical lines indicate log2FC>1 and
log2FC<-1, respectively. The horizontal dotted line
indicates-log10 P=0.05. The top five
(log2FC<-1) genes are FCER1G, DSC1, BTBD11, NGFRAP1
and S100A8. The top five (log2FC>1) genes are FCGR3A,
CX3CR1, FCRL3, ADGRG1 and GZMB. (B) Heatmap of the 1,101 DEGs
between AML and normal samples. Red and blue indicate higher and
lower expression, respectively. (C) Heatmap of the DMGs between AML
and normal samples. Red and blue indicate hypermethylation and
hypomethylation, respectively. DEGs, differentially expressed
genes; DMGs, differentially methylated genes; AML, acute myeloid
leukemia. |
Identification of abnormally
methylated DEGs
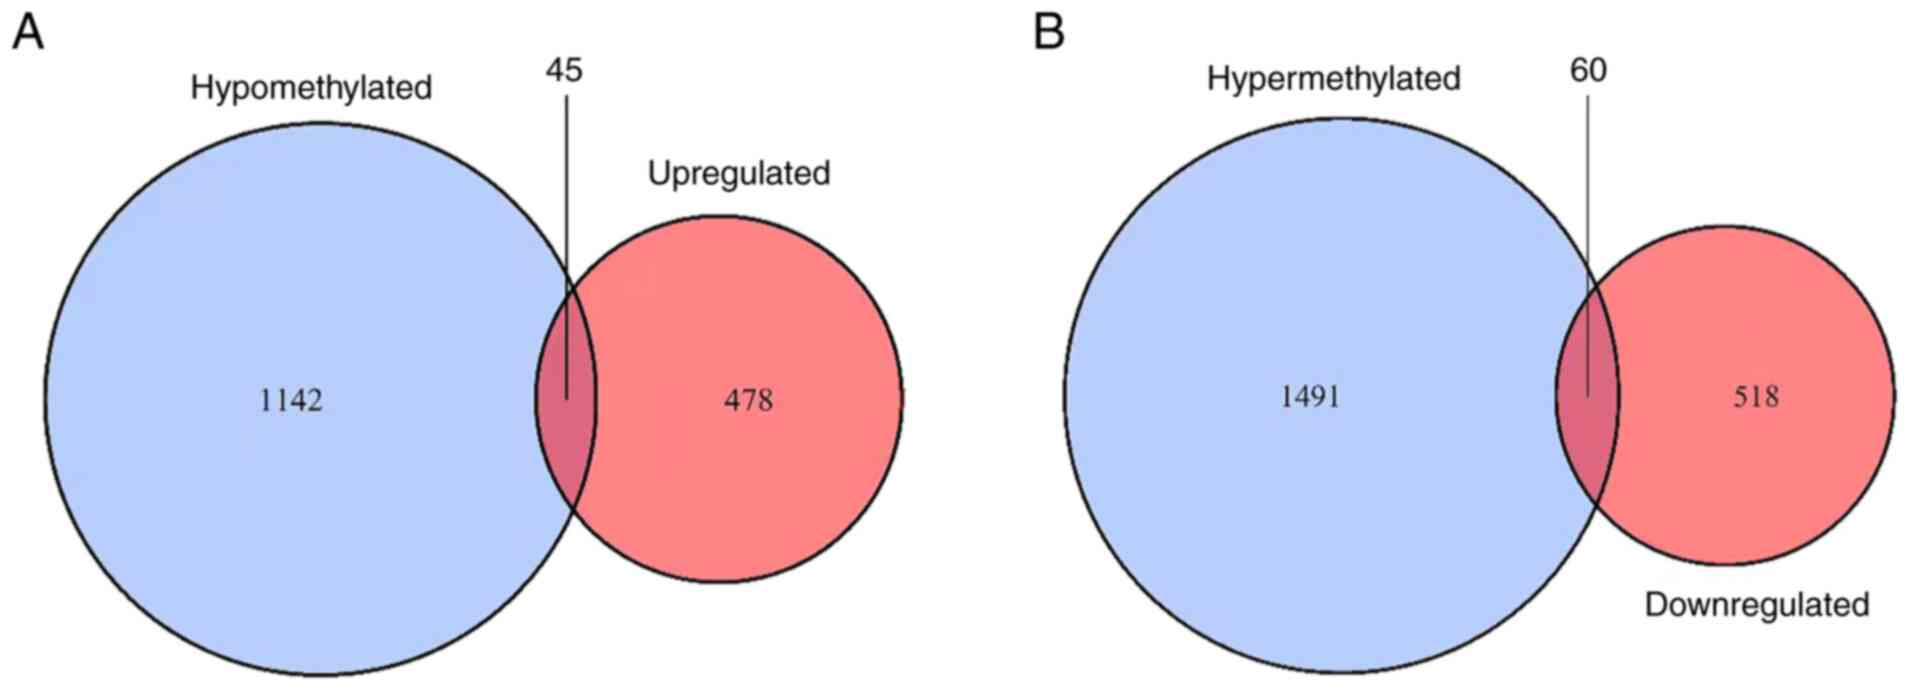
To identify the abnormally methylated DEGs (24), the upregulated genes that were also
hypomethylated were identified, along with the downregulated genes
that were also hypermethylated. In total, 45 upregulated
hypomethylated genes (Fig. 2A) and
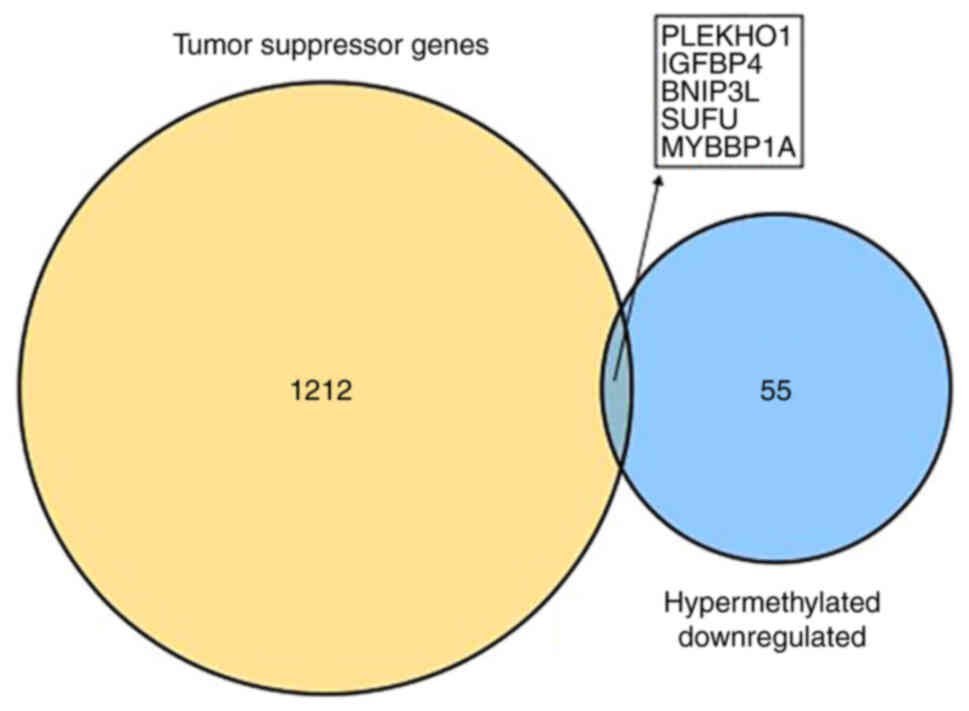
60 downregulated hypermethylated genes (Fig. 2B) were identified. The ON Gene and
TS Gene databases were used to further research the abnormally
methylated DEGs. The present study aimed to identify the
upregulated hypomethylated genes that were oncogenes, but none were
found. However, five downregulated hypermethylated TSGs [PLEKHO1,
insulin like growth factor binding protein 4 (IGFBP4), BNIP3L, SUFU
and MYB binding protein 1a (MYBBP1A); Fig. 3] were identified. The possibility
that the abnormal hypermethylation of these TSGs led to their
downregulation in AML and, consequently, to increased tumorigenesis
requires investigation.
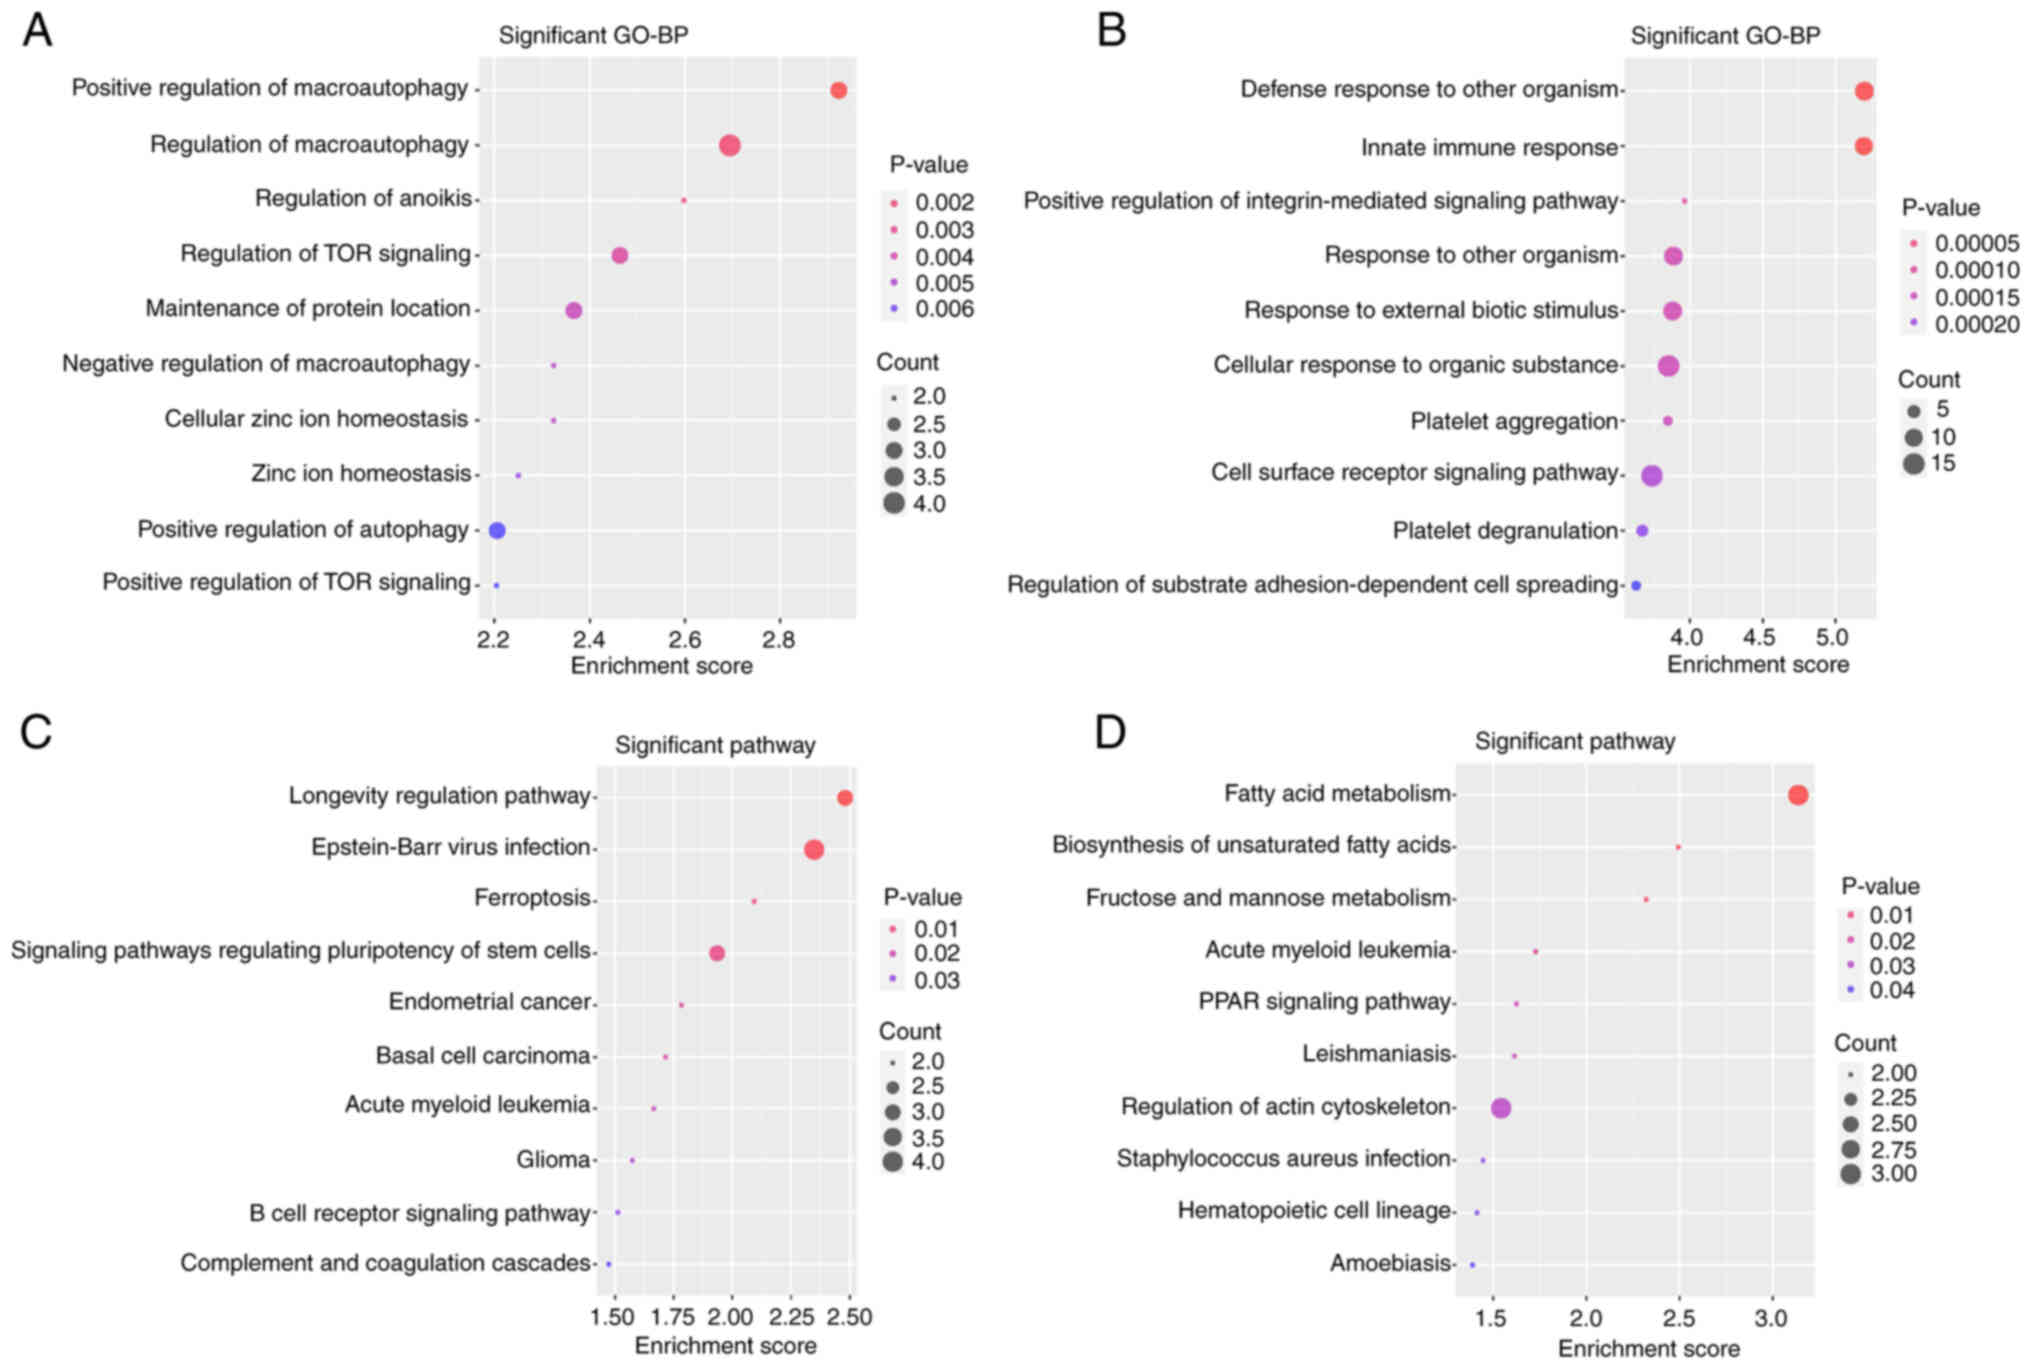
Functional enrichment analyses
To search and visualize the GO BP terms and KEGG
pathways associated with the upregulated hypomethylated genes and
downregulated hypermethylated genes, the two lists of genes were
uploaded to DAVID and the FunRich tool. The GO BP enrichment
analysis, conducted using DAVID software (Fig. 4A and B) indicated that the 45
upregulated hypomethylated genes were significantly enriched in
‘defense response to other organism’, ‘innate immune response’,
‘positive regulation of integrin-mediated signaling pathway’,
‘response to other organism’, ‘response to external biotic
stimulus’, ‘cellular response to organic substance’, ‘platelet
aggregation’, ‘cell surface receptor signaling pathway’, ‘platelet
degranulation’ and ‘regulation of substrate adhesion-dependent cell
spreading’. The 60 downregulated hypermethylated genes were
significantly enriched in ‘positive regulation of macro-autophagy’,
‘regulation of macroautophagy’, ‘regulation of anoikis’,
‘regulation of TOR signaling’, ‘maintenance of protein location’,
‘negative regulation of macroautophagy’, ‘cellular zinc ion
homeostasis’, ‘positive regulation of autophagy’ and ‘positive
regulation of TOR signaling’. Regarding the KEGG pathways (Fig. 4C and D), the 45 upregulated
hypomethylated genes were significantly enriched in ‘fatty acid
metabolism’, ‘biosynthesis of unsaturated fatty acids’, ‘fructose
and mannose metabolism’, ‘acute myeloid leukemia’, ‘PPAR signaling
pathway’, ‘leishmaniasis’, ‘regulation of actin cytoskeleton’,
‘Staphylococcus aureus infection’, ‘hematopoietic cell
lineage’ and ‘amoebiasis’. The 60 downregulated hypermethylated
genes were significantly enriched in ‘longevity regulating
pathway’, ‘Epstein-Barr virus infection’, ‘ferroptosis’, ‘signaling
pathways regulating the pluripotency of stem cells’, ‘endometrial
cancer’, ‘basal cell carcinoma’, ‘acute myeloid leukemia’,
‘glioma’, ‘B-cell receptor signaling pathway’ and ‘complement and
coagulation cascades’. The genes associated with the pathways in
Fig. 4 are presented in Table VI.
| Table VI.Pathways and their associated
genes. |
Table VI.
Pathways and their associated
genes.
| Pathway | Genes |
|---|
| Acute myeloid
leukemia | ITGAM, PIK3CA,
TCF7 |
| B cell receptor
signaling pathway | CR2, LYN,
PIK3CA |
| Longevity
regulating pathway | CAMK4, PIK3CA,
SESN3 |
| Fructose and
mannose metabolism | GMDS, SORD |
| Regulation of actin
cytoskeleton | DIAPH2, ITGAM,
PIK3CA, VCL |
| Ferroptosis | CYBB, SLC39A8 |
| Signaling pathways
regulating pluripotency of stem cells | ID3, PIK3CA,
TCF7 |
| Fatty acid
metabolism | CPT1A, FADS1 |
| Endometrial
cancer | PIK3CA, TCF7 |
| Basal cell
carcinoma | SUFU, TCF7 |
| Necroptosis | CHMP7, CYBB,
ZBP1 |
| Glioma | CAMK4, PIK3CA |
| Leishmaniasis | CYBB, ITGAM |
| Epstein-Barr virus
infection | CR2, LYN,
PIK3CA |
| TGF-beta signaling
pathway | ID3, TFDP1 |
| cAMP signaling
pathway | ADRB2, CAMK4,
PIK3CA |
| Hematopoietic cell
lineage | CR2, ITGAM |
| Defense response to
other organism | BNIP3L, C1R, CD244,
CR2, CYBB, FLNA, GBP1, ITGAM, KLRG1, LYN, SIGLEC10, ZBP1 |
| Positive regulation
of macroautophagy | ADRB2, BNIP3L,
SESN3, SMCR8 |
| Defense
response | BNIP3L, C1R, CAMK4,
CD244, CR2, CYBB, FLNA, GBP1, IGFBP4, ITGAM, KLRG1, LYN, SIGLEC10,
ZBP1 |
| Innate immune
response | C1R, CD244, CR2,
CYBB, GBP1, ITGAM, KLRG1, LYN, SIGLEC10, ZBP1 |
| Positive regulation
of autophagosome maturation | ADRB2, SMCR8 |
| Positive regulation
of integrin-mediated signaling pathway | FLNA, LIMS1 |
| Regulation of
macroautophagy | ADRB2, BNIP3L,
PIK3CA, SESN3, SMCR8 |
| Anoikis | PIK3CA, TFDP1 |
| Positive regulation
of autophagy | ADRB2, BNIP3L,
SESN3, SMCR8 |
| Regulation of
substrate adhesion-dependent cell spreading | FLNA, GBP1,
LIMS1 |
| Response to other
organism | BNIP3L, C1R, CD244,
CR2, CYBB, FLNA, GBP1, ITGAM, KLRG1, LYN, SIGLEC10, ZBP1 |
| Response to
external biotic stimulus | BNIP3L, C1R, CD244,
CR2, CYBB, FLNA, GBP1, ITGAM, KLRG1, LYN, SIGLEC10, ZBP1 |
| Cellular response
to organic substance | ADRB2, CPT1A, CYBB,
EHD1, FLNA, GBP1, ID3, ITGAM, LIMS1, LYN, MAP4K1, OSM, PIK3CA,
PTPN12, SESN3, TCF7, TGFBR3 |
| Regulation of TOR
signaling | PIK3CA, SESN3,
SMCR8 |
| Cell surface
receptor signaling pathway | ADRB2, CR2, CYBB,
FLNA, GBP1, GMDS, ITGAM, KLRG1, LIMS1, LYN, OSM, PIK3CA, PTPN12,
SUFU, TCF7, TGFBR3 |
| Negative regulation
of macroautophagy | PIK3CA, SMCR8 |
| Positive regulation
of TOR signaling | PIK3CA, SMCR8 |
| Platelet
degranulation | FLNA, LYN, VCL |
| Platelet
aggregation | FLNA, VCL |
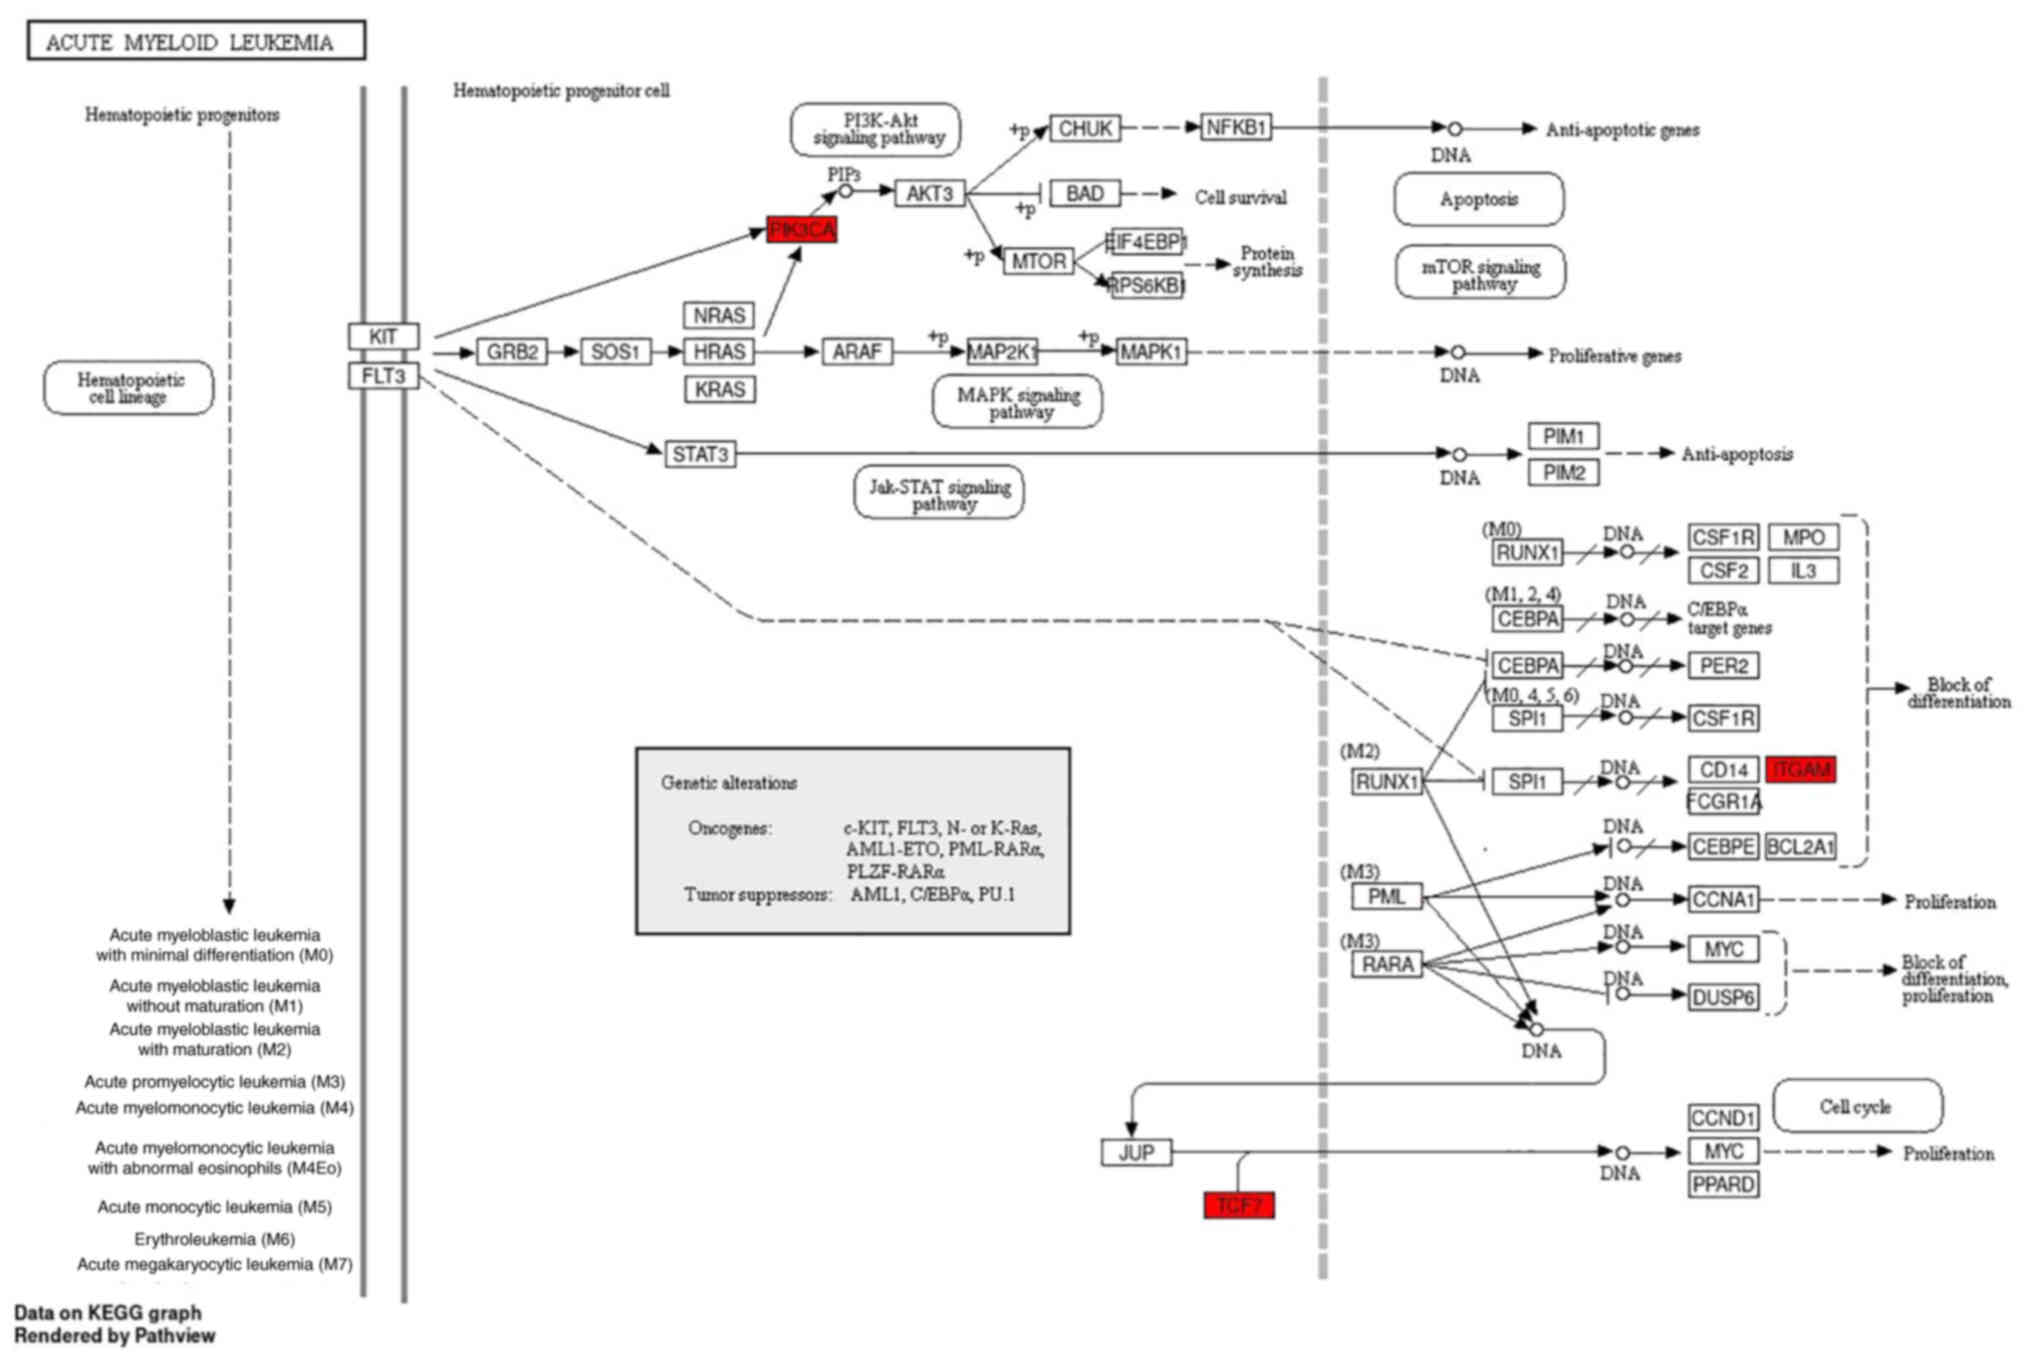
The significantly enriched pathways in the KEGG
analysis were visualized using the pathview package (https://pathview.uncc.edu/). The AML signaling
pathways include the MAPK, Jak-STAT, PI3K-Akt and mTOR pathways, as
shown in Fig. 5. Notably, TCF7,
ITGAM and PIK3CA participate in the ‘acute myeloid leukemia’
signaling pathway (Table VI).
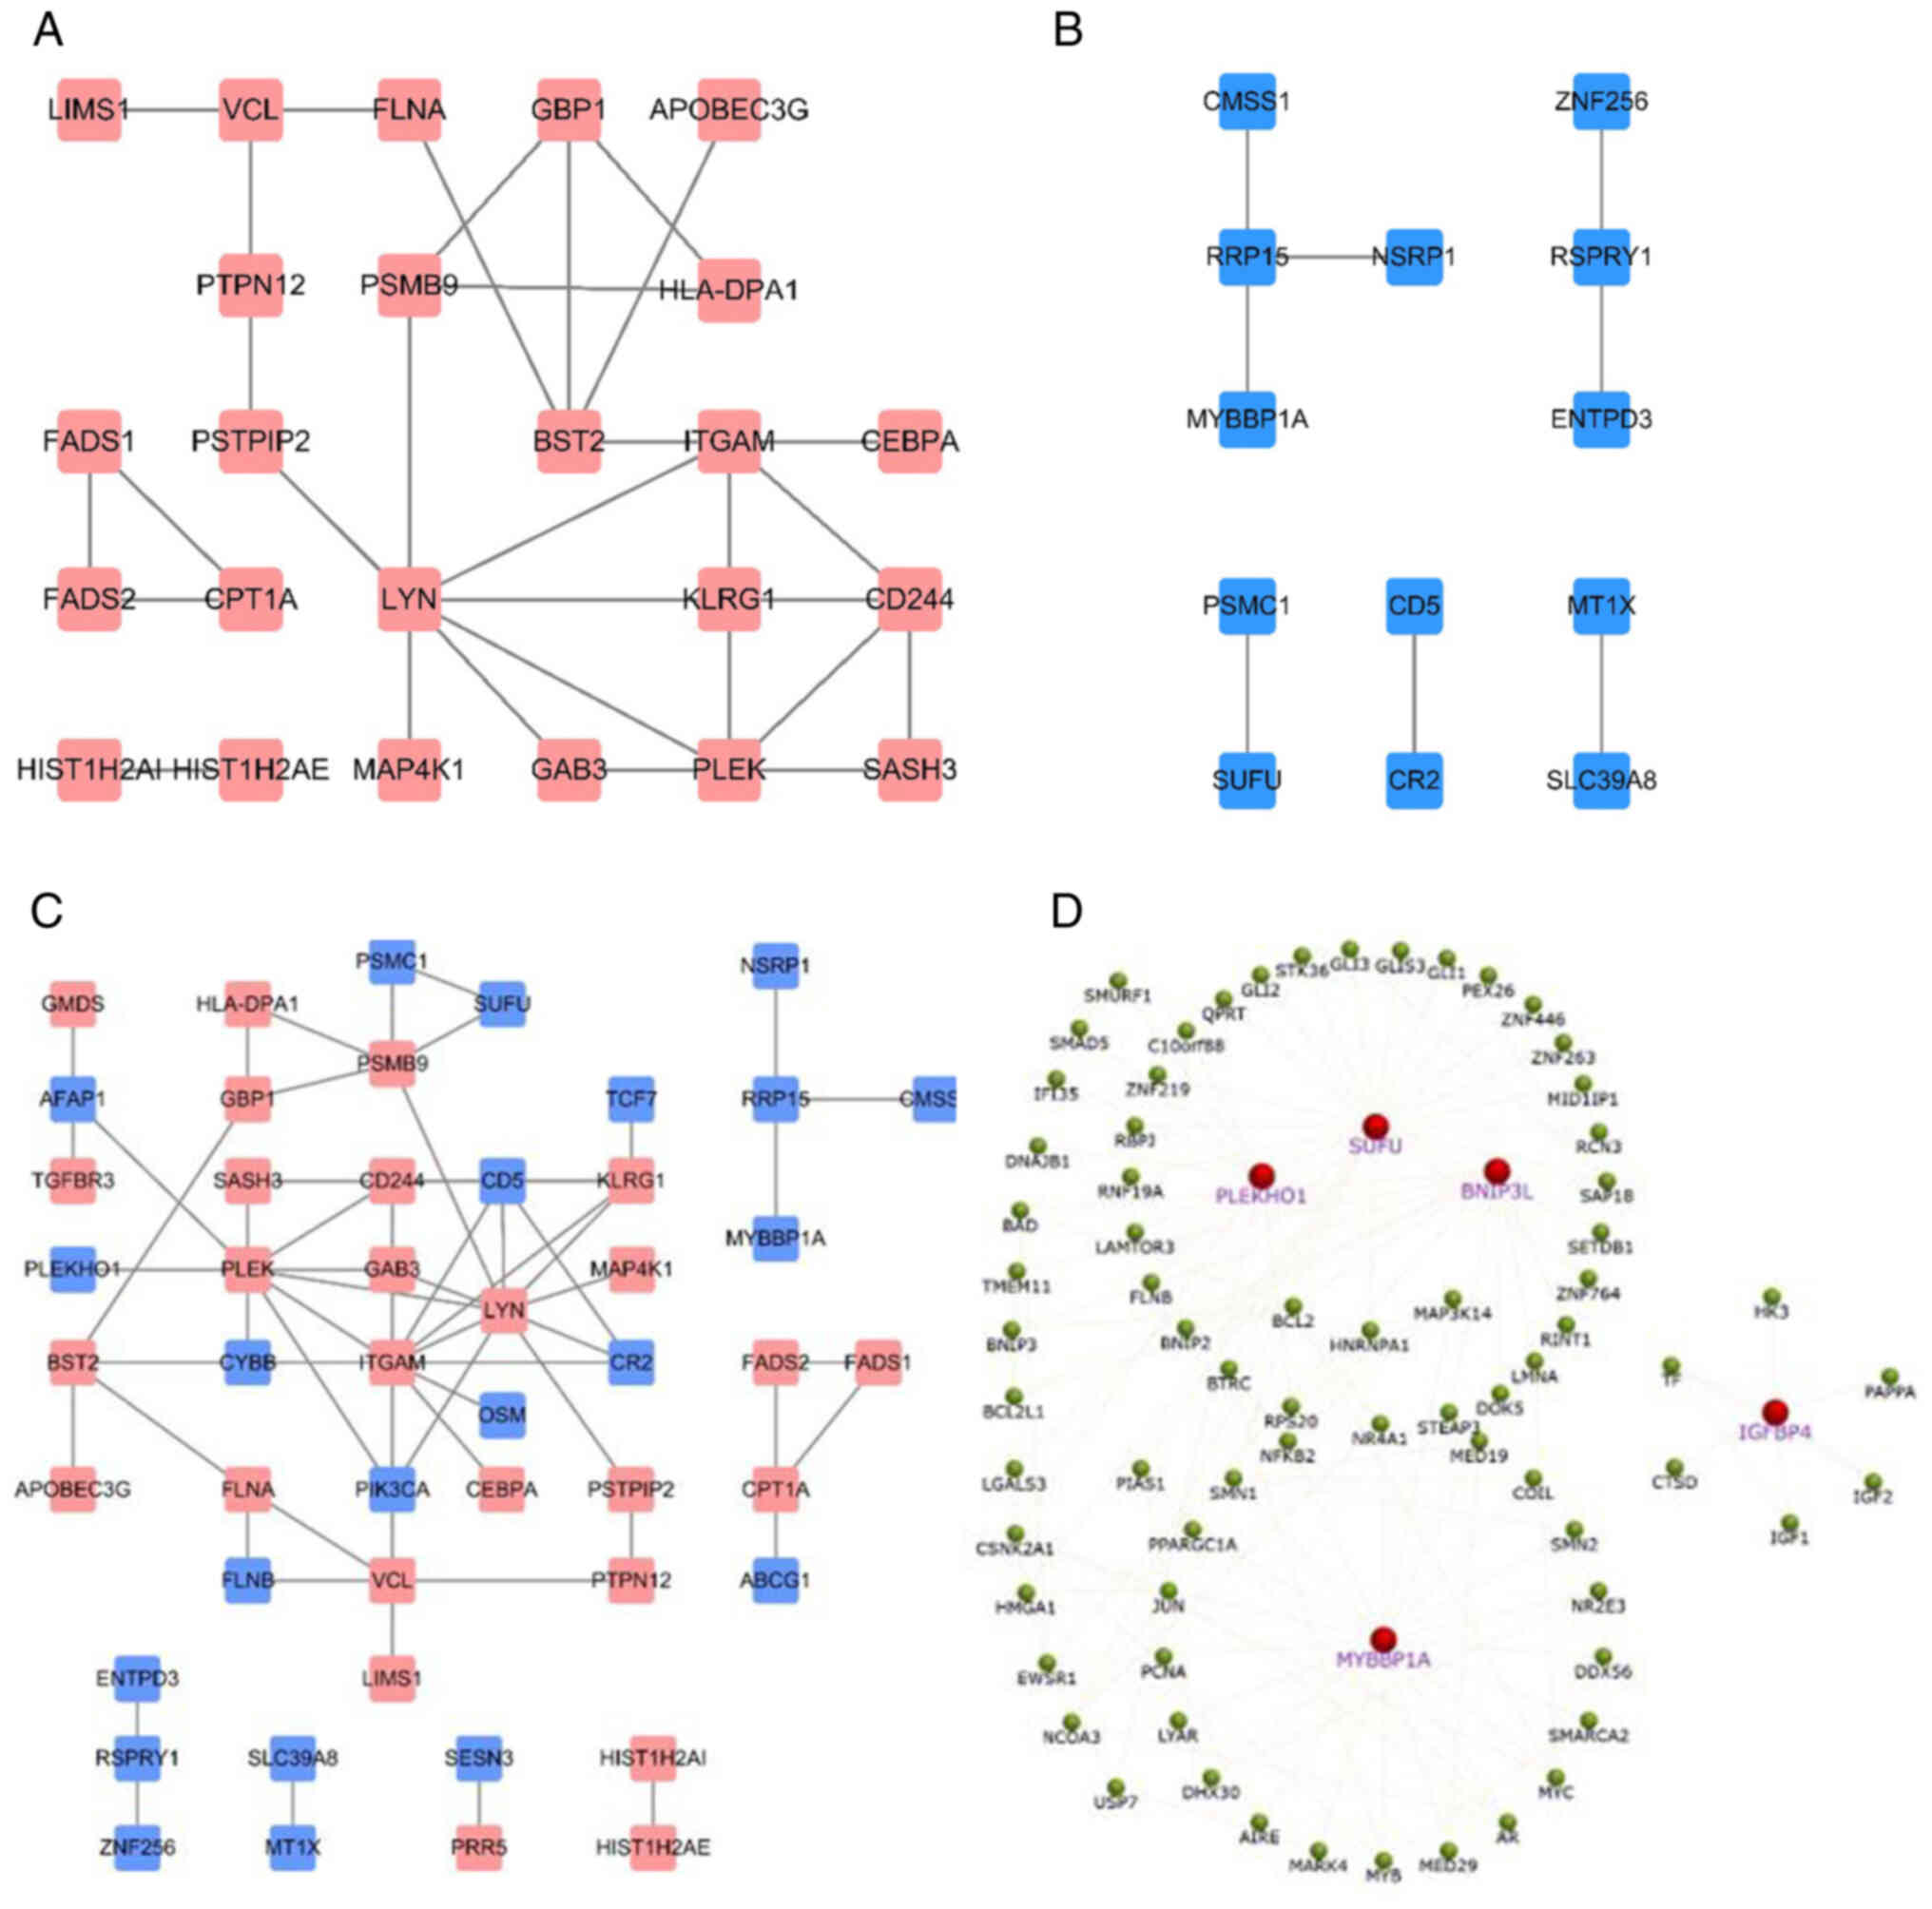
PPI network construction
The online STRING database was utilized to construct
PPI networks. For the 45 upregulated hypomethylated genes, the PPI
network involved 45 nodes and 31 edges and showed significant PPI
enrichment (P=4.02×10⁻⁸; Fig. 6A). For the 60 downregulated
hypermethylated genes, the PPI network involved 13 nodes and 8
edges, but the PPI enrichment was not found to be significant
(P=79.3; Fig. 6B). The PPI network
of the combination of 45 upregulated hypomethylated genes and 60
downregulated hypermethylated genes is shown, with significant PPI
enrichment (P=6.28×10⁻⁴; Fig. 6C). Finally, the PPI network of all
five downregulated hypermethylated TSGs (PLEKHO1, IGFBP4, BNIP3L,
SUFU and MYBBP1A) was constructed, along with their associated
genes, to assess their biological functions in the network
(Fig. 6D).
Validation of the selected DEGs
The data obtained by integrated bioinformatics
analysis were validated using blood samples collected from
patients. RT-qPCR was used to assess the levels of the 15 DEGs
(TCF7, CHMP7, PIK3CA, SLC39A8, CYBB, ID3, CAMK4, SUFU, PLEKHO1,
BNIP3L, VCL, ZBP1, TFDP1, ITGAM and ADRB2), 10 of which were
downregulated and hypermethylated and 5 of which were upregulated
and hypomethylated according to the bioinformatics analysis. The
results of the RT-qPCR analysis indicated that the expression
levels of 6 genes, namely CAMK4, CYBB, SLC39A8, SUFU and TCF7,
matched the bioinformatics data, being significantly lower
(P<0.05) in the AML samples compared with the control samples.
Strong associations between the RT-qPCR results and the
bioinformatics data were observed. Nevertheless, the expression
levels of ITGAM and VCL did not correspond with those in the
bioinformatics analyses; ITGAM and VCL were upregulated in AML in
the bioinformatics analysis but significantly downregulated
(P<0.05) in the AML samples compared with the control samples.
The remaining eight genes (PIK3CA, BNIP3L, PLEKHO1, ADRB2, CHMP7,
ID3, TFDP1 and ZBP1) did not exhibit statistically significant
differences between the patients with AML and the controls
(Fig. 7). Regarding the
methylation status of the promoters of the six DEGs assessed using
next-generation sequencing-based bisulfite sequencing/PCR (Table SI), the methylation status of
CAMK4 promoters was higher in patients with AML compared with the
healthy controls (P<0.05), which was consistent with the
bioinformatics analysis, while the four genes CYBB, SLC39A8, SUFU
and VCL did not exhibit statistically significant differences
between the patients with AML and the healthy controls (Fig. 8). It was also observed that the
methylation status of ITGAM promoters in the samples did not
correspond with that in the bioinformatics analyses; the
bioinformatics analysis indicated that ITGAM was hypomethylated,
whereas the TBS data showed that ITGAM was significantly
hypermethylated in patients with AML compared with the healthy
controls (P<0.05).
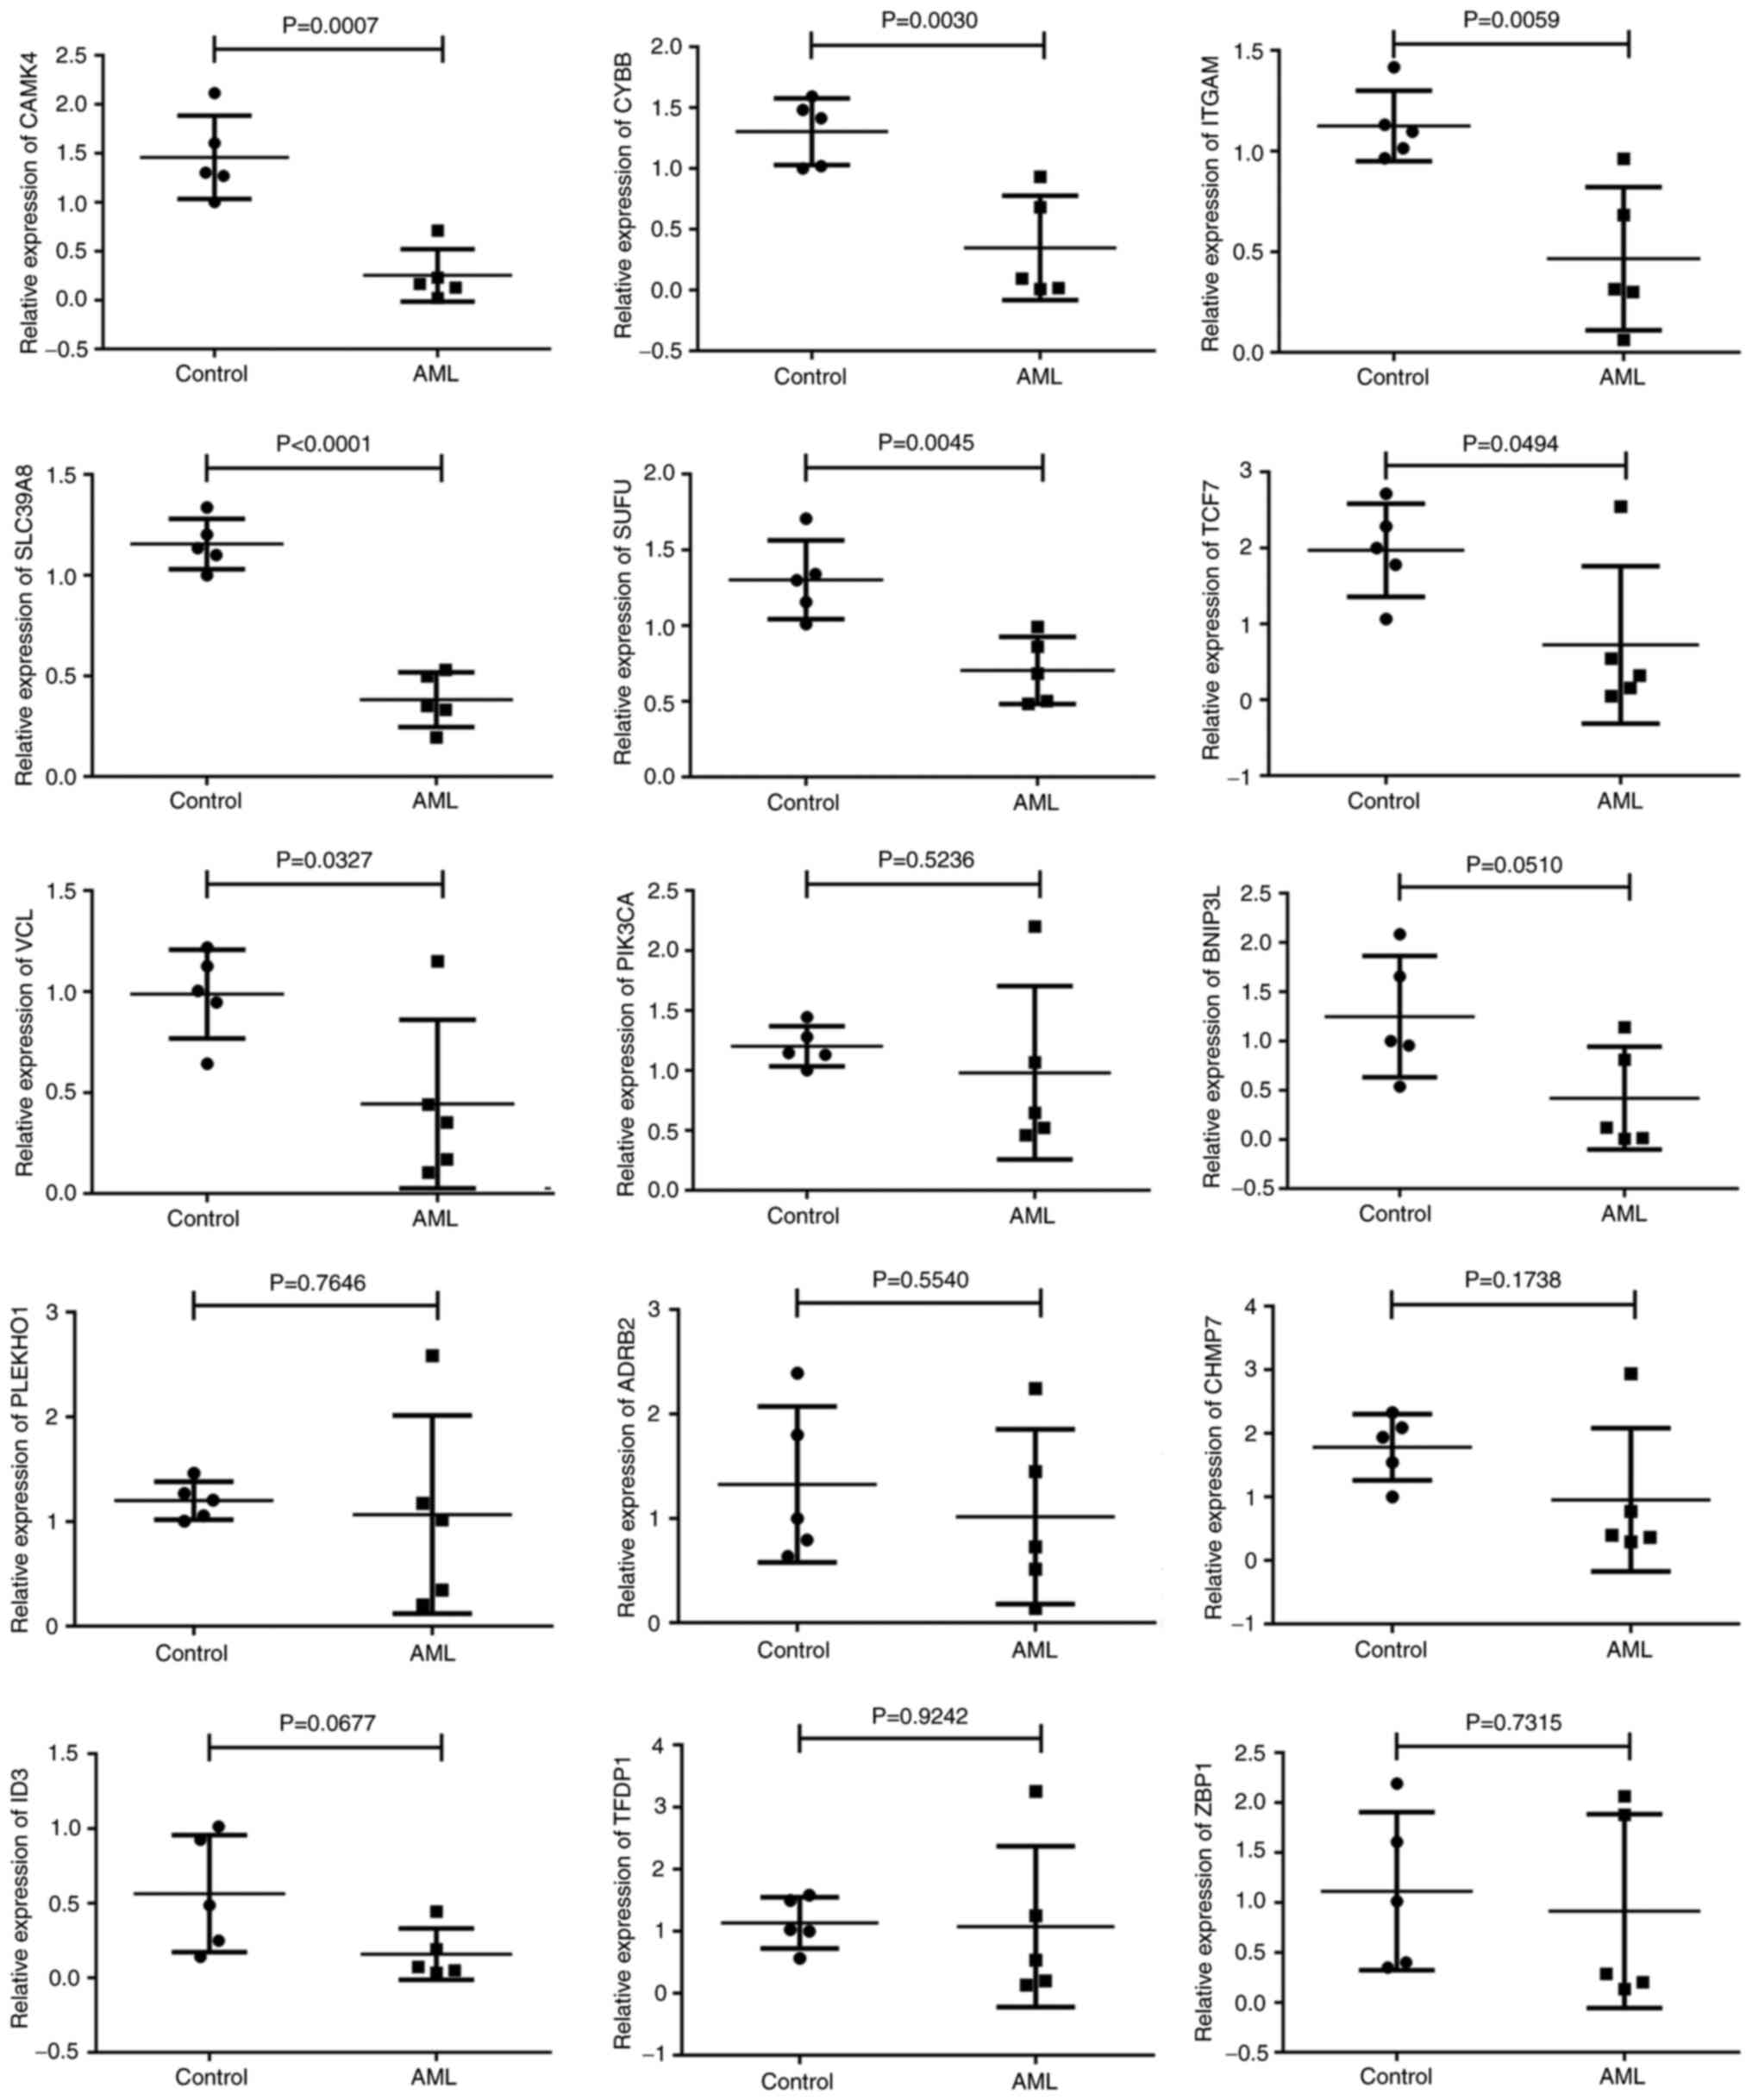 | Figure 7.Validation of gene expression results
in clinical samples. Scatter diagrams of the expression of 15 genes
in normal and AML samples using reverse transcription-quantitative
PCR. AML, acute myeloid leukemia. CAMK4, calcium/calmodulin
dependent protein kinase IV; CYBB, cytochrome B-245 β chain; ITGAM,
integrin α M; SCL39A8, solute carrier family 39 member 8; SUFU,
SUFU negative regulator of Hedgehog signaling; TCF7, transcription
factor 7; VCL, vinculin; PIK3CA,
phosphatidylinositol-4,5-bisphosphonate 3-kinase catalytic subunit
α; BNIP3L, BCL2 interacting protein 3 like; PLEKHO1, pleckstrin
homology domain containing O1; ADRB2, adrenoceptor β 2; CHMP7,
charged multivesicular body protein 7; ID3, inhibitor of DNA
binding 3, HLH protein; TFDP1, transcription factor Dp-1; ZBP1,
Z-DNA binding protein 1, transcription factor Dp-ZBP1. |
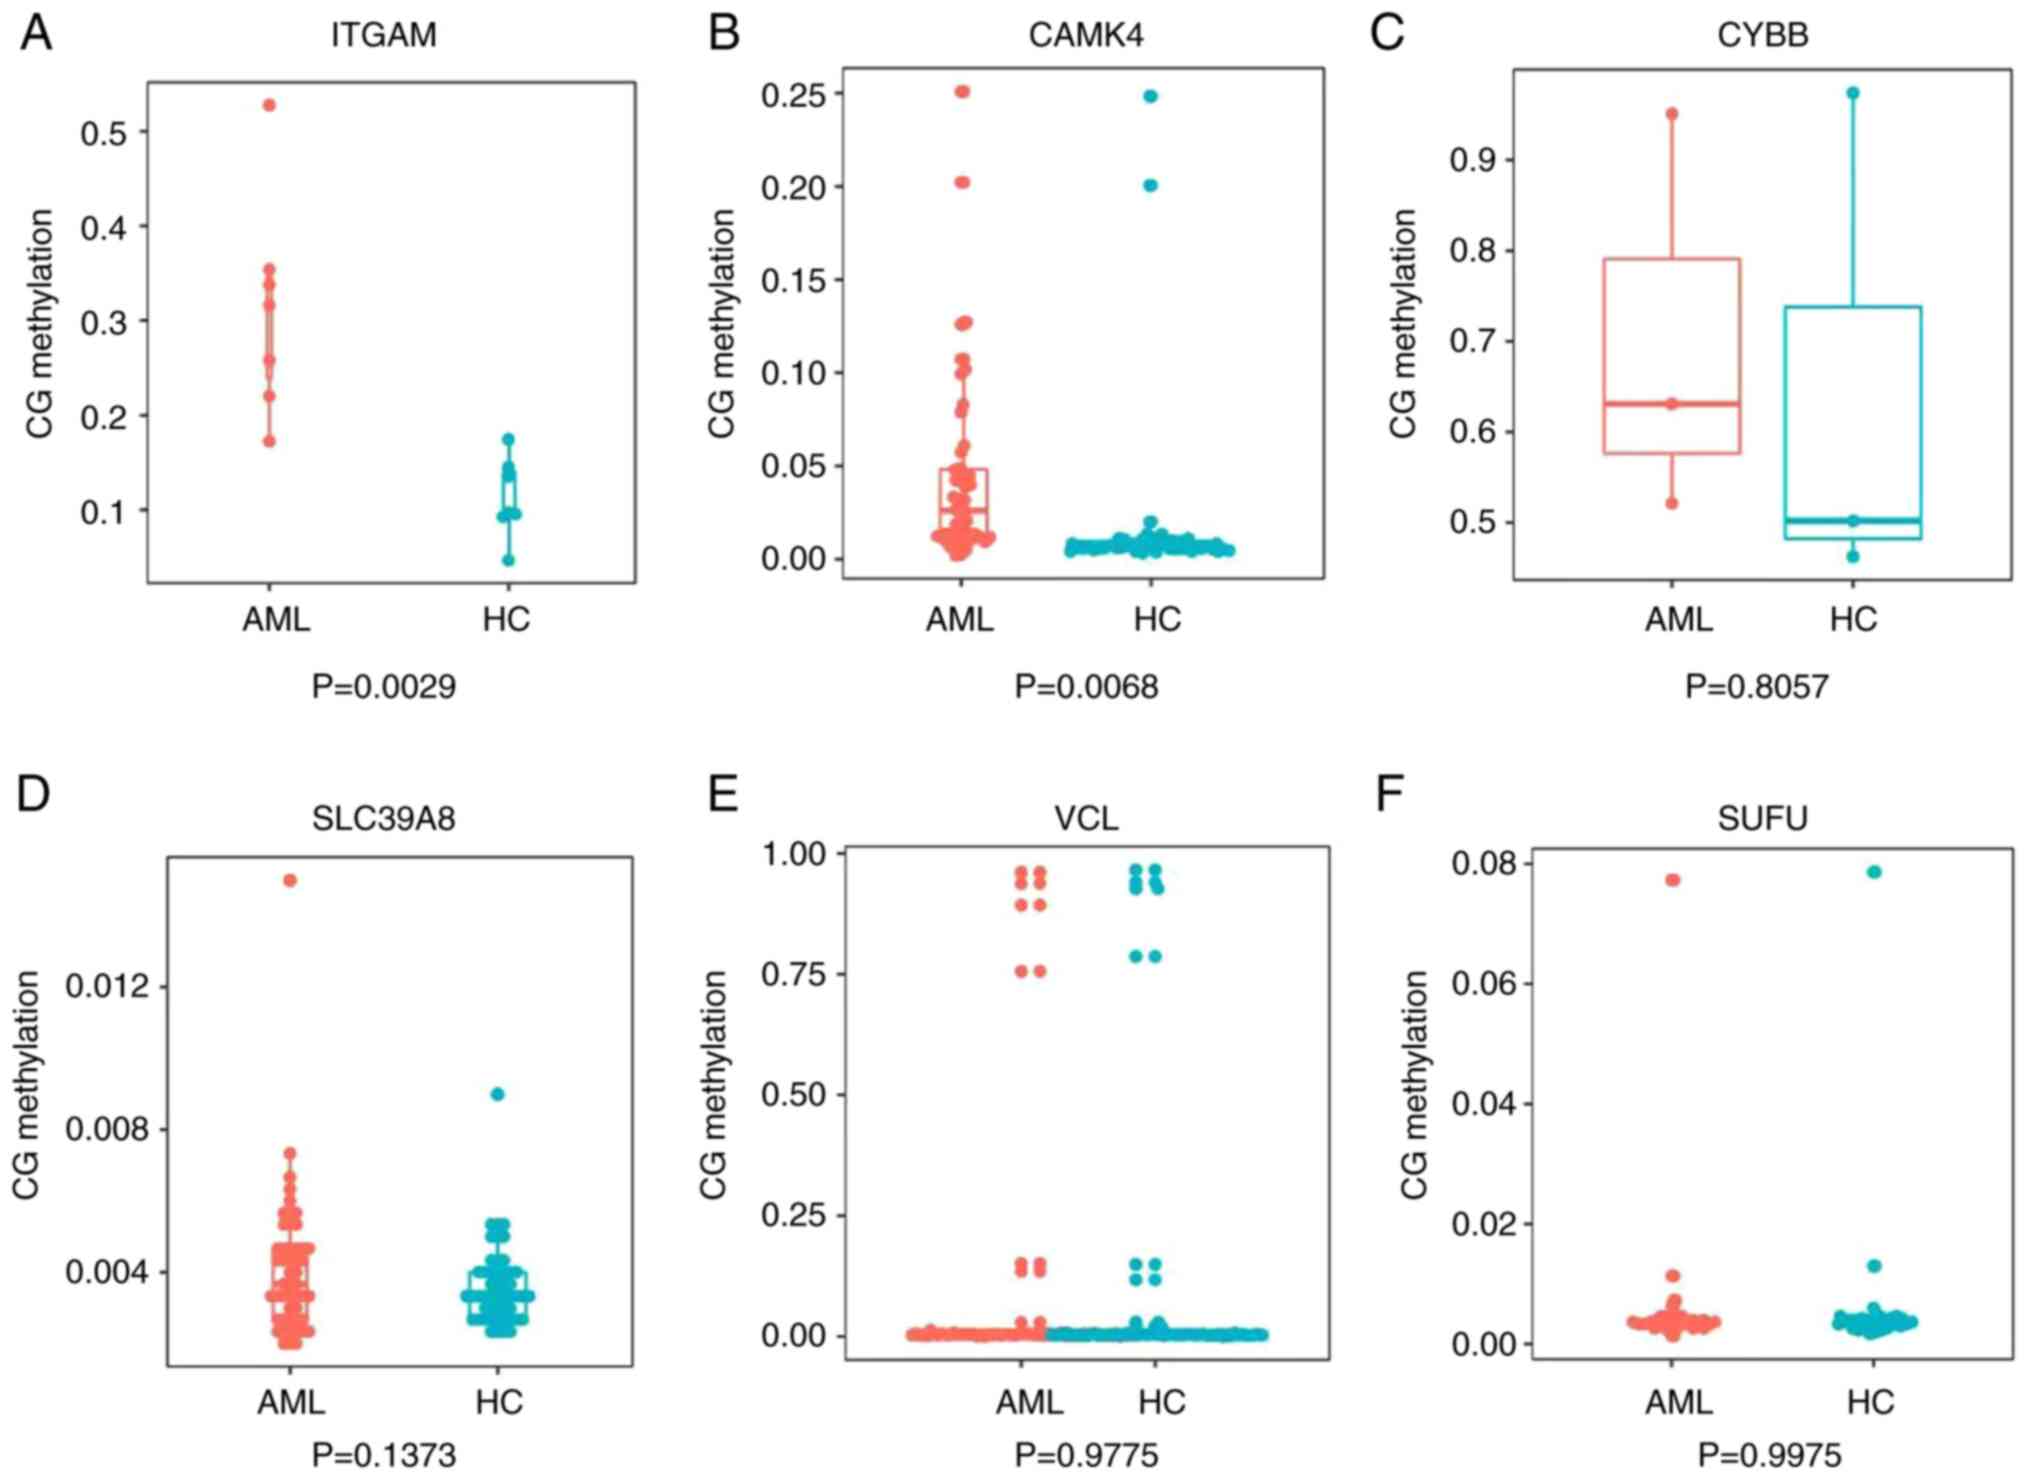 | Figure 8.Validation of gene methylation
results. Box plots showing the methylation status in the promoters
of six genes obtained using next-generation sequencing-based
bisulfite sequencing/PCR. (A) ITGAM, (B) CAMK4, (C) CYBB, (D)
SCL39A8, (E) VCL and (F)SUFU. ITGAM, integrin α M; CAMK4,
calcium/calmodulin dependent protein kinase IV; CYBB, cytochrome
B-245 β chain; SCL39A8, solute carrier family 39 member 8; VCL,
vinculin; SUFU, SUFU negative regulator of Hedgehog signaling. |
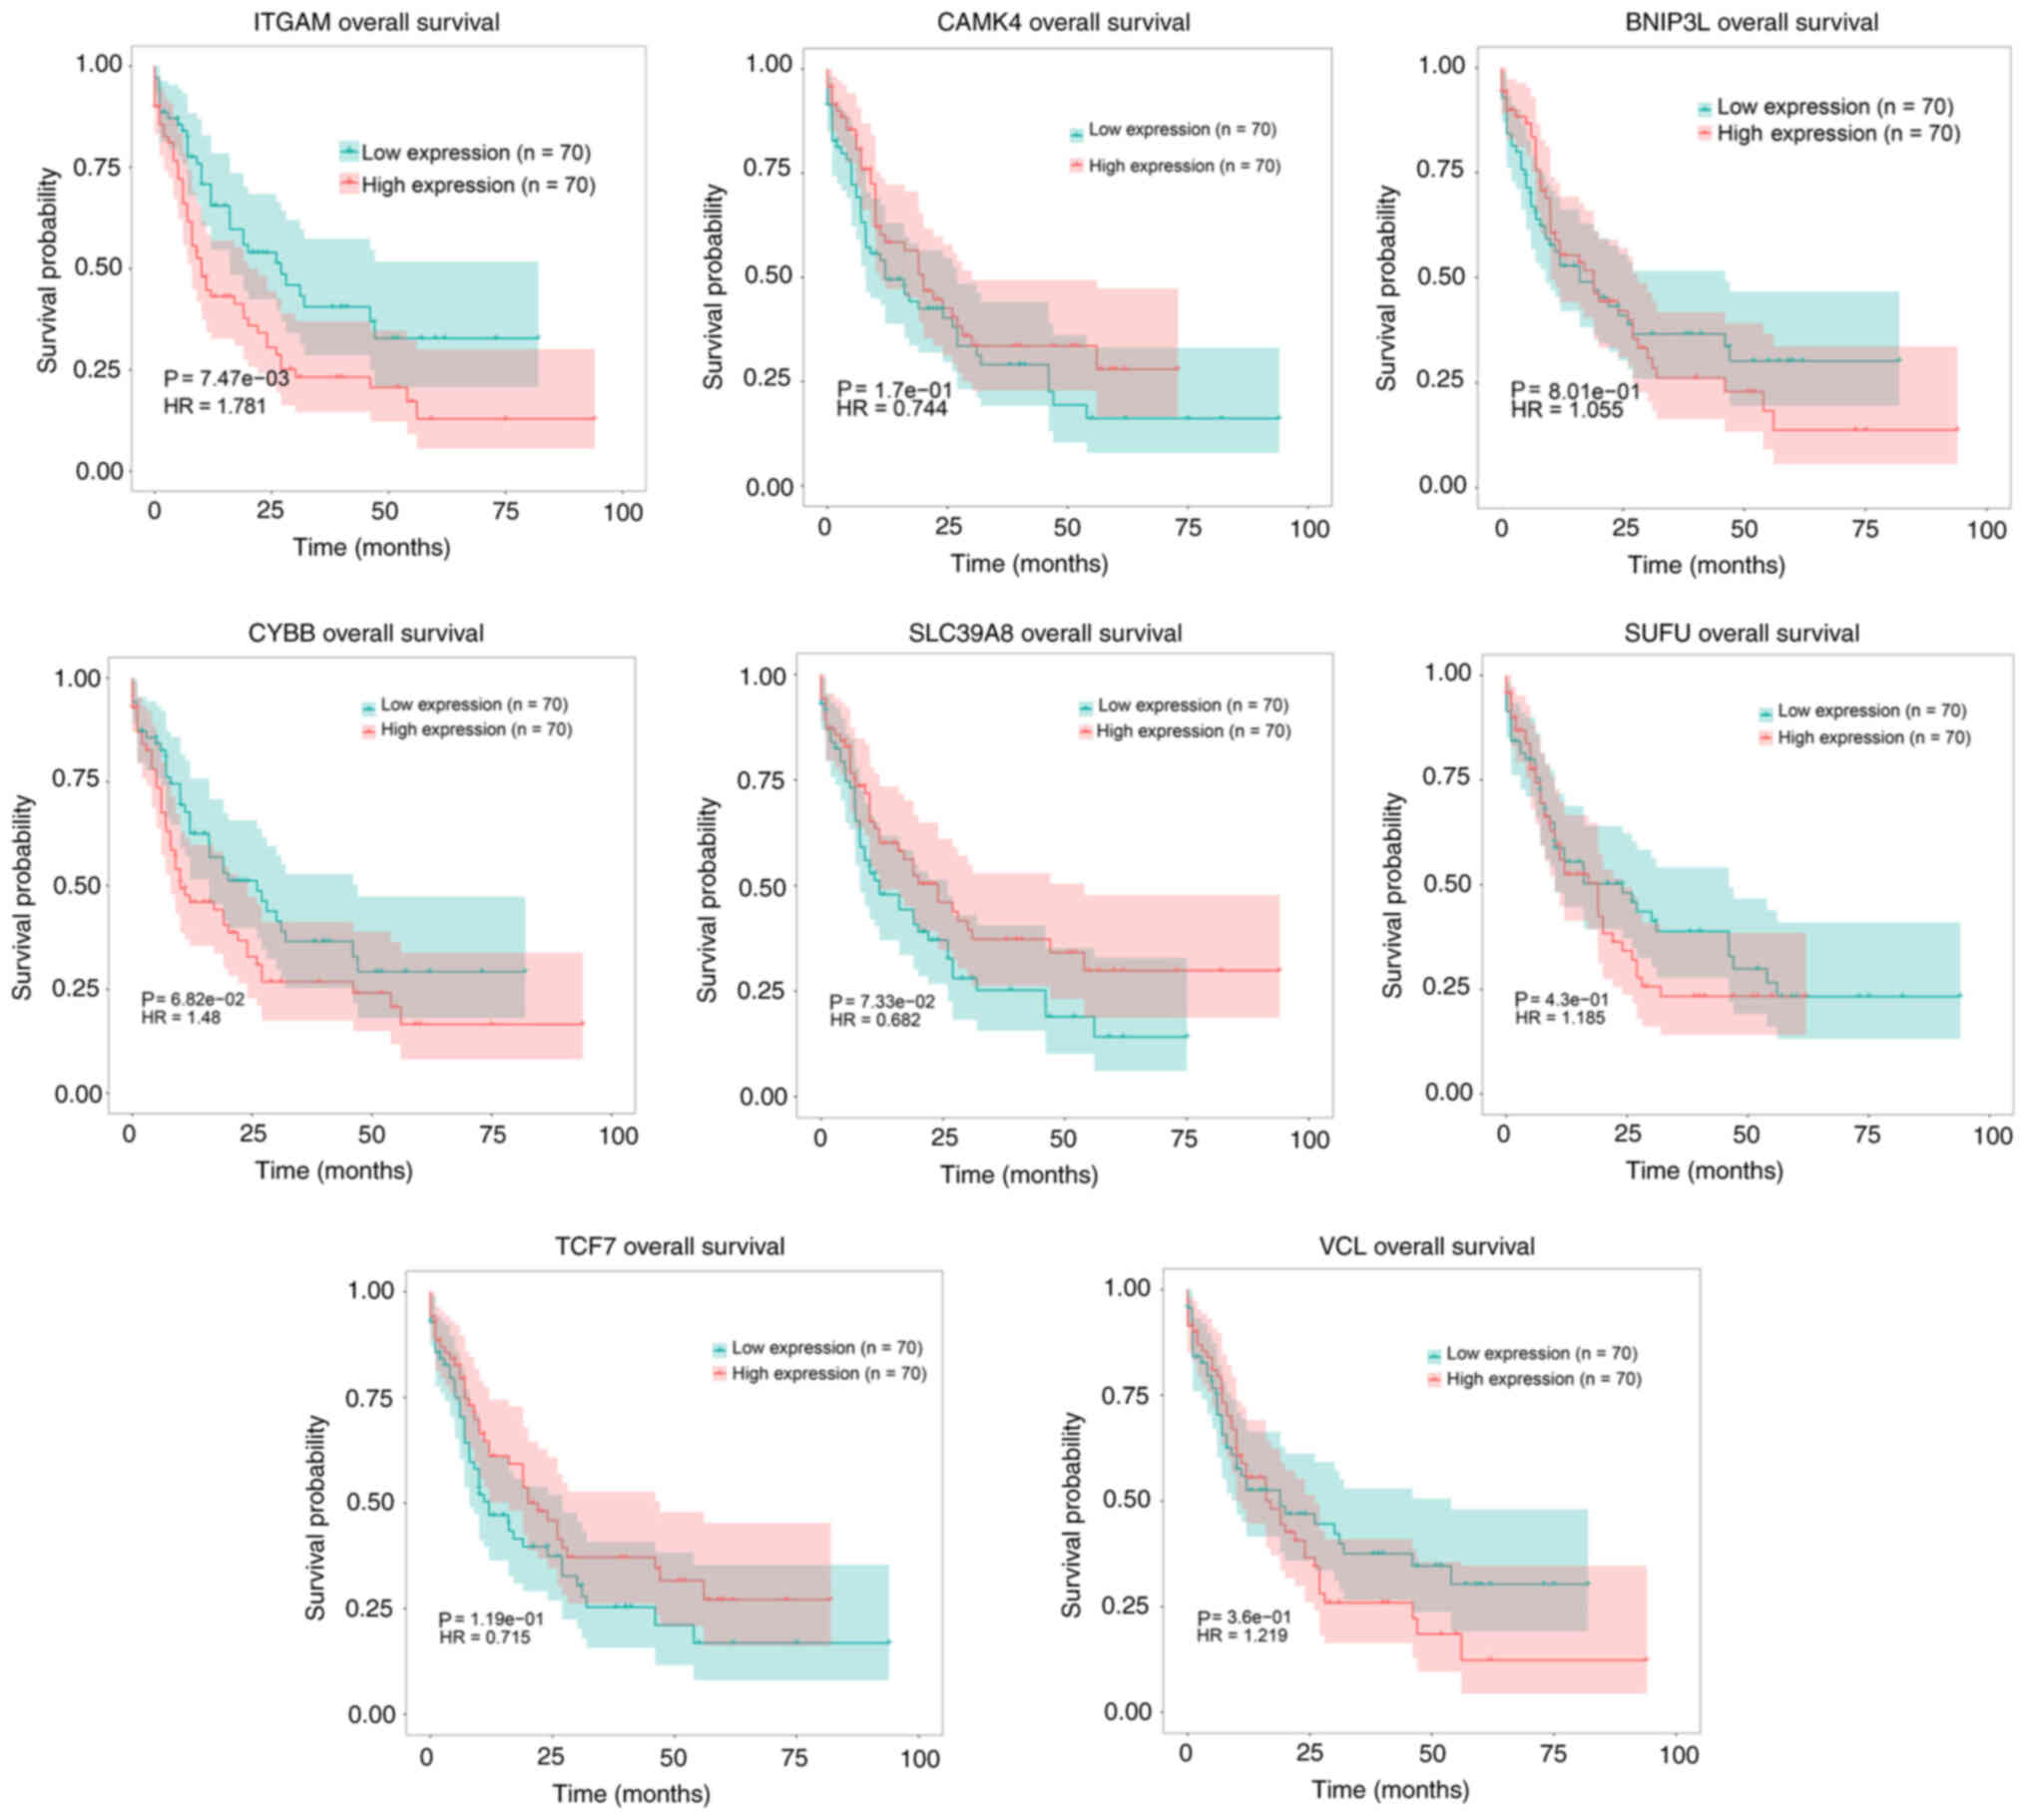
Survival analysis
To assess the associations between the AML survival
rates and DEGs, a survival analysis using TCGA data was performed.
Kaplan-Meier survival curves were constructed for high and low
expression subgroups for six downregulated hypermethylated genes
(TCF7, SLC39A8, CYBB, SUFU, BNIP3L and CAMK4) and two upregulated
hypomethylated genes (VCL and ITGAM). The gene expression subgroups
were compared using log-rank tests. The results revealed that
upregulated ITGAM, BNIP3L, CYBB and VCL, as well as downregulated
CAMK4 and TCF7, were associated with a low probability of survival
in patients with AML; however, downregulated ITGAM, BNIP3L, CYBB
and VCL, as well as upregulated CAMK4 and TCF7, were associated
with a high probability of survival in patients with AML. At the
same time, it was found that upregulated SLC39A8, as well as
downregulated SUFU, were associated with a high probability of
survival in patients with AML, and downregulated SLC39A8, as well
as upregulated SUFU, were associated with a low probability of
survival in patients with AML (Fig.
9).
TCF7 and ITGAM overexpression inhibits
while CAMK4 and TCF7 downregulation increases cell proliferation
without affecting cell apoptosis
To further investigate the effects of certain genes,
ITGAM, TCF7 and CAMK4 were overexpressed or knocked down in HL60
cells (Figs. S1 and S2). Subsequently, HL60 cell
proliferation was analyzed, and the results revealed that the
overexpression of TCF7 and ITGAM significantly suppressed cell
proliferation (Fig. 10A and B).
However, the overexpression of CAMK4 did not have a significant
effect on HL60 cell proliferation (Fig. 10C). The downregulation of CAMK4
and TCF7 significantly increased cell proliferation (Fig. 10D and E), but the downregulation
of ITGAM had no significant effect on cell proliferation (Fig. 10F). The apoptotic percentages of
the HL60 cells were also measured. Flow cytometric results
indicated that neither the overexpression nor the downregulation of
TCF7, ITGAM and CAMK4 induced cell apoptosis (Fig. 11).
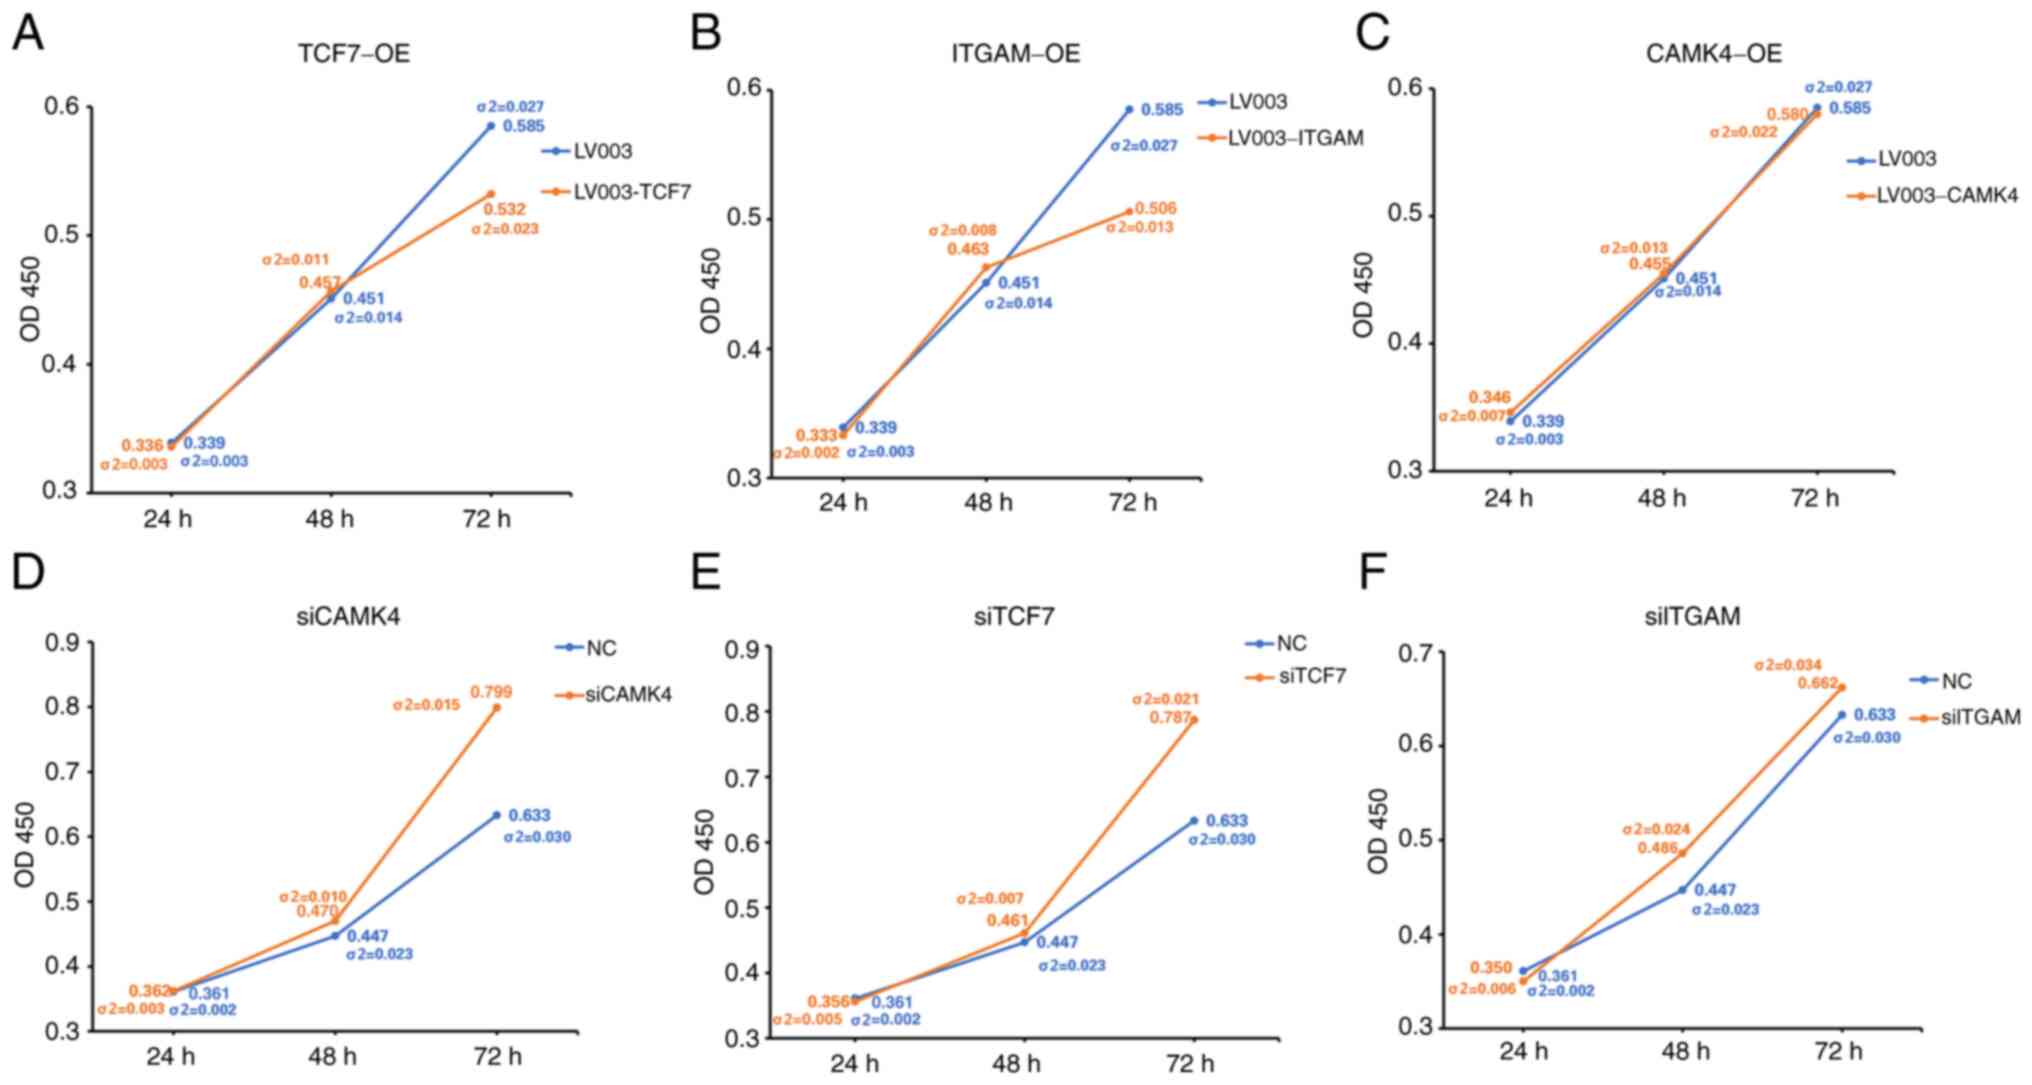 | Figure 10.Viability of HL60 cells with gene
overexpression or knockdown. Viability of HL60 cells with
overexpression of (A) TCF7, (B) ITGAM and (C) CAMK4 or knockdown of
(D) CAMK4, (E) TCF7 and (F) ITGAM. (A), (B), (D) and (E)
σ2<0.05. σ2-values were determined using the unpaired t-tests.
Each time point for each group has two values. One value is the
mean OD measurement, and the other (σ2) the standard deviation.
TCF7, transcription factor 7; ITGAM, integrin α M; CAMK4,
calcium/calmodulin dependent protein kinase IV; OE, overexpression;
OD450, optical density at 450 nm. |
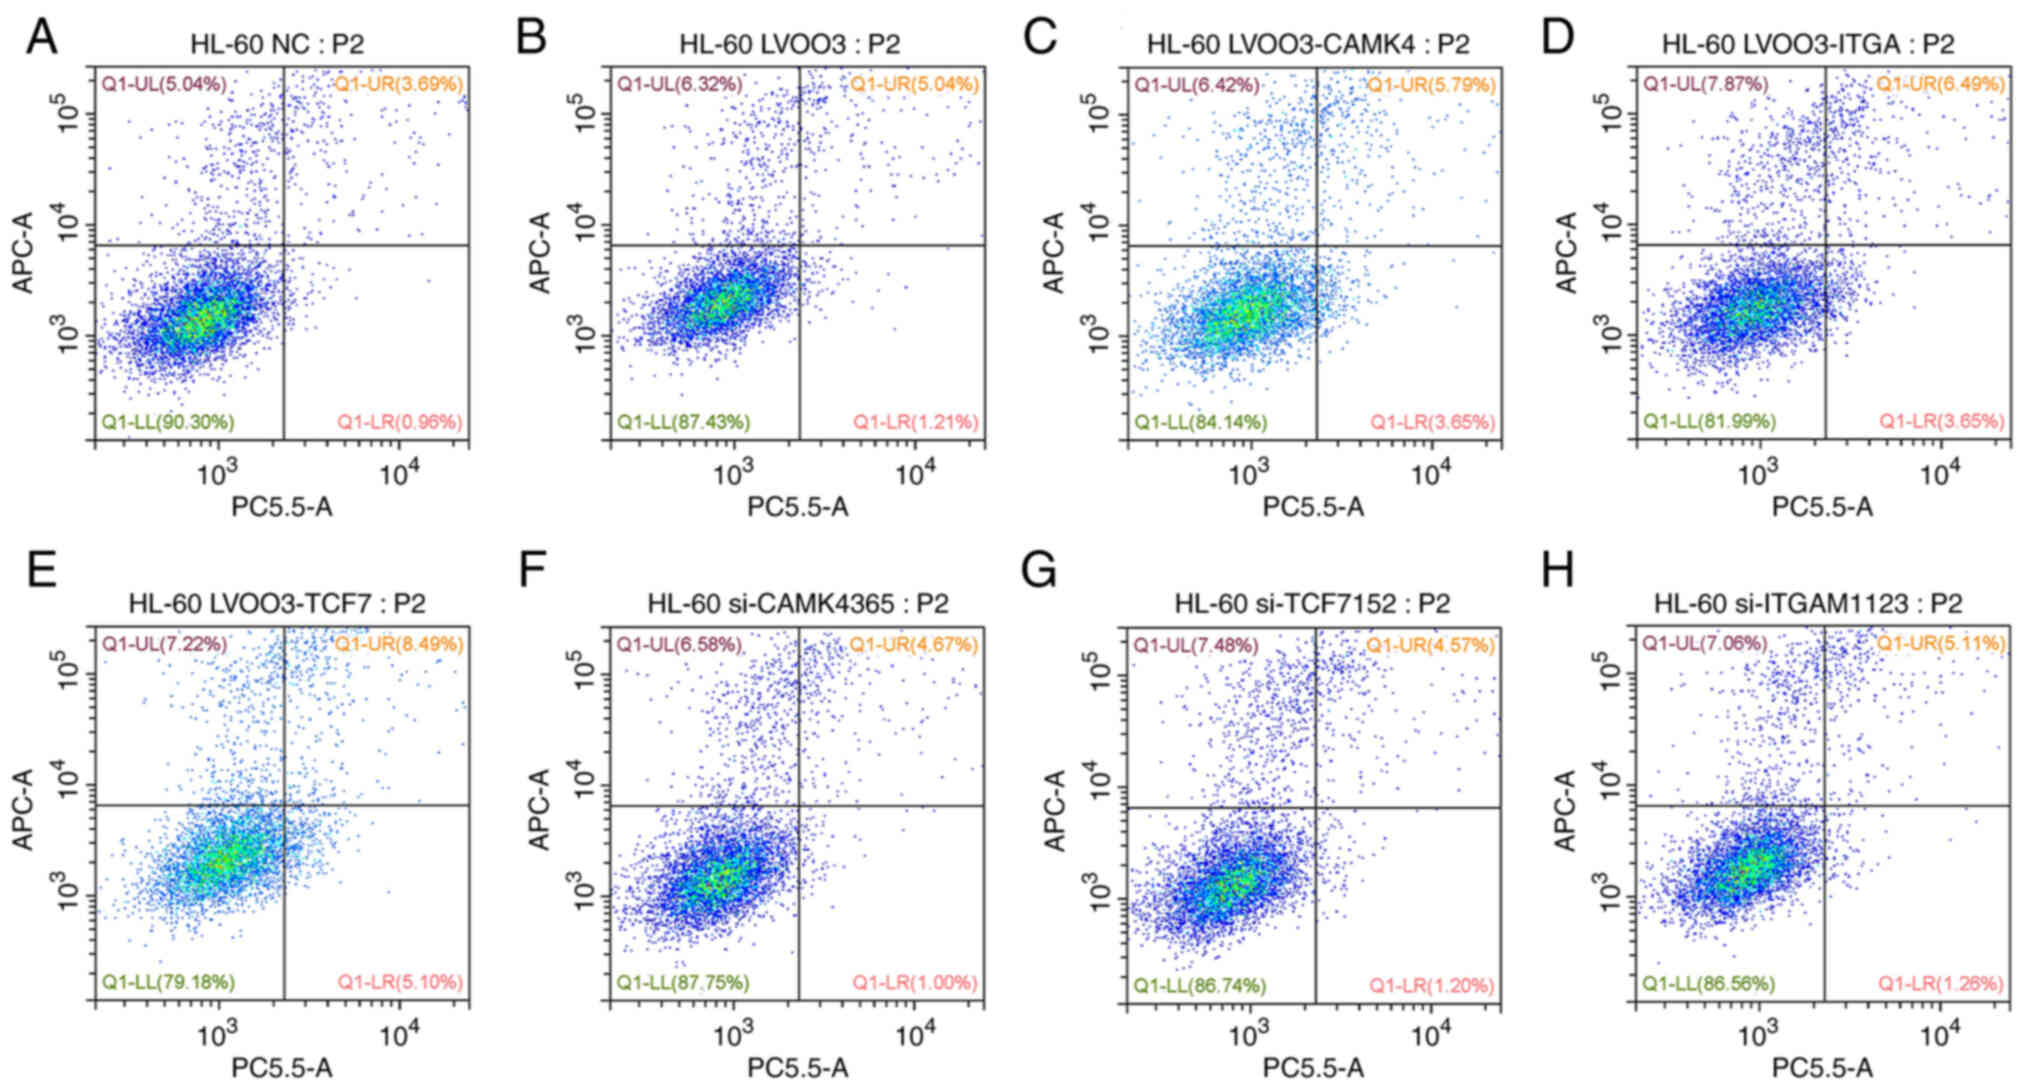 | Figure 11.Apoptosis of HL60 cells with gene
expression or knockdown. Flow cytometry plots for cells transfected
with (A) NC, (B) LV003 empty vector control, (C) CAMK4
overexpression vector, (D) ITGAM overexpression vector, (E) TCF7
overexpression vector, (F) si-CAMK4, (G) si-TCF7 and (H) si-ITGAM.
NC, negative control siRNA; si, small interfering; CAMK4,
calcium/calmodulin dependent protein kinase IV; ITGAM, integrin α
M; TCF7, transcription factor 7. |
Discussion
In the present study, the NCBI GEO database was used
to obtain gene expression and methylation profiles on patients with
AMI. In total, four gene expression profile datasets, namely
GSE109179, GSE142699, GSE49665 and GSE14772, and one gene
methylation profile dataset, namely GSE42042, were acquired from
the NCBI GEO database. R software is an important tool for
analyzing microarray data, as it can be used to compare different
groups of samples and identify genes that are differentially
expressed under various conditions. Additionally, bioinformatics
analyses of the mechanisms underlying AML occurrence and
development may provide findings useful in the diagnosis, treatment
and prognostic evaluation of patients with AML. Using
bioinformatics analyses, the present study identified no
hypomethylated oncogenes and five downregulated hypermethylated
TSGs in AML. Functional enrichment of differentially expressed and
methylated genes revealed that abnormal methylation influences
certain pathways and their hub genes. These data provide novel
perspectives on the pathogenic mechanisms of AML.
The enriched GO terms associated with the abnormally
methylated DEGs were found to be associated with control of the
immune response. The present study indicated that the upregulated
hypomethylated genes were significantly enriched in the ‘positive
regulation of macroautophagy’ and the ‘regulation of mTOR
signaling’ GO BPs. The mTOR signaling pathway participates in cell
apoptosis and autophagy (25),
which may influence the prognosis and progression of AML. The
downregulated hypermethylated genes were significantly enriched in
the ‘defense response to other organism’ and ‘innate immune
response’ GO BPs. KEGG pathway analysis revealed that the
upregulated hypomethylated genes were significantly enriched in the
‘longevity regulating pathway’. The enriched KEGG pathways were
also found to be associated with immunoregulation. These findings
may be relevant to the chemotherapy and other treatment measures
used for patients with AML.
Pathway mapping of the KEGG data demonstrated the
enrichment of aberrantly methylated DEGs in the regulation of AML
signaling pathways, including the MAPK, Jak-STAT, PI3K-Akt and mTOR
pathways. TCF7, ITGAM and PIK3CA participate in the ‘acute myeloid
leukemia’ signaling pathway, which has been recognized as a key
pathway in cancer (20). The
PI3K/AKT/mTOR pathway is considered crucial pathway in malignant
tumors as it is commonly beneficial to survival via the activation
of anti-apoptotic factors and the suppression of pro-apoptotic
factors; it plays a key role in tumor stem-cell self-renewal and
the resistance to radiotherapy or chemotherapy (21), which are considered to be the
fundamental reason for ineffective treatment and neoplasm
recurrence. The present data suggest the importance of these
pathways in AML; however, further research is required to validate
these data. The Jak-STAT pathway is a common pathway associated
with cytokine transduction, which is widely involved in cell
proliferation, differentiation, apoptosis and inflammation
(26). Further studies are
essential to validate the importance of the role of this pathway in
AML.
PPI networks were established based on the 105
abnormally methylated DEGs. The PPI network of the 45 upregulated
hypomethylated genes revealed that ITGAM was the most highly
interconnected node, and ITGAM was identified to be most enriched
in the ‘acute myeloid leukemia’ pathways. The PPI network of the 60
downregulated hypermethylated genes revealed that ribosomal RNA
processing 15 homolog (RRP15) was the most interconnected node,
with only three connected nodes. When all 105 genes were combined
into a PPI network, ITGAM and LYN were the top interconnected
nodes. The PPI network of the five downregulated hypermethylated
TSGs indicated that SUFU was the top interconnected node, and SUFU
was identified as mainly enriched in the ‘basal cell carcinoma’
pathway. TCF7, which was found to be the most connected gene in
this study (22), maps on the TCF
element in the AML pathway and participates in cell proliferation.
ITGAM represents the most connected node in the PPI network. ITGAM
is regarded as a flag for myeloid-derived suppressor cells that can
mediate tumor immune escape and treatment failure. It has been
evaluated in patients with AML, and a close association between
ITGAM overexpression and an unfavorable AML prognosis was
identified (5). Overall, the
findings are consistent with those of the present study, which
demonstrated an association between high ITGAM expression and an
unfavorable AML prognosis in the survival analysis. This result
requires confirmation in further experiments. The integrated
bioinformatics analyses revealed that ITGAM was upregulated and
hypomethylated, whereas the validation results showed that ITGAM
was downregulated and hypermethylated. Further research is required
to clarify these results. It has been reported that the
upregulation of PIK3CA may downregulate its target gene, PIK3R2,
which affects the PTEN/PIK3CA/AKT pathway and decreases the
proliferation, transplantation and aggression of tumor cells
(27). A previous study
demonstrated that signaling pathways in AML serve an essential role
in resistance to radiotherapy and chemotherapy and the self-renewal
capacity of tumor stem cells (28). The significance of the roles of the
aforementioned genes in AML may be interpreted on the basis of
known data. However, further research on these genes is warranted
to fully determine their roles in AML.
Seven major downregulated hypermethylated genes
identified in the bioinformatics analysis in the present study were
TCF7, CHMP7, PIK3CA, SLC39A8, CYBB, ID3 and CAMK4. These genes are
enriched in metabolic pathways that are associated with AML and
play a key role in PPI networks. CHMP7 has been found to be
unusually downregulated in spinal and bulbar muscular atrophy,
while SLC39A8 mutations can result in severe type II glycosylation
disease (29). Previous data
indicate that CYBB induces reactive oxygen species; the researchers
discovered an association between lower CYBB expression and
improved survival in AML (30).
ID3 is a member of the ID family that influences cell proliferation
and differentiation (31).
However, it is primarily expressed in lymphoblastic leukemias
rather than AML (32). Lastly,
CAMK4 is a novel drug target for the treatment of
autoimmune/inflammatory diseases that has been shown to be
downregulated in hepatocellular carcinoma tissues (33).
The five major upregulated hypomethylated genes
identified using bioinformatics were VCL, ZBP1, TFDP1, ITGAM and
ADRB2; they are enriched in star pathways that are associated with
AML and have great connectivity to play a key role in PPI networks.
These genes have seldom been reported.
VCL is a cytoskeletal protein that is involved in
cell-cell and cell-matrix interactions (34), and may be involved in securing
F-actin to the membrane. ZBP1 is an immune sensor of nucleic acids.
The activation of this protein leads to inflammation, necroptosis,
apoptosis and pyroptosis (35).
TFDP1 has been shown to be a latent target gene of miR-4711-5,
which contributes to cell cycle progression from the G1
to the S phase (36). Three major
downregulated hypermethylated TSGs were SUFU, PLEKHO1 and BNIP3L.
SUFU is a negative regulator of the Hedgehog signaling pathway,
which has been implicated in cancer progression in several organs
(37); it has been shown to
inhibit cancer progression by suppressing the activation of
Hedgehog signaling in cancer cells, thereby inducing apoptosis.
PLEKHO1 is involved in macrophage proliferation and migration and
can interact with Akt via its leucine zipper motif and thereby
suppress PI3K/Akt signalling (38). AML cells lacking BNIP3L have been
reported to display a high sensitivity to mitochondria-targeting
drugs (39), suggesting that
BNIP3L may be a novel drug target for AML.
In vitro experiments were performed in the
present study to verify the results in the samples from patients
with AML. The results revealed that the overexpression of TCF7 and
ITGAM inhibited cell proliferation, the downregulation of CAMK4 and
TCF7 enhanced cell proliferation, but the overexpression or
downregulation of TCF7, ITGAM and CAMK4 did not induce cell
apoptosis.
The present study has certain limitations. Clinical
data and prognoses were not examined due to the lack of available
data. Thus, further research in this area is necessary. Further
mechanistic analyses are required to perform a substantial
verification of the results in association with AML.
In conclusion, in the present study, integrated
bioinformatics analyses were performed to identify abnormally
methylated and differentially expressed oncogenes and TSGs, and
their associated pathways and functions. These results provide
insight into the molecular mechanisms underlying the initiation and
development of AML. The 15 selected genes, comprising 10
downregulated hypermethylated genes (TCF7, CHMP7, PIK3CA, SLC39A8,
CYBB, ID3, CAMK4, SUFU, PLEKHO1 and BNIP3L) and five upregulated
hypomethylated genes (VCL, ZBP1, TFDP1, ITGAM and ADRB2), underwent
validation using RT-qPCR. In the future, at least some of these
genes may be utilized for precise AML diagnosis and therapy, as
they may serve as abnormal methylation-based biomarkers and
treatment targets. The present study employed several datasets
rather than a single dataset to increase the validity of the
findings. The lack of availability of additional data is a
limitation of the present study. Therefore, additional samples and
further assessments are necessary to confirm the relevance of the
candidate AML genes.
Supplementary Material
Supporting Data
Supporting Data
Acknowledgements
Not applicable.
Funding
The present study was financially supported by the Science and
Technology Program of Guangzhou (grant no. 202002030022).
Availability of data and materials
All data generated or analyzed during this study are
included in this published article.
Authors' contributions
WWC conceived and designed the study, obtained the
funding and provided administrative support. JQ contributed to
analyzing the data. DBL analysed and interpreted the data. JQ and
DBL confirm the authenticity of all the raw data. WWC, LJZ and HXX
conducted the data analysis and interpretation. All authors wrote
the manuscript, and all authors read and approved the final version
of the manuscript.
Ethics approval and consent to
participate
Ethics approval was obtained from the Ethics
Committee of Guangzhou Twelfth People's Hospital (Guangzhou, China;
approval no. 2020046). The patients provided written informed
consent for collection of their samples and their use in scientific
research.
Patient consent for publication
Not applicable.
Competing interests
The authors declare that they have no competing
interests.
Glossary
Abbreviations
Abbreviations:
|
AML
|
acute myeloid leukemia
|
|
BP
|
biological process
|
|
GO
|
gene ontology
|
|
DEG
|
differentially expressed gene
|
|
DMG
|
differentially methylated gene
|
|
PPI
|
protein-protein interaction
|
References
|
1
|
Alvarez MC, Maso V, Torello CO, Ferro KP
and Saad STO: The polyphenol quercetin induces cell death in
leukemia by targeting epigenetic regulators of pro-apoptotic genes.
Clin Epigenetics. 10:1392018. View Article : Google Scholar : PubMed/NCBI
|
|
2
|
Casano K, Meddaugh H, Zambrano RM, Marble
M, Torres JI and Lacassie Y: Gorlin-like phenotype in a patient
with a PTCH2 variant of uncertain significance. Eur J Med Genet.
63:1038422020. View Article : Google Scholar
|
|
3
|
Hao BB, Li XJ, Jia XL, Wang YX, Zhai LH,
Li DZ, Liu J, Zhang D, Chen YL, Xu YH, et al: The novel cereblon
modulator CC-885 inhibits mitophagy via selective degradation of
BNIP3L. Acta Pharmacol Sin. 41:1246–1254. 2020. View Article : Google Scholar : PubMed/NCBI
|
|
4
|
Wei Y, Xiong X, Li X, Lu W, He X, Jin X,
Sun R, Lyu H, Yuan T, Sun T and Zhao M: Low-dose decitabine plus
venetoclax is safe and effective as post-transplant maintenance
therapy for high-risk acute myeloid leukemia and myelodysplastic
syndrome. Cancer Sci. 112:3636–3644. 2021. View Article : Google Scholar
|
|
5
|
Hu L, Gao Y, Shi Z, Liu Y, Zhao J, Xiao Z,
Lou J, Xu Q and Tong X: DNA methylation-based prognostic biomarkers
of acute myeloid leukemia patients. Ann Transl Med. 7:7372019.
View Article : Google Scholar : PubMed/NCBI
|
|
6
|
Zhang X, Feng H, Li D, Liu S, Amizuka N
and Li M: Identification of differentially expressed genes induced
by aberrant methylation in oral squamous cell carcinomas using
integrated bioinformatic analysis. Int J Mol Sci. 19:16982018.
View Article : Google Scholar
|
|
7
|
Xi Y, Lin Y, Guo W, Wang X, Zhao H, Miao
C, Liu W, Liu Y, Liu T, Luo Y, et al: Multi-omic characterization
of genome-wide abnormal DNA methylation reveals diagnostic and
prognostic markers for esophageal squamous-cell carcinoma. Signal
Transduct Target Ther. 7:532022. View Article : Google Scholar : PubMed/NCBI
|
|
8
|
Itoh S, Yamazaki J, Iwahana M and
Tsukamoto A: Olsalazine inhibits cell proliferation and DNA
methylation in canine lymphoid tumor cell lines. Pol J Vet Sci.
24:515–523. 2021.
|
|
9
|
Shen S, Wang G, Shi Q, Zhang R, Zhao Y,
Wei Y, Chen F and Christiani DC: Seven-CpG-based prognostic
signature coupled with gene expression predicts survival of oral
squamous cell carcinoma. Clin Epigenetics. 9:882017. View Article : Google Scholar : PubMed/NCBI
|
|
10
|
Grencewicz DJ, Romigh T, Thacker S, Abbas
A, Jaini R, Luse D and Eng C: Redefining the PTEN promoter:
Identification of novel upstream transcription start regions. Hum
Mol Genet. 30:2135–2148. 2021. View Article : Google Scholar
|
|
11
|
Pramodh S, Raina R, Hussain A, Bagabir SA,
Haque S, Raza ST, Ajmal MR, Behl S and Bhagavatula D: Luteolin
causes 5′CpG demethylation of the promoters of TSGs and modulates
the aberrant histone modifications, restoring the expression of
TSGs in human cancer cells. Int J Mol Sci. 23:40672022. View Article : Google Scholar
|
|
12
|
Huang S, Zhang B, Fan W, Zhao Q, Yang L,
Xin W and Fu D: Identification of prognostic genes in the acute
myeloid leukemia microenvironment. Aging (Albany NY).
11:10557–10580. 2019. View Article : Google Scholar : PubMed/NCBI
|
|
13
|
Kanehisa M and Goto S: KEGG: Kyoto
encyclopedia of genes and genomes. Nucleic Acids Res. 28:27–30.
2000. View Article : Google Scholar : PubMed/NCBI
|
|
14
|
Chin CH, Chen SH, Wu HH, Ho CW, Ko MT and
Lin CY: cytoHubba: Identifying hub objects and sub-networks from
complex interactome. BMC Syst Biol. 8 (Suppl 4):S112014. View Article : Google Scholar
|
|
15
|
Ashburner M, Ball CA, Blake JA, Botstein
D, Butler H, Cherry JM, Davis AP, Dolinski K, Dwight SS, Eppig JT,
et al: Gene ontology: Tool for the unification of biology. The gene
ontology consortium. Nat Genet. 25:25–29. 2000. View Article : Google Scholar
|
|
16
|
Shen Y, Pan X and Yang J: Gene regulation
and prognostic indicators of lung squamous cell carcinoma:
TCGA-derived miRNA/mRNA sequencing and DNA methylation data. J Cell
Physiol. 234:22896–22910. 2019. View Article : Google Scholar
|
|
17
|
Knaus HA, Berglund S, Hackl H, Blackford
AL, Zeidner JF, Montiel-Esparza R, Mukhopadhyay R, Vanura K, Blazar
BR, Karp JE, et al: Signatures of CD8+ T cell dysfunction in AML
patients and their reversibility with response to chemotherapy. JCI
Insight. 3:e1209742018. View Article : Google Scholar
|
|
18
|
Rommer A, Steinleitner K, Hackl H,
Schneckenleithner C, Engelmann M, Scheideler M, Vlatkovic I,
Kralovics R, Cerny-Reiterer S, Valent P, et al: Overexpression of
primary microRNA 221/222 in acute myeloid leukemia. BMC Cancer.
13:3642013. View Article : Google Scholar : PubMed/NCBI
|
|
19
|
Tanaka M, Oikawa K, Takanashi M, Kudo M,
Ohyashiki J, Ohyashiki K and Kuroda M: Down-regulation of miR-92 in
human plasma is a novel marker for acute leukemia patients. PLoS
One. 4:e55322009. View Article : Google Scholar : PubMed/NCBI
|
|
20
|
Pérez C, Pascual M, Martín-Subero JI,
Bellosillo B, Segura V, Delabesse E, Álvarez S, Larrayoz MJ, Rifón
J, Cigudosa JC, et al: Aberrant DNA methylation profile of chronic
and transformed classic Philadelphia-negative myeloproliferative
neoplasms. Haematologica. 98:1414–1420. 2013. View Article : Google Scholar
|
|
21
|
Liu F, Wei T, Liu L, Hou F, Xu C, Guo H,
Zhang W, Ma M, Zhang Y, Yu Q and Wang J: Role of necroptosis and
immune infiltration in human stanford type A aortic dissection:
Novel insights from bioinformatics analyses. Oxid Med Cell Longev.
2022:61848022022.PubMed/NCBI
|
|
22
|
Livak KJ and Schmittgen TD: Analysis of
relative gene expression data using real-time quantitative PCR and
the 2(−Delta Delta C(T)) method. Methods. 25:402–408. 2001.
View Article : Google Scholar : PubMed/NCBI
|
|
23
|
Abd ElHafeez S, D'Arrigo G, Leonardis D,
Fusaro M, Tripepi G and Roumeliotis S: Methods to analyze
time-to-event data: The cox regression analysis. Oxid Med Cell
Longev. 2021:13028112021. View Article : Google Scholar : PubMed/NCBI
|
|
24
|
Luo Y, Sun F, Peng X, Dong D, Ou W, Xie Y
and Luo Y: Integrated bioinformatics analysis to identify abnormal
methylated differentially expressed genes for predicting prognosis
of human colon cancer. Int J Gen Med. 14:4745–4756. 2021.
View Article : Google Scholar : PubMed/NCBI
|
|
25
|
Wang L, Jiang W, Wang J, Xie Y and Wang W:
Puerarin inhibits FUNDC1-mediated mitochondrial autophagy and
CSE-induced apoptosis of human bronchial epithelial cells by
activating the PI3K/AKT/mTOR signaling pathway. Aging (Albany NY).
14:1253–1264. 2022. View Article : Google Scholar : PubMed/NCBI
|
|
26
|
Alhadidi Q and Shah ZA: Cofilin Mediates
LPS-induced microglial cell activation and associated neurotoxicity
through activation of NF-κB and JAK-STAT pathway. Mol Neurobiol.
55:1676–1691. 2018. View Article : Google Scholar
|
|
27
|
Silverbush D, Grosskurth S, Wang D, Powell
F, Gottgens B, Dry J and Fisher J: Cell-specific computational
modeling of the PIM pathway in acute myeloid leukemia. Cancer Res.
77:827–838. 2017. View Article : Google Scholar : PubMed/NCBI
|
|
28
|
Stranahan AW, Berezniuk I, Chakraborty S,
Feller F, Khalaj M and Park CY: Leukotrienes promote stem cell
self-renewal and chemoresistance in acute myeloid leukemia.
Leukemia. 36:1575–1584. 2022. View Article : Google Scholar
|
|
29
|
Malik B, Devine H, Patani R, La Spada AR,
Hanna MG and Greensmith L: Gene expression analysis reveals early
dysregulation of disease pathways and links Chmp7 to pathogenesis
of spinal and bulbar muscular atrophy. Sci Rep. 9:35392019.
View Article : Google Scholar : PubMed/NCBI
|
|
30
|
Garcia-Manero G, Tambaro FP, Bekele NB,
Yang H, Ravandi F, Jabbour E, Borthakur G, Kadia TM, Konopleva MY,
Faderl S, et al: Phase II trial of vorinostat with idarubicin and
cytarabine for patients with newly diagnosed acute myelogenous
leukemia or myelodysplastic syndrome. J Clin Oncol. 30:2204–2210.
2012. View Article : Google Scholar
|
|
31
|
Park JS, Kim SM, Choi J, Jung KA, Hwang
SH, Yang S, Kwok SK, Cho ML and Park SH: Interleukin-21-mediated
suppression of the Pax3-Id3 pathway exacerbates the development of
Sjögren's syndrome via follicular helper T cells. Cytokine.
125:1548342020. View Article : Google Scholar : PubMed/NCBI
|
|
32
|
May AM, Frey AV, Bogatyreva L,
Benkisser-Petersen M, Hauschke D, Lübbert M, Wäsch R, Werner M,
Hasskarl J and Lassmann S: ID2 and ID3 protein expression mirrors
granulopoietic maturation and discriminates between acute leukemia
subtypes. Histochem Cell Biol. 141:431–440. 2014. View Article : Google Scholar
|
|
33
|
Li Z, Lu J, Zeng G, Pang J, Zheng X, Feng
J and Zhang J: MiR-129-5p inhibits liver cancer growth by targeting
calcium calmodulin-dependent protein kinase IV (CAMK4). Cell Death
Dis. 10:7892019. View Article : Google Scholar : PubMed/NCBI
|
|
34
|
Wang XT, Fang R, Ye SB, Zhang RS, Li R,
Wang X, Ji RH, Lu ZF, Ma HH, Zhou XJ, et al: Targeted
next-generation sequencing revealed distinct clinicopathologic and
molecular features of VCL-ALK RCC: A unique case from an older
patient without clinical evidence of sickle cell trait. Pathol Res
Pract. 215:1526512019. View Article : Google Scholar
|
|
35
|
Kesavardhana S, Malireddi RKS, Burton AR,
Porter SN, Vogel P, Pruett-Miller SM and Kanneganti TD: The Zα2
domain of ZBP1 is a molecular switch regulating influenza-induced
PANoptosis and perinatal lethality during development. J Biol Chem.
295:8325–8330. 2020. View Article : Google Scholar : PubMed/NCBI
|
|
36
|
Morimoto Y, Mizushima T, Wu X, Okuzaki D,
Yokoyama Y, Inoue A, Hata T, Hirose H, Qian Y, Wang J, et al:
miR-4711-5p regulates cancer stemness and cell cycle progression
via KLF5, MDM2 and TFDP1 in colon cancer cells. Br J Cancer.
122:1037–1049. 2020. View Article : Google Scholar : PubMed/NCBI
|
|
37
|
Zheng S, Li M, Miao K and Xu H: lncRNA
GAS5-promoted apoptosis in triple-negative breast cancer by
targeting miR-378a-5p/SUFU signaling. J Cell Biochem.
121:2225–2235. 2020. View Article : Google Scholar : PubMed/NCBI
|
|
38
|
Zhang P, Zhou C, Lu C, Li W, Li W, Jing B,
Chen W, Zha Y, Zhang P, Bai C, et al: PLEKHO2 is essential for
M-CSF-dependent macrophage survival. Cell Signal. 37:115–122. 2017.
View Article : Google Scholar
|
|
39
|
Rodrigo R, Mendis N, Ibrahim M, Ma C,
Kreinin E, Roma A, Berg S, Blay J and Spagnuolo PA: Knockdown of
BNIP3L or SQSTM1 alters cellular response to mitochondria target
drugs. Autophagy. 15:900–907. 2019. View Article : Google Scholar : PubMed/NCBI
|