Introduction
Hepatocellular carcinoma (HCC) is one of the most
common malignant tumors, ranking sixth in incidence worldwide, and
is the fourth leading cause of cancer-associated mortality, with a
5-year survival rate of only 18% (1,2).
Furthermore, the onset of HCC is insidious, and there are no
obvious clinical symptoms at the early stage (2). The majority of HCC cases are
diagnosed at advanced stages, and are ineligible for curative
resection, which leads to poor prognosis (2). Transarterial chemoembolization (TACE)
is one of the most effective treatments for patients with
unresectable HCC worldwide (3–5). HCC
obtains its blood supply mainly from the hepatic artery, which
provides 90% of the blood supply (6). In TACE, direct delivery of drugs to
the tumor by intra-arterial chemotherapy, during which liver blood
flow is occluded, is often used to induce ischemia and hypoxia of
the tumor tissue, which leads to long-term retention of the drug to
enhance the subsequent necrosis (7). However, HCC exhibits remarkable
cellular heterogeneity, which contributes to high rates of
therapeutic resistance and rapid recurrence (8,9). A
total of 27 randomized controlled trials between 1978 and 2002
suggested that the objective response rate for TACE was only 15–55%
and that 70–80% of patients treated with TACE would die from tumor
progression rather than liver failure (10,11).
Therefore, the relatively high incidence of tumor recurrence after
TACE suggests that adequate assessment of its therapeutic efficacy
and prognosis is required before TACE.
Serum-based tumor biomarkers are widely used to
predict tumor prognosis preoperatively, and AFP is the most common
one in HCC (12). However, due to
tumor heterogeneity, certain patients with AFP-negative HCC require
novel tumor biomarkers for the prediction of their prognosis in
clinical settings (13). A recent
study noted that ~50% of patients with HCC are AFP-negative,
particularly those at an early stage and with small HCC tumors
(14). Des-γ-carboxyprothrombin
(DCP) was first proposed by Liebman et al (15) in 1984. It has been reported that
DCP has a higher value in the evaluation of HCC than AFP (12,15).
The presence of ≥1 glutamate residues in the γ-carboxyglutamic
acid-rich structural domain that are not fully carboxylated to
γ-carboxyglutamate leads to the synthesis of the aforementioned
immature thrombin by the liver (16). DCP has been reported to be elevated
in patients with HCC (12,13). To the best of our knowledge, for
patients with ‘single-positive’ HCC (AFP-negative and
DCP-positive), the association between the level of DCP and the
therapeutic efficacy and prognosis of TACE remains unclear. In
addition, the key signaling pathways, hub genes and potential
molecular mechanisms involved in the pathology of these patients
remain to be identified.
The present study retrospectively reviewed the
clinical data of patients with ‘single-positive’ HCC, aiming to
explore the role of DCP in the therapeutic efficacy and prognosis
of TACE. Differentially expressed genes (DEGs) between HCC and
normal tissues were obtained from a microarray dataset in the Gene
Expression Omnibus (GEO) database. Subsequently, Gene Ontology (GO)
analysis, Kyoto Encyclopedia of Genes and Genomes (KEGG) analysis
and Gene Set Enrichment Analysis (GSEA) were performed, followed by
protein-protein interaction (PPI) network analysis based on these
DEGs. The combination of clinical survival analysis and
bioinformatics methods may provide novel insights for clinical
treatments and drug target discovery in HCC.
Materials and methods
Ethics
The present retrospective study was approved by the
ethics committee review board of Jiangsu Provincial Hospital
(Nanjing, China), which waived the requirement for informed patient
consent (approval no. 2022-SR-249). All the procedures performed in
the present study were consistent with the ethical standards of
institutional and national research committees, and with the 1964
Declaration of Helsinki and its later amendments or comparable
ethical standards. The authors could identify the information of
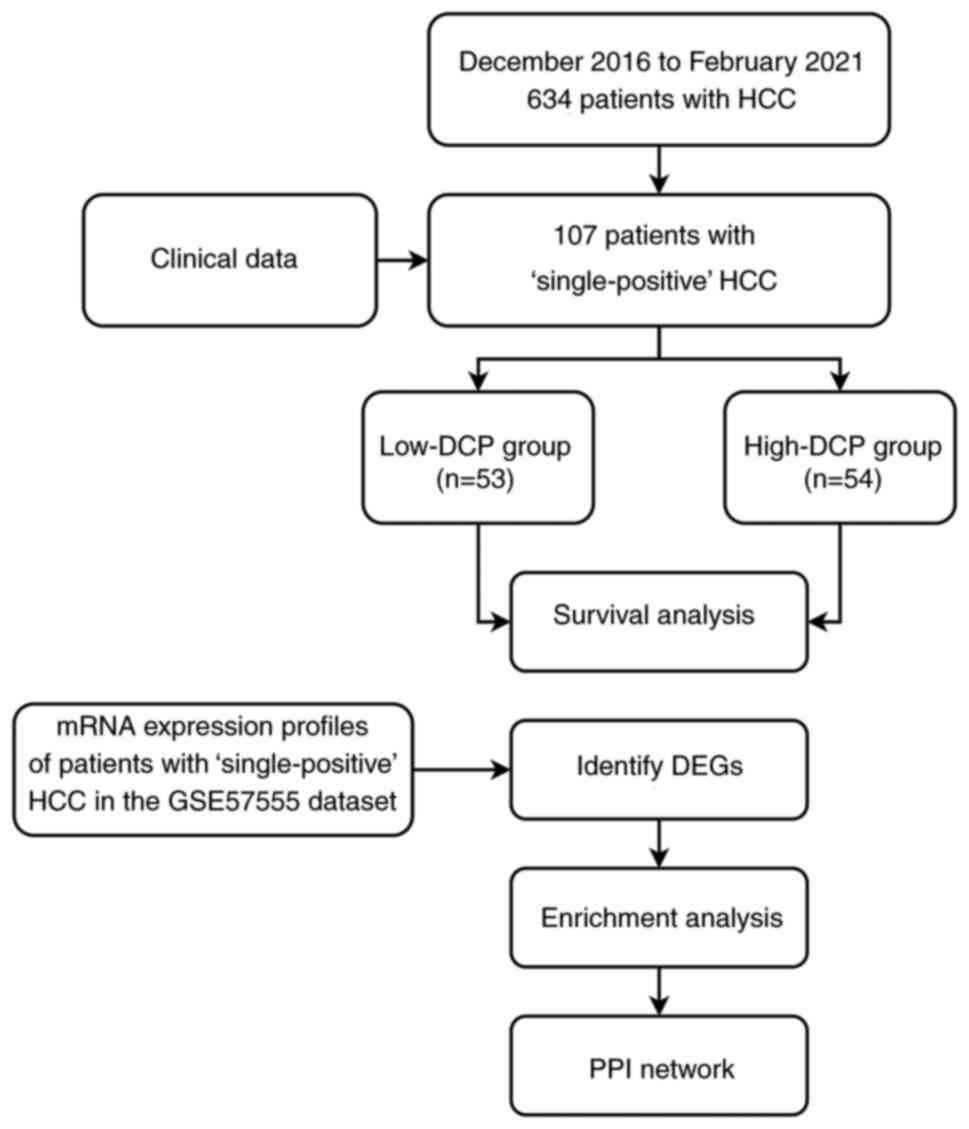
individual participants only during data collection. A flowchart of
the present study is shown in Fig.
1.
Patient selection
The medical records of 634 consecutive adult
patients with HCC treated with TACE as the initial treatment
between December 2016 and February 2021 at the Department of
Interventional Radiology, The First Affiliated Hospital of Nanjing
Medical University (Nanjing, China) were analyzed in the present
study. The patients were diagnosed with HCC based on clinical
symptoms, serological tests, imaging and pathological evaluations
according to the ‘Primary Liver Cancer Clinical Diagnosis and
Staging Criteria’ (17). The 107
patients who met the inclusion criteria were included in the
analysis and were divided into low-DCP (≤180 mAU/ml) and high-DCP
(>180 mAU/ml) groups according to the median serum levels of DCP
(Table SI). The inclusion
criteria were as follows: i) Patients were aged between 18 and 85
years; ii) Eastern Cooperative Oncology Group (ECOG) (18) performance status of 0–2; iii) no
ability to accept curative surgery, such as partial hepatectomy;
iv) preoperative serum AFP was negative (<20.00 ng/ml); and v)
serum DCP was positive (≥40 mAU/ml). The exclusion criteria were as
follows: i) Diffuse-type HCC; ii) ECOG performance score >2;
iii) decompensated cirrhosis; iv) patients with severe heart,
liver, brain, lung, kidney, hematopoietic system and
neuropsychiatric disorders; and v) presence of any other
malignancy. All patients were observed until mortality or end of
follow-up in May 2021.
Standard conventional-TACE
procedure
The TACE procedure began with routine disinfection,
followed by towel spreading and administration of local anesthesia
with 2% lidocaine. A 5-F sheath was introduced into each patient's
femoral artery using the Seldinger technique (19), and a 5-F RH catheter (Terumo
Corporation) was then used, through which arteriography of the
celiac trunk, superior mesenteric artery and hepatic arteries was
successively performed to collect an overview of the hepatic
arterial blood supply and to evaluate the location, number and size
of HCC tumors. A 2.7-F microcatheter (Terumo Corporation) was
employed for superselection of the blood supply artery, and
angiography confirmed that the microcatheter was accurately
positioned. Once the target artery was catheterized, a 1:1 mixed
suspension of iodized oil (1–10 ml; Lipiodol Ultra-Fluide; Yantai
Luyin Pharmaceutical Co., Ltd.) and epirubicin (20–40 mg;
Pharmorubicin; Pfizer, Inc.) was infused into the artery through
the catheter, depending on liver function and tumor size. Finally,
gelatin sponge particles (Gelfoam; Jiangxi Xiangen Medical
Technology Development Co., Ltd.) were infused to embolize the
artery until no tumor staining was found after repeated
angiography. Finally, the guidewire and catheters were removed, and
the femoral artery was compressed for 10 min to secure hemostasis
at the puncture site.
Clinical data
The patients' demographic data, results of
serological tests, imaging results, survival data and clinical
manifestations were collected from medical records, and the
Child-Pugh classification and ECOG score were also assessed
(20,21). Routine laboratory analyses included
hematology screening, blood chemistry panel, coagulation function
tests, liver function tests and tumor markers (including AFP and
DCP). All patients were subjected to abdominal CT or MRI
examination to determine the tumor number and size, and to
establish whether there was metastasis. Patients were followed up
by telephone and outpatient review. The first follow-up visit was
in the first month after surgery; thereafter, follow-up was every 3
months in the first year after surgery, every 6 months in the
second and third years after surgery, and annually thereafter. The
overall survival (OS) time was defined as the time interval from
the date of surgery to the end of follow-up or mortality date
(Table SI).
Microarray data
mRNA expression profiles were downloaded from the
GEO (22) platform
GPL16699-Agilent-039494 SurePrint G3 Human GE v2 8×60K Microarray
039381 (Feature Number version) (GSE57555), which included 16 tumor
tissues and 16 nontumor tissues (23). A total of 3 tumor tissues
(GSM1384684, GSM1384688 and GSM1384690) and 3 nontumor tissues
(GSM1384685, GSM1384689 and GSM1384691) from patients with
‘single-positive’ HCC were selected for analysis.
Identification of DEGs
The downloaded platform and matrix files were
converted using R software (version 4.1; www.r-project.org/). Probes were converted to gene
symbols according to the platform annotation information of the
normalized data. Probes with >1 gene were eliminated, and the
mean value was calculated for genes corresponding to >1 probe.
The limma package version 3.40.2 of R software (24) was used to study the differential
expression of mRNAs. P<0.05 and |log2 fold change|>1 were
defined as the threshold criteria to identify the final DEGs.
Heatmaps and volcano plots of DEGs were generated using the
pheatmap version 1.0.12 (https://CRAN.R-project.org/package=pheatmap) and
ggplot2 version 3.3.0 (https://CRAN.R-project.org/package=ggplot2)
packages.
Functional enrichment analysis of
DEGs
To identify the affected biological processes, the
Bioconductor package ‘Cluster Profiler’ (version 4.4.0; http://bioconductor.org/packages/release/bioc/html/clusterProfiler.html)
of R software was used to classify the enriched GO terms
(http://geneontology.org/). Information
in the KEGG database (https://www.kegg.jp/) was used for the pathway
enrichment analysis of DEGs. P<0.05 indicated a statistically
significant selection of GO terms and KEGG pathways (25).
GSEA
GSEA was carried out for all genes that were also
detected using the package ‘Cluster Profiler’ in R. The genes were
sorted according to their expression and compared with the KEGG
database to provide another option for screening possible
differential biological functions. The gene set arrangement was
performed 1,000 times per analysis. Gene sets were considered to be
significantly enriched with an α or P-value <0.05 and a false
discovery rate <25%.
PPI network of DEGs
PPI networks of DEGs were constructed utilizing the
Search Tool for the Retrieval of Interacting Genes/Proteins
(STRING) database (version 11.5) (26), and were visualized using Cytoscape
software (version 3.8.2; http://cytoscape.org/), the cytoHubba plugin (27) and the MCODE plugin (28). From 787,896 pairs of human protein
interactions containing 16,730 genes, DEG-containing interactions
were obtained. STRING utilized a combined score from 0 to 1 to
assess reliability. Each protein was regarded as a node in the
network, and the degree of a node was considered to be the number
of interactions with other nodes. Hub genes were nodes with ≥50
degrees.
Statistical analysis
Statistical analysis was conducted using SPSS 26.0
for Windows (IBM Corp.) and R software version 4.1 (www.r-project.org/). Continuous data are presented as
the mean ± standard deviation or as the median (interquartile
range). Unpaired Student's t-test was used to determine differences
in continuous variables that followed a normal distribution between
two groups. Non-normally distributed data were compared using
U-Mann Whitney test. Non-continuous and categorical data were
compared with c2 test and Fisher's test. For survival
analysis, the Kaplan-Meier method was applied. For comparisons of
survival between groups, the log-rank test was employed. Univariate
analysis was performed with the Cox regression model, and variables
with P≤0.1 in univariate analysis were included in the multivariate
Cox regression model. P<0.05 was considered to indicate a
statistically significant difference.
Results
Baseline patient demographics and
clinical characteristics
The demographic and baseline characteristics of our
study cohort are shown in Table I.
A total of 107 patients, 53 in the low-DCP group and 54 in the
high-DCP group, were included in the study. They did not
significantly differ in age (P=0.745), sex (P=0.356), hepatitis
(P=0.784), Child-Pugh classification (P=0.322), aspartate
transaminase (AST; P=0.126), total bilirubin (TBil; P=0.660),
high-density lipoprotein (HDL; P=0.079), retinol binding protein
(RBP; P=0.843), platelet count (PLT; P=0.429), plateletcrit (PCT;
P=0.198), platelet distribution width (PDW; P=0.571), red cell
distribution width (RDW; P=0.625), tumor number (P=0.126),
lymphatic node metastasis (P=0.113) or distant metastasis
(P>0.999) (Table I). The
results indicated that patients in the two groups were comparable.
Nevertheless, significant differences in ECOG score (P=0.043),
alanine transaminase (ALT; P=0.037) and tumor size (P<0.001)
were observed.
 | Table I.Baseline demographic data and
characteristics of the patients in our cohort. |
Table I.
Baseline demographic data and
characteristics of the patients in our cohort.
| Variables | All patients
(n=107) | Low-DCP group
(n=53) | High-DCP group
(n=54) | Statistical
value | P-value |
|---|
| Age, n (%) |
|
|
|
χ2=0.106 | 0.745 |
| >60
years | 40 (37.4) | 19 (35.8) | 21 (38.9) |
|
|
| ≤60
years | 67 (62.6) | 34 (64.2) | 33 (61.1) |
|
|
| Sex, n (%) |
|
|
|
χ2=0.853 | 0.356 |
|
Male | 94 (87.9) | 45 (84.9) | 49 (90.7) |
|
|
|
Female | 13 (12.1) | 8 (15.1) | 5 (9.3) |
|
|
| Hepatitis, n
(%) |
|
|
|
χ2=0.075 | 0.784 |
|
Yes | 72 (67.3) | 35 (66.0) | 37 (68.5) |
|
|
| No | 35 (32.7) | 18 (34.0) | 17 (31.5) |
|
|
| ECOG score, n
(%) |
|
|
|
χ2=4.114 | 0.043 |
| 0 | 50 (46.7) | 30 (56.6) | 20 (37.0) |
|
|
| 1 | 57 (53.3) | 23 (43.4) | 34 (63.0) |
|
|
| Child-Pugh
classification, n (%) |
|
|
|
χ2=0.981 | 0.322 |
| A | 89 (83.2) | 46 (86.8) | 43 (79.6) |
|
|
| B | 18 (16.8) | 7 (13.2) | 11 (20.4) |
|
|
| ALT, U/l | 26.9
(19.3-42.2) | 23.9
(18.2-32.6) | 31.4
(20.4-50.0) | U=1765.5 | 0.037 |
| AST, U/l | 33.9
(26.1-45.2) | 32.3
(25.0-40.7) | 34.8
(26.5-53.0) | U=1676.5 | 0.126 |
| TBil, µmol/l | 15.1
(11.2-22.3) | 14.7
(11.1-22.4) | 16.3
(11.3-22.4) | U=1501.5 | 0.660 |
| HDL, mmol/l | 1.08±0.3 | 1.14±0.3 | 1.03±0.3 | t=1.774 | 0.079 |
| RBP, mg/l | 23.9±10.1 | 23.7±9.9 | 24.1±10.3 | t=−0.199 | 0.843 |
| PLT,
109/l | 137.9±70.1 | 132.4±70.4 | 143.3±70.0 | t=−0.798 | 0.429 |
| PCT, % | 14.5±7.2 | 13.6±7.2 | 15.4±7.1 | t=−1.296 | 0.198 |
| PDW, % | 16.0
(13.7-17.2) | 16.0
(13.6-17.1) | 16.0
(13.8-17.1) | U=1522.0 | 0.571 |
| RDW, % | 13.6
(13.0-14.9) | 13.7
(12.9-15.3) | 13.6
(13.0-14.7) | U=1352.5 | 0.625 |
| Tumor size, cm | 3.35 (2.2-6.7) | 2.6 (1.9-4.9) | 4.4 (2.8-8.1) | U=1974.0 | <0.001 |
| Tumor number, n
(%) |
|
|
|
χ2=2.341 | 0.126 |
|
Single | 33 (30.8) | 20 (37.7) | 13 (24.1) |
|
|
|
Multiple | 74 (69.2) | 33 (62.3) | 41 (75.9) |
|
|
| N-metastasis, n
(%) |
|
|
|
χ2=2.256 | 0.113 |
|
Yes | 27 (25.2) | 10 (18.9) | 17 (31.5) |
|
|
| No | 80 (74.8) | 43 (81.1) | 37 (68.5) |
|
|
| M-metastasis, n
(%) |
|
|
|
| >0.999 |
|
Yes | 3 (2.8) | 1 (1.9) | 2 (3.7) |
|
|
| No | 104 (97.2) | 52 (98.1) | 52 (96.3) |
|
|
Comparison of prognosis between the
low-DCP group and the high-DCP group
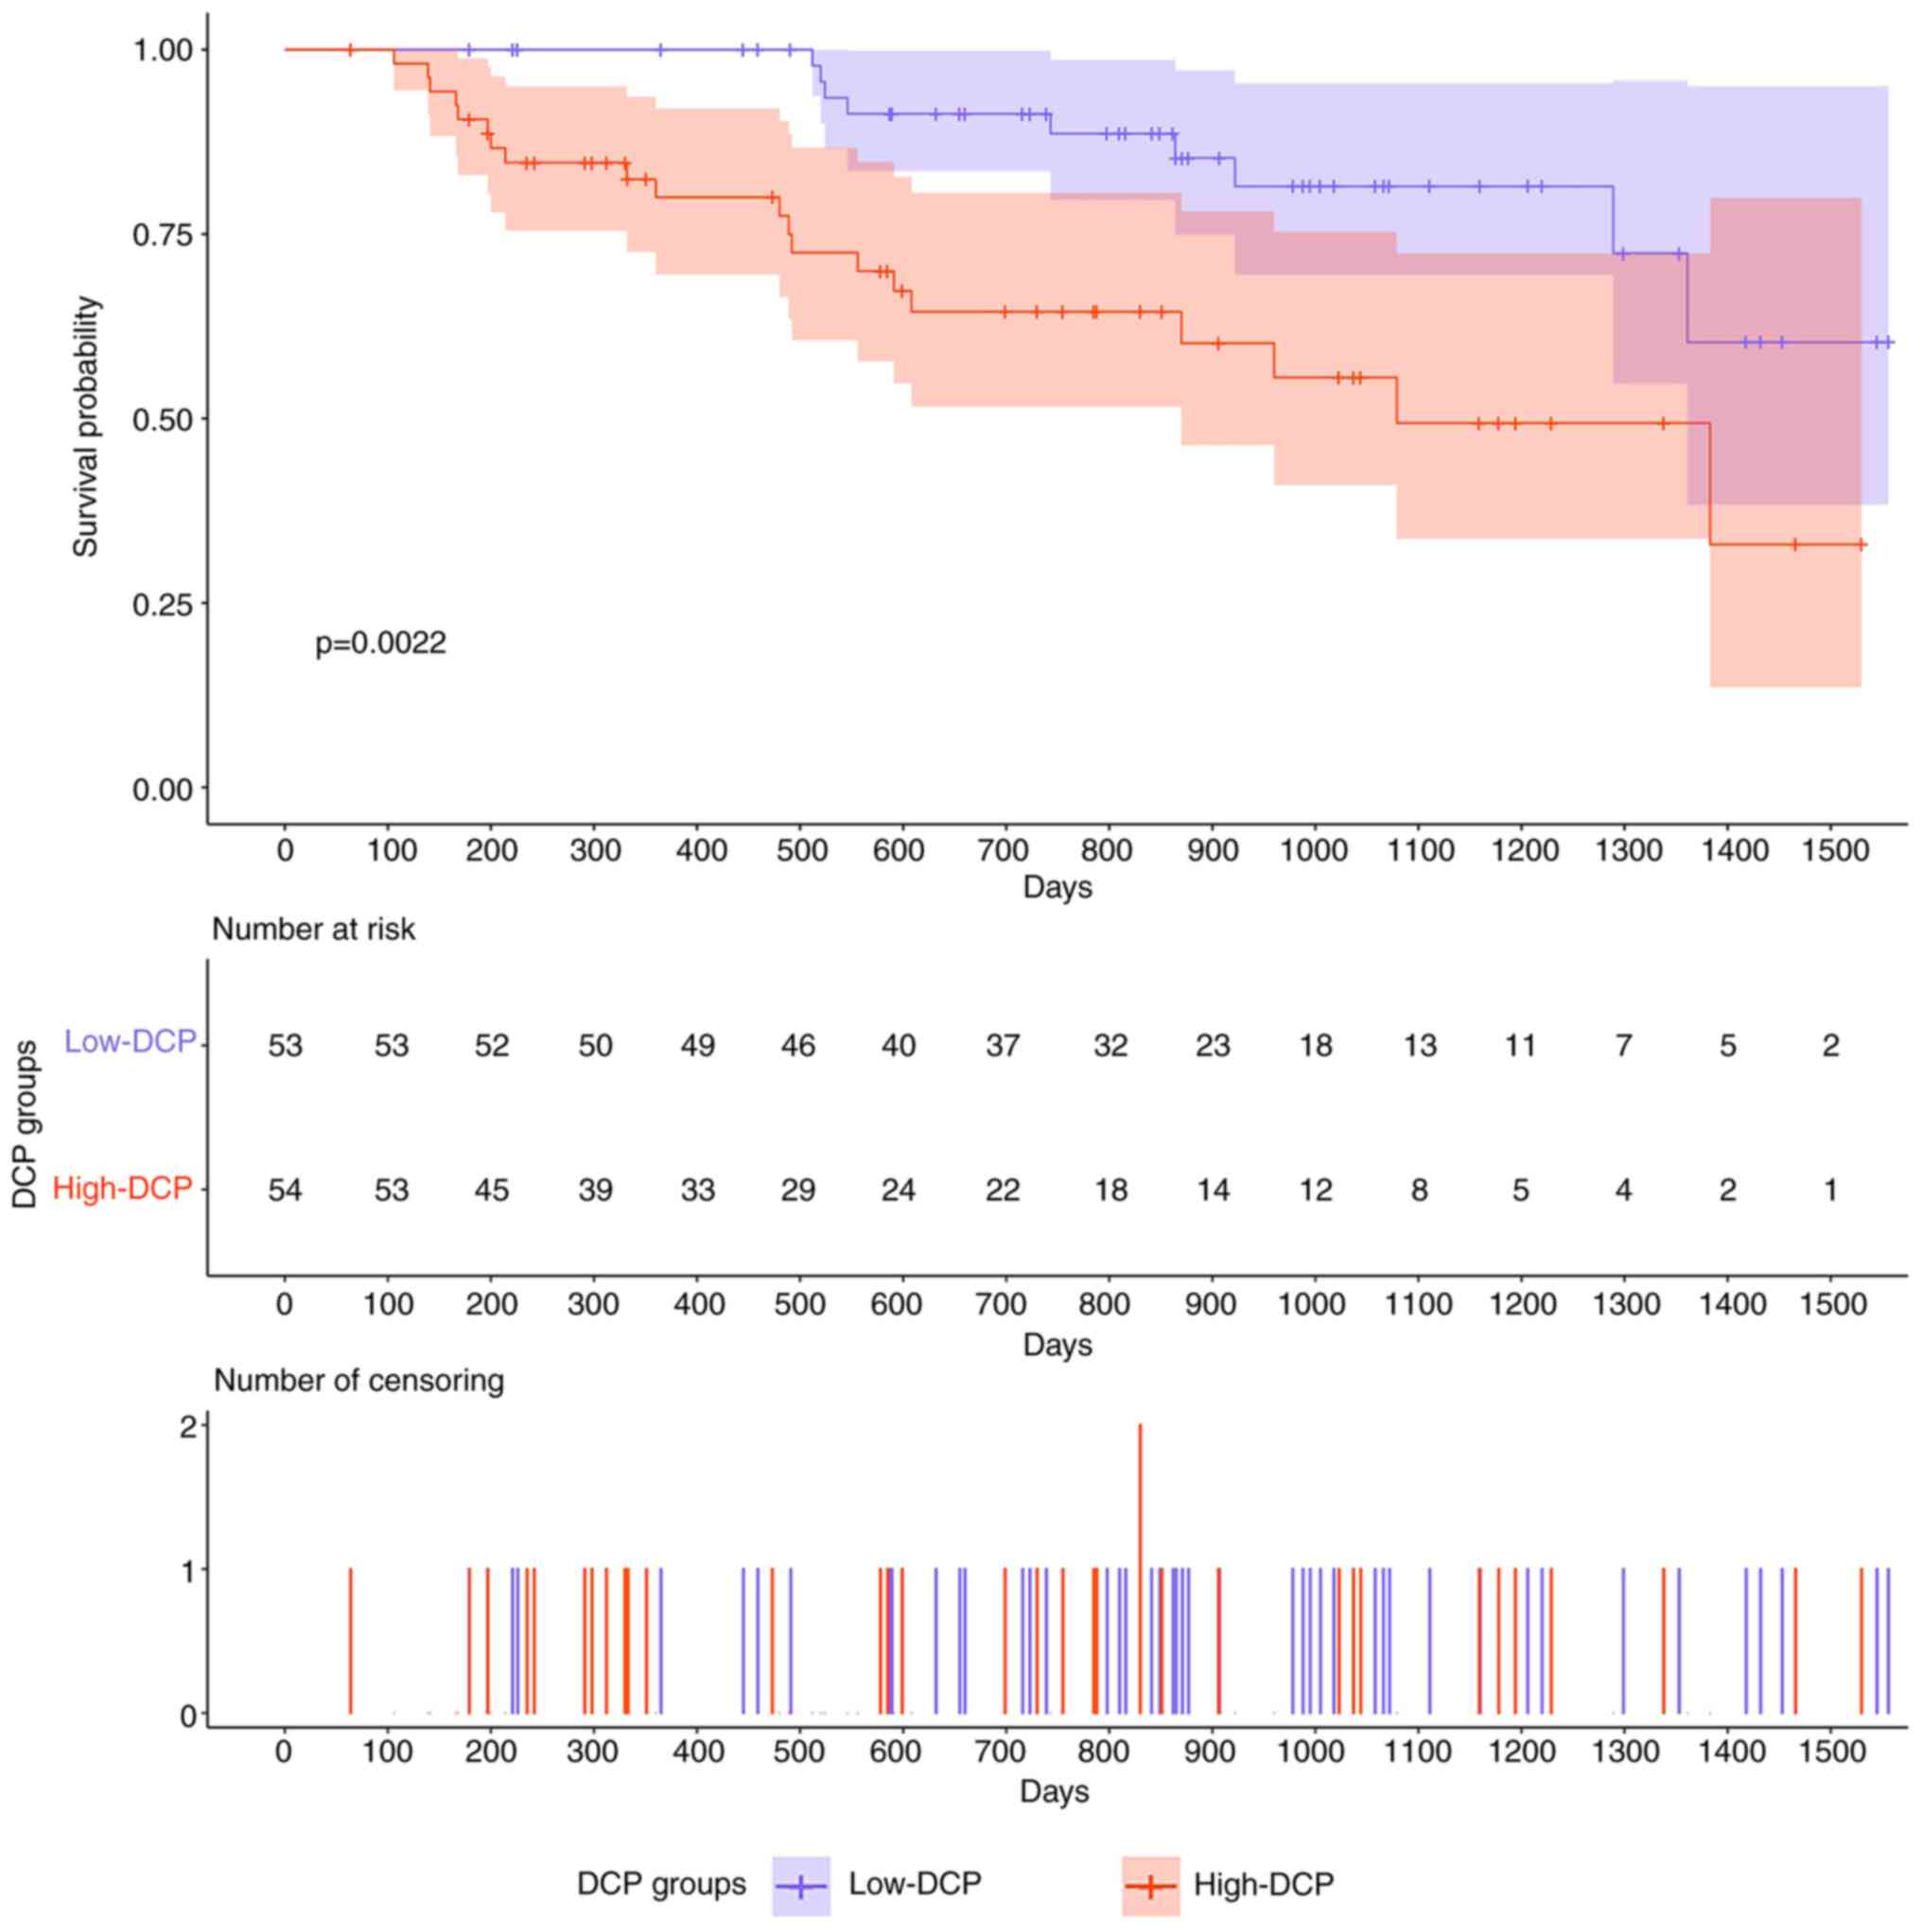
In our cohort, the median follow-up time of all
patients was 755 days (64–1,556 days); 31 patients died, 75
survived and 1 was lost to follow-up. 11 patients in the low-DCP
group (20.8%) died. Among them, 10 died from HCC progression and 1
died from other causes. In addition, 20 patients in the high-DCP
group (37.0%) died, all from HCC progression. The mean survival
time in the low-DCP group was 1,350 days, whereas the mean survival
time in the high-DCP group was 1,005 days. The median survival time
in the high-DCP group was 1,079 days, and the median survival time
in the low-DCP group was not reached. Survival analysis was
performed using the Kaplan-Meier method with a log-rank test. The
OS time of the patients in the high-DCP group was shorter than that
of the patients in the low-DCP group (log-rank P=0.0022; Fig. 2).
Prognostic factors of
‘single-positive’ patients who underwent TACE
In univariate analysis of OS time, lymphatic node
metastasis [hazard ratio (HR), 3.924; P<0.001; 95% CI,
1.883-8.181], DCP group (HR, 3.219; P=0.004; 95% CI, 1.461-7.093),
Child-Pugh classification (HR, 2.876; P=0.010; 95% CI,
1.287-6.427), tumor size (HR, 1.085; P=0.026; 95% CI, 1.010-1.167),
tumor number (HR, 3.061; P=0.038; 95% CI, 1.062-8.822) and HDL (HR,
0.265; P=0.048; 95% CI, 0.071-0.991) were significant prognostic
factors in our cohort. In multivariate analysis of OS time,
lymphatic node metastasis (HR, 3.903; P=0.001; 95% CI, 1.778-8.519)
and DCP group (HR, 2.465; P=0.041; 95% CI, 1.038-5.854) were
significant prognostic factors of poor survival. The results are
shown in Table II.
| Table II.Univariate and multivariate analyses
of prognostic factors for overall survival of patients in our
cohort. |
Table II.
Univariate and multivariate analyses
of prognostic factors for overall survival of patients in our
cohort.
|
| Univariate
analysis | Multivariate
analysis |
|---|
|
|
|
|
|---|
| Variables | HR (95% CI) | P-value | HR (95% CI) | P-value |
|---|
| Age (≤60 vs. >60
years) | 1.614
(0.714-3.648) | 0.250 |
|
|
| Sex (male vs.
female) | 0.521
(0.211-1.284) | 0.157 |
|
|
| DCP group (low-DCP
group vs. high-DCP group) | 3.219
(1.461-7.093) | 0.004 | 2.465
(1.038-5.854) | 0.041 |
| Hepatitis (yes vs.
no) | 0.725
(0.334-1.574) | 0.416 |
|
|
| ECOG score (0 vs.
1) | 1.762
(0.816-3.808) | 0.149 |
|
|
| Child-Pugh
classification (A vs. B) | 2.876
(1.287-6.427) | 0.010 | 1.887
(0.798-4.459) | 0.148 |
| ALT | 1.011
(0.995-1.026) | 0.181 |
|
|
| AST | 1.009
(0.994-4.024) | 0.229 |
|
|
| TBil | 1.008
(1.000-1.017) | 0.061 |
|
|
| HDL | 0.265
(0.071-0.991) | 0.048 | 0.743
(0.198-2.782) | 0.659 |
| RBP | 1.002
(0.966-4.040) | 0.913 |
|
|
| PLT | 1.004
(0.999-4.009) | 0.168 |
|
|
| PCT | 1.029
(0.980-4.081) | 0.248 |
|
|
| PDW | 0.963
(0.829-4.120) | 0.627 |
|
|
| RDW | 0.966
(0.810-4.152) | 0.700 |
|
|
| Tumor size | 1.085
(1.010-1.167) | 0.026 | 1.062
(0.975-1.158) | 0.170 |
| Tumor number
(single vs. multiple) | 3.061
(1.062-8.822) | 0.038 | 2.402
(0.811-7.111) | 0.114 |
| N-metastasis (yes
vs. no) | 3.924
(1.883-8.181) | <0.001 | 3.903
(1.778-8.519) | 0.001 |
| M-metastasis (yes
vs. no) | 0.704
(0.095-5.217) | 0.731 |
|
|
Identification of DEGs in
‘single-positive’ patients
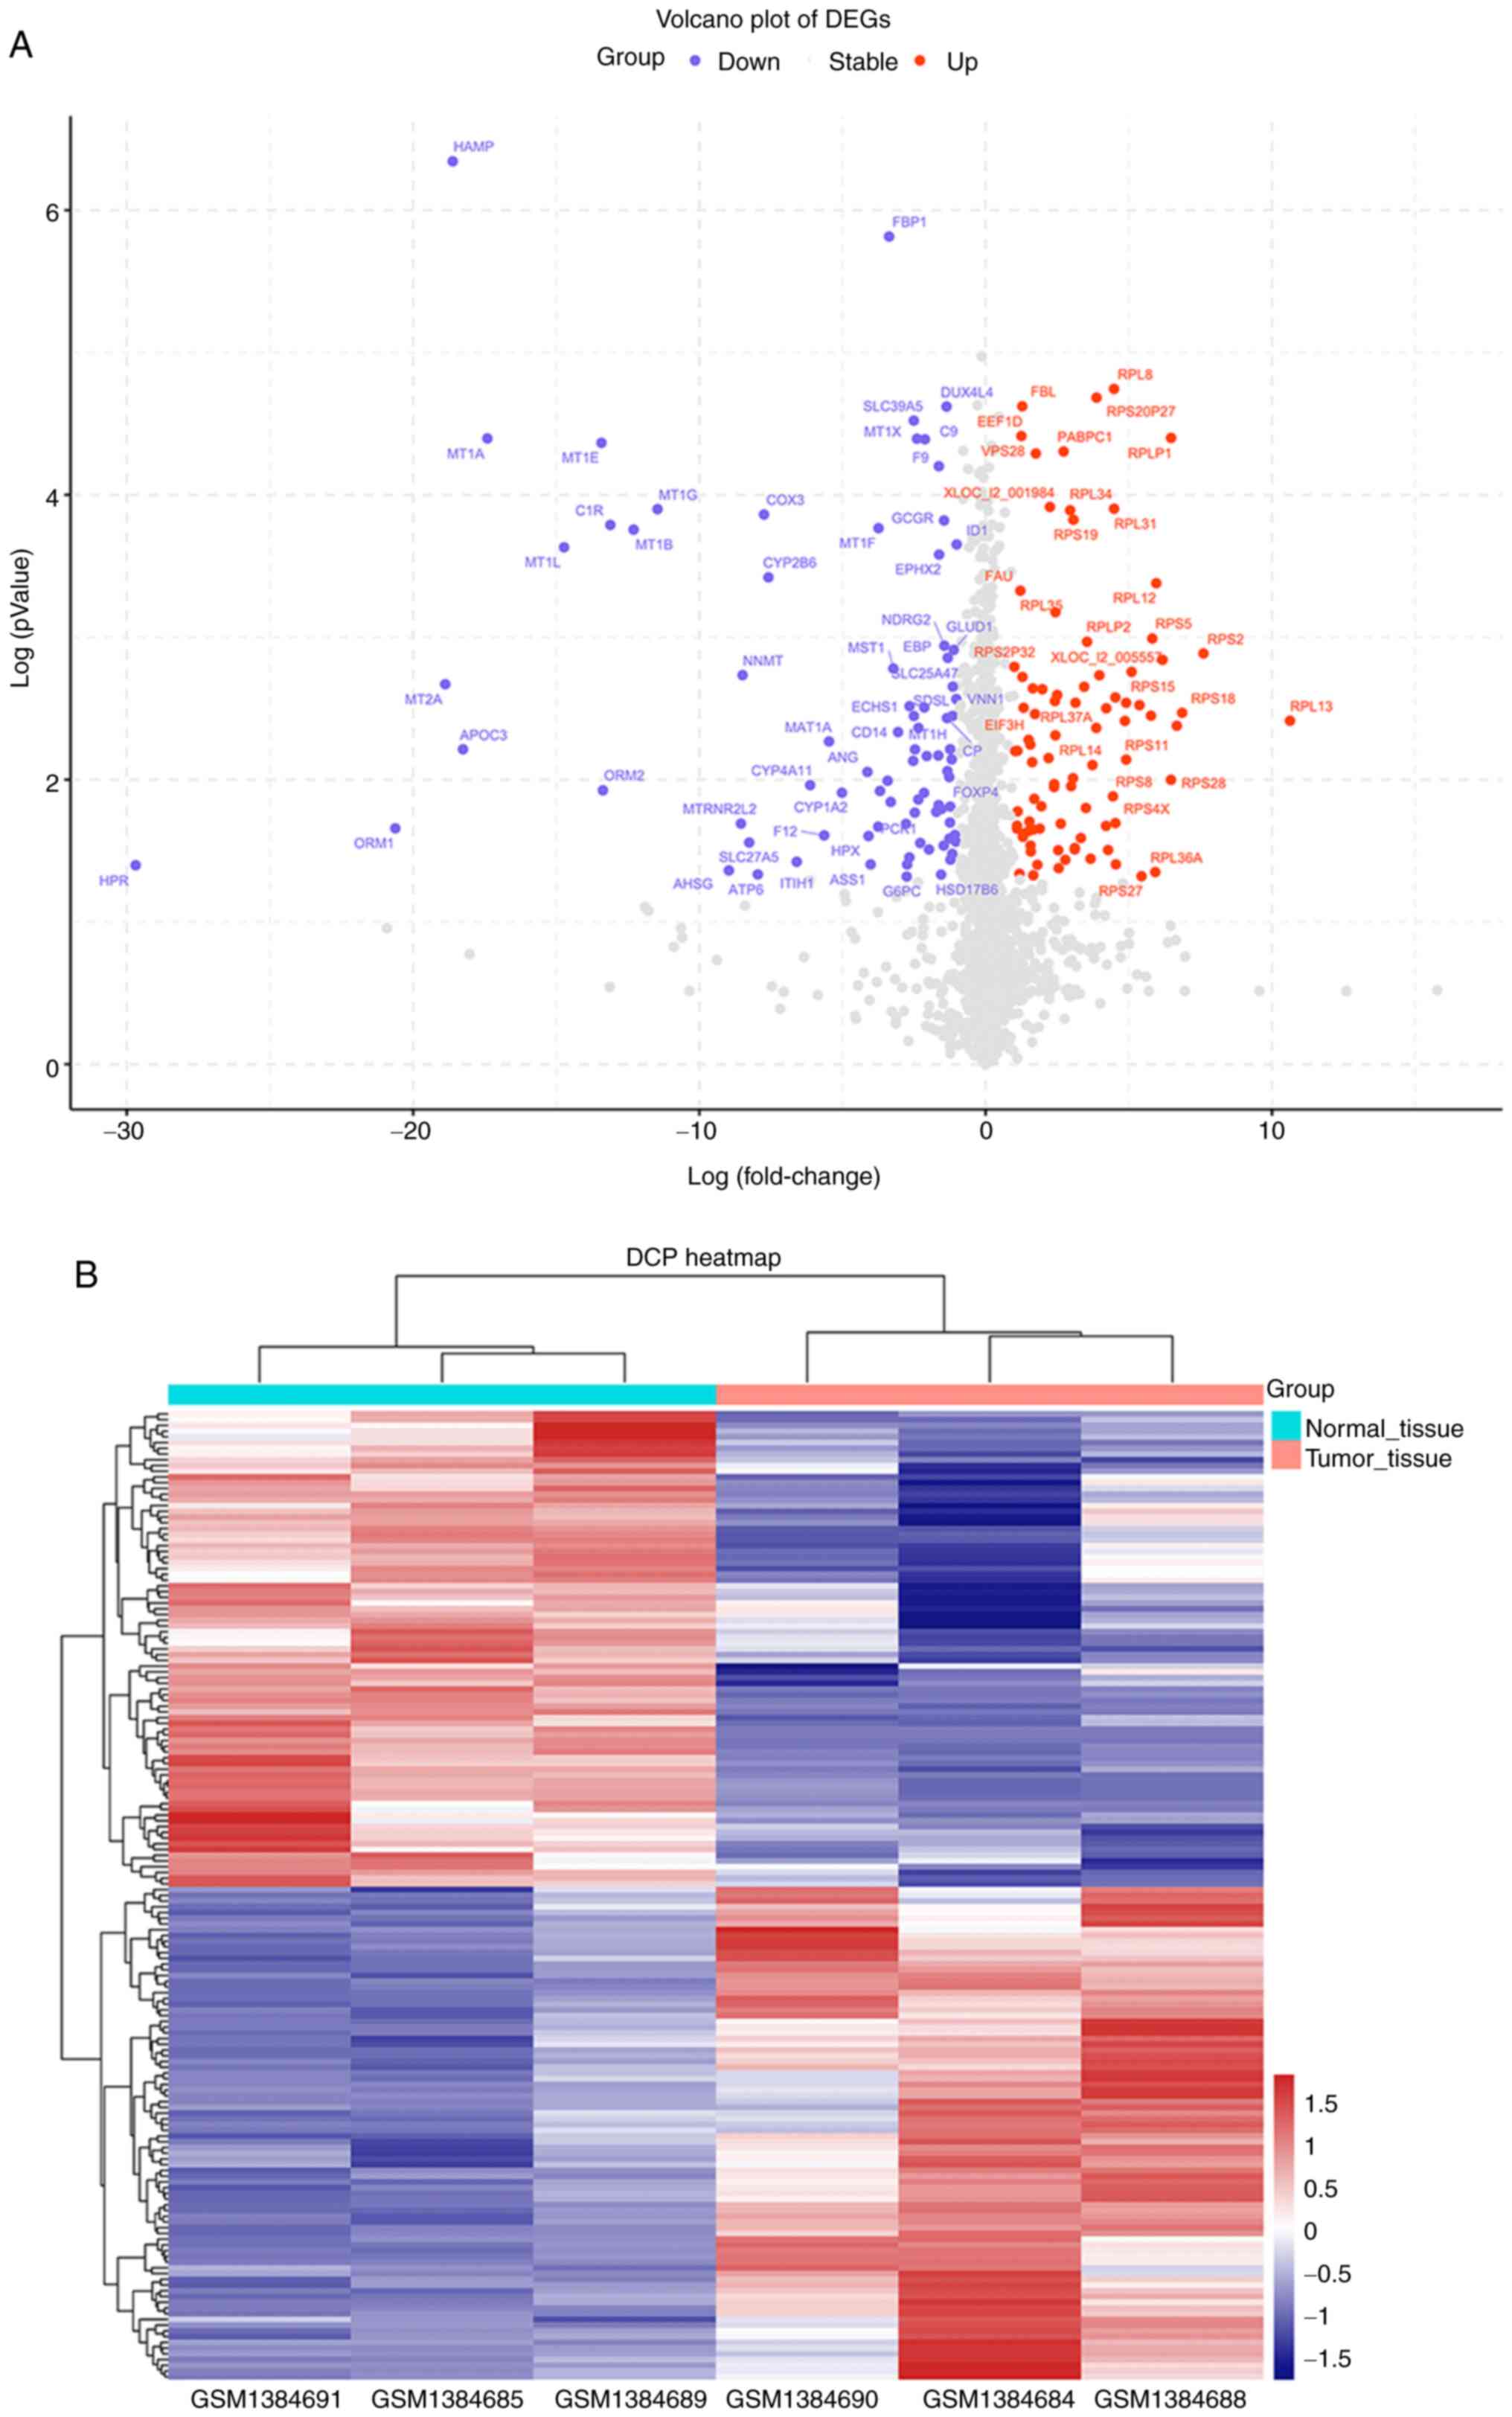
To identify DEGs in tumor tissues and normal tissues
of ‘single-positive’ patients, the mRNA expression profile dataset
(GSE57555) from ‘single-positive’ patients with HCC was first
downloaded. Based on the cutoff criteria used to determine the
DEGs, 169 DEGs were identified between tumor and nontumor samples
(adjacent tumor tissues from the same patients), including 83
upregulated DEGs and 86 downregulated DEGs. A volcano plot
(Fig. 3A) and a clustering heatmap
(Fig. 3B) indicated the
distribution of DEGs.
GO and KEGG pathway enrichment
analyses of DEGs
Next, it was attempted to identify the biological
function of the 169 DEGs. The Bioconductor package ‘Cluster
Profiler’ of R software was used to carry out GO functional
enrichment analysis.
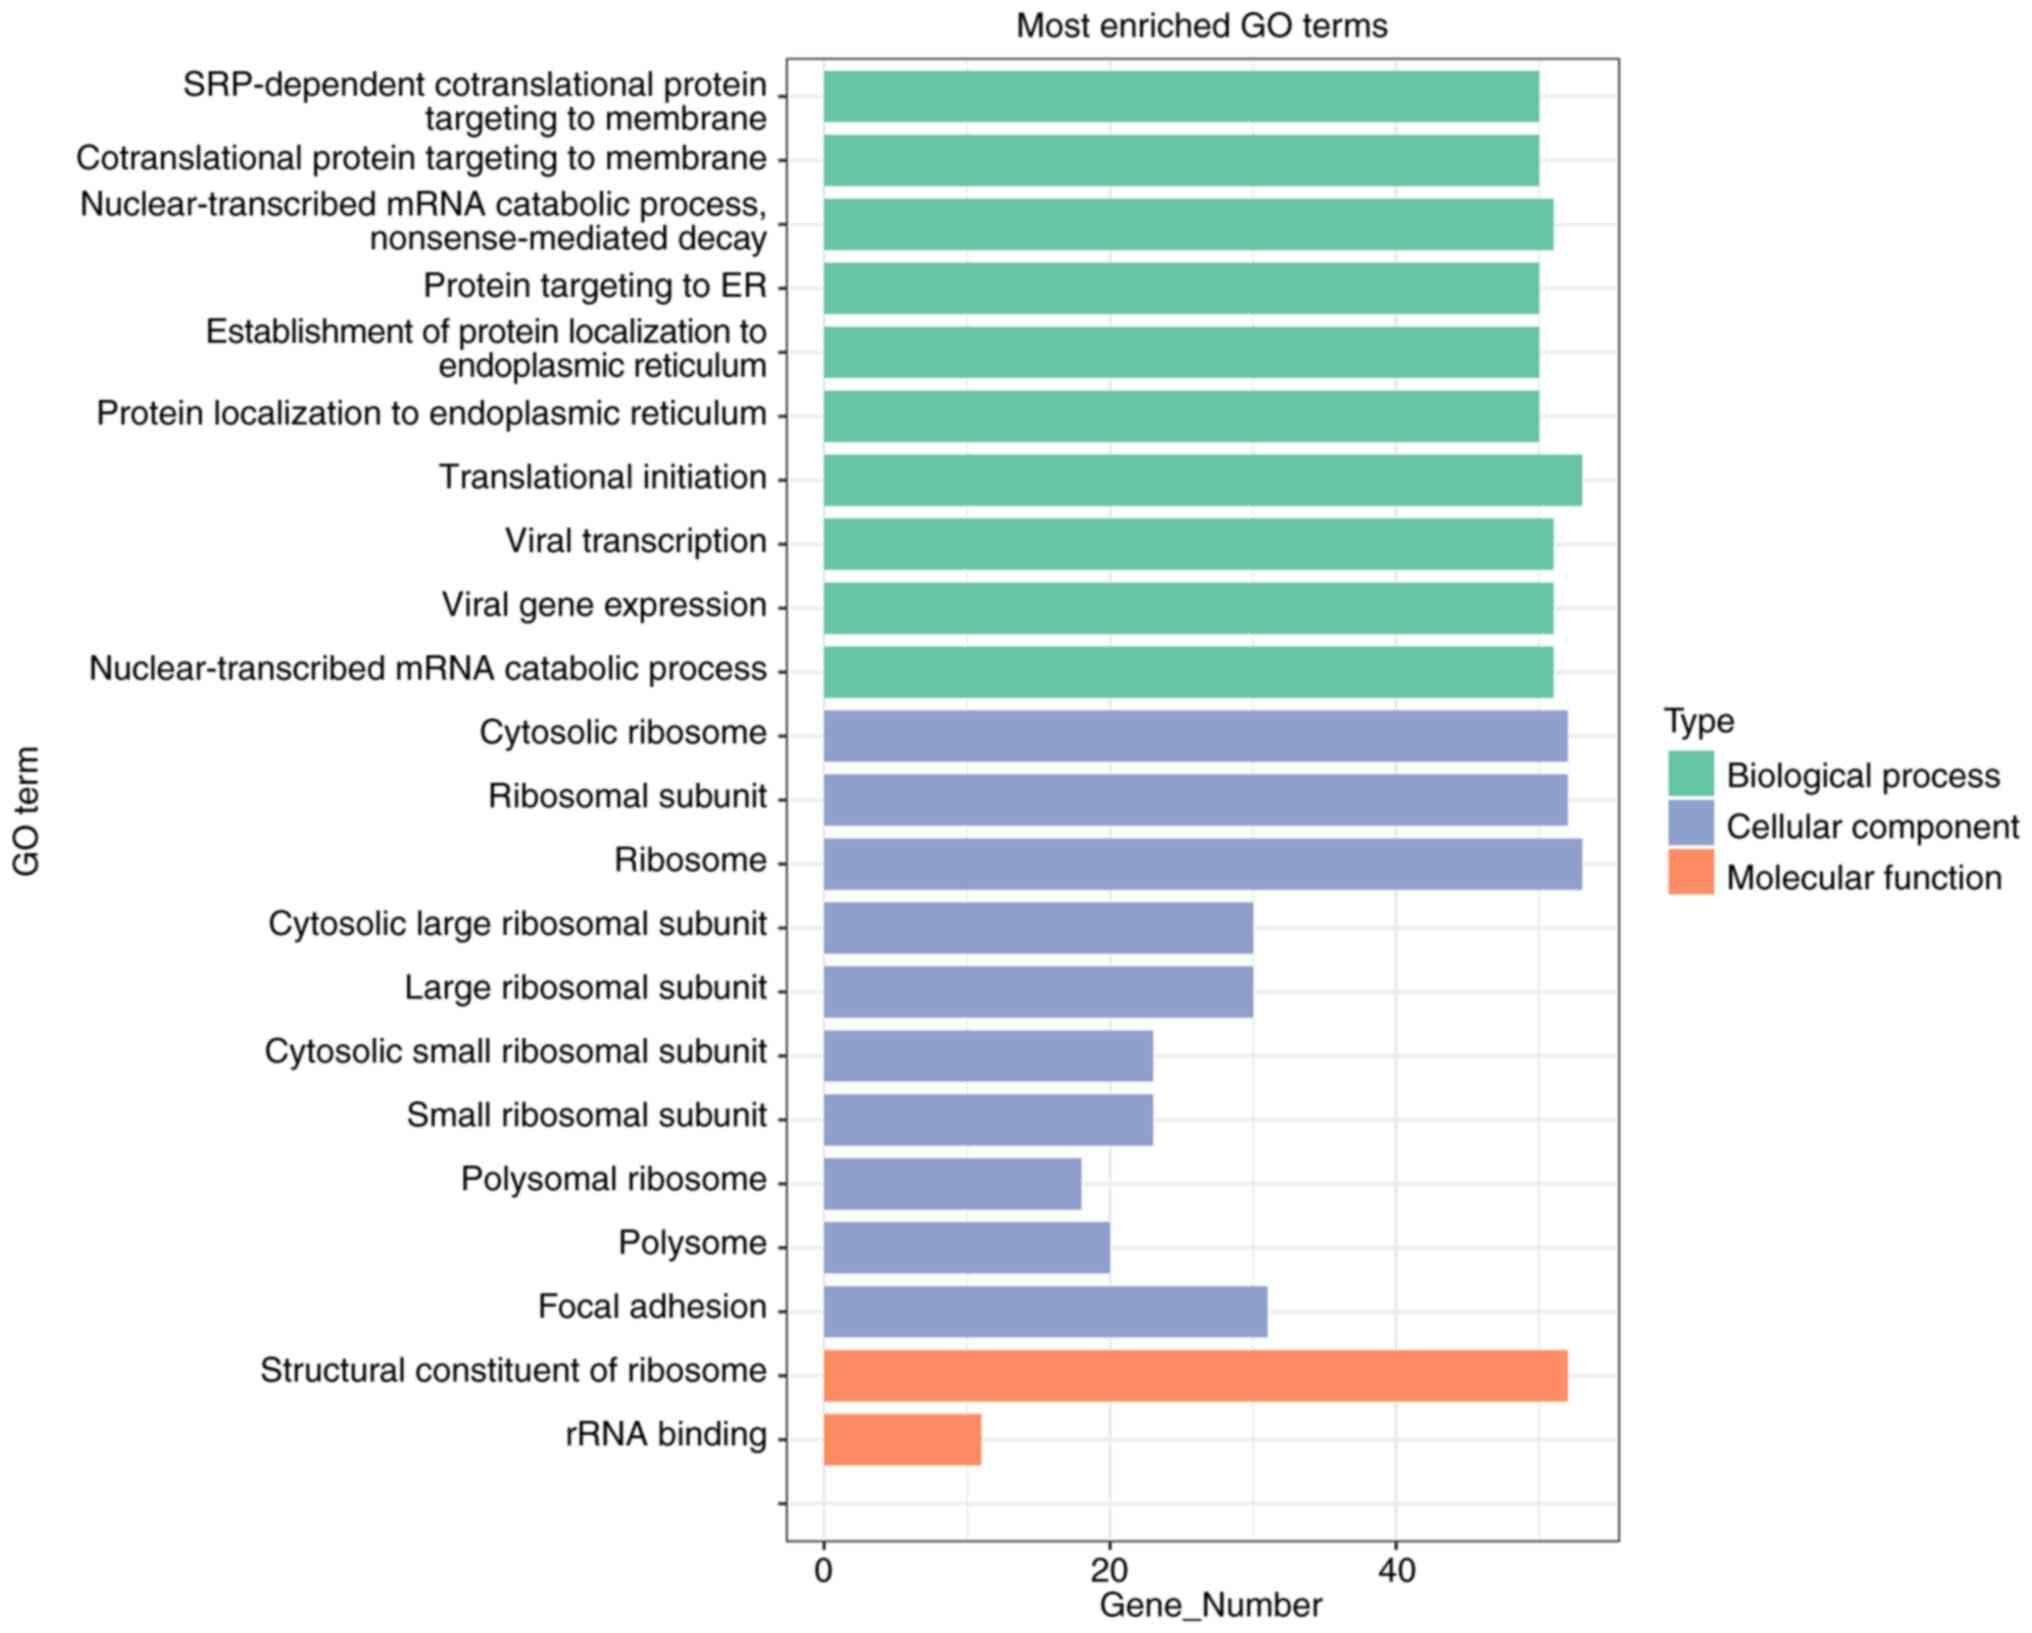
As shown in Fig. 4
and Table III, the top five
terms for biological processes were: ‘SRP-dependent cotranslational
protein targeting to membrane’, ‘cotranslational protein targeting
to membrane’, ‘nuclear-transcribed mRNA catabolic process,
nonsense-mediated decays’, ‘protein targeting to ER’ and
‘establishment of protein localization to the endoplasmic
reticulum’. The top two molecular functions were: ‘structural
constituent of ribosome’ and ‘rRNA binding’. The top five terms for
cellular components were: ‘cytosolic ribosome’, ‘ribosomal
subunit’, ‘ribosome’, ‘cytosolic large ribosomal subunit’ and
‘large ribosomal subunit’.
| Table III.Most significantly enriched GO terms
for differentially expressed genes determined using the Gene
Expression Omnibus dataset. |
Table III.
Most significantly enriched GO terms
for differentially expressed genes determined using the Gene
Expression Omnibus dataset.
| GO ID | GO name | Gene ratio | P-value |
|---|
| BP |
|
|
|
|
GO:0006614 | SRP-dependent
cotranslational protein targeting to membrane | 50/151 |
3.36×10-79 |
|
GO:0006613 | Cotranslational
protein targeting to membrane | 50/151 |
4.03×10-78 |
|
GO:0000184 | Nuclear-transcribed
mRNA catabolic process, nonsense-mediated decay | 51/151 |
1.51×10-77 |
|
GO:0045047 | Protein targeting
to ER | 50/151 |
2.04×10-75 |
|
GO:0072599 | Establishment of
protein localization to endoplasmic reticulum | 50/151 |
1.63×10-74 |
|
GO:0070972 | Protein
localization to endoplasmic reticulum | 50/151 |
4.20×10-69 |
|
GO:0006413 | Translational
initiation | 53/151 |
1.02×10-68 |
|
GO:0019083 | Viral
transcription | 51/151 |
5.91×10-67 |
|
GO:0019080 | Viral gene
expression | 51/151 |
1.22×10-64 |
|
GO:0000956 | Nuclear-transcribed
mRNA catabolic process | 51/151 |
8.67×10-63 |
| CC |
|
|
|
|
GO:0022626 | Cytosolic
ribosome | 52/152 |
6.65×10-83 |
|
GO:0044391 | Ribosomal
subunit | 52/152 |
3.55×10-68 |
|
GO:0005840 | Ribosome | 53/152 |
1.32×10-60 |
|
GO:0022625 | Cytosolic large
ribosomal subunit | 30/152 |
6.05×10-49 |
|
GO:0015934 | Large ribosomal
subunit | 30/152 |
7.73×10-38 |
|
GO:0022627 | Cytosolic small
ribosomal subunit | 23/152 |
7.36×10-37 |
|
GO:0015935 | Small ribosomal
subunit | 23/152 |
3.17×10⁻³¹ |
|
GO:0042788 | Polysomal
ribosome | 18/152 |
1.63×10⁻³⁰ |
|
GO:0005844 | Polysome | 20/152 |
1.49×10⁻²⁶ |
|
GO:0005925 | focal adhesion | 31/152 |
8.34×10⁻²² |
| MF |
|
|
|
|
GO:0003735 | Structural
constituent of ribosome | 52/149 |
2.62×10-65 |
|
GO:0019843 | rRNA binding | 11/149 |
3.58×10⁻¹² |
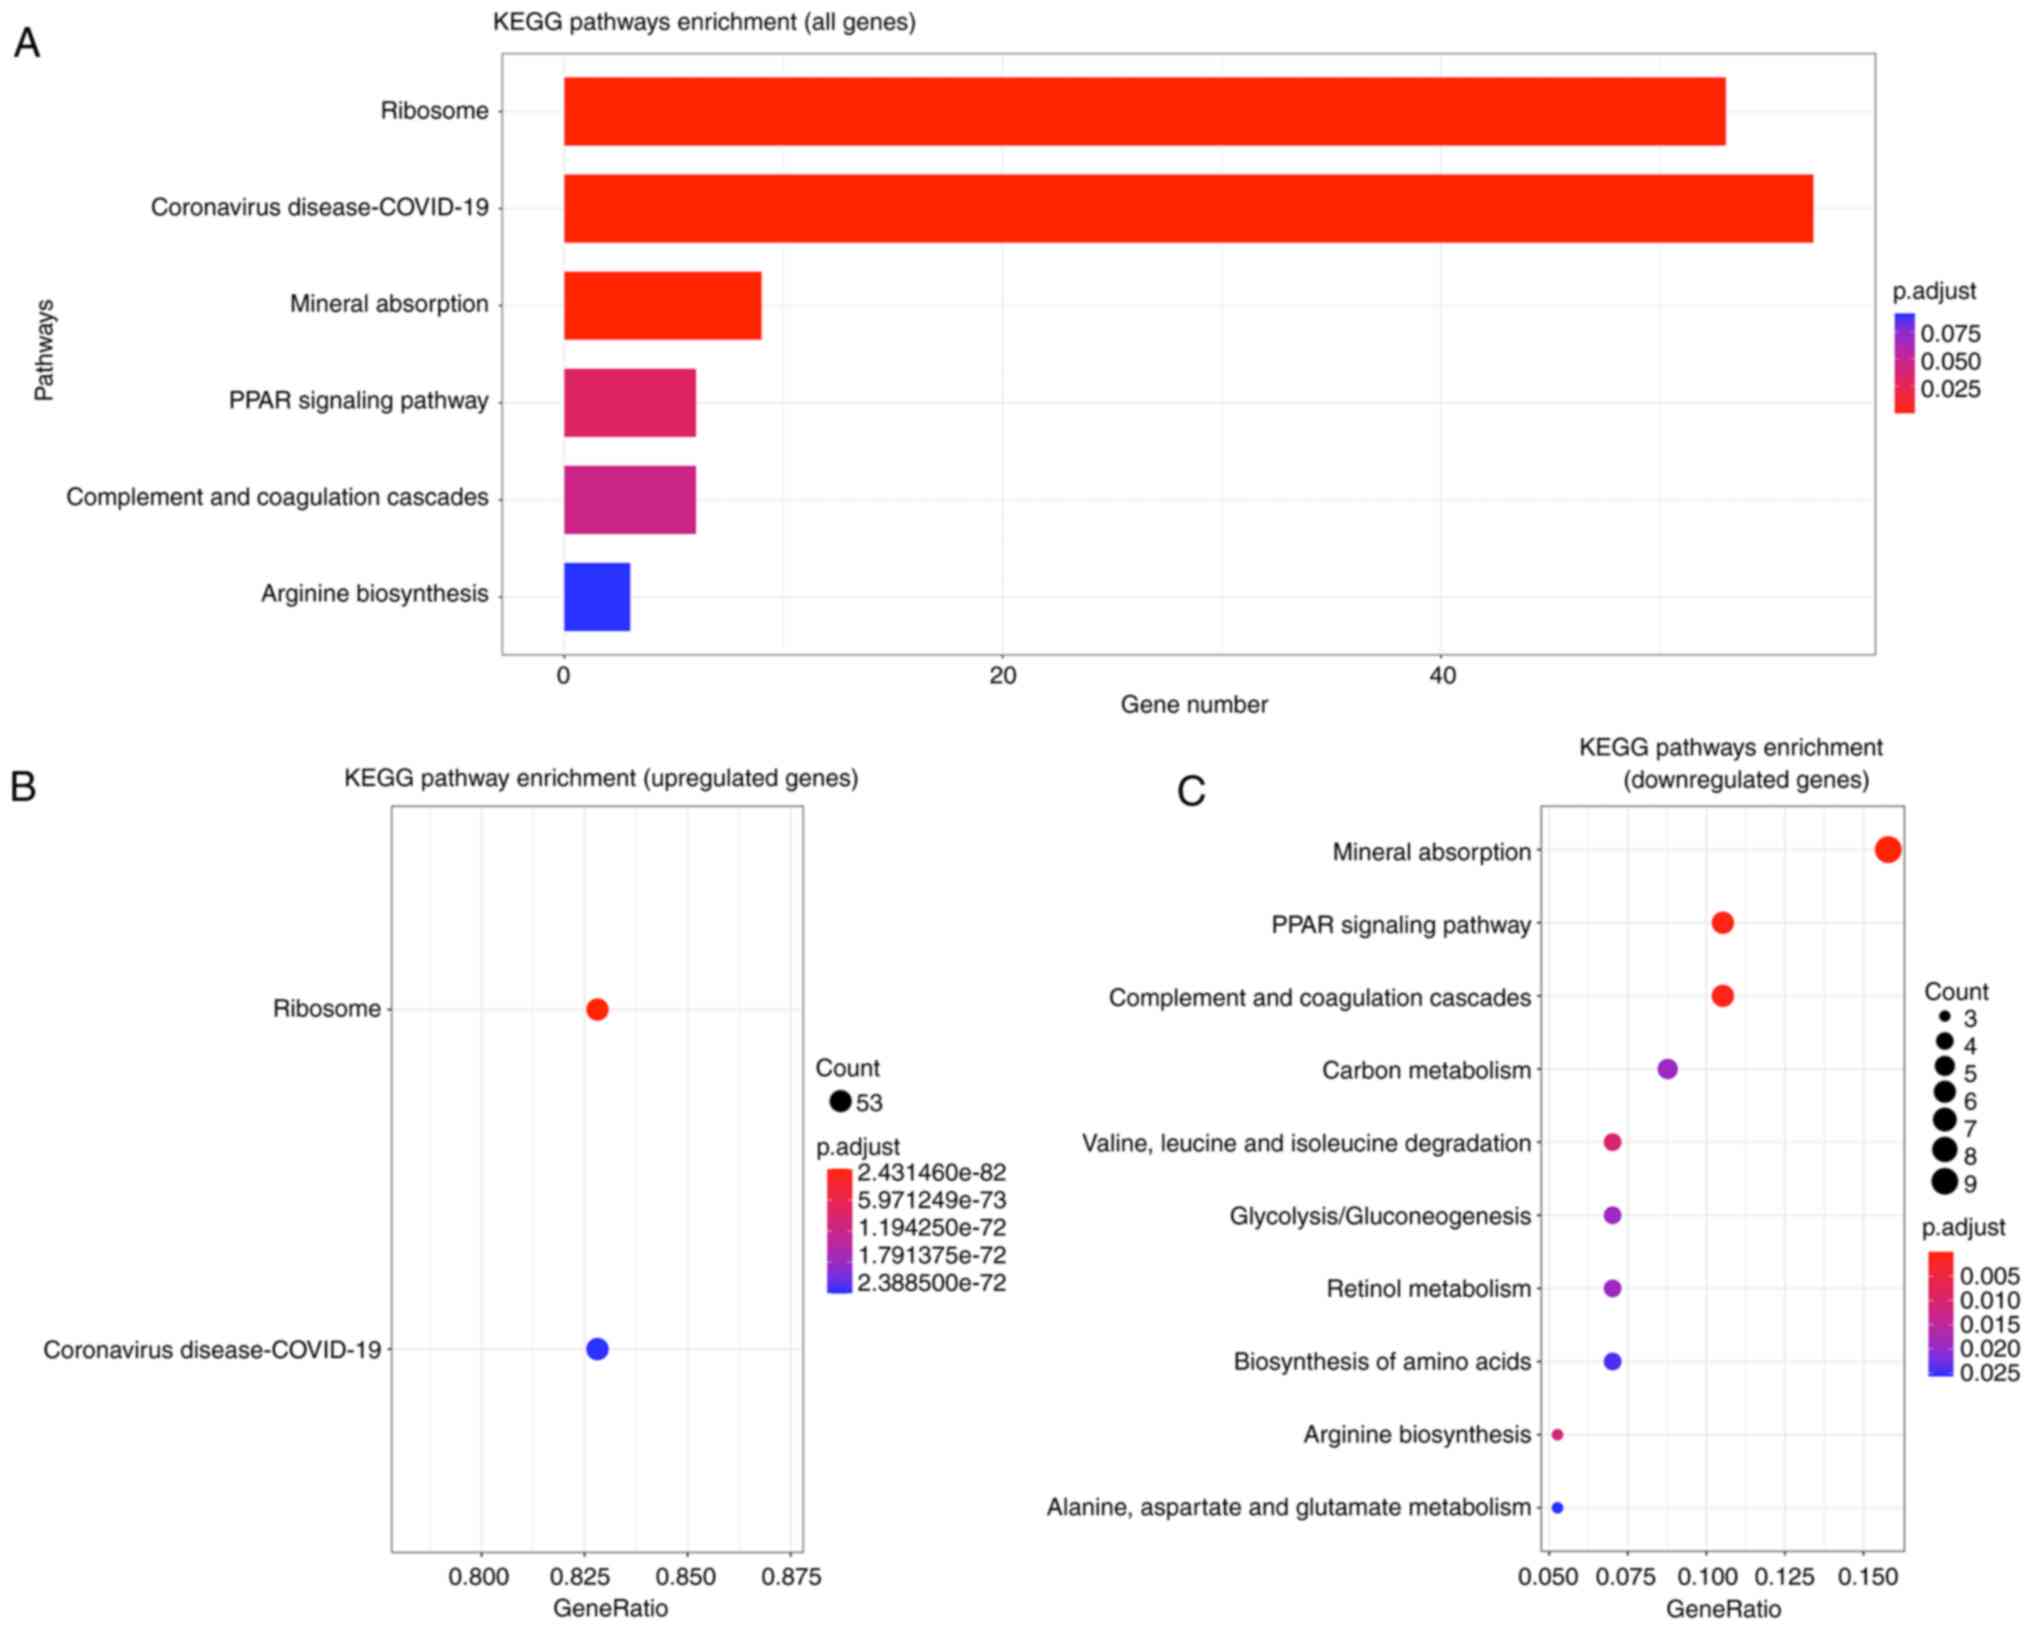
In addition, the results of KEGG pathway enrichment
analysis indicated that upregulated DEGs were mainly enriched in
the ‘Ribosome’ and the ‘Coronavirus disease-COVID-19’ pathway. The
top five pathways in terms of significance enriched by the
downregulated DEGs include: ‘Mineral absorption’, ‘PPAR signaling
pathway’, ‘Complement and coagulation cascades’, ‘Valine, leucine
and isoleucine degradation’ and the ‘Arginine biosynthesis’ pathway
(Fig. 5B and C; Table IV). Fig. 5A shows the top six pathways that
were significantly enriched for all genes.
| Table IV.Most significantly enriched KEGG
terms for differentially expressed genes determined using the Gene
Expression Omnibus dataset. |
Table IV.
Most significantly enriched KEGG
terms for differentially expressed genes determined using the Gene
Expression Omnibus dataset.
| KEGG pathway
number | Signaling
pathway | Gene ratio | P-value |
|---|
| Downregulated |
|
|
|
|
hsa04978 | Mineral
absorption | 9/57 |
2.48×10⁻¹⁰ |
|
hsa03320 | PPAR signaling
pathway | 6/57 |
1.39×10⁻⁵ |
|
hsa04610 | Complement and
coagulation cascades | 6/57 |
2.66×10⁻⁵ |
|
hsa00280 | Valine, leucine and
isoleucine degradation | 4/57 |
3.42×10⁻⁴ |
|
hsa00220 | Arginine
biosynthesis | 3/57 |
4.64×10⁻⁴ |
|
hsa00010 |
Glycolysis/Gluconeogenesis | 4/57 |
1.22×10⁻³ |
|
hsa01200 | Carbon
metabolism | 5/57 |
1.23×10⁻³ |
|
hsa00830 | Retinol
metabolism | 4/57 |
1.29×10⁻³ |
|
hsa01230 | Biosynthesis of
amino acids | 4/57 |
1.85×10⁻³ |
|
hsa00250 | Alanine, aspartate
and glutamate metabolism | 3/57 |
2.17×10⁻³ |
| Upregulated |
|
|
|
|
hsa03010 | Ribosome | 53/64 |
6.65×10-83 |
|
hsa05171 | Coronavirus
disease-COVID-19 | 53/64 |
3.55×10-68 |
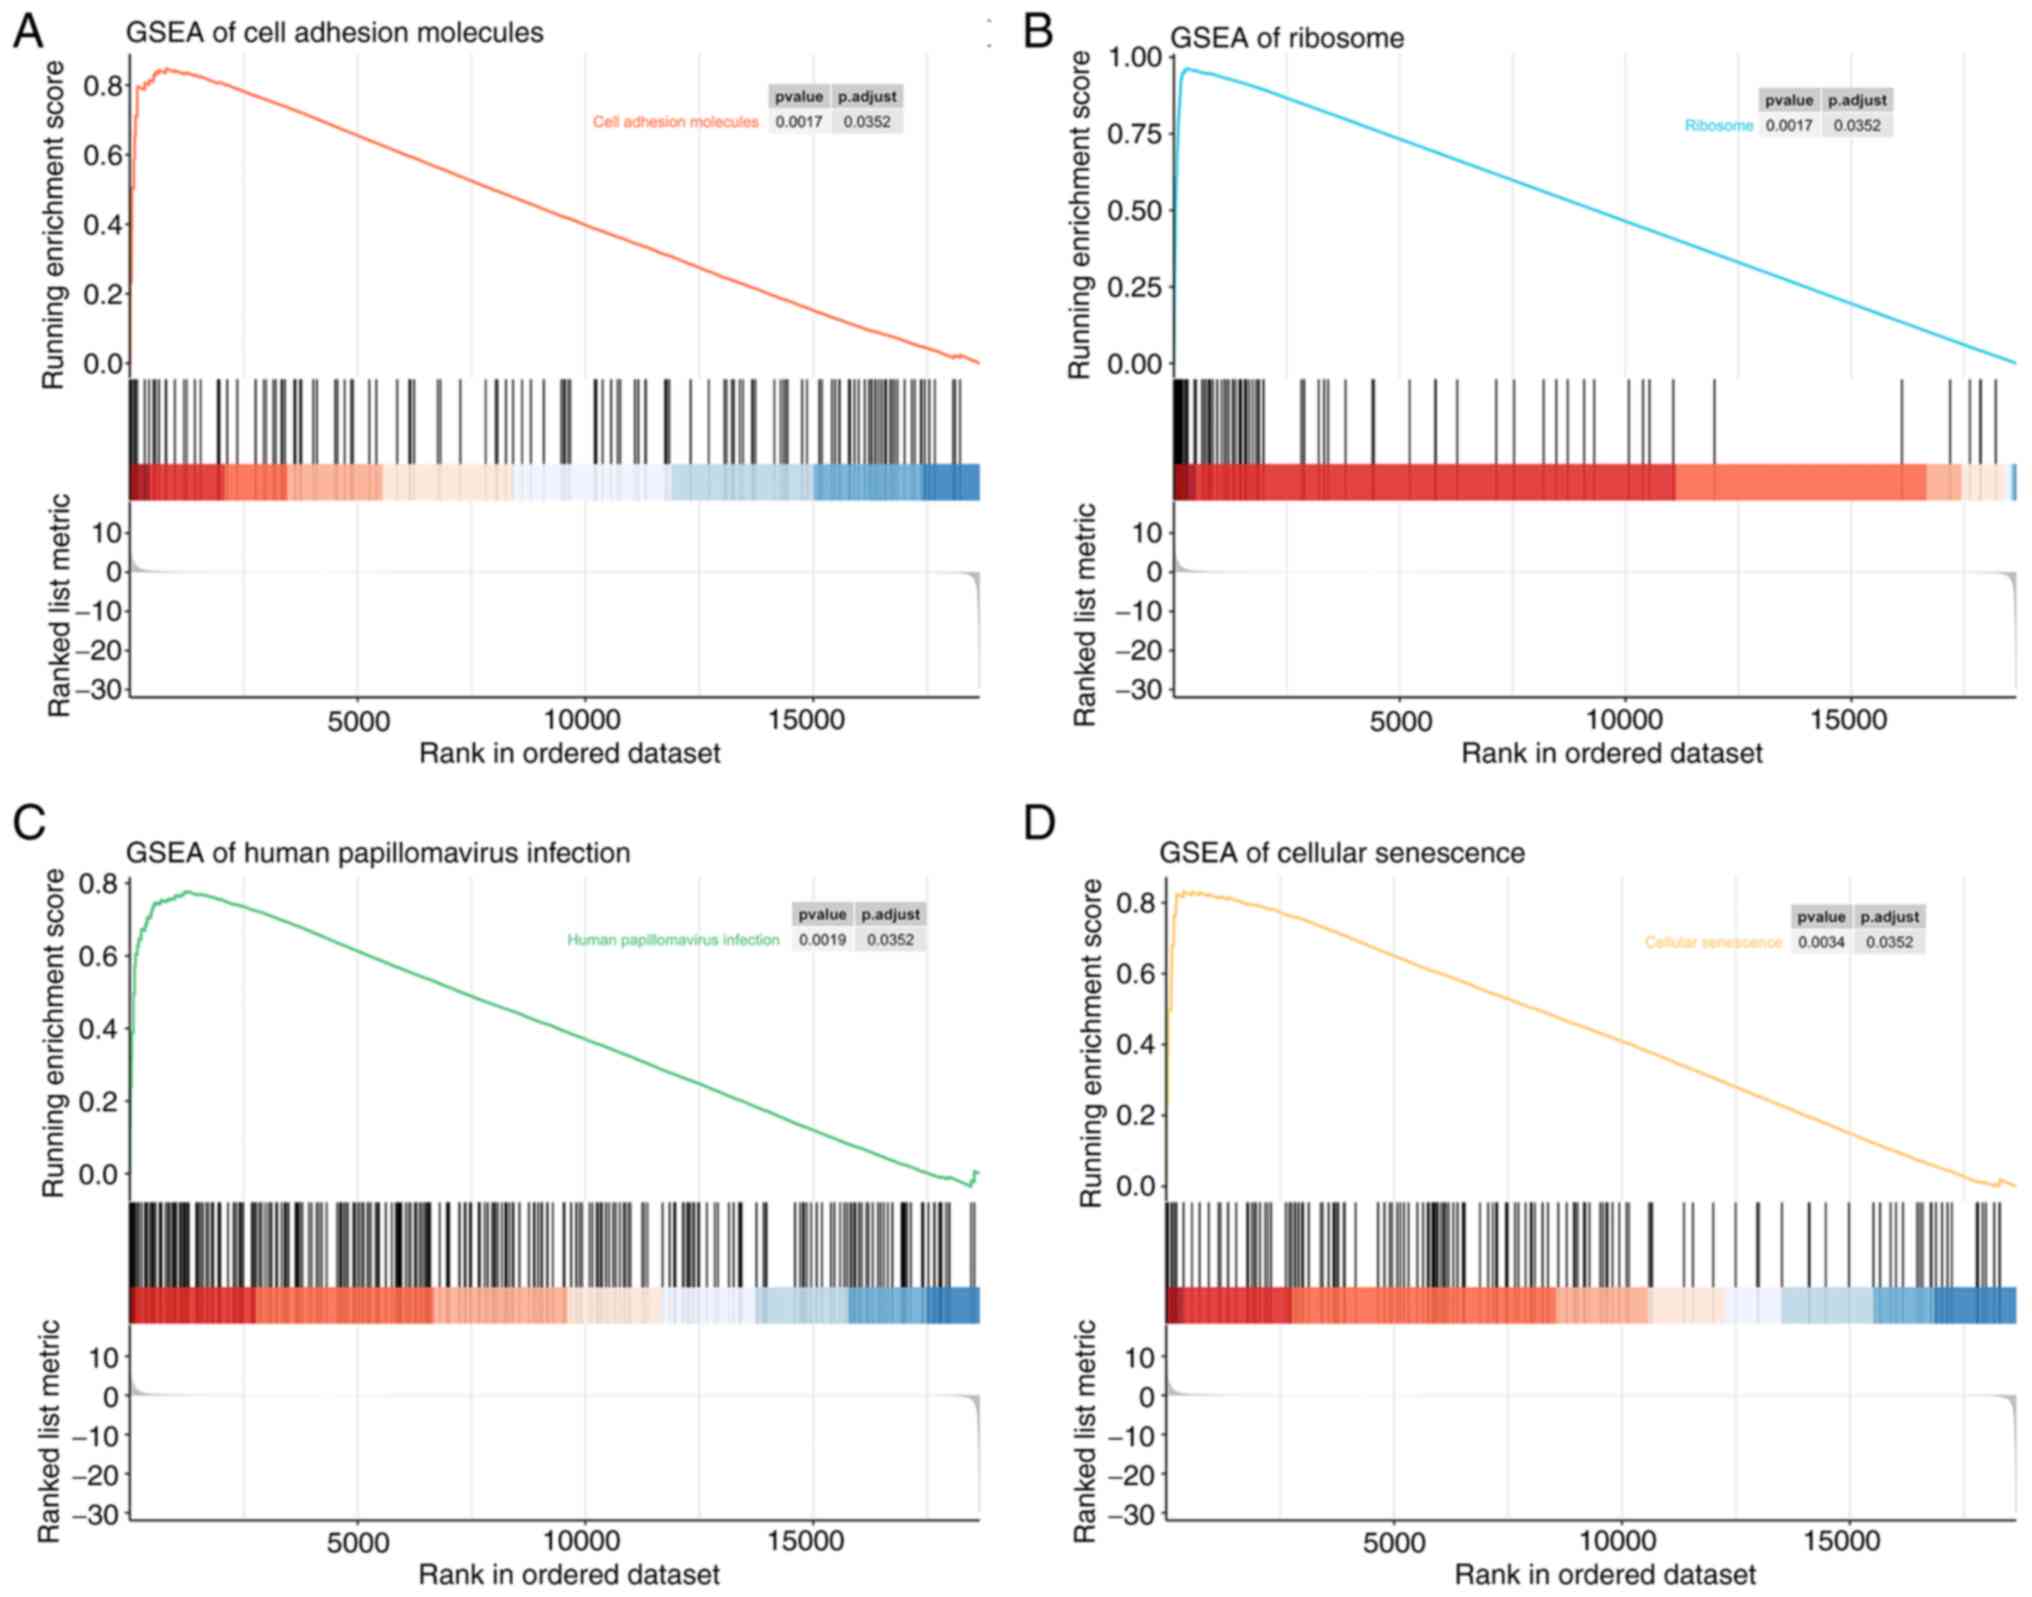
GSEA
GSEA was performed to identify the potential
associated biological processes and signaling pathways. As shown in
Fig. 6, several cancer-related and
protein synthesis pathways, such as ‘Cellular senescence’,
‘Ribosome’ and ‘Cell adhesion molecules’ pathways, were enriched.
The results also showed the enrichment of the ‘Human papillomavirus
infection’ pathway.
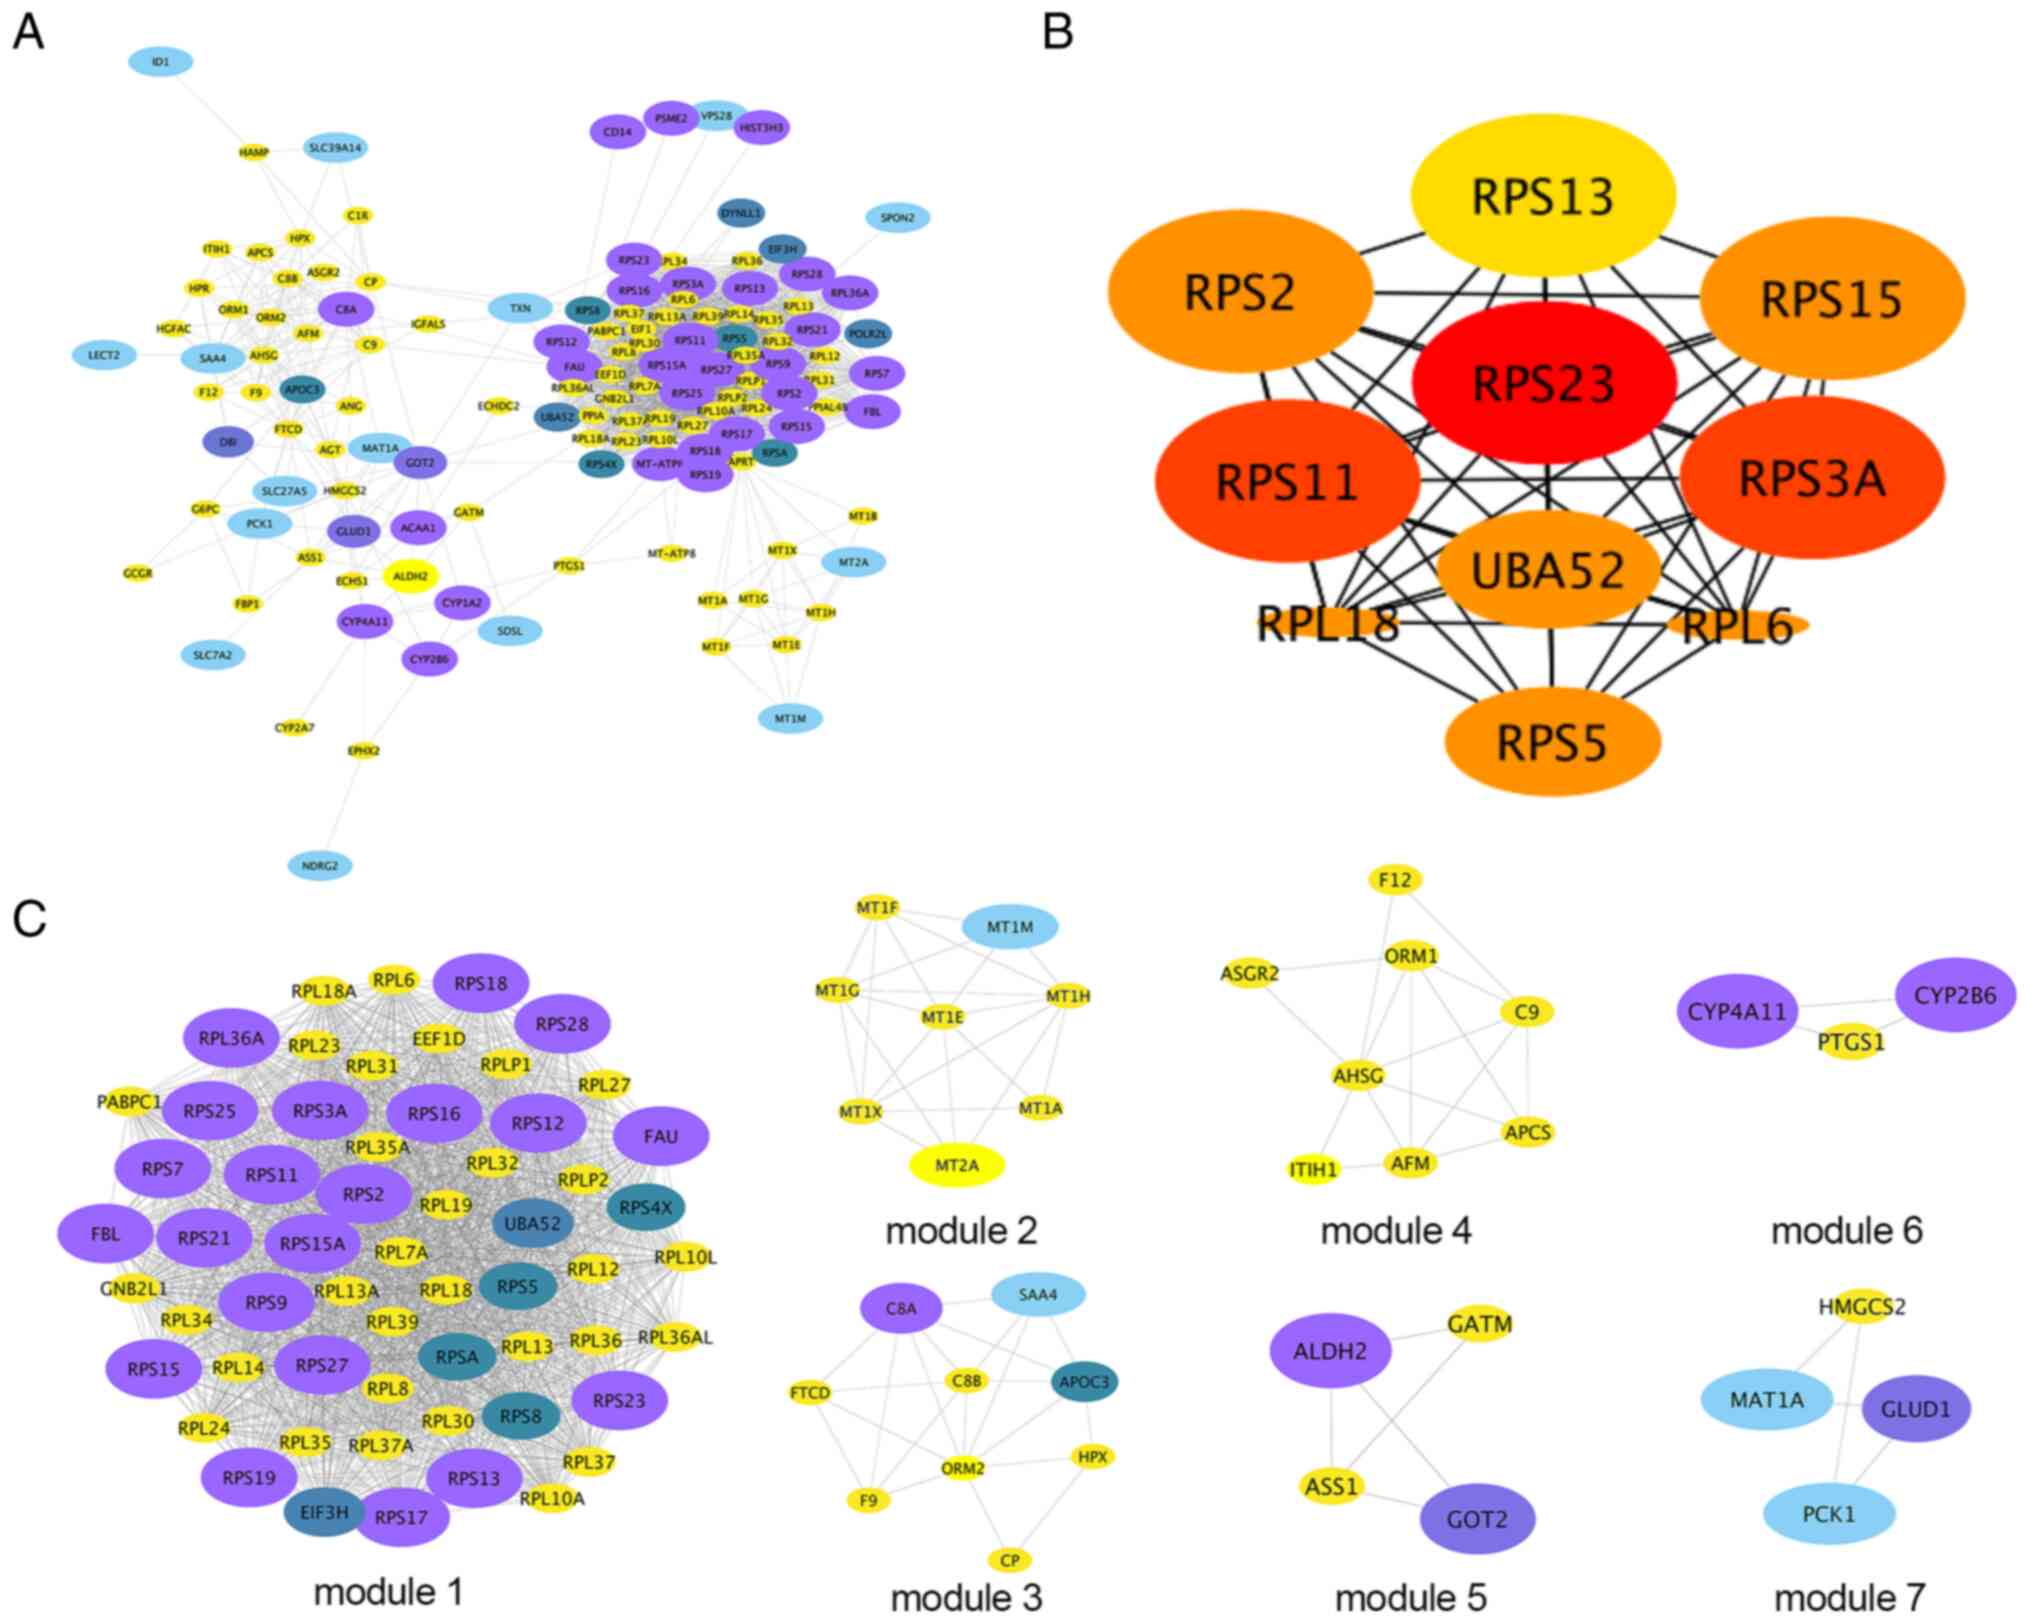
PPI network of DEGs
As shown in Fig.
7A, the PPI network based on STRING included 169 DEGs gathered
as a cluster consisting of 133 nodes and 1,944 edges. These results
were imported into Cytoscape software for visual analysis. Using
the cytoHubba plugin and the degree method, the top 10 hub genes
were identified: Ribosomal protein (RPS)23, UBA52, RPS11, RPS3A,
RPS2, RPS15, RPS5, RPL6, RPL18 and RPS13 (Fig. 7B). In addition, the MCODE plugin of
Cytoscape was used to analyze the whole network, which identified
seven subnetworks (Fig. 7C). Of
these, module 1 achieved the highest score (score, 57.404) and
featured the most hub genes.
Discussion
TACE is increasingly used in clinical settings as
the primary treatment for patients with unresectable HCC, which can
effectively prolong the survival of patients (5). Currently, the main tumor marker used
to predict the efficacy and prognosis of TACE is AFP (14). However, there are patients with HCC
with negative serum AFP levels, and it is difficult to predict the
effectiveness of TACE using AFP levels in clinical practice
(13). Liebman et al
(15) first reported elevated
serum DCP levels in patients with HCC in 1984 and that high-DCP
levels were associated with the development, metastasis and
recurrence of HCC. Since then, several studies have demonstrated
that serum DCP levels are an essential factor in the prognosis of
HCC (29,30), and DCP has become one of the
commonly accepted serum oncology markers in clinical practice. In
the Japanese Society of Hepatology clinical guidelines for HCC, DCP
is included for the assessment of the diagnosis and prognosis of
HCC, and the Asia-Pacific Association for the Study of the Liver
also recommends testing serum DCP levels (31,32).
On one hand, to the best of our knowledge, for AFP-negative
patients with HCC, there are no studies that have explored the
value of DCP in predicting the prognosis of patients treated by
TACE (33,34). The exploration of these populations
is one of the highlights of the present study. On the other hand,
previous studies did not use bioinformatics to analyze ‘single
positive’ patients. The present study briefly explored the key
signaling pathways and the relevant genes.
There is a lack of reports on the relationship
between DCP levels and prognosis in patients with AFP-negative HCC
treated with TACE, and the molecular mechanisms of ‘single
positivity’ remain poorly understood. Saito et al (33) reported a case-control study of 100
patients with HCC treated by TACE, showing that high-DCP levels
before TACE were associated with poor liver function. A study of
1,560 patients with HCC treated with TACE conducted by Kinugasa
et al (34) revealed that
high-DCP levels were associated with local recurrence, with local
recurrence rates of 18.6, 33.4 and 61.8% at 3 months, 6 months and
1 year, respectively, and intrahepatic distant recurrence rates. In
the present study, the mortality rate in the high-DCP group (37.0%)
was significantly higher than that in the low-DCP group (20.8%),
indicating that the prognosis of patients with AFP-negative HCC can
be assessed by preoperative serum DCP levels.
The present study revealed no significant
association between serum DCP levels and sex, age group, hepatitis,
Child-Pugh classification, AST, TBil, HDL, RBP, PLT, PDW, RDW,
tumor number, lymph node metastasis or distant metastasis but a
positive association with ECOG score, ALT and tumor size. The
results demonstrated that the serum DCP level was an important
indicator affecting the prognosis of patients with AFP-negative HCC
treated by TACE, and the serum DCP level was negatively associated
with prognosis, which was consistent with the results of Payancé
et al (35). A related
study found that the serum DCP level was not significantly
associated with AFP, and the accuracy of the DCP level as a
prognostic assessment was greater than that of AFP (36).
Microarray technology and bioinformatics analysis
enable researchers to identify genetic differences between tumors
and normal tissues and help discover novel biomarkers (37,38).
The present study analyzed the GSE57555 gene expression profile
dataset and revealed that 169 DEGs were present in
‘single-positive’ patients, with significant differences compared
with normal tissues, including 83 upregulated genes and 86
downregulated genes. In addition, both GO and KEGG analyses
demonstrated that genes were enriched in the ribosomal pathway,
suggesting that ribosome-related genes may serve a role in
‘single-positive’ HCC. A ‘single-positive’ HCC-related PPI network
was also constructed and 10 hub genes were identified by centrality
analysis. Notably, nine genes were from the ribosomal protein
family. These results imply that ribosomal protein family genes may
participate in ‘single-positive’ HCC.
The ribosomal protein family is the cornerstone of
ribosome biogenesis and involved in the assembly of the ribosome
(39). RPS23, RPS11, RPS3A, RPS2,
RPS15, RPS5 and RPS13 are components of the 40S subunit, and RPL6
and RPL18 are components of the 60S subunit (39). In the present study, the top three
significant genes were RPS23, RPS11 and RPS3A. Upregulation of
RPS23 promotes the biogenesis of 18S ribosomal RNA, which is
detrimental to the oncogenic effect of the tumor suppressor p53
(40). A high RPS11 level in HCC
is associated with poor prognosis after curative resection,
suggesting a potential tumor-promoting role for RPS11 (41). In addition, high RPS3A expression
is associated with low tumor immune cell infiltration and
unfavorable prognosis in patients with HCC (42). In our study, ‘single-positive’ HCC
exhibited abnormally high expression of the ribosomal protein
family. Therefore, the study of ribosomal proteins may provide an
important novel direction for the diagnosis, prognosis and
treatment of ‘single-positive’ HCC.
The present study has several limitations. First, as
with most retrospective studies, the study was not randomized in
design, which may have led to some bias. Second, as the median
follow-up period was 755 days, survival data were limited. Although
the value of DCP was confirmed in predicting prognosis, further
follow-up is necessary. Third, the number of patients (n=107) was
relatively small, and studies involving more patients are required
to further support the findings. Finally, the potential link
between DCP and genes needs to be further explored in in
vivo and in vitro studies.
In conclusion, the present study demonstrated that
higher serum DCP levels in patients with AFP-negative HCC were
associated with poor prognosis after TACE and revealed that the
occurrence of ‘single-positive’ HCC might be associated with genes
such as the ribosomal protein family. Exploration in this area will
facilitate the discovery of personalized regimens for TACE
treatment in patients with serum AFP-negative HCC. These genes from
the RPS family may be potential diagnostic and prognostic
biomarkers that could contribute to targeted treatment of the
disease.
Supplementary Material
Supporting Data
Acknowledgements
The authors would like to thank Dr Zhouyue Wu (Key
Laboratory of Cardiovascular & Cerebrovascular Medicine, School
of Pharmacy, Nanjing Medical University, Nanjing, Jiangsu, China)
for assisting in all stages of the study.
Funding
The present study was supported by the National Natural Science
Foundation of China (grant no. 81901855), the Natural Science
Foundation of Jiangsu Province (grant no. BK20181087) and the
Jiangsu Planned Projects for Postdoctoral Research Funds (grant no.
2020Z069).
Availability of data and materials
The microarray datasets generated and/or analyzed
during the current study are available in the GEO repository,
https://www.ncbi.nlm.nih.gov/geo/query/acc.cgi?acc=GSE57555.
All other data generated or analyzed during this study are included
in this published article.
Authors' contributions
HS and WY were involved in conceptualization,
project administration, formal analysis, use of software, writing
and editing. WZ and CZ conceived and designed the study, and
prepared figures and tables. SL collected and analyzed data. HS and
WT were involved in conceptualization, supervision, writing, review
and editing. HS and WT confirm the authenticity of all the raw
data. All authors read and approved the final manuscript.
Ethics approval and consent to
participate
This retrospective study was discussed and approved
by the ethics committee review board of Jiangsu Provincial Hospital
(Nanjing, China), which waived the requirement for informed consent
(approval no. 2022-SR-249).
Patient consent for publication
Not applicable.
Competing interests
The authors declare that they have no competing
interests.
References
|
1
|
Villanueva A: Hepatocellular carcinoma. N
Engl J Med. 380:1450–1462. 2019. View Article : Google Scholar : PubMed/NCBI
|
|
2
|
Llovet JM, Kelley RK, Villanueva A, Singal
AG, Pikarsky E, Roayaie S, Lencioni R, Koike K, Zucman-Rossi J and
Finn RS: Hepatocellular carcinoma. Nat Rev Dis Primers. 7:62021.
View Article : Google Scholar : PubMed/NCBI
|
|
3
|
Lencioni R, de Baere T, Soulen MC, Rilling
WS and Geschwind JFH: Lipiodol transarterial chemoembolization for
hepatocellular carcinoma: A systematic review of efficacy and
safety data. Hepatology. 64:106–116. 2016. View Article : Google Scholar : PubMed/NCBI
|
|
4
|
Llovet JM and Bruix J: Systematic review
of randomized trials for unresectable hepatocellular carcinoma:
Chemoembolization improves survival. Hepatology. 37:429–442. 2003.
View Article : Google Scholar : PubMed/NCBI
|
|
5
|
Murata S, Mine T, Sugihara F, Yasui D,
Yamaguchi H, Ueda T, Onozawa S and Kumita S: Interventional
treatment for unresectable hepatocellular carcinoma. World J
Gastroenterol. 20:13453–13465. 2014. View Article : Google Scholar : PubMed/NCBI
|
|
6
|
Murakami T and Tsurusaki M: Hypervascular
benign and malignant liver tumors that require differentiation from
hepatocellular carcinoma: Key points of imaging diagnosis. Liver
Cancer. 3:85–96. 2014. View Article : Google Scholar : PubMed/NCBI
|
|
7
|
Tsurusaki M and Murakami T: Surgical and
locoregional therapy of HCC: TACE. Liver Cancer. 4:165–175. 2015.
View Article : Google Scholar : PubMed/NCBI
|
|
8
|
Chen X, Tang FR, Arfuso F, Cai WQ, Ma Z,
Yang J and Sethi G: The emerging role of long non-coding RNAs in
the metastasis of hepatocellular carcinoma. Biomolecules.
10:662019. View Article : Google Scholar : PubMed/NCBI
|
|
9
|
Ji J, Gu J, Wu JZ, Yang W, Shi HB, Liu S
and Zhou WZ: The ‘six-and-twelve’ score for recurrent HCC patients
receiving TACE: Does it still work? Cardiovasc Intervent Radiol.
44:720–727. 2021. View Article : Google Scholar : PubMed/NCBI
|
|
10
|
Bruix J, Sala M and Llovet JM:
Chemoembolization for hepatocellular carcinoma. Gastroenterology.
127 (5 Suppl 1):S179–S188. 2004. View Article : Google Scholar : PubMed/NCBI
|
|
11
|
Llovet JM, Real MI, Montaña X, Planas R,
Coll S, Aponte J, Ayuso C, Sala M, Muchart J, Solà R, et al:
Arterial embolisation or chemoembolisation versus symptomatic
treatment in patients with unresectable hepatocellular carcinoma: A
randomised controlled trial. Lancet. 359:1734–1739. 2002.
View Article : Google Scholar : PubMed/NCBI
|
|
12
|
Tsuchiya N, Sawada Y, Endo I, Saito K,
Uemura Y and Nakatsura T: Biomarkers for the early diagnosis of
hepatocellular carcinoma. World J Gastroenterol. 21:10573–10583.
2015. View Article : Google Scholar : PubMed/NCBI
|
|
13
|
Luo P, Wu S, Yu Y, Ming X, Li S, Zuo X and
Tu J: Current status and perspective biomarkers in AFP negative
HCC: Towards screening for and diagnosing hepatocellular carcinoma
at an earlier stage. Pathol Oncol Res. 26:599–603. 2020. View Article : Google Scholar : PubMed/NCBI
|
|
14
|
Wang T and Zhang KH: New blood biomarkers
for the diagnosis of AFP-negative hepatocellular carcinoma. Front
Oncol. 10:13162020. View Article : Google Scholar : PubMed/NCBI
|
|
15
|
Liebman HA, Furie BC, Tong MJ, Blanchard
RA, Lo KJ, Lee SD, Coleman MS and Furie B: Des-gamma-carboxy
(abnormal) prothrombin as a serum marker of primary hepatocellular
carcinoma. N Engl J Med. 310:1427–1431. 1984. View Article : Google Scholar : PubMed/NCBI
|
|
16
|
Inagaki Y, Tang W, Makuuchi M, Hasegawa K,
Sugawara Y and Kokudo N: Clinical and molecular insights into the
hepatocellular carcinoma tumour marker des-γ-carboxyprothrombin.
Liver Int. 31:22–35. 2011. View Article : Google Scholar : PubMed/NCBI
|
|
17
|
Verslype C, Rosmorduc O and Rougier P;
ESMO Guidelines Working Group, : Hepatocellular carcinoma:
ESMO-ESDO clinical practice guidelines for diagnosis, treatment and
follow-up. Ann Oncol. 23 (Suppl 7):vii41–vii48. 2012. View Article : Google Scholar : PubMed/NCBI
|
|
18
|
Oken MM, Creech RH, Tormey DC, Horton J,
Davis TE, McFadden ET and Carbone PP: Toxicity and response
criteria of the eastern cooperative oncology group. Am J Clin
Oncol. 5:649–655. 1982. View Article : Google Scholar : PubMed/NCBI
|
|
19
|
Seldinger SI: Catheter replacement of the
needle in percutaneous arteriography; a new technique. Acta Radiol.
39:368–376. 1953. View Article : Google Scholar : PubMed/NCBI
|
|
20
|
Zhou J, Sun H, Wang Z, Cong W, Wang J,
Zeng M, Zhou W, Bie P, Liu L, Wen T, et al: Guidelines for the
diagnosis and treatment of hepatocellular carcinoma (2019 edition).
Liver Cancer. 9:682–720. 2020. View Article : Google Scholar : PubMed/NCBI
|
|
21
|
Laird BJ, Kaasa S, McMillan DC, Fallon MT,
Hjermstad MJ, Fayers P and Klepstad P: Prognostic factors in
patients with advanced cancer: A comparison of clinicopathological
factors and the development of an inflammation-based prognostic
system. Clin Cancer Res. 19:5456–5464. 2013. View Article : Google Scholar : PubMed/NCBI
|
|
22
|
Barrett T, Wilhite SE, Ledoux P,
Evangelista C, Kim IF, Tomashevsky M, Marshall KA, Phillippy KH,
Sherman PM, Holko M, et al: NCBI GEO: Archive for functional
genomics data sets-update. Nucleic Acids Res. 41:(Database Issue).
D991–D995. 2013. View Article : Google Scholar : PubMed/NCBI
|
|
23
|
Murakami Y, Kubo S, Tamori A, Itami S,
Kawamura E, Iwaisako K, Ikeda K, Kawada N, Ochiya T and Taguchi YH:
Comprehensive analysis of transcriptome and metabolome analysis in
intrahepatic cholangiocarcinoma and hepatocellular carcinoma. Sci
Rep. 5:162942015. View Article : Google Scholar : PubMed/NCBI
|
|
24
|
Diboun I, Wernisch L, Orengo CA and
Koltzenburg M: Microarray analysis after RNA amplification can
detect pronounced differences in gene expression using limma. BMC
Genomics. 7:2522006. View Article : Google Scholar : PubMed/NCBI
|
|
25
|
Ashburner M, Ball CA, Blake JA, Botstein
D, Butler H, Cherry JM, Davis AP, Dolinski K, Dwight SS, Eppig JT,
et al: Gene ontology: Tool for the unification of biology. The gene
ontology consortium. Nat Genet. 25:25–29. 2000. View Article : Google Scholar : PubMed/NCBI
|
|
26
|
Szklarczyk D, Morris JH, Cook H, Kuhn M,
Wyder S, Simonovic M, Santos A, Doncheva NT, Roth A, Bork P, et al:
The STRING database in 2017: Quality-controlled protein-protein
association networks, made broadly accessible. Nucleic Acids Res.
45(D1): D362–D368. 2017. View Article : Google Scholar : PubMed/NCBI
|
|
27
|
Chin CH, Chen SH, Wu HH, Ho CW, Ko MT and
Lin CY: cytoHubba: Identifying hub objects and sub-networks from
complex interactome. BMC Syst Biol. 8 (Suppl 4):S112014. View Article : Google Scholar : PubMed/NCBI
|
|
28
|
Bader GD and Hogue CWV: An automated
method for finding molecular complexes in large protein interaction
networks. BMC Bioinformatics. 4:22003. View Article : Google Scholar : PubMed/NCBI
|
|
29
|
Lee YK, Kim SU, Kim DY, Ahn SH, Lee KH,
Lee DY, Han KH, Chon CY and Park JY: Prognostic value of
α-fetoprotein and des-γ-carboxy prothrombin responses in patients
with hepatocellular carcinoma treated with transarterial
chemoembolization. BMC Cancer. 13:52013. View Article : Google Scholar : PubMed/NCBI
|
|
30
|
Hiraoka A, Ishimaru Y, Kawasaki H, Aibiki
T, Okudaira T, Toshimori A, Kawamura T, Yamago H, Nakahara H, Suga
Y, et al: Tumor markers AFP, AFP-L3, and DCP in hepatocellular
carcinoma refractory to transcatheter arterial chemoembolization.
Oncology. 89:167–174. 2015. View Article : Google Scholar : PubMed/NCBI
|
|
31
|
Kokudo N, Hasegawa K, Akahane M, Igaki H,
Izumi N, Ichida T, Uemoto S, Kaneko S, Kawasaki S, Ku Y, et al:
Evidence-based clinical practice guidelines for hepatocellular
carcinoma: The Japan society of hepatology 2013 update (3rd JSH-HCC
guidelines). Hepatol Res. 45:2015. View Article : Google Scholar
|
|
32
|
Omata M, Lesmana LA, Tateishi R, Chen PJ,
Lin SM, Yoshida H, Kudo M, Lee JM, Choi BI, Poon RT, et al: Asian
pacific association for the study of the liver consensus
recommendations on hepatocellular carcinoma. Hepatol Int.
4:439–474. 2010. View Article : Google Scholar : PubMed/NCBI
|
|
33
|
Saito M, Seo Y, Yano Y, Miki A, Yoshida M
and Azuma T: A high value of serum des-γ-carboxy prothrombin before
hepatocellular carcinoma treatment can be associated with long-term
liver dysfunction after treatment. J Gastroenterol. 47:1134–1142.
2012. View Article : Google Scholar : PubMed/NCBI
|
|
34
|
Kinugasa H, Nouso K, Takeuchi Y, Yasunaka
T, Onishi H, Nakamura S, Shiraha H, Kuwaki K, Hagihara H, Ikeda F,
et al: Risk factors for recurrence after transarterial
chemoembolization for early-stage hepatocellular carcinoma. J
Gastroenterol. 47:421–426. 2012. View Article : Google Scholar : PubMed/NCBI
|
|
35
|
Payancé A, Dioguardi Burgio M, Peoc'h K,
Achahboun M, Albuquerque M, Devictor J, Chor H, Manceau H, Soubrane
O, Durand F, et al: Biological response under treatment and
prognostic value of protein induced by vitamin K absence or
antagonist-II in a French cohort of patients with hepatocellular
carcinoma. Eur J Gastroenterol Hepatol. 32:1364–1372. 2020.
View Article : Google Scholar : PubMed/NCBI
|
|
36
|
Yamamoto K, Imamura H, Matsuyama Y,
Hasegawa K, Beck Y, Sugawara Y, Makuuchi M and Kokudo N:
Significance of alpha-fetoprotein and des-gamma-carboxy prothrombin
in patients with hepatocellular carcinoma undergoing hepatectomy.
Ann Surg Oncol. 16:2795–2804. 2009. View Article : Google Scholar : PubMed/NCBI
|
|
37
|
Vogelstein B, Papadopoulos N, Velculescu
VE, Zhou S, Diaz LA Jr and Kinzler KW: Cancer genome landscapes.
Science. 339:1546–1558. 2013. View Article : Google Scholar : PubMed/NCBI
|
|
38
|
Guo Y, Bao Y, Ma M and Yang W:
Identification of key candidate genes and pathways in colorectal
cancer by integrated bioinformatical analysis. Int J Mol Sci.
18:7222017. View Article : Google Scholar : PubMed/NCBI
|
|
39
|
Warner JR and McIntosh KB: How common are
extraribosomal functions of ribosomal proteins? Mol Cell. 34:3–11.
2009. View Article : Google Scholar : PubMed/NCBI
|
|
40
|
Wang Y, Huang JW, Castella M, Huntsman DG
and Taniguchi T: p53 is positively regulated by miR-542-3p. Cancer
Res. 74:3218–3227. 2014. View Article : Google Scholar : PubMed/NCBI
|
|
41
|
Zhou C, Sun J, Zheng Z, Weng J, Atyah M,
Zhou Q, Chen W, Zhang Y, Huang J, Yin Y, et al: High RPS11 level in
hepatocellular carcinoma associates with poor prognosis after
curative resection. Ann Transl Med. 8:4662020. View Article : Google Scholar : PubMed/NCBI
|
|
42
|
Zhou C, Weng J, Liu C, Zhou Q, Chen W, Hsu
JL, Sun J, Atyah M, Xu Y, Shi Y, et al: High RPS3A expression
correlates with low tumor immune cell infiltration and unfavorable
prognosis in hepatocellular carcinoma patients. Am J Cancer Res.
10:2768–2784. 2020.PubMed/NCBI
|