Introduction
Breast cancer constitutes 28% of the cancer
incidents worldwide and is thereby the most frequently occurring
cancer and the most frequent cause of mortality in women.
Lethality, which has fortunately been regressive since the 1970s,
remains at 30% over the stages of breast cancer on average.
The main reason for breast cancer-associated
mortality is the formation of remote metastases by the primary
tumour. Current models assume that cells, dissolving from the
primary tumour, migrate to other organs and bone marrow, where they
settle down, forming the core for remote metastases (1). The occurrence of these so-called
‘circulating tumour cells’ (CTCs) in peripheral blood and
disseminated tumour cells (DTCs) in bone marrow of patients with
epithelial tumours has already been found in numerous studies
(1–3). A number of these studies demonstrated
that the occurrence of CTCs in blood is linked to a worse prognosis
for overall survival in comparison to patients without CTCs
(4,5). Several trials have been made to detect
CTCs in the peripheral blood of patients. Various methods of
analysis are used in laboratories working on this topic, rendering
a comparison difficult.
Changes in gene expression levels are important
features of tumour cells (6),
whereas most genes, regulating the cell cycle control and thereby
cell proliferation, are altered, often leading to an increase in
cell proliferation. For example, microarray analyses have been
carried out to identify genes with changes in expression levels in
healthy and breast cancer tissues (7,8).
Differences in the expression rates of certain genes are known to
have the potential to facilitate a statement on the prognosis of a
cancer disease and the opportunity to improve medical treatment
(9,10). Such changes in gene expression may
also be used for diagnostic purposes. Measurement of gene
expression can be performed using polymerase chain reaction
(PCR)-based methods, especially real-time PCR. By this method an
increase of DNA molecules during PCR reaction is measured by
fluorescent reporter molecules such as SYBR-Green. This substance
is incorporated in DNA molecules during the reaction (11). If the RNA-depending cDNA-amount of a
gene at the beginning of a reaction is high, then the increase in
DNA molecules during the reaction is likely to be higher, meaning
that a high fluorescence level for the analysed gene at the end of
the PCR is evident and can be detected. The DNA-amount at the
beginning of a reaction depends on the complementary DNA (cDNA),
which is received from isolated mRNA as a result of reverse
transcription reaction. The mRNA in turn is isolated from a tissue
or cell pellet that is to be analysed.
TaqMan real-time PCR, invented by the Cetus
Corporation (Berkeley, CA, USA) in 1991, is one of the most
sensitive PCR methods currently available. An additional
gene-specific PCR-reagent is coupled to a reporter and a quencher
molecule. The quencher represses the fluorescence of the reporter
provided they are in close proximity (12). During PCR-reaction, the reporter and
quencher are separated by the 5′-3′ exonuclease activity of the
polymerase, while a marked increase was detected in the
fluorescence signal.
The first step towards a real-time PCR-based
quantitative cancer diagnosis is to create calibration curves for
the used genes to evaluate the number of cancer cells exhibited at
a certain level of gene expression in blood or bone marrow
samples.
Therefore, in the present study, blood samples of
healthy donors were spiked with determined numbers of breast cancer
cell line cells, and treated in the same manner as patient samples
(see Materials and methods). Real-time PCR was employed with the
Cytokeratin genes (CK) 8, 18 and 19. These genes are also used in
the immunohistochemical detection of cancer cells [alkaline
phosphatase-anti alkaline phosphatase (APAAP-staining; 13,14)] from
bone marrow, and are established markers for epithelial cells in
contrast to blood cells.
Materials and methods
Cell culture
The epithelial breast cancer cell lines used for the
experiments were Cama-1, MCF-7, MDA-MB231, derived from mammary
gland adenocarcinoma and ZR-75-1, derived from ductal carcinoma.
Cells were cultured routinely, according to international
standards. After being detached, the cells were counted in a
haemocytometer and diluted to adequate concentrations with
phosphate-buffered saline (PBS; Biochrome Ltd., Cambridge, UK).
Cells were then added to the blood samples taken from healthy
donors. Two different experiments were carried out: in the first
part, blood samples were spiked with 0, 10, 100 and 1000 cells from
the above-mentioned breast cancer cell lines, while in the second
part 0, 10, 100, 1000, 10000 and 100000 MCF-7 cells were added per
ml of a blood sample.
Treatment of blood samples
A blood sample (7.5 ml) was collected from a healthy
donor in EDTA-tubes to prevent coagulation. The respective number
of cell line cells was added to the blood, and the samples were
diluted with PBS up to 20 ml. For density gradient centrifugation,
the samples were carefully layered onto 20 ml of
Histopaque® 1077 (Invitrogen, Carlsbad, CA, USA) and
centrifuged for 30 min at 400 g. Following centrifugation the buffy
coat was aspirated in each case and transferred into new tubes. Two
washing steps were carried out using PBS (10 min, 250 g, 4°C). The
resulting cell pellets were then air dried and frozen at −80°C.
RNA isolation
To extract RNA, the cell pellets were defrosted and
resuspended in 1 ml TRIzol® LS Reagent (Invitrogen Life
Technologies) and 0.2 ml chloroform was added. The solution was
vortexed vigorously. Following a centrifugation step at 12000 x g
for 15 min at 4°C the resulting supernatant was aspirated and
transferred into a fresh tube, prepared with 500 μl cooled
isopropanol and 2.5 μl glycogen (Invitrogen Life Technologies). The
samples were slightly vortexed and stored frozen at −20°C
overnight. The following day the samples were centrifuged at 12000
x g for 10 min at 4°C. The supernatant was removed and pellets were
washed with 1 ml 75% ethanol and centrifuged at 12000 x g for 10
min at 4°C. The supernatant was removed again and pellets were
air-dried and resuspended in 20 μl diethylpyrocarbonate
(DEPC)-treated water. RNA concentrations and ratios were measured
photometrically by a NanoPhotometer® (Implen GmbH,
Munich, Germany). Special attention was paid to high-quality
templates as only high-quality RNAs were used with absorbance
ratios of 260/280 nm between 1.7 and 1.9.
Reverse transcription
The reverse transcription from RNA to cDNA was
carried out using the SuperScript® III First Strand
Synthesis Supermix kit (Invitrogen Life Technologies). Therefore, 4
μg of RNA, in a maximum volume of 6 μl, 1 μl Oligo(dT)-primers and
1 μl annealing buffer were added to the samples. The preparations
were incubated at 65°C for 5 min, and immediately chilled on ice
for at least 5 min. First strand reaction mix (10μl) and
SuperScript® III/RNase Out™ enzyme mix (2 μl)
(Invitrogen Life Technologies) were immediately added. The samples
were incubated at 50°C for 50 min. To inactivate the enzyme reverse
transcriptase after completing the reaction, the samples were
denatured at 85°C for 5 min and stored at −20°C until use.
Real-time PCR
For each real-time PCR reaction, 2 μl cDNA were used
together with 1 μl of gene-specific TaqMan primers (CK8, 18 and
19), 10 μl TaqMan Fast Universal PCR Mastermix (Applied Biosystems,
Foster City, CA, USA) and 7 μl PCR-water. The 96-well plates were
run on a 7500 Fast Real Time PCR System (Applied Biosystems). A
denaturation step of cDNA at 95°C for 20 sec was initially
administered, followed by 40 cycles at 95°C for 3 sec and 60°C for
30 sec. Subsequent to each PCR cycle the fluorescence intensity was
measured by the system and recorded by the corresponding software
[Sequence Detection System® (SDS) Version 1.3.1; Applied
Biosystems]. 18S was used in the experiments as an internal
reference control for the PCR reaction (15). The primers (Applied Biosystems) used
for the experiments were CK8, Hs_02339472_g1; CK18, Hs_01920599_gH;
CK19, Hs_00761767_s1 and 18S, Hs_03928990_g1. For each gene and
cell amount added to a blood sample, eight reactions were run in
the PCR and the means were used for evaluation.
Evaluation of results
Ct-, ΔCt- and ΔΔCt-values were calculated by the
SDS-software (Applied Biosystems), and the threshold was set
automatically, 18S was used as a calibrator sample. The generated
files were exported to Microsoft™ Excel® and the
additional graphs were added in.
Results
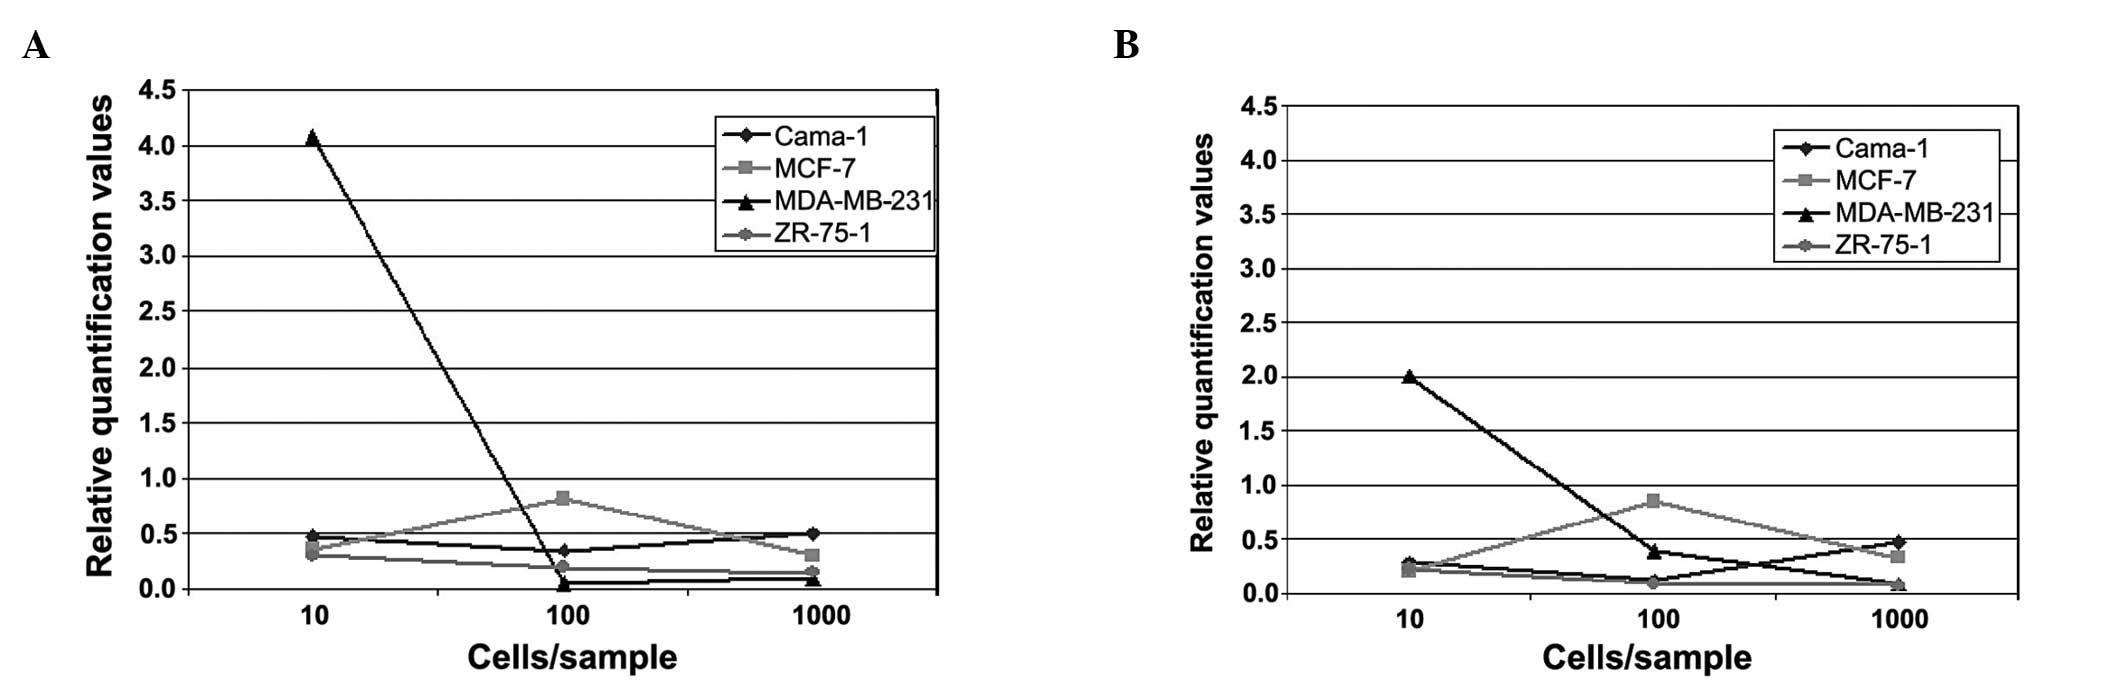
The curves of relative quantification of
gene expression did not show consistent tendencies
In the first part of the experiment, in which blood
samples were spiked with 0, 10, 100 and 1000 cells of various
breast cancer cell lines (Cama-1, MDA-MB231, MCF-7 and ZR-75-1),
the relative quantification curves for each cell line were similar
for CK18 and 19. With the exception of Cama-1, a decrease was
detected for the cell lines between the values of 10 and 1000 cells
added (Fig. 1A and B).
The strongest decrease was observed for MDA-MB-231.
In this cell line, the curve of relative quantification of gene
expression was already on the decrease between 10 and 100 cells
added and was, notably, not increasing for 1000 cells added to the
blood sample. A slight decrease was detected between 10 and 100
cells per blood sample for the ZR-75-1 sample that was maintained
until 1000 cells. The MCF-7-cells showed an increase in the
relative quantification values between 10 and 100 cells, although
the curves again showed a decrease towards the 1000 cell sample. In
the Cama-1 sample, a slight decrease was detected, from 10 to 100
cells. However, an increase was observed from 100 to 1000 cells of
the added cell line.
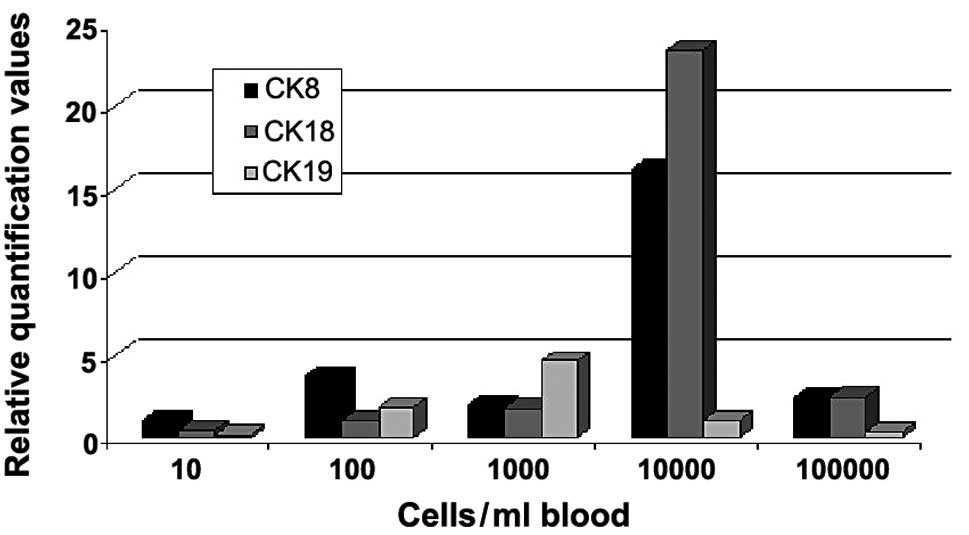
In the second part of the experiment MCF-7 cells
were spiked per ml blood sample in steps of 0, 10, 100, 1000, 10000
and 100000 cells (Fig. 2). The
relative quantification values of gene expression for CK8, 18 and
19 were measured. The values for CK8 showed an increase until the
100 MCF-7 cell sample. A decrease of the value in the 1000-cell
sample was observed, whereas for the 10000-cell sample a strong
increase of relative quantification was measured. For the 100000
cells/ml blood sample, the curve for CK8 was almost on the decrease
again to the value of the 1000-cell sample. For CK18 a slight but
steady increase was observed, until the cell number of 1000 cells
was added. A strong increase occurred again between 1000 and 10000
cells. The value for 100000 cells being added to the sample was on
the decrease as observed for CK8. The relative quantification curve
for CK19 appeared markedly different compared to the curves for CK8
and 18. Thus, there was only a slight increase in gene expression
values until 1000 cells/ml were added and then a reduction was
detected to levels lower than those found for CK8 and CK18.
Discussion
The best cell line for generating calibration curves
for real-time PCR experiments with CK was Cama-1 of the first part
of the experiment. Only for this cell line the expected increase in
relative quantification of gene expression was seen for the numbers
of added cells. ZR-75-1 relative quantification levels were rather
low, showing no considerable changes at increasing numbers of
cancer cells added. By contrast, MDA-MB-231 showed a marked
decrease in the curves between 10 and 100 tumour cells added for
CK18, as well as for CK19. This may be due to immunological
effects, leading to an apparent agglutination of cancer cell line
cells with common blood cells. Similar effects are likely to be the
reason for the graph progression of the MCF-7-spiked blood samples.
Of note, in the MCF-7 samples an initial increase occurred,
however, values of relative quantification showed a decrease for
higher numbers of cancer cells added to the blood sample. This
finding might also indicate that certain immunological effects
between common blood cells and added artificial tumour cells are
dependent on cell concentration. Thus, the higher the added cell
concentration, the more agglutinative effects occur, altering the
results of the PCR.
The second experiment showed rather different
tendencies in comparison to the first one (Fig. 2). In this trial, only MCF-7 cells
were used for spiking and for the generation of the graphs, for CK8
as well as for CK18 and 19, and showed an increase in relative
quantification levels until 100 cells added per ml blood sample and
a decrease from the highest cell number used (100000 cell line
cells added). For CK8, the sample with 1000 cells per ml added
showed an unexpectedly lower value. However, for 10000 cells, the
relative quantification value was again elevated. CK18 showed a
steady increase of relative quantification values when more cancer
cells are added to the sample (until 10000 cells) with the
strongest increase being measured between 1000 and 10000 cells. For
CK19, an increase in relative quantification values was detected
until 1000 cells, followed by a steady decrease. These results seem
to confirm the suggestion that immunological reactions occur
between MCF-7 and common blood cells, rendering MCF-7 cells alone
inappropriate for the generation of calibration curves. However,
using different artificial breast cancer cell lines may be the key
for generating calibration curves, as CTCs are regarded to be of
different origins and therefore show histological distinctions.
Another aspect that may be relevant is that better results are
potentially obtained when tumour cells are added following
enrichment of cells by density gradient centrifugation, shortly
before the RNA extraction process is started. Fewer cells are
likely to be lost during the centrifugation and washing steps and
more precise calibration curves could be generated. Adding the
cancer cell line cells per ml of a blood sample used is also
important, otherwise real-time PCR detection limits may be undercut
(16).
References
|
1
|
Pantel K and Brakenhoff RH: Dissecting the
metastatic cascade. Nat Rev Cancer. 4:448–456. 2004. View Article : Google Scholar : PubMed/NCBI
|
|
2
|
Ring A, Smith IE and Dowsett M:
Circulating tumour cells in breast cancer. Lancet Oncol. 5:79–88.
2004. View Article : Google Scholar
|
|
3
|
Smerage JB and Hayes DF: The measurement
and therapeutic implications of circulating tumour cells in breast
cancer. Br J Cancer. 94:8–12. 2006. View Article : Google Scholar : PubMed/NCBI
|
|
4
|
Braun S, Pantel K, Muller P, et al:
Cytokeratin-positive cells in the bone marrow and survival of
patients with stage I, II, or III breast cancer. N Engl J Med.
342:525–533. 2000. View Article : Google Scholar : PubMed/NCBI
|
|
5
|
Braun S, Vogl FD, Naume B, et al: A pooled
analysis of bone marrow micrometastasis in breast cancer. N Engl J
Med. 353:793–802. 2005. View Article : Google Scholar : PubMed/NCBI
|
|
6
|
Zhang L, Zhou W, Velculescu VE, et al:
Gene expression profiles in normal and cancer cells. Science.
276:1268–1272. 1997. View Article : Google Scholar : PubMed/NCBI
|
|
7
|
Frasor J, Danes JM, Komm B, et al:
Profiling of estrogen up- and down-regulated gene expression in
human breast cancer cells: insights into gene networks and pathways
underlying estrogenic control of proliferation and cell phenotype.
Endocrinology. 144:4562–4574. 2004. View Article : Google Scholar : PubMed/NCBI
|
|
8
|
Hedenfalk I, Duggan D, Chen Y, et al: Gene
expression profiles in hereditary breast cancer. N Engl J Med.
344:539–548. 2001. View Article : Google Scholar : PubMed/NCBI
|
|
9
|
Urban P, Vuaroqueaux V, Labuhn M, et al:
Increased expression of urokinase-type plasminogen activator mRNA
determines adverse prognosis in ErbB2-positive primary breast
cancer. J Clin Oncol. 24:4245–4253. 2006. View Article : Google Scholar : PubMed/NCBI
|
|
10
|
Taylor KJ, Sims AH, Liang L, et al:
Dynamic changes in gene expression in vivo predict prognosis of
tamoxifen-treated patients with breast cancer. Breast Cancer Res.
12:R392010. View
Article : Google Scholar : PubMed/NCBI
|
|
11
|
Devlin TM: Regulation of gene expression.
Textbook of Biochemistry with Clinical Correlations. John Wiley
& Sons; 7th edition. pp. 2572010
|
|
12
|
Holland PM, Abramson RD, Watson R and
Gelfand DH: Detection of specific polymerase chain reaction product
by utilizing the 5′-3′ exonuclease activity of Thermus aquaticus
DNA polymerase. Proc Natl Acad Sci USA. 88:7276–7280. 1991.
|
|
13
|
Kurec AS, Baltrucki L, Mason DY and Davey
FR: Use of the APAAP method in the classification and diagnosis of
hematologic disorders. Clin Lab Med. 8:223–236. 1988.PubMed/NCBI
|
|
14
|
Noack F, Schmitt M, Bauer J, et al: A new
approach to phenotyping disseminated tumor cells: methodological
advances and clinical implications. Int J Biol Markers. 15:100–104.
2000.PubMed/NCBI
|
|
15
|
Huggett J, Dheda K, Bustin S and Zumla A:
Real-time RT-PCR normalisation; strategies and considerations.
Genes Immun. 6:279–284. 2005. View Article : Google Scholar : PubMed/NCBI
|
|
16
|
Datta YH, Adams PT, Drobyski WR, et al:
Sensitive detection of occult breast cancer by the
reverse-transcriptase polymerase chain reaction. J Clin Oncol.
12:475–482. 1994.
|