Introduction
Liver regeneration is a hyperplastic phenomenon of
residual livers in response to partial hepatectomy (PH) or liver
damage. Liver regeneration has been an advantage in liver cancer
surgery and transplantation from a medical viewpoint (1). Therefore, it is important to elucidate
the mechanisms underlying liver regeneration for the development of
regenerative medicine.
Rodent PH models have been a useful tool in the
investigation of signals that regulate this regenerative response
(2,3). Growth factors, such as hepatocyte
growth factor (HGF), epidermal growth factor (EGF) or insulin
growth factor (IGF) and cytokines, such as IL-6 or TNF-α, have been
shown to play important roles in the early phase of liver
regeneration by using rodent PH models (4–6). HGF
is synthesized by non-parenchymal (particularly stellate) cells in
the liver and binds to the c-Met receptor of hepatocytes. HGF
activates a variety of downstream pathways, including the
mitogen-activated protein kinase (MAPK) signaling pathway which is
involved in cell growth and enhances DNA synthesis of hepatocytes
during liver regeneration (4–6).
TNF-α, as an initiation factor of liver regeneration, stimulates
Kupffer cells in the liver. Subsequently, IL-6 is produced in
Kupffer cells by the activation of NF-κB and stimulates janus
kinase (JAK)/signal transduction and activator of transcription
(STAT) by binding to its receptor (IL-6R) in hepatocytes, resulting
in hepatocyte proliferation (4–6).
However, studies on TNF-α and IL-6 knockout mice have demonstrated
that these factors are not key to liver regeneration (7,8). Thus,
multiple pathways are currently considered to be involved in the
initiation of liver regeneration.
Recently, microarray analyses were performed to
identify novel genes involved in liver regeneration. Togo et
al reported 23 genes, including Karyopherin α1 and
interleukin-1 receptor associated kinase-1 (IRAK-1),
as novel genes involved in the early phase of liver regeneration by
microarray analysis (9).
Furthermore, we previously demonstrated that Rab30 and
S100a8/S100a9 genes were upregulated >20-fold at 2 and 6
h post 70% PH in mice (10).
Antisense transcripts, which were transcribed from
the DNA strand opposite the sense strand, have been identified by
cDNA sequencing projects in human and mouse (11,12).
Using cDNA sequence database, Kiyosawa et al predicted that
sense and antisense transcripts were produced from 15% of mouse
gene loci (13) and demonstrated
via microarray analysis that 1,947 sense and antisense transcripts
were expressed in mice (14).
Tsix, the antisense transcript of X-inactive specific
transcript (Xist) gene, was demonstrated to be involved
in the regulation of the Xist gene which mediates X
chromosome inactivation (15).
Furthermore, β-site APP cleaving enzyme 1 (BACE1) antisense
transcript was shown to be involved in the stability of
BACE1 sense transcript via RNA duplex formation with
BACE1 sense transcripts (16). In a previous study, we identified
antisense transcripts as up- and downregulated in human colorectal
cancer tissues as compared to normal colonic tissues (17). These studies suggested that
antisense transcripts were expressed in various tissues and may be
involved in the regulation of several biological activities.
In the present study, in order to identify the sense
and antisense transcripts possibly involved in liver regeneration,
the up- or downregulated sense and antisense transcripts were
investigated using 70% PH mice and custom-microarray containing
mouse sense/antisense probe for ∼21,000 genes.
Materials and methods
Animals
Eight-week-old specific pathogen-free (SPF) male
BALB/c mice were purchased from Clea Japan Inc. (Tokyo, Japan).
Mice were maintained in a temperature-controlled room on a 12-h
light-dark cycle, with free access to water and standard chow.
Seventy percent PH was performed on anesthetized mice, according to
the procedure described by Higgins and Anderson (2). Mice were sacrificed at five time
points: 0, 2, 6, 12 and 24 h post PH (n=3 at each time point). All
animal experiments in the present study were performed according to
the Guidelines of the University of Tsukuba for the Care of
Laboratory Animals and the Regulation for Animal Experiments.
Tissue samples
For microarray analysis, the hepatectomized
8-week-old BALB/c mice were sacrificed at the time points indicated
above and the residual livers of mice were collected, immediately
frozen in liquid nitrogen and stored at −80°C until use. For
histological analysis, the residual livers at each time point were
fixed with 4% (w/v in phosphate-buffered saline; PBS) ice-cold
paraformaldehyde solution overnight. The fixed livers were washed
in PBS, dehydrated in ethanol and embedded in paraffin blocks.
Hematoxylin and eosin staining
The livers were sliced into 4-μm sections.
The sections were placed on glass slides and deparaffinized in
xylene, followed by treatment with ethanol. Following immersion in
water, the sections were treated with hematoxylin solution for 1
min, followed by washing with warm water for 15 min. The sections
were then treated with eosin solution for 10 sec, followed by
washing with water. The stained sections were dehydrated with
ethanol followed by xylene. The resulting sections were
photographed using the MIRAX Desk scanner (CarlZeiss, Oberkochen,
Germany).
RNA extraction and quality check
Total RNAs from frozen livers were isolated using
the ISOGEN kit (Nippon Gene, Tokyo, Japan), according to the
manufacturer’s instructions. The quality and concentration of total
RNAs were assessed with a NanoDrop Spectrophotometer (NanoDrop
Technologies, Wilmington, DE, USA), according to the manufacturer’s
instructions. Total RNA samples exhibited 260/280-nm absorbance
ratios of 1.8–2.0. The integrity of the RNAs was assessed using the
Agilent 2100 Bioanalyzer (Agilent Technologies, Santa Clara, CA,
USA) and the RNA 6000 Nano LabChip kit (Agilent Technologies),
revealing RNA integrity numbers (RIN) of the samples to be >8.0;
these RNA samples were considered suitable for microarray
analysis.
Sense and antisense microarray
Cyanine 3 (Cy3)-labeled cDNA samples were
synthesized from 10 μg total RNAs of regenerating or normal
livers, using the LabelStar Array kit (Qiagen, Valencia, CA, USA),
Cy3-dCTP (GE Healthcare, Buckinghamshire, UK) and random nonamer
primers. The custom-designed mouse sense and antisense 60-nt
sequences were arranged in an Agilent 44K × 4 system (Agilent
eArray Design ID=021137; Tsukuba GeneTech Laboratories, Ibaraki,
Japan). Agilent 44K × 4 mouse sense and antisense custom-microarray
slides were hybridized with Cy3-labeled cDNAs (2 μg) in
hybridization solution prepared with Gene Expression Hybridization
kit (Agilent Technologies), following the manufacturer’s
instructions. Cy3 fluorescence signal images on the slides were
obtained by DNA microarray scanner (Agilent Technologies) and
processed using Feature Extraction software (Agilent Technologies),
according to the manufacturer’s instructions.
The expression data obtained were processed using
GeneSpring GX12 software (Agilent Technologies) to perform a log
transformation and normalization to the 75th percentile of all
values on respective microarrays, followed by normalization of the
median expression level of all samples. Additionally, the
normalized data of gene expression were filtered on flags and genes
classified as either flag-[Detected] or flag-[Not Detected] were
allowed to pass the filter. The expression profiles at each time
point, i.e., 2, 6, 12 and 24 h post PH against 0 h were compared
using GeneSpring GX12 software. To identify genes with
statistically significant differences at each time point, a
Kruskal-Wallis test with a P-value cutoff of 0.05 was performed.
The up- and downregulated sense/antisense transcripts were selected
by fold changes (>2.0) at each time point against 0 h and by
signal intensities (>100.0).
Strand-specific reverse
transcription-quantitative polymerase chain reaction (RT-qPCR)
To examine the expression of sense and antisense
transcripts obtained by the microarray analysis, strand-specific
RT-qPCR was performed in selected genes. The synthesis of
strand-specific cDNAs derived from sense or antisense transcripts
was performed using reverse or forward primers as previously
described (17). In order to
normalize the values of sense and antisense transcripts among
samples, EGFP (enhanced green fluorescent protein) RNA was mixed
with total RNAs prior to strand-specific RT-qPCR (17). These strand-specific cDNAs were used
as a template for qPCR. The qPCRs were performed using Power
SYBR-Green PCR Master Mix (Life Technologies, Carlsbad, CA, USA),
primer pair sets and StepOnePlus Real-Time PCR system (Life
Technologies) under the conditions of 10 min at 95°C followed by 40
cycles at 95°C for 15 sec and at 60°C for 60 sec. The values of
sense or antisense transcripts were normalized based on the values
of the control.
Results and Discussion
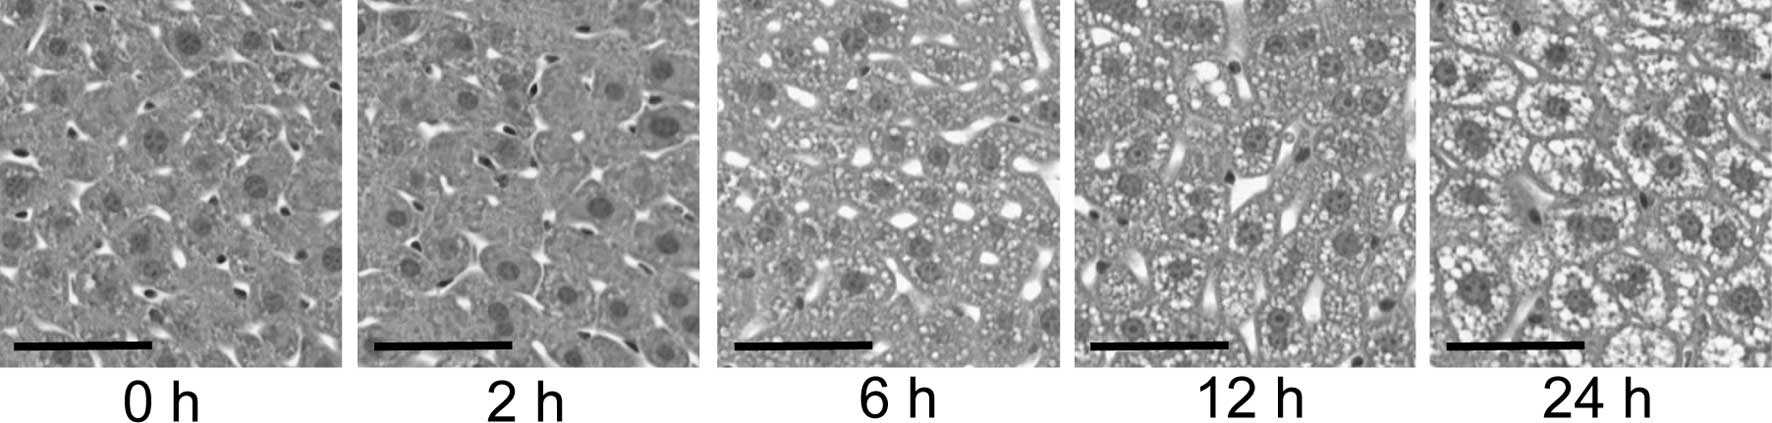
In order to confirm the histological characteristics
of liver regeneration, hematoxylin and eosin staining was performed
on the sections of regenerating livers as described above. As shown
in Fig. 1, hepatocellular
morphological changes were insignificant at 2 h post PH; however,
fat droplets appeared in hepatocytes at 6 h post PH. Hepatocellular
expansions were recognized at 12 h post PH and hepatocellular
proliferation images were observed at 24 h post PH. These
observations were consistent with those previously reported
regarding liver regeneration (18).
Subsequently, using the liver samples as described
above, up- or downregulation of sense and antisense transcripts in
the liver regeneration process was investigated. The liver samples
were collected from three animals at each time point, i.e., 0, 2,
6, 12 and 24 h post PH, and subjected to expression analysis using
the custom-microarray. When the expression profiles of sense and
antisense transcripts in the liver samples were assessed with the
Kruskal-Wallis test using GeneSpring GX12 software, 104 sense and
17 antisense transcripts were observed to be differentially
expressed with a magnitude of >2.0-fold (P<0.05) during the
course of liver regeneration. Among the 104 sense transcripts, 97
were upregulated and 7 were down-regulated (Table I). The upregulation of
Igfbp1, Btg2, Socs3, Gadd45g,
S3-12 (Plin4), Apoa4 and Hp transcripts
in the 104 sense transcripts has already been documented in liver
regeneration (9,18–21);
however, to the best of our knowledge, the upregulation of the
remaining transcripts was first described in the present study. As
regards the 17 antisense transcripts, 15 and 2 transcripts were up-
and downregulated, respectively, as described for the first time in
the present study (Table II).
 | Table IUpregulated 97 (20 of the 97
indicated) and downregulated 7 sense transcripts in the early phase
of liver regeneration. |
Table I
Upregulated 97 (20 of the 97
indicated) and downregulated 7 sense transcripts in the early phase
of liver regeneration.
| Fold change (vs. 0 h)
| | |
|---|
| Accession no. | 2 h | 6 h | 12 h | 24 h | Gene name | Regulation |
|---|
| NM_008341 | 64.94 | 52.31 | 21.22 | 7.20 | Mus musculus
insulin-like growth factor binding protein 1 (Igfbp1) | Up |
| NM_007570 | 26.45 | 28.70 | 9.16 | 4.47 | Mus musculus
B-cell translocation gene 2, anti-proliferative (Btg2) | Up |
| NM_007707 | 18.36 | 8.78 | 5.21 | 2.61 | Mus musculus
suppressor of cytokine signaling 3 (Socs3) | Up |
| NM_021897 | 15.99 | 4.10 | 2.73 | 2.31 | Mus musculus
transformation-related protein 53-inducible nuclear protein 1
(Trp53inp1) | Up |
| NM_054098 | 14.80 | 24.71 | 11.68 | 2.74 | Mus musculus
STEAP family member 4 (Steap4) | Up |
| NM_011817 | 14.50 | 14.67 | 5.65 | 4.54 | Mus musculus
growth arrest and DNA-damage-inducible 45 γ (Gadd45g) | Up |
| NM_011803 | 14.05 | 25.39 | 11.39 | 10.75 | Mus musculus
Kruppel-like factor 6 (Klf6) | Up |
| NM_025459 | 11.44 | 14.01 | 3.45 | 2.89 | Mus musculus
family with sequence similarity 134, member B (Fam134b) | Up |
| NM_022424 | 10.50 | 7.67 | 4.41 | 2.18 | Mus musculus
fibronectin type III domain-containing 4 (Fndc4) | Up |
| NM_144792 | 10.47 | 22.33 | 4.35 | 3.52 | Mus musculus
sphingomyelin synthase 1 (Sgms1) | Up |
| NM_019653 | 10.11 | 5.73 | 2.64 | 2.90 | Mus musculus
WD repeat and SOCS box-containing 1 (Wsb1) | Up |
| NM_011809 | 10.03 | 9.19 | 5.61 | 3.61 | Mus musculus
E26 avian leukemia oncogene 2, 3′ domain (Ets2) | Up |
| NM_016896 | 9.88 | 12.72 | 6.28 | 3.14 | Mus musculus
mitogen-activated protein kinase kinase kinase 14
(Map3k14) | Up |
| NM_029844 | 9.51 | 19.37 | 11.82 | 4.59 | Mus musculus
melanocortin 2 receptor accessory protein (Mrap) | Up |
| NM_008362 | 8.36 | 15.05 | 7.75 | 2.98 | Mus musculus
interleukin 1 receptor, type I (Il1r1) | Up |
| NM_007468 | 7.64 | 9.95 | 13.76 | 15.49 | Mus musculus
apolipoprotein A-IV (Apoa4) | Up |
| NM_017370 | 3.20 | 4.85 | 6.42 | 3.82 | Mus musculus
haptoglobin (Hp) | Up |
| NM_133862 | 2.59 | 3.92 | 4.77 | 2.43 | Mus musculus
fibrinogen γ chain (Fgg) | Up |
| NM_181849 | 2.43 | 4.01 | 5.33 | 2.50 | Mus musculus
fibrinogen β chain (Fgb) | Up |
| NM_020568 | 6.54 | 6.55 | 3.71 | 2.13 | Mus musculus
perilipin 4, S3-12 (Plin4) | Up |
| NM_145434 | −7.07 | −10.06 | −21.76 | −5.68 | Mus musculus
nuclear receptor subfamily 1, group D, member 1 (Nr1d1) | Down |
| NM_021704 | −6.92 | −8.73 | −3.66 | −3.45 | Mus musculus
chemokine (C-X-C motif) ligand 12 (Cxcl12) | Down |
| NM_011535 | −2.83 | −5.04 | −3.08 | −2.64 | Mus musculus
T-box 3 (Tbx3) | Down |
| NM_010570 | −2.60 | −9.03 | −3.71 | −2.02 | Mus musculus
insulin receptor substrate 1 (Irs1) | Down |
| NM_016974 | −2.26 | −24.91 | −61.47 | −18.86 | Mus musculus
D site albumin promoter-binding protein (Dbp) | Down |
| NM_145152 | −2.16 | −7.81 | −5.11 | −2.08 | Mus musculus
leucine-rich repeat-containing 3 (Lrrc3) | Down |
| NM_153584 | −2.14 | −12.74 | −6.50 | −2.79 | Mus musculus
cDNA sequence BC031353 (BC031353) | Down |
| Table IIFifteen upregulated and two
downregulated antisense transcripts in the early phase of liver
regeneration. |
Table II
Fifteen upregulated and two
downregulated antisense transcripts in the early phase of liver
regeneration.
| Fold change (vs. 0
h)
| | |
|---|
| Accession no. | 2 h | 6 h | 12 h | 24 h | Gene name | Regulation |
|---|
| NM_026300 | 31.12 | 52.99 | 68.18 | 16.48 | Mus musculus
RIKEN cDNA 4930549C01 gene (4930549C01Rik) | Up |
| NM_021478 | 10.82 | 13.23 | 6.03 | 2.95 | Mus musculus
tubby-like protein 1 (Tulp1) | Up |
| NM_133862 | 6.44 | 27.91 | 24.97 | 11.12 | Mus musculus
fibrinogen γ chain (Fgg) | Up |
| NM_017370 | 5.28 | 14.96 | 17.19 | 12.40 | Mus musculus
haptoglobin (Hp) | Up |
| NM_175439 | 5.26 | 6.56 | 3.22 | 2.01 | Mus musculus
methionine-tRNA synthetase 2 (mitochondrial) (Mars2) | Up |
| NM_181849 | 4.38 | 11.18 | 12.71 | 5.99 | Mus musculus
fibrinogen β chain (Fgb) | Up |
| NM_009984 | 4.28 | 8.65 | 5.26 | 3.96 | Mus musculus
cathepsin L (Ctsl) | Up |
| NM_007468 | 4.19 | 5.84 | 10.06 | 17.23 | Mus musculus
apolipoprotein A-IV (Apoa4) | Up |
| NM_177867 | 3.76 | 7.30 | 9.35 | 2.69 | Mus musculus
spermatogenesis associated 21 (Spata21) | Up |
| NM_133653 | 3.65 | 12.96 | 8.90 | 2.52 | Mus musculus
methionine adenosyltransferase I, α (Mat1a) | Up |
| NM_010196 | 3.48 | 12.21 | 14.08 | 6.33 | Mus musculus
fibrinogen α chain (Fga) | Up |
| NM_181325 | 2.60 | 4.92 | 3.28 | 3.63 | Mus musculus
solute carrier family 25 (mitochondrial carrier ornithine
transporter), member 15 (Slc25a15) | Up |
| NM_018746 | 2.45 | 10.18 | 10.67 | 3.77 | Mus musculus
inter α-trypsin inhibitor, heavy chain 4 (Itih4) | Up |
| NM_008716 | 2.09 | 9.08 | 35.23 | 6.45 | Mus musculus
Notch gene homolog 3 (Drosophila) (Notch3) | Up |
| NM_008407 | 2.04 | 4.04 | 5.36 | 2.99 | Mus musculus
inter-α trypsin inhibitor, heavy chain 3 (Itih3) | Up |
| NM_010107 | −2.14 | −2.04 | −3.23 | −4.63 | Mus musculus
ephrin A1 (Efna1) | Down |
| NM_001033537 | −2.07 | −2.08 | −4.53 | −5.25 | Mus musculus
post-GPI attachment to proteins 3 (Pgap3) | Down |
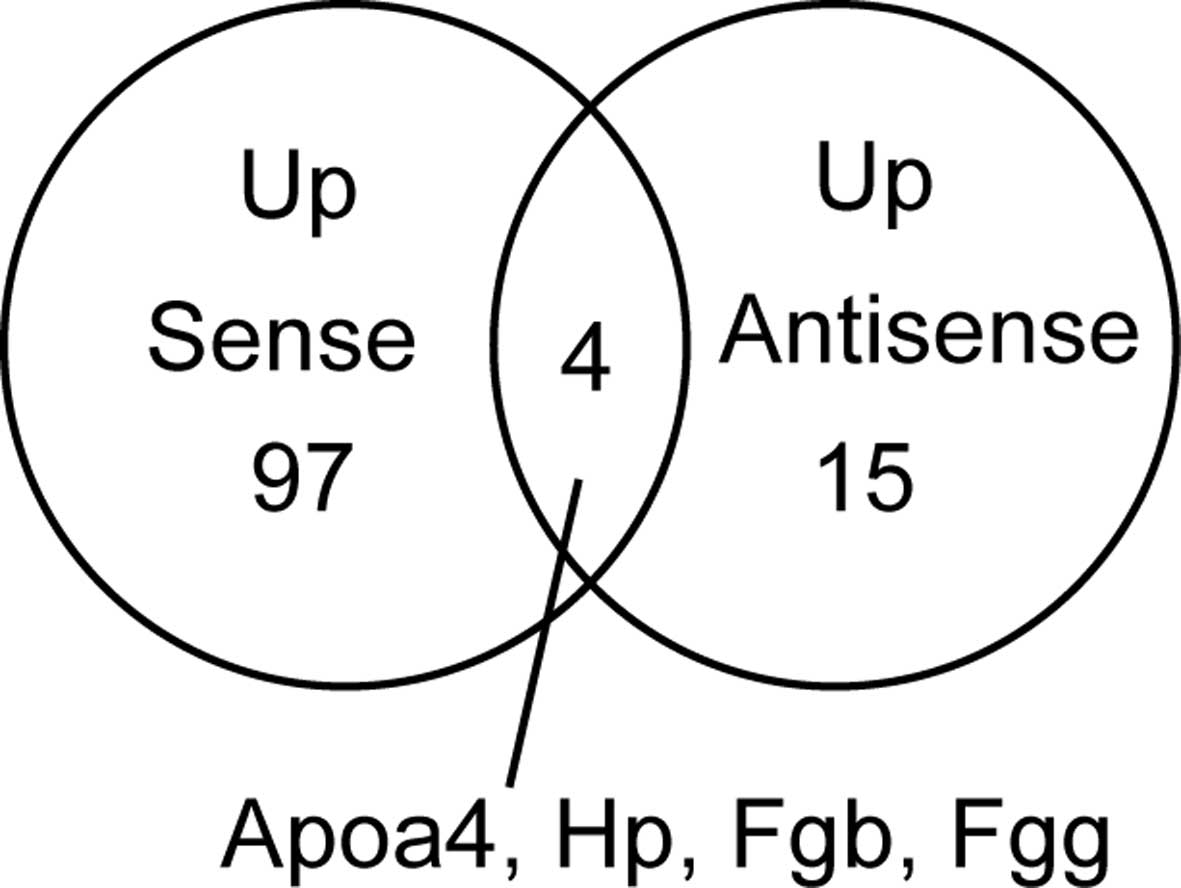
When we investigated whether the same genes were
observed in the sense and antisense transcripts, four genes
(Apoa4, Hp, Fgb and Fgg) exhibited
upregulation in the sense and antisense transcripts during liver
regeneration (Fig. 2, Tables I and II). Apolipoprotein A-IV (APOA4) is a
component of chylomicrons and high-density lipoprotein (http://omim.org/entry/107690). Haptoglobin (HP),
combines with free plasma hemoglobin, preventing loss of iron
through the kidneys (http://omimorg/entry/140100). FGB and FGG are members
of the fibrinogen family and function as factor I of blood
coagulation for hemostasis (http://omim.org/entry/134830; http://omim.org/entry/134850). The expression of these
genes was indicated to be under complex control in liver
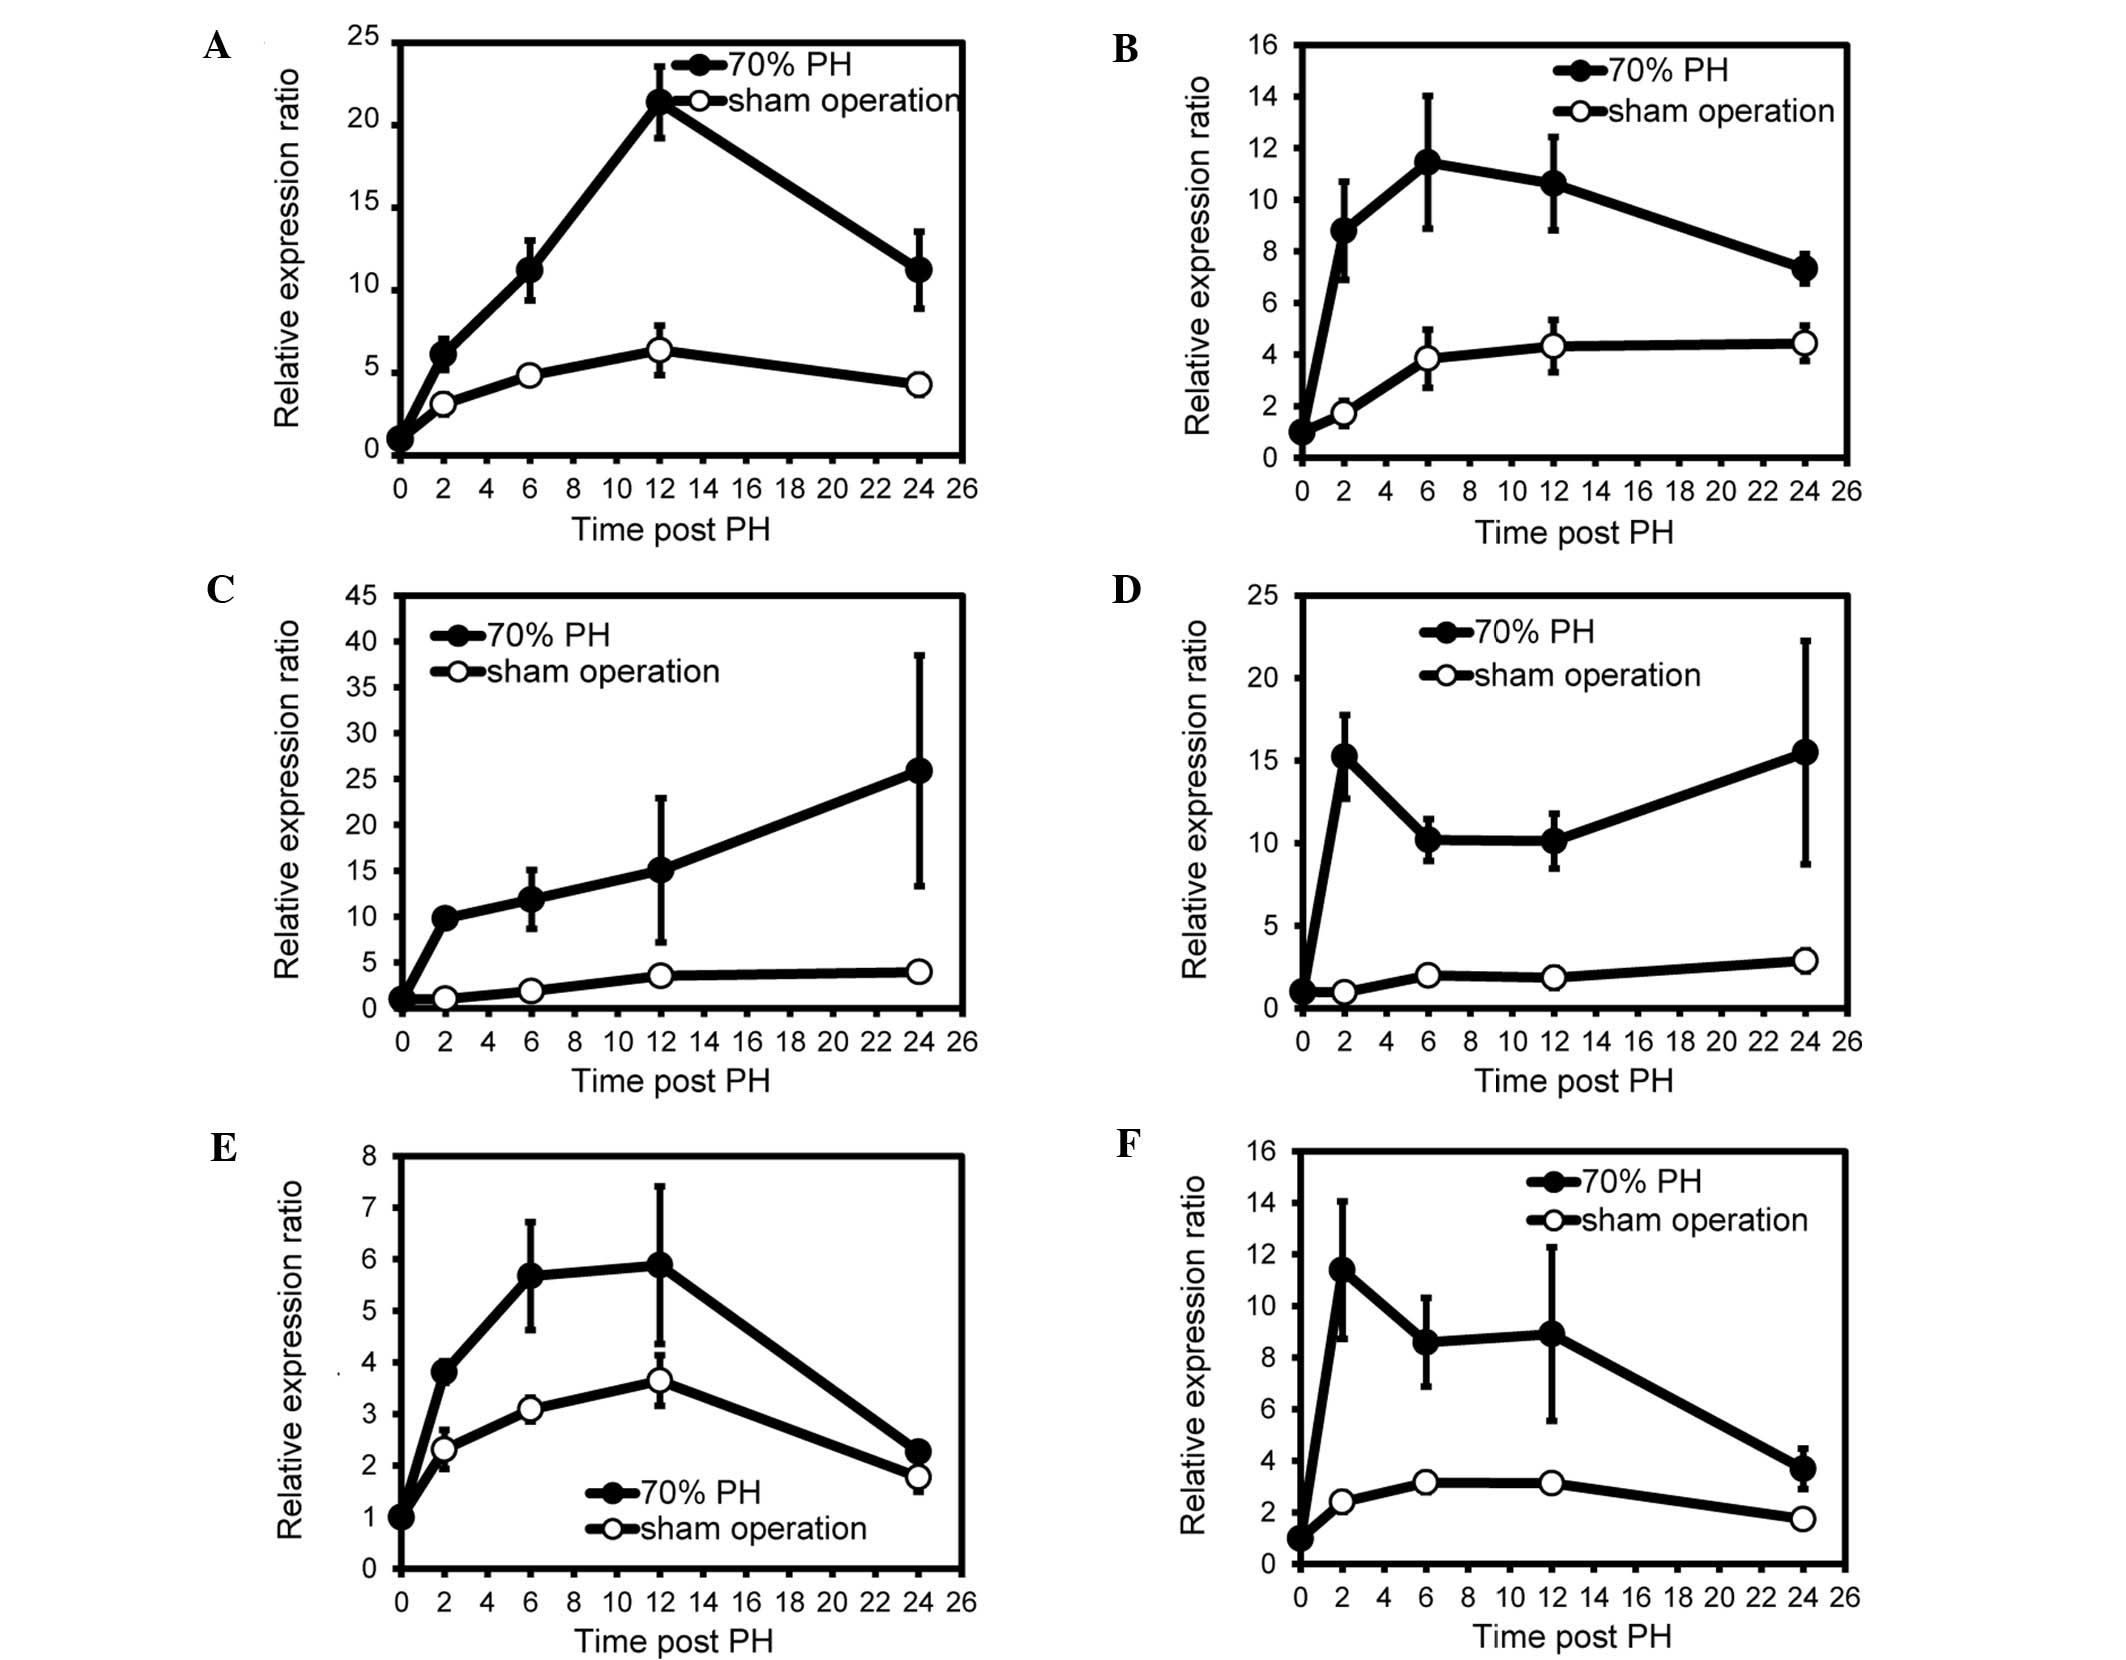
regeneration. To verify that these expression levels were the
results of liver regeneration and were not due to the skin
incision, we attempted to design strand-specific primers in the
sequences used for the microarray probe and succeeded in synthesis
of primer pairs of the Apoa4, Hp and Fgb
transcripts (Table III).
Subsequently, the amounts of the Apoa4, Hp and
Fgb transcripts were measured in regenerating liver samples
using strand-specific RT-qPCR and compared to liver samples of
sham-operated mice. As shown in Fig.
3, the strand-specific RT-qPCR demonstrated that the expression
patterns of the genes were essentially identical to those described
above.
| Table IIIPrimer sequences for detection of
sense/antisense transcripts. |
Table III
Primer sequences for detection of
sense/antisense transcripts.
| Primer name | Sequences | Size (mer) | PCR products
(bp) |
|---|
| Apoa4
forward |
5′-ATGTGGACAACCTGCACAC-3′ | 19 | 60 |
| Apoa4
reverse |
5′-CCACCAACTTAAAGGACAAGTTTA-3′ | 24 | |
| Hp
forward |
5′-GGGTGTACACCTTAAACGAC-3′ | 20 | 60 |
| Hp
reverse |
5′-TCGCTGGAGAGAAACTCC-3′ | 18 | |
| Fgb
forward |
5′-TTCTCATTGAAATGGAGGACTGGA-3′ | 24 | 60 |
| Fgb
reverse |
5′-TGAAGCCTCCATAATGTGCCT-3′ | 21 | |
In previous studies, two types of regulation were
reported in sense and antisense transcripts of a single gene: one
type was associated with a positive correlation between the
regulation of sense and antisense transcripts and the other type
with a negative correlation. An example of the former correlation
was reported between breast tumor and normal cells (22) and an example of the latter
correlation between leukemia and normal cells (23). These findings indicated that an
antisense transcript has different control mechanisms in gene
expression regulation. The Apoa4, Hp, Fgb and
Fgg sense and antisense transcripts in the liver
regeneration were positively correlated, as in the case of the
breast tumor and normal cells. We were not able to determine the
function of antisense transcripts, since it has not yet been
elucidated. To elucidate the function of the transcripts in liver
regeneration, protein synthesis from the sense transcripts should
be measured. In the future, the up- and downregulation of
transcripts other than Apoa4, Hp, Fgb and
Fgg should be verified as being the results of liver
regeneration and not those of the skin incision, using liver
samples of sham-operated mice.
In conclusion, 104 sense and 17 antisense
transcripts were indicated to be liver regeneration-responsive
transcripts. Of these transcripts, the upregulation of
Apoa4, Hp, Fgb and Fgg sense and
antisense transcripts was confirmed during liver regeneration using
sham-operated mice. Loss-of-function analyses of sense and
antisense transcripts may provide additional information to further
elucidate the function of antisense transcripts in liver
regeneration.
References
|
1
|
Clavien PA, Petrowsky H, DeOliveira ML and
Graf R: Strategies for safer liver surgery and partial liver
transplantation. N Engl J Med. 356:1545–1559. 2007. View Article : Google Scholar : PubMed/NCBI
|
|
2
|
Higgins GM and Anderson RM: Experimental
pathology of the liver. Arch Pathol. 12:186–202. 1931.
|
|
3
|
Martins PN, Theruvath TP and Neuhaus P:
Rodent models of partial hepatectomies. Liver Int. 28:3–11. 2008.
View Article : Google Scholar
|
|
4
|
Fausto N, Campbell JS and Riehle KJ: Liver
regeneration. Hepatology. 43:S45–S53. 2006. View Article : Google Scholar
|
|
5
|
Michalopoulos GK: Liver regeneration. J
Cell Physiol. 213:286–300. 2007. View Article : Google Scholar : PubMed/NCBI
|
|
6
|
Taub R: Liver regeneration: from myth to
mechanism. Nat Rev Mol Cell Biol. 5:836–847. 2004. View Article : Google Scholar : PubMed/NCBI
|
|
7
|
Cressman DE, Greenbaum LE, DeAngelis RA,
et al: Liver failure and defective hepatocyte regeneration in
interleukin-6-deficient mice. Science. 274:1379–1383. 1996.
View Article : Google Scholar : PubMed/NCBI
|
|
8
|
Yamada Y, Kirillova I, Peschon JJ and
Fausto N: Initiation of liver growth by tumor necrosis factor:
deficient liver regeneration in mice lacking type I tumor necrosis
factor receptor. Proc Natl Acad Sci USA. 94:1441–1446. 1997.
View Article : Google Scholar : PubMed/NCBI
|
|
9
|
Togo S, Makino H, Kobayashi T, et al:
Mechanism of liver regeneration after partial hepatectomy using
mouse cDNA microarray. J Hepatol. 40:464–471. 2004. View Article : Google Scholar : PubMed/NCBI
|
|
10
|
Chiba M, Murata S, Myronovych A, et al:
Elevation and characteristics of Rab30and
S100a8/S100a9expression in an early phase of liver
regeneration in the mouse. Int J Mol Med. 27:567–574.
2011.PubMed/NCBI
|
|
11
|
Katayama S, Tomaru Y, Kasukawa T, et al:
Antisense transcription in the mammalian transcriptome. Science.
309:1564–1566. 2005. View Article : Google Scholar : PubMed/NCBI
|
|
12
|
Røsok Ø and Sioud M: Systematic
identification of sense-antisense transcripts in mammalian cells.
Nat Biotechnol. 22:104–108. 2004.PubMed/NCBI
|
|
13
|
Kiyosawa H, Yamanaka I, Osato N, Kondo S
and Hayashizaki Y: Antisense transcripts with FANTOM2 clone set and
their implications for gene regulation. Genome Res. 13:1324–1334.
2003. View Article : Google Scholar : PubMed/NCBI
|
|
14
|
Kiyosawa H, Mise N, Iwase S, Hayashizaki Y
and Abe K: Disclosing hidden transcripts: mouse natural
sense-antisense transcripts tend to be poly(A) negative and nuclear
localized. Genome Res. 15:463–474. 2005. View Article : Google Scholar : PubMed/NCBI
|
|
15
|
Lee JT, Davidow LS and Warshawsky D:
Tsix, a gene antisense to Xist at the X-inactivation
centre. Nat Genet. 21:400–404. 1999. View
Article : Google Scholar
|
|
16
|
Faghihi MA, Modarresi F, Khalil AM, et al:
Expression of a noncoding RNA is elevated in Alzheimer’s disease
and drives rapid feed-forward regulation of beta-secretase. Nat
Med. 14:723–730. 2008.
|
|
17
|
Kohno K, Chiba M, Murata S, et al:
Identification of natural antisense transcripts involved in human
colorectal cancer development. Int J Oncol. 37:1425–1432.
2010.PubMed/NCBI
|
|
18
|
Shteyer E, Liao Y, Muglia LJ, Hruz PW and
Rudnick DA: Disruption of hepatic adipogenesis is associated with
impaired liver regeneration in mice. Hepatology. 40:1322–1332.
2004. View Article : Google Scholar : PubMed/NCBI
|
|
19
|
White P, Brestelli JE, Kaestner KH and
Greenbaum LE: Identification of transcriptional networks during
liver regeneration. J Biol Chem. 280:3715–3722. 2005. View Article : Google Scholar : PubMed/NCBI
|
|
20
|
Jensen SA: Liver gene regulation in rats
following both 70 or 90% hepatectomy and endotoxin treatment. J
Gastroenterol Hepatol. 16:525–530. 2001.
|
|
21
|
Riehle KJ, Campbell JS, McMahan RS, et al:
Regulation of liver regeneration and hepatocarcinogenesis by
suppressor of cytokine signaling 3. J Exp Med. 205:91–103. 2008.
View Article : Google Scholar : PubMed/NCBI
|
|
22
|
Grigoriadis A, Oliver GR, Tanney A, et al:
Identification of differentially expressed sense and antisense
transcript pairs in breast epithelial tissues. BMC Genomics.
10:3242009. View Article : Google Scholar : PubMed/NCBI
|
|
23
|
Yu W, Gius D, Onyango P, et al: Epigenetic
silencing of tumor suppressor gene p15 by its antisense RNA.
Nature. 451:202–206. 2008. View Article : Google Scholar : PubMed/NCBI
|