Introduction
The global molecular changes during the development
of liver cancer are not well characterized despite the availability
of large-scale screening techniques capable of detecting these
alterations. Cancer progression stages involve genetic and
epigenetic events that transform a normal cell into a malignant
cell. Underlying these changes are genome instability,
inflammation, a reprogramming of energy metabolism and evasion of
the immune system giving rise to a cell with progressive autonomy
that has a sustained proliferation, with insensitivity to
inhibitory growth, resistance to death, replicative immortality, an
increment in angiogenesis and activation of invasion and metastasis
(1). In humans, a liver cancer
progression analysis is uncertain; it is difficult to establish a
demonstrative transcriptomic profile of the time-points
representative of the common stages of cancer progression. An issue
that increases the complexity of investigating cancer in humans is
the numerous etiological factors involved in its occurrence
(2). Despite these limitations,
important achievements have been made through microarray studies
using human tumors to obtain the characteristic gene expression
profiles (GEP) that are referred to as ‘signatures’. In mammary
cancers, GEP predict the result of treatment (3), and in liver cancer, GEP forecast an
early recurrence following treatment (4). GEP has been used to identify the
origins of metastatic tumors (5).
Additionally, there are examples of successful studies in
experimental animal liver cancer models. In a microarray study in
rodents, the HSP70 protein was proposed to be an early marker of
hepatocellular cancer (6). In
another animal model, epigenetic modulation of protein expression
was detected through gene expression profiling by selecting
differentially expressed genes and studying their non-coding,
regulatory regions (7). One
potential method of studying types of human cancer is to use
experimental animal models (8). The
advantage of this methodology is the well-defined and reproducible
stages of tumor evolution (9),
which allows for a sound global molecular study of cancer
progression through GEP that can then be extrapolated to humans.
The aim of the present study was to characterize the liver GEP
associated with hepatocellular liver cancer (HCC) progression in a
rat model of hepatocarcinogenesis. The resistant hepatocyte model,
as modified in laboratory 50 (Department of Cell Biology, Center
for Research and Advanced Studies, Mexico) is suitable for this
purpose (10) as it reproducibly
exhibits the initiation, promotion, preneoplastic and tumor
progression stages (Fig. 1A).
Ten different time-points from day 1 through 18
months after the initiation of treatment were selected to assess
the GEP in whole tissue, dysplastic nodules, tumors and tissue
surrounding neoplastic alterations, corresponding to the
initiation, promotion, preneoplastic lesion evolution and cancer
progression stages. As the genes identified in the present study
and possibly those that are directly involved in cancer
progression, ABCC3 and LGALS3BP genes are discussed
as candidates for further analysis to establish their protein
expression profiles associated with liver cancer progression, and
consequently, to validate them as early detection markers or
therapeutic targets. In the present model, based only in the
comparative gene profile expression during progression of
preneoplastic lesions and tumors, it is possible to identify
candidate genes and their respective proteins to validate them in
determining their relevance in rat HCC progression.
Materials and methods
Animals
All the experiments were performed in accordance
with and approval by the Internal Committee for the Care and Use of
Laboratory Animals of the Center for Research and Advanced Studies
of the National Polytechnic Institute (CINVESTAV-IPN) under the
protocol no. 0001-02. Male Fischer 344 rats (180–200 g) were
obtained from the Unit for Production of Experimental Laboratory
Animals (UPEAL Cinvestav, Mexico City, Mexico). The animals had
free access to food (PMI Feeds Inc., Laboratory Diet, Richmond, IN,
USA) and water. The animals were maintained in a holding room under
controlled conditions with 12-h light/dark cycles, 50% relative
humidity and a temperature of 21 ˚ C. Animal care followed the
institutional guidelines for the use of laboratory animals.
Experimental protocol
The animals were administered 200 mg/kg
diethylnitrosamine (Sigma-Aldrich, St. Louis, MO, USA) (11). Subsequently, they received 3 daily
dosages of 20 mg/kg 2-acetylaminofluoeren (Sigma-Aldrich) on days
7, 8 and 9, and a 75% partial hepatectomy was performed on day 10.
Three groups of non-treated animals (n=4/group) were sacrificed by
exsanguination at 0 h, and 9 and 12 months. Treated animals
(n=4/group) were sacrificed at 1, 7, 11, 16 and 30 days and 5, 9,
12 and 18 months (Fig. 1A). Their
livers were excised, washed in physiological saline solution,
frozen in 2-methyl butane with liquid nitrogen (Sigma-Aldrich) and
stored at −80 ˚ C. Frozen liver sections were used for the
microarray assays (n=4/group). Paraffin-fixed liver samples were
also prepared for histochemical and immunohistochemical
examination.
Histochemical analysis and tissue
selection
Histological analysis of preneoplastic and
neoplastic lesions was performed using hematoxylin and eosin
staining and γ-glutamil transpeptidase (GGT) histochemical
(12) (Fig. 1B). Images of GGT-positive lesions
were captured with a digital camera (Color view 12) and quantified
with AnalySIS software (AnalySIS) (Soft Imaging System GmbH,
Muenster, Germany). Total liver homogenates were used to analyze
the specimens obtained at 0 h and 1, 7, 11 and 16 days. Based on
the GGT histochemical analysis, tissues from preneoplastic lesions
corresponding to the persistent nodules, tumors and the adjacent
tissue were selected to be analyzed at 30 days and 5, 9, 12 and 18
months (Fig. 1B).
RNA extraction and microarray
hybridization
RNA was extracted using Tripure Isolation Reagent
(Roche, Indianapolis, IN, USA). The microarray analysis was
performed using GeneChip® Rat Exon 1.0 ST arrays, which
are whole-genome arrays containing over 1 million probe sets, with
<4 perfect match (PM) probes each, spread across the exons of
all the known genes, plus a number of additional regions based on
other annotation sources, including GenScan predictions and ESTs
from dbEST. Microarray hybridizations were performed in four
replicates for each analysis point according to the GeneChip Whole
Transcript (WT) Sense Target Labeling Assay user manual (www.affymetrix.com). The data were collected using
Affymetrix GCOS software, and the quality of the results was
analyzed with the Affymetrix Gene Expression Console (Affymetrix,
Inc., Santa Clare, CA, USA).
Reverse transcription-quantitative
polymerase chain reaction (RT-qPCR)
Certain gene products that were differentially
expressed using the microarray gene analysis were validated by
RT-qPCR. Total RNA was extracted from the tissue samples using
TRIzol reagent and was reverse transcribed into cDNA using
SuperScrit II RT and oligo(dTs) were used according to the
manufacturer's instructions (Invitrogen, Carlsbad, CA, USA). qPCR
assays of the transcripts were performed with gene-specific
fluorescent labeled probes on a 7000 Sequence Detector (Applied
Biosystems, Foster City, CA, USA). The specificity of
S100A10, SPINT1, TXNRD1, LGALS3BP,
ABCC3 and LYST primers was designed using Primer
Express software (Applied Biosystems). The reference gene,
18S, was used to normalize the mRNA data. The PCR reaction
mixture contained 1 µ1 cDNA, 7.5 µ1 1X TaqMan Universal PCR Master
Mix and 1 µ1 of the primers and probe. The following cycling
protocol was employed: 1 cycle at 50 ˚ C for 2 min, 1 cycle at 95 ˚
C for 10 min and 40 cycles at 95 ˚ C and 60 ˚ C for 15 sec and 1
min, respectively. The results were evaluated according to the
comparative Ct method.
Principal component analysis, Venn
diagram and pathway analysis
Microarray data was performed (Affymetrix, Inc.) and
analyzed (Affymetrix gene expression console and Partek software)
determining the transcriptional changes during liver cancer
progression.
Partek® software, version 6.5 (Partek,
Inc., St. Louis, MO, USA) was used to perform the principal
component analysis. After statistical analysis using
Partek® software we realized the Venn diagram in each
stage. The ingenuity pathway analysis (IPA) software program was
used to assign genes to specific biological functions and canonical
and toxicological pathways.
Data analysis
Data analysis was performed using Partek Genomics
Suite software (Partek, Inc.). Normalization and probe
summarization were performed using the Robust Multi-array average
algorithm, and differential gene expression was evaluated using a
one-way analysis of variance with Tukey's post hoc test. GEPs were
selected based on a fold-change ≤ 1 and a P-value <0.05, which
was considered to indicate a statistically significant
difference.
Results
GEP analysis
GEP from the liver of non-treated rats and in 9
different times after the corresponding treatment interventions
were obtained (Fig. 1A) and
analyzed using the Affymetrix gene expression console and Partek
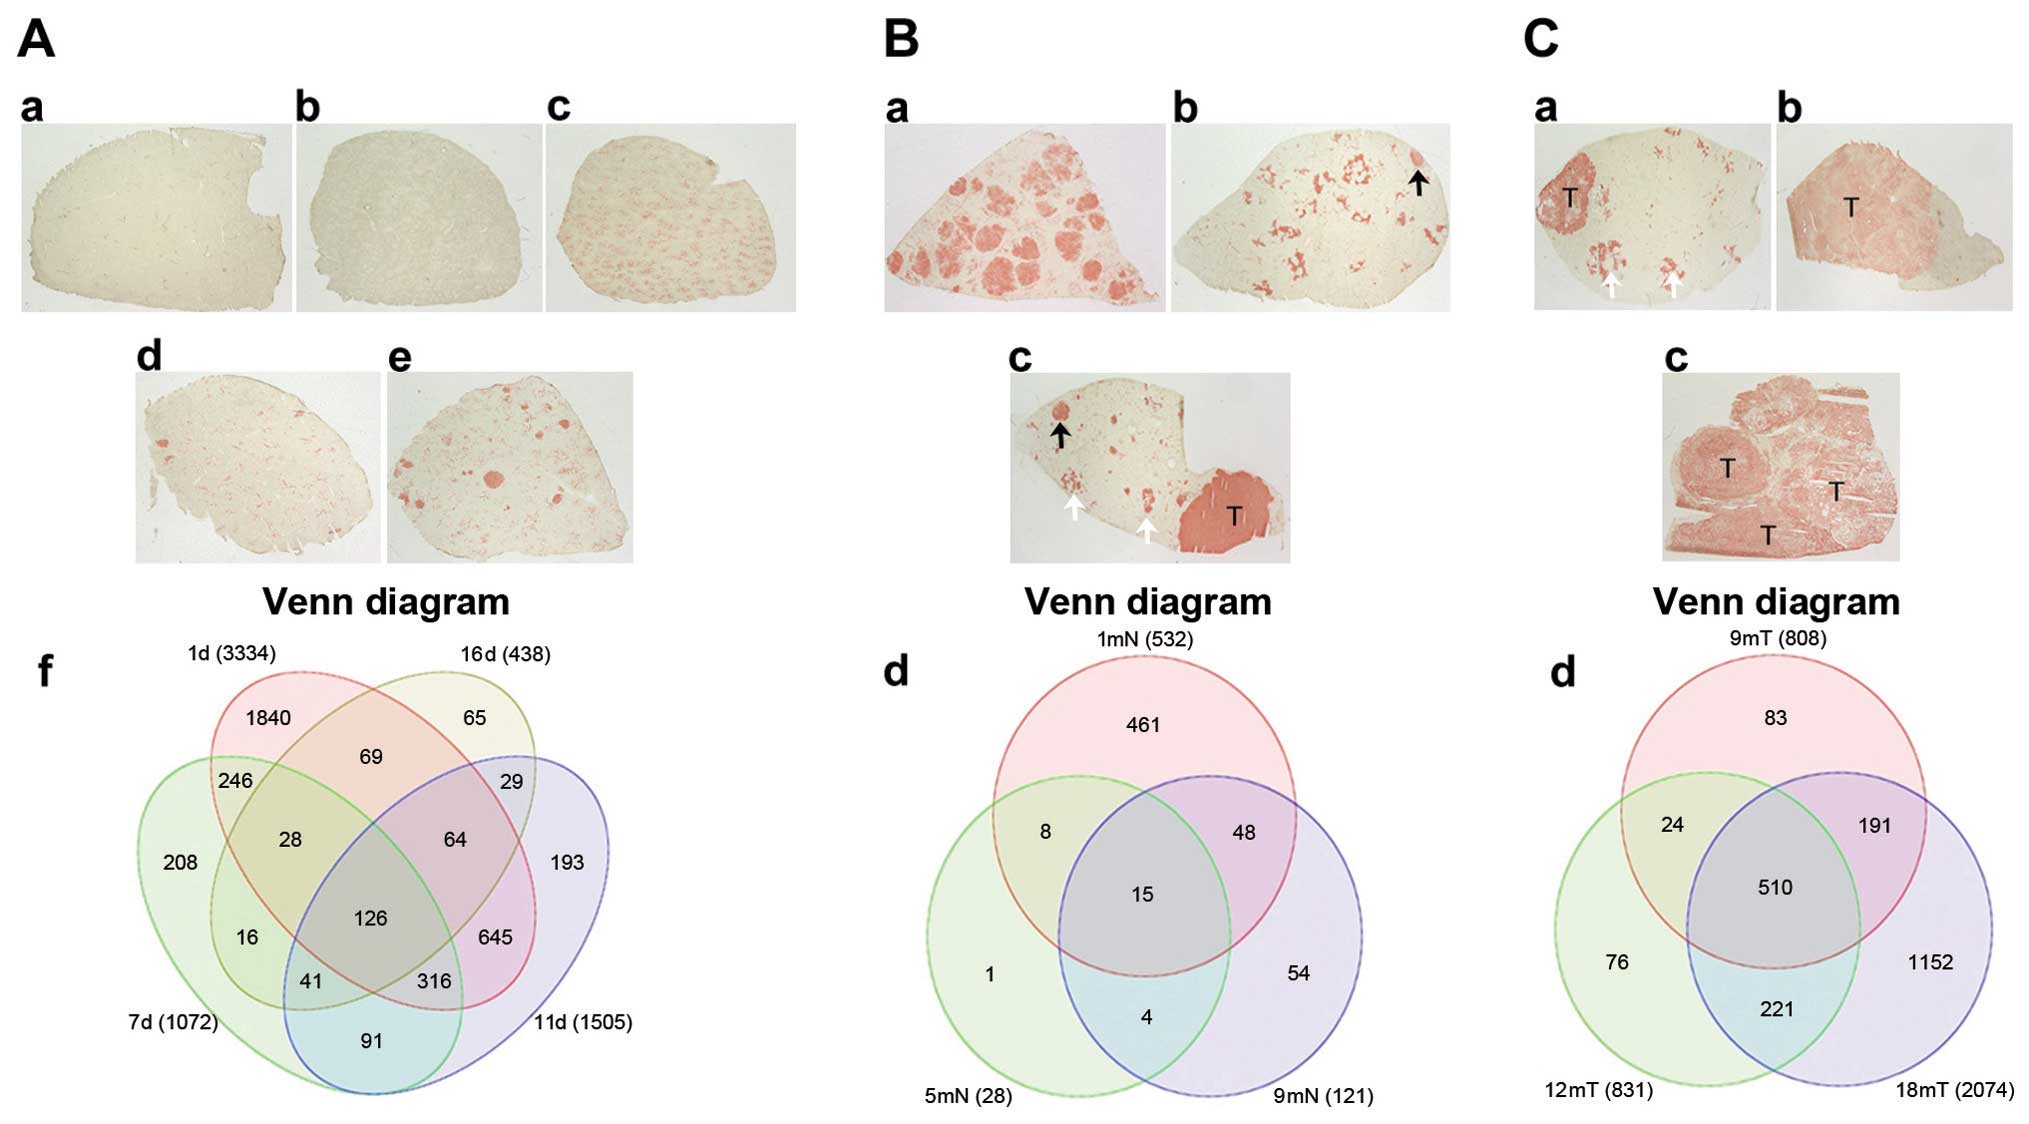
software. As shown in Fig. 1, to
obtain tissue from preneoplastic lesion (Fig. 1Ba-d) sections were stained with GGT+
to localize preneoplastic lesion and with a cork borer were
extracted. The same operation was performed to obtain tumor tissue
(Fig. 1 Ca-c). In the progression
period, from 1, 7, 11 days until 16 days after the initiation of
treatment, the expression of 3,334, 1,072, 1,505 and 438
transcripts were differentially expressed, respectively (Fig. 2A-f). Of the 3,334 altered-expression
genes of day 1, ~60% were overexpressed. There is a clear tendency
for the number of differentially expressed genes to decrease that
coincides with the minimum number of nodular lesions being observed
at 5 months (data not shown). At this time, significant changes in
the histology of GGT+ tissue were observed, mainly in
the persistence of nodules with highly modified phenotypes, which
was in contrast to the detection of the fewest gene expression
changes, with only 28 differentially expressed genes in the nodular
regions and eight in the surrounding tissue (Fig. 2B-d). When a cancer was exhibited and
progressed, a continuous increase in the number of differentially
expressed genes was observed. Tumors exhibited 808, 831 and 1,465
differentially expressed genes at 9, 12 and 18 months (Fig. 2C-d). Of note, from 9 months onward,
in contrast to the early period from 24 h to 16 days, the number of
underexpressed genes was greater than the number of overexpressed
genes.
IPA
Pathway and global functional analyses were
performed using IPA 6.0 (www.
ingenuity.com). Analysis of the top four biological functions
determined by IPA was cancer with 1,335 genes altered, neurological
disease with 1,310 genes altered, cellular growth and proliferation
with 1,271 genes altered and cell death with 1,260 genes altered.
The top genes from those determined as altered for cancer by the
number of frequency were LGALS3BP, GADD45B,
ABCC3 and EPH1. The other genes of the remaining
pathways that were of note for the number of frequency were
CREM, ANNXA2, GNAI2, BAK1, ARNT
and CCN1. This data provide information to find new markers
for the early detection of HCC or target genes for
chemoprevention.
Common GEP in the modified resistant
hepatocyte model
A comparative analysis using Venn diagrams allows
for the detection of the number of genes exclusive to each
time-point in the three progression periods. Between 1, 7, 11 and
16 days, there were 126 genes in common with altered expression;
this GEP could be considered a characteristic of the initial
progression period of cancer development (Fig. 2A). In the preneoplastic evolution
period of persistent nodular lesions, which was measured at 1, 5
and 9 months, there were 15 commonly altered genes (Fig. 2B), of which 11 were overexpressed
and only four were underexpressed. Several genes are highly
associated with detoxification processes, lipid metabolism, redox
reactions and energy production. In tumor tissue samples from 9, 12
and 18 months (Fig.2C), there were
510 modified genes in common, which represent a group of genes that
may be considered as markers of cancer progression (Fig. 2C-d).
Hypothetically, the genes that show altered
expression throughout cancer promotion and tumor progression are
good candidates for further analyses to characterize the genetic
footprint of liver cancer. In this context, LGALS3BP and
ABCC3 are gene candidates for further studies.
LGALS3BP was commonly expressed throughout the progression
of hepatocarcinogenesis from 24 h until the end of the experiment
at 18 months, and ABCC3 was highly expressed from
preneoplastic progression until the 18-month time-point. The gene
differential expression values were extremely statistically
significant between the observed differences in LGALS3BP and
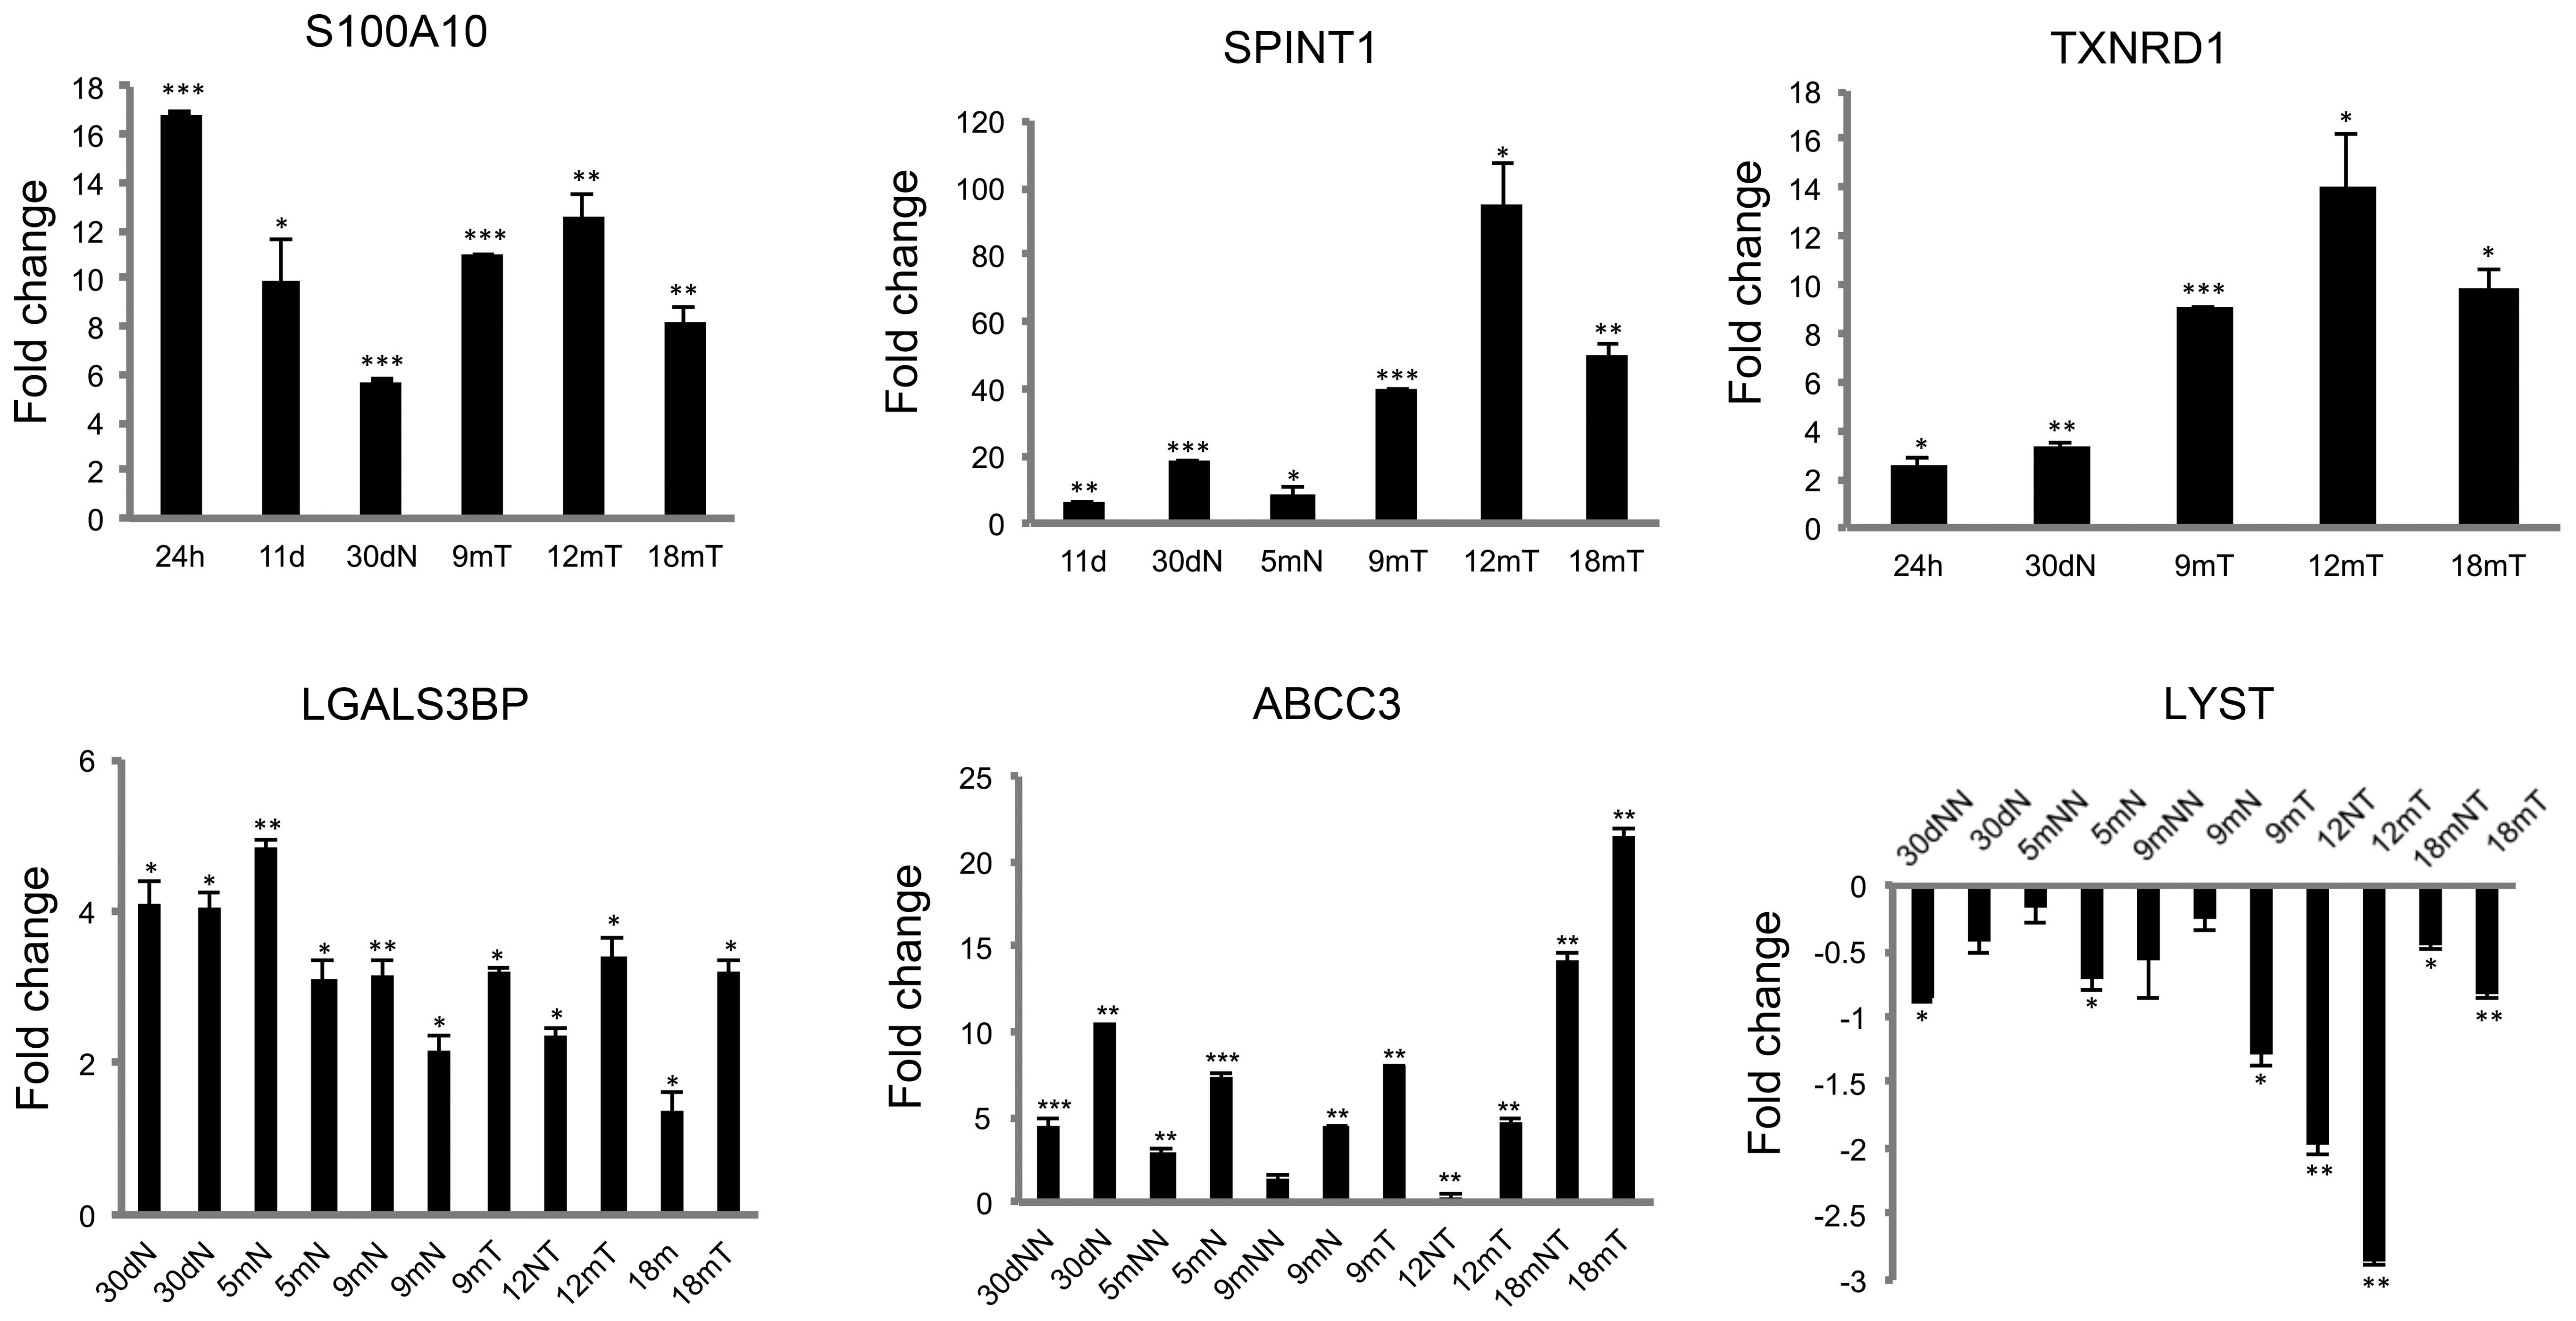
ABCC3 (data not shown). Validation of the present
microarrays results by RT-qPCR of S100A10, SPINT1, LGALS3BP,
TXNRD1, ABCC3 and LYST presented the similar clear
differential expression in the carcinogenesis process, as was
observed in the microarrays results (Fig. 3). The mRNA overexpression of
LGALS3BP in all the carcinogenesis processes allows the
proposal of this gene as a candidate for an early biomarker. The
high mRNA overexpression of ABCC3, mainly in persistent
nodule, preneoplastic lesions, and tumors, and to a lesser degree
in the adjacent tissue, suggests a participation in the progression
of hepatocarcinogenesis that should be further studied (Fig. 3). The sustained mRNA underexpression
of LYST suggests that decreased expression of this gene is
required throughout the progression of the carcinogenic
process.
Discussion
Animal models of hepatocarcinogenesis of liver
tumorigenesis provide data for the cellular development of HCC in
humans (13–15). In the present model, the progression
from nodules to HCC occurs without additional carcinogen treatment.
The majority of nodules undergo remodeling but a few persistent
nodules show spontaneous cell proliferation and increased size
(9, 16–18).
These types of nodules were susceptible to dissection. In the
present model, rats with persistent hepatic nodular lesions will
coexist with HCC after 9 to 10 months (19). Hypothetically, persistent nodule
cells may exhibit an altered genetic background that allows
autonomous cell proliferation to undergo a slow evolution to
cancer. The genes that were differentially expressed within the
persistent nodules and commonly observed from 1 to 9 months
represent preneoplastic evolution. Using a Venn diagram, the genes
that were unique to each period and the genes that were shared
between periods were identified. Those genes commonly expressed
from the initial time analyzed through the eight time-points that
followed until the last time-point at 18 months were investigated.
With the suggestion that hepatocyte nodules are known precursors
for HCC (18), the present analysis
was directed to detect 13 genes that were commonly differentially
expressed during preneoplastic evolution and during tumor
progression; these are the candidates for further studies. In this
context, ABCC3 and LGALS3BP are good candidates to be
further studied as cancer markers.
With regards to ABCC3, multidrug
resistance-associated protein 3 (MRP3) and MRP-like protein
2, upregulation of this gene has been associated with HCC
progression and is negatively regulated by microRNA (20). Together with MPR2, these are
components of the multidrug resistance phenotype (21) and its upregulation has been
confirmed in choriocarcinoma and cervical cancer (22). The protein encoded by this gene is a
tumor-associated antigen in HCC recognized by cytotoxic T cells and
has been suggested as an immunogenic target for HCC immunotherapy
(23).
LGALS3BP is also known as Mac-2 binding
protein (Mac-2BP or MAC2BP), Cyp-C-associated protein
(CyCAP), and protein 90K. This protein has been detected as a
ligand of dendritic cell (DC)-specific intercellular adhesion
molecule-3-grabbing non-integrin (DC-SIGN), suggesting that it
binds to LGALS3BP-bearing tumor-associated Le glycans. Of
note, Mac-2BP was detected as a predominant DC-SIGN ligand
expressed in several primary colorectal cancer tissues in patients
in comparison with CEAs from other areas, and may become a novel
potential colorectal cancer biomarker for certain patients, rather
than CEA (24). Notably, the
LGALS3BP from the cell matrix of neuroblastoma cells was
observed to act as a secreted protein that stimulates interleukin-6
expression in bone marrow stromal cells, which raises the question
of whether LGALS3BP-binding protein could be a valuable
target for therapeutic intervention in metastatic neuroblastoma
(25).
In conclusion, a comparative profiling during
preneoplastic and tumor progression provided an unbiased selection
of a set of genes that should be analyzed as candidates for cancer
markers or therapeutic targets.
Glossary
Abbreviations
Abbreviations:
|
NN
|
no nodule
|
|
N
|
nodule
|
|
NT
|
no tumor
|
|
T
|
tumor
|
|
GEP
|
gene expression profiles
|
|
ABCC3
|
ATP-binding cassette sub-family C
member 3
|
|
LGALS3BP
|
lectin galactoside-binding soluble
3-binding protein
|
|
Lyst
|
lysosomal trafficking regulator
|
|
MRHM
|
modified resistant hepatocyte
model
|
Acknowledgements
The present study was supported by a scholarship, a
grant contribution (no. 39525-M) from CONACYT and a postdoctoral
scholarship for multidisciplinary project 3 from the SVT grant of
CINVESTAV. The authors would like to acknowledge the animal
technical support at UPEAL-Cinvestav, including M. Vet. Rafael
Leyva-Muñoz, M. Vet. Ricardo Gaxiola-Centeno and Dr Jorge
Fernandez.
References
|
1
|
Hanahan D and Weinberg RA: Hallmarks of
cancer: next generation. Cell. 144:646–674. 2011. View Article : Google Scholar : PubMed/NCBI
|
|
2
|
Blum HE: Hepatocellular carcinoma: therapy
and prevention. World J Gastroenterol. 11:7391–7400.
2005.PubMed/NCBI
|
|
3
|
Dunn L and Demichele A: Genomic predictors
of outcome and treatment response in breast cancer. Mol Doagn Ther.
13:73–90. 2009. View Article : Google Scholar
|
|
4
|
Woo HG, Park ES, Cheon JH, et al: Gene
expression-based recurrence prediction of hepatitis B virus-related
human hepatocellular carcinoma. Clin Cancer Res. 14:2056–2064.
2008. View Article : Google Scholar : PubMed/NCBI
|
|
5
|
Ge X, Yamamoto S, Tsusumi S, et al:
Interpreting expression profiles of cancers by genome-wide survey
of breath expression in normal tissues. Genomics. 86:127–141. 2005.
View Article : Google Scholar : PubMed/NCBI
|
|
6
|
Chuma M, Sakamoto M, Yamazaki K, et al:
Expression profiling in multistage hepatocarcinogenesis:
identification of HSP70 as a molecular marker of early
hepatocellular carcinoma. Hepatology. 37:198–207. 2003. View Article : Google Scholar : PubMed/NCBI
|
|
7
|
Nojima M, Maruyama R, Yasui H, et al:
Genomic screening of genes silenced by DNA methylation revealed an
association between RASD1 inactivation and dexamethasone resistance
in multiple myeloma. Clin Cancer Res. 15:4356–4364. 2009.
View Article : Google Scholar : PubMed/NCBI
|
|
8
|
Lee JS, Grisham JW and Thorgeirsson SS:
Comparative functional genomics for identifying models of human
cancer. Carcinogenesis. 26:1013–1020. 2005. View Article : Google Scholar : PubMed/NCBI
|
|
9
|
Farber E: Pre-cancerous steps in
carcinogenesis. Their physiological adaptive nature. Biochim
Biophys Acta. 738:171–180. 1984.PubMed/NCBI
|
|
10
|
Carrasco-Legleu CE, Márquez-Rosado L,
Fattel-Fazenda S, et al: Chemoprotective effect of caffeic acid
phenethyl ester on promotion in a medium-term rat
hepatocarcinogenesis assay. Int J Cancer. 108:488–492. 2004.
View Article : Google Scholar : PubMed/NCBI
|
|
11
|
Marche-Cova A, Fattel-Fazenda S,
Rojas-Ochoa A, et al: Follow-up of GST-p during
hepatocarcinogenesis with DEN-2AAF in F344 rats. Arch Med Res.
26:S169–S173. 1995.PubMed/NCBI
|
|
12
|
Rutemburg AM, Kim H, Fischbein JW, et al:
Histochemical and structural demonstration of gamma-glutamyl
transpeptidase activity. J Histochem Cytochem. 17:517–526. 1969.
View Article : Google Scholar : PubMed/NCBI
|
|
13
|
Thorgeirsson SS and Grisham JW: Molecular
pathogenesis of human hepatocellular carcinoma. Nat Genet.
31:339–346. 2002. View Article : Google Scholar : PubMed/NCBI
|
|
14
|
Lee JS, Chu IS, Heo J, et al:
Classification and prediction of survival in hepatocellular
carcinoma by gene expression profiling. Hepatology. 40:667–676.
2004. View Article : Google Scholar : PubMed/NCBI
|
|
15
|
Feitelson MA, Pan J and Lian Z: Early
molecular and genetic determinants of primary liver malignancy.
Surg Clin North Am. 84:339–354. 2004. View Article : Google Scholar : PubMed/NCBI
|
|
16
|
Enomoto K and Farber E: Kinetics of
phenotypic maturation of remodeling of hyperplastic nodules during
liver carcinogenesis. Cancer Res. 42:2330–2335. 1982.PubMed/NCBI
|
|
17
|
Tatematsu M, Nagamine Y and Farber E:
Redifferenciation as a basis for remodeling of carcinogen-induced
hepatocyte nodules to normal appearing liver. Cancer Res.
1:5049–5058. 1983.
|
|
18
|
Farber E: Experimental induction of
hepatocellular carcinoma as paradigm for carcinogenesis. Clin
Physiol Biochem. 5:152–159. 1987.PubMed/NCBI
|
|
19
|
Pérez-Carreón JI, López-García C,
Fattel-Fazenda S, et al: Gene expression profile related to the
progression of preneoplastic nodules toward hepatocellular
carcinoma in rats. Neoplasia. 8:373–383. 2006. View Article : Google Scholar : PubMed/NCBI
|
|
20
|
Borel F, Han R, Visser A, et al: Adenosine
triphosphate-binding cassette transporter genes up-regulation in
untreated hepatocellular carcinoma is mediated by cellular micro
RNAs. Hepatology. 55:821–832. 2012. View Article : Google Scholar : PubMed/NCBI
|
|
21
|
Nies AT, König J, Pfannschmidt M, et al:
Expression of the multidrug resistance proteins MRP2 and MRP3 in
human hepatocellular carcinoma. Int J Cancer. 94:492–499. 2001.
View Article : Google Scholar : PubMed/NCBI
|
|
22
|
Serrano MA, Macias RI, Briz O, et al:
Expression in human trophoblast and choriocarcinoma cell lines,
BeWo, Jeg-3 and JAr of genes involved in the hepatobiliary-like
excretory function of the placenta. Placenta. 28:107–117. 2007.
View Article : Google Scholar : PubMed/NCBI
|
|
23
|
Mizukoshi E, Honda M, Arai K, et al:
Expression of multidrug resistance-associated protein 3 and
cytotoxic T cell responses in patients with hepatocellular
carcinoma. J Hepatol. 49:946–954. 2008. View Article : Google Scholar : PubMed/NCBI
|
|
24
|
Nonaka M, Ma BY, Imaeda H, et al:
Dendritic cell-specific intercellular adhesion molecule 3-grabbing
non-integrin (DC-SIGN) recognizes a novel ligand, Mac-2-binding
protein, characteristically expressed on human colorectal
carcinomas. J Biol Chem. 286:22403–22413. 2011. View Article : Google Scholar : PubMed/NCBI
|
|
25
|
Fukaya Y, Shimada H, Wang LC, Zandi E and
DeClerck YA: Identification of galectin-3-binding protein as a
factor secreted by tumor cells that atimulates interleukin-6
expression in the bone marrow stroma. J Biol Chem. 283:18573–18581.
2008. View Article : Google Scholar : PubMed/NCBI
|