Introduction
Coronary artery disease (CAD) has become a leading
cause of morbidity and mortality in India and worldwide (1,2). In India,
CAD affects younger people (aged <45 years) with a higher
severity resulting in a 4-fold higher incidence compared to the
western population. The present day preventive strategies mainly
depend on the conventional risk factors, such as diabetes,
hypertension, obesity and levels of lipids [including total
cholesterol, triglycerides, high-density lipoprotein (HDL) and
low-density lipoprotein (LDL)]. However, a number of supposedly
healthy people without the majority of these risk factors develop
the disease (3,4). This high prevalence of CAD in Asian
Indians accentuates the requirement for identification of
biomarkers for an improved risk stratification (5,6).
Serum γ-glutamyl transferase (GGT) levels, a
traditional marker of hepatobiliary dysfunction, are positively
associated with atherosclerosis and have prognostic importance. An
increase of 1 U/l of GGT (on a log scale) was found to increase the
risk of coronary heart disease (CHD) by 20%, stroke by 54% and the
combined risk of stroke and CHD by 34% (7). Furthermore, correlation of GGT has been
found with cardiovascular risk factors, such as hypertension,
stroke, diabetes, dyslipidemia and metabolic syndrome (8). The presence of catalytically active GGT
molecules in the atheromatous plaque also reinforce the association
of GGT with atherosclerosis (9).
However, the association of GGT to premature CAD in Asian Indians
has not yet been evaluated. The present study was undertaken to
investigate the association of plasma GGT levels with CAD in young
Asian Indians and its interaction with other biomarkers for
potential use in an improved risk stratification.
Materials and methods
Subjects
A total of 2,318 subjects were enrolled in the
phase-I of the Indian Atherosclerosis Research Study (IARS)
(10) between 2004–2006, which is a
prospective study designed according to the principles and the
guidelines of World Medical Association Declaration of Helsinki and
the Indian Council of Medical Research and approved by Thrombosis
Research Institute Ethics committee. Signed informed consent was
obtained from all the participants who were enrolled, and 240 age-
and gender-matched subjects (120 unaffected and 120 affected) were
selected for this study. All the subjects were ≤45 years of age for
males and ≤50 years for females at the onset of the disease. The
individuals with an abnormal electrocardiogram (ECG), positive
angiogram showing >70% stenosis in any one of the coronary
arteries or >50% in two or more arteries and individuals posted
for coronary artery bypass graft (CABG) surgery or percutaneous
coronary intervention were considered as CAD subjects. The
unaffected subjects were all healthy volunteers without clinical
signs of CAD, as confirmed by ECG. None of the participants
enrolled in the study had inflammatory disorders, concomitant
infections or any other major illness such as cancer, liver or
renal disease.
Telephonic assessment of cardiac
health status
Periodic telephonic follow-up of all the study
participants was undertaken to obtain an update on the cardiac
health status, and five rounds of follow-up for an average time of
18 months were completed. Endpoints included non-fatal events
(re-do percutaneous transluminal coronary angioplasty/repeat
CABG/heart attack or stroke) and fatal events (fatal heart
attack/fatal stroke/sudden death or cardiac arrest). This
information was verified through either paper trail or hospital
records, wherever available.
Assessment of risk factors
All the participants were assessed for the presence
of the risk factors by personal interviews, which included
demographics (age, gender, occupation and socio-economic status),
lifestyle, health characteristics (diet, waist circumference,
smoking status and use of alcohol), and medical history
[hypertension and diabetes, systolic and diastolic blood pressure,
LDL and HDL-cholesterol (HDL-c), and triglycerides].
Assessment of lipids
Venous blood samples (20 ml) were collected after
overnight fasting (12 h). The samples were centrifuged at 2,000 × g
for 20 min at 25°C, following which 1 ml aliquots of serum and
plasma were stored at −80°C. Total cholesterol and triglycerides
were measured using reagents and standards from Randox Laboratories
(Antrim, UK) in a Cobas-Fara II Clinical Chemistry auto-analyzer
(Hoffman La Roche Ltd., Basel, Switzerland). For the estimation of
HDL-c, the non-HDL fractions were precipitated with a mixture of
2.4 mmol/l phosphotungstic acid and 39 mmol/l magnesium chloride
(Bayer Diagnostics, Baroda, Gujarat, India) prior to estimation.
The LDL concentration was calculated using the Friedewald formula.
The inter-assay coefficient of variation for commercial controls
and normal human pooled serum/plasma (NHP) was 4.9–7.0% for total
cholesterol, 6.1–7.7% for triglycerides, and 7.1–12.2% for
HDL-c.
Biomarker evaluation
All the plasma or serum biomarkers were measured by
ELISA (enzyme-linked immunosorbent assay) or the
immunoturbidometric method. Plasma GGT and high-sensitivity
C-reactive protein (hsCRP) concentrations were measured using a
Flex reagent cartridge in Dimension XpandPlus Integrated Chemistry
system (Siemens, Germany). Lipoprotein (a) [lp(a)] (Randox
Laboratories) was measured in the Cobas-Fara II Clinical Chemistry
auto-analyzer. Plasma levels of interleukin-6 (IL-6), cystatin C
(R&D systems, Minneapolis, MN, USA), neopterin (IBL
International, Atlanta, GA, USA), myeloperoxidase (MPO) (Mercodia,
Uppasala, Sweden) and tumor necrosis factor-like weak inducer of
apoptosis (TWEAK) (eBiosciences, Vienna, Austria) were measured
using ELISA kits. The secretory phospholipase A2 (sPLA2) was
measured by a sandwich immunometric assay (Cayman Corporation, Ann
Arbor, MI, USA). The inter-assay coefficient of variation of
in-house controls (NHP) was 4.40% for GGT, 5.2% for lp(a), 4.3% for
IL-6, 5.37% for sPLA2, 7.85% for hsCRP, 5.99 to 11.8% for
neopterin, 11.8% for cystatin C, 9.3% for myeloperoxidase, and 7%
for TWEAK.
Statistical analysis
The variations in the baseline characteristics
between the unaffected and affected subjects were studied using the
Student's t-test and univariate analysis of variance for
quantitative variables. The quantitative parameters were adjusted
for age, gender, hypertension, diabetes mellitus and smoking.
χ2 test was used to assess the association of discrete
outcomes with premature CAD. Results are represented as mean ±
standard error for quantitative variables, whereas the discrete
outcomes were represented as frequencies. The Shapiro-Wilk and
Kolmogorove-Smirnov test were used to assess the normality of the
data. The data with skewed distribution were natural
log-transformed. The association of GGT with lipids, inflammatory
and oxidative stress markers was evaluated by Pearson's correlation
for quantitative variables and partial correlation was used for
conventional risk factors (CRFs; which were age, gender,
hypertension diabetes mellitus and smoking) adjusted analysis. The
association of GGT with discrete outcomes was evaluated using
χ2 test.
In order to review the association between higher
levels of GGT and incidence of premature CAD, GGT levels were
categorized in to tertiles. The odds ratios (OR) with 95%
confidence interval (CI) were obtained by comparing top tertiles,
considering the first tertile as the reference category using
logistic regression analysis. The logistic regression analysis was
also used to build different models with multiple markers having
GGT in common. The discriminative ability of a significant model
with the highest OR was evaluated using receiver operating
characteristic analysis. The significance of improvement in the
area under the curve (AUC) between CRF and GGT + CRF models was
assessed using DeLong's test. A two-tailed P-value <0.05% was
considered to indicate a statistically significant difference. All
the above statistical analyses were carried out using statistical
package for social sciences (SPSS) version 17.0 (SPSS, Inc.,
Chicago, IL, USA).
Results
Baseline clinical characteristics of
unaffected subjects and premature CAD patients
The clinical characteristics of the 240 age- and
gender-matched study subjects (120 affected and 120 unaffected) are
provided in Table I. The CAD-affected
subjects showed a high frequency of hypertension and diabetes, and
low levels of HDL-c compared to the unaffected subjects. The
frequency of smokers was also significantly higher in the
CAD-affected group. The affected subjects showed a lower level of
LDL compared to the unaffected, possibly due to statin usage in
this group. Six out of 9 protein markers assayed in the present
study were significantly different between the affected and
unaffected subjects. As shown in Table
I, the mean GGT levels were significantly higher in
CAD-affected subjects in comparison with the unaffected subjects
(34.48±1.00 vs. 30.94±0.90 U/l; P=0.009) and similar results were
also obtained for lp(a) (27.20±2.34 vs. 18.70±1.55 mg/dl;
P=0.019).
 | Table I.Baseline characteristics of the study
population. |
Table I.
Baseline characteristics of the study
population.
| Variables | Unaffected,
n=120 | Affected, n=120 | P-value |
|---|
| Age, years | 41.78±0.40 | 41.79±0.40 | 0.988 |
| Age at onset,
years | – | 39.50±0.43 | – |
| Waist circumference,
cm | 89.57±0.85 | 88.41±0.87 | 0.341 |
| Gender, n (%) |
|
|
|
|
Males | 93 (77.5) | 93 (77.5) | 1.00 |
|
Females | 27 (22.5) | 27 (22.5) |
|
| Smoking, n (%) | 30 (25.0) | 55 (45.8) | 0.001 |
| Alcohol habit, n
(%) | 24 (20.0) | 16 (13.3) | 0.053 |
| Hypertension, n
(%) | 19 (15.8) | 45 (37.5) | <0.001 |
| Diabetes, n (%) | 16 (13.3) | 32 (26.7) | 0.007 |
| Total cholesterol,
mg/dl | 181.83±3.94 | 154.00±3.45 | <0.001 |
| Triglyceride,
mg/dl | 150.20±8.30 | 163.17±6.26 | 0.152 |
| High-density
lipoprotein, mg/dl | 39.00±0.88 | 35.97±0.76 | 0.010 |
| Low-density
lipoprotein, mg/dl | 112.78±3.36 | 85.35±3.14 | <0.001 |
| γ-glutamyl
transferase, U/l | 30.94±0.90 | 34.48±1.00 | 0.009 |
| Secretory
phospholipase A2, pg/ml | 2,518.02±130.67 | 2,720.00±130.15 | 0.027 |
| Lipoprotein (a),
mg/dl | 18.70±1.55 | 27.20±2.34 | 0.019 |
| Myeloperoxidase,
µg/l | 304.61±14.73 | 356.51±19.89 | 0.037 |
| Neopterin,
nmol/l | 7.65±0.32 | 8.50±0.34 | 0.034 |
| Interleukin-6,
pg/ml | 2.98±0.15 | 3.66±0.19 | 0.006 |
| Cystatin C,
ng/ml | 1,053.61±30.43 | 1,058.03±32.74 | 0.899 |
| High-sensitivity
C-reactive protein, mg/dl | 2.35±0.18 | 2.32±0.19 | 0.599 |
| Tumor necrosis
factor-like weak inducer of apoptosis, pg/ml | 355.94±30.95 | 347.00±17.99 | 0.802 |
| Statins, n (%) | 5 (4.2) | 82 (68.3) | <0.001 |
Correlation of GGT levels with
inflammatory and lipid markers
The GGT levels showed a significant
moderate-positive correlation with the oxidative stress marker
neopterin, and remained borderline significant following adjustment
for the age, gender, hypertension, diabetes mellitus and smoking
(Table II). GGT was also positively
correlated to triglyceride levels and waist circumference, and
remained significant following adjustment with age, gender,
hypertension, diabetes mellitus and smoking (all the significant
correlation coefficients were <0.3).
| Table II.Correlation of γ-glutamyl transferase
(GGT) levels with oxidative stress, inflammatory markers and lipid
markers. |
Table II.
Correlation of γ-glutamyl transferase
(GGT) levels with oxidative stress, inflammatory markers and lipid
markers.
|
| Unadjusted | Adjusted |
|---|
|
|
|
|
|---|
| Characteristics | Correlation | P-value | Correlation | P-value |
|---|
| Lipoprotein (a),
mg/dl | 0.050 | 0.465 | 0.050 | 0.480 |
| Secretory
phospholipase A2, pg/ml | 0.036 | 0.584 | 0.092 | 0.165 |
| Interleukin-6,
pg/ml | 0.090 | 0.164 | 0.093 | 0.161 |
| Myeloperoxidase,
µg/l | 0.106 | 0.102 | 0.068 | 0.310 |
| Neopterin,
nmol/l | 0.172 | 0.008 | 0.127 | 0.050 |
| Total cholesterol,
mg/dl | 0.110 | 0.090 | 0.136 | 0.041 |
| High-density
lipoprotein, mg/dl | −0.035 | 0.587 | 0.012 | 0.862 |
| Low-density
lipoprotein, mg/dl | 0.001 | 0.993 | 0.043 | 0.519 |
| Triglyceride,
mg/dl | 0.292 | <0.001 | 0.168 | 0.011 |
| Waist circumference,
cm | 0.252 | <0.001 | 0.251 | <0.001 |
Cross-sectional correlation was carried out to
understand the association between GGT and binary outcomes. The
present analysis did not observe any association of hypertension,
diabetes and alcohol habit with GGT levels (Table III). The number of smokers in the
second and third tertile of GGT was higher in comparison to the
first, and there was a positive association between GGT levels and
smoking.
| Table III.Cross-sectional correlation of binary
outcomes with γ-glutamyl transferase (GGT). |
Table III.
Cross-sectional correlation of binary
outcomes with γ-glutamyl transferase (GGT).
|
| GGT tertiles |
|
|---|
|
|
|
|
|---|
|
Characteristics | Tertile 1
(<22.59 U/l) (n=86) | Tertile 2
(22.59–32.21 U/l) (n=71) | Tertile 3 (≥32.21
U/l) (n=83) | P-value |
|---|
| Smoking, n (%) | 19 (22.1) | 26 (36.6) | 40 (48.2) | 0.002 |
| Hypertension, n
(%) | 17 (19.8) | 22 (31.0) | 25 (30.1) | 0.194 |
| Diabetes melitus, n
(%) | 14 (16.3) | 15 (21.1) | 19 (22.9) | 0.539 |
| Alcohol habits, n
(%) | 10 (11.6) | 14 (19.7) | 16 (19.3) | 0.293 |
Association of GGT tertiles with
CAD
In comparison to the low GGT level of <22.59 U/l
reference group, the high GGT levels of ≥32.21 U/l (third tertile)
showed an OR of 1.909 (95% CI, 1.036–3.517; P=0.038). Following
adjustment to the GGT-associated risk factors and CAD risk factors,
the OR increased to 2.104 (95% CI, 1.063–4.165; P=0.033), i.e., the
subjects with GGT levels of ≥32.21 U/l had a 2.11-fold higher risk
of premature CAD in comparison to <22.59 U/l. The intermediate
GGT levels (second tertile) group did not show any association with
premature CAD prior and subsequent to adjustment to the
conventional risk factors (Table
IV).
| Table IV.Risk of coronary artery disease
events based on γ-glutamyl transferase (GGT) tertiles. |
Table IV.
Risk of coronary artery disease
events based on γ-glutamyl transferase (GGT) tertiles.
|
| Unadjusted | Adjusted |
|---|
|
|
|
|
|---|
| GGT tertiles | OR (95% CI) | P-value | OR (95% CI) | P-value |
|---|
| Tertile 1 | – | – | – | – |
| Tertile 2 | 1.212
(0.647–2.289) | 0.542 | 1.057
(0.528–2.117) | 0.875 |
| Tertile 3 | 1.909
(1.036–3.517) | 0.038 | 2.104
(1.063–4.165) | 0.033 |
Risk association assessment
The logistic regression model was used to assess the
risk predictive ability of GGT alone and along with lipid,
inflammatory, oxidative stress markers and conventional risk
factors. GGT alone was found to have an OR of 4.94 (95% CI,
1.015–24.095; P=0.048), which improved to 5.208 (95% CI,
1.018–24.624; P=0.048) upon adjusting for the conventional risk
factors. The OR of this model further improved to 5.64 (95% CI,
1.004–31.642; P=0.049) upon addition of lp(a). The above
combination of GGT and lp(a) exhibited a higher odds ratio of 7.492
(95% CI, 1.221–45.979; P=0.030) (Table
V) following adjustment for CRFs.
| Table V.Association of γ-glutamyl transferase
(GGT) levels with coronary artery disease in the presence of lipid,
inflammatory and oxidative stress markers. |
Table V.
Association of γ-glutamyl transferase
(GGT) levels with coronary artery disease in the presence of lipid,
inflammatory and oxidative stress markers.
|
| Unadjusted | Adjusted |
|---|
|
|
|
|
|---|
| Model | OR (95% CI) | P-value | OR (95% CI) | P-value |
|---|
| Lipid and
inflammatory markers |
|
|
|
|
GGT | 4.944
(1.015–24.095) | 0.048 | 5.208
(1.018–24.624) | 0.048 |
|
+Lipoprotein (a) | 5.636
(1.004–31.642) | 0.049 | 7.492
(1.221–45.979) | 0.030 |
|
+Secretory phospholipase
A2 | 4.829
(0.972–23.980) | 0.054 | 5.138
(0.952–27.742) | 0.057 |
|
+Interleukin-6 | 4.445
(0.972–22.011) | 0.068 | 4.691
(0.866–25.339) | 0.073 |
| Oxidative stress
markers |
|
+Myeloperoxidase | 3.485
(1.199–10.128) | 0.022 | 4.555
(0.849–24.443) | 0.077 |
|
+Neopterin | 3.816
(0.746–19.060) | 0.103 | 4.041
(0.741–21.923) | 0.105 |
The addition of MPO to the GGT was significant with
a reduction in the OR of GGT from 4.94 to 3.48; however, the
significance of the model was lost following adjustment with CRFs
(Table V). Other inflammatory and
oxidative stress markers did not add any significant value to the
predictive ability of the GGT.
Discriminative ability of the
model
The C-statistic analysis was performed to assess the
discriminative ability of the models built using logistic
regression (Fig. 1). The
discriminative ability of GGT alone was tested and compared with
the other models. The GGT alone significantly classified the 61.5%
population correctly. However, conventional risk factors used in
the model building exhibited an AUC of 0.647 (95% CI, 0.577–0.717;
P<0.001). The GGT and lp(a) together increased the AUC to 0.654
(95% CI, 0.576–0.732; P<0.001). A combined model of GGT and
lp(a) plus conventional risk factors showed the best performance
with an AUC of 0.711 (95% CI, 0.642–0.799; P<0.001). The
DeLong's test indicated that the improvement of AUC from CRF to
biomarkers [GGT + lp(a)] adjusted to CRFs was significant
(P<0.001). All the models built were tested for best-fit using
the Hosmer-Lemeshow test.
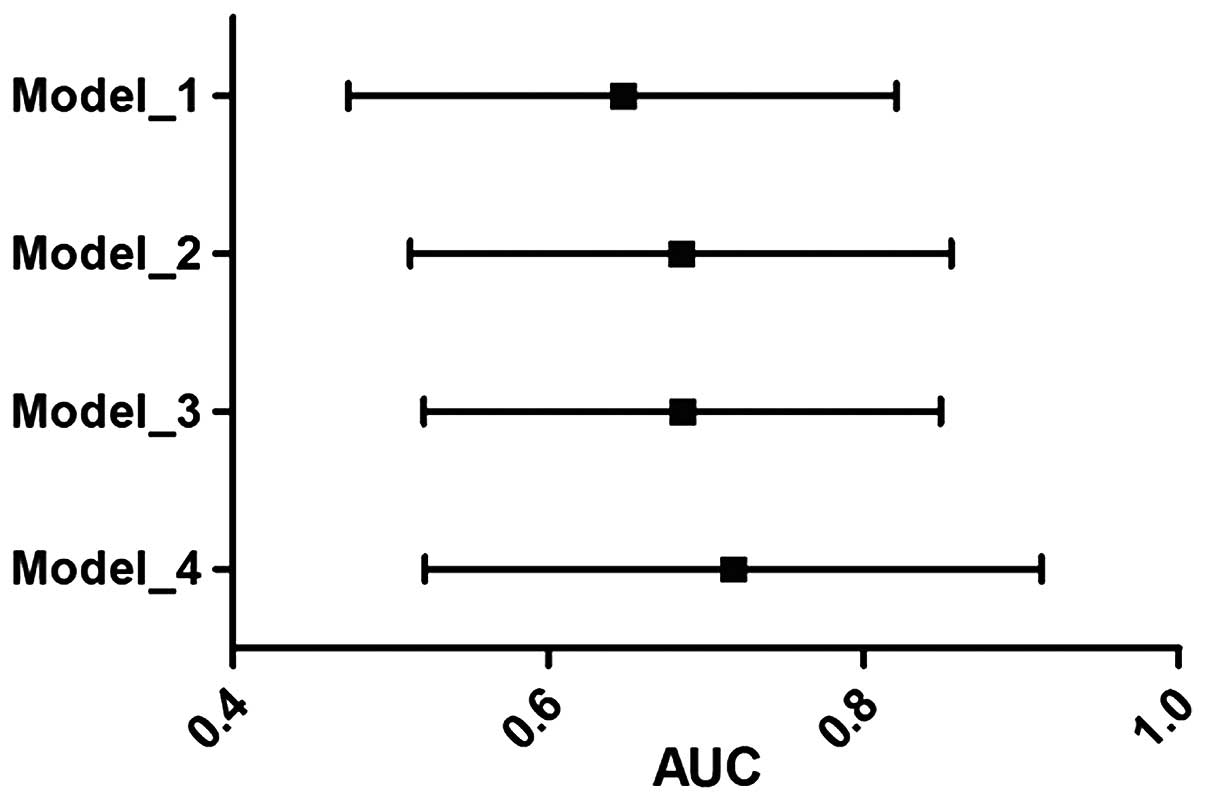 | Figure 1.AUC of four different models with
corresponding confidence intervals. Model 1, GGT alone; model 2,
conventional risk factors (age, gender, smoking, hypertension and
diabetes melitus); model 3, GGT + lp(a); model 4, GGT + lp(a) +
conventional risk factors. AUC, area under the curve; GGT,
γ-glutamyl transferase; lp(a), lipoprotein (a). |
Discussion
The key outcomes of the present study were two-fold.
The first section of the results suggest that increasing GGT levels
were associated with the CAD risk factors, such as smoking,
hyperlipidemia, waist circumference and oxidative stress marker
neopterin, indicating a possible existence of a condition such as
oxidative stress in the subjects. The second section of the results
indicates that higher levels of GGT in the blood are associated
with an increased risk of premature CAD. However, the other major
risk factors, such as diabetes mellitus, hypertension and
dyslipidemia, were not associated with GGT levels but were
significantly associated with the premature CAD. Therefore, we
adjusted the GGT levels with these risk factors and the association
remained significant following adjustment. This suggests that
increased GGT levels could act as an independent factor in the
process of premature CAD development in the Indian population.
Previously a number of studies have shown the
association of increased GGT levels with CAD risk factors and CAD
development (11–14); however, to best of our knowledge there
are no studies showing the association of increased GGT levels with
premature CAD in the Indian population. In the present study, a
pilot investigation was performed to show this possible association
between premature CAD and GGT levels. The findings indicate that
young subjects in the highest tertile have a 2.1-fold higher risk
with respect to reference tertile (Table
IV) and a unit increase of GGT levels (on a log scale)
increases the risk of premature CAD by 5-fold, which increased to
7-fold in the presence of higher lp(a) levels (Table V).
The results of the present study indicate the
association of GGT levels with premature CAD, which was independent
of alcohol habits. However, the correlation between GGT, smoking,
triglycerides, waist circumference and neopterin levels indicates a
potential mechanism in the development of the disease. Experimental
evidence suggests that GGT, by regulating intracellular
glutathione, acts as an antioxidant (15,16). Whereas
GGT has been shown to have a prooxidant role by producing reactive
oxygen species in the presence of transition metal ions (such as
iron) (17–19), which can lead to endothelial
dysfunction. However, this increased deposition of iron could be
due to smoking and may contribute to the endothelial dysfunction
(20). In addition, our previous study
also revealed reduced adiponectin levels in CAD subjects (21). Kozakova et al (22) reported the importance of GGT linking
fatty liver condition and atherosclerosis potentially by regulating
the adiponectin level. In accordance with these findings, the
present data suggests that in a fatty liver condition, higher GGT
levels may indicate the migration of aortic SMC into the intimal
layer, and hence, inducing the atherosclerotic condition. In
conclusion, elevated plasma GGT levels may indicate an increased
risk of developing premature CAD.
There were strengths and limitations of the present
study. The present study was carried out on a relatively small
sample size, and requires further validation on larger subjects.
However, this preliminary data revealed GGT as one of the risk
factors and biomarkers in premature CAD subjects. GGT is a low cost
and readily available assay, thus, validating in a larger cohort
and translating the findings into clinical practice would be
comparatively easy.
Acknowledgements
The authors are grateful for the support of the
funding agencies: Department of Biotechnology, Ministry of Science
and Technology, Government of India (grant no. BT/01/CDE/08/07),
the Tata Social Welfare Trust, India (grant no.
TSWT/IG/SNB/JP/Sdm), Garfield Weston Foundation, UK, Foundation
Bay, UK and Bharati Foundation, India. The authors thank all the
investigators, staff, and administrative teams and participants of
IARS from Narayana Hrudayalaya, Bangalore and Asian Heart Centre
(Mumbai) for their contribution. The authors are grateful to the
patients and their family members for participating in the
study.
References
|
1
|
Kanjilal S, Rao VS, Mukherjee M, Natesha
BK, Renuka KS, Sibi K, Iyengar SS and Kakkar VV: Application of
cardiovascular disease risk prediction models and the relevance of
novel biomarkers to risk stratification in Asian Indians. Vasc
Health Risk Manag. 4:199–211. 2008. View Article : Google Scholar : PubMed/NCBI
|
|
2
|
Mathers CD and Loncar D: Projections of
global mortality and burden of disease from 2002 to 2030. PLoS Med.
3:e4422006. View Article : Google Scholar : PubMed/NCBI
|
|
3
|
Greenland P, Knoll MD, Stamler J, Neaton
JD, Dyer AR, Garside DB and Wilson PW: Major risk factors as
antecedents of fatal and nonfatal coronary heart disease events.
JAMA. 290:891–897. 2003. View Article : Google Scholar : PubMed/NCBI
|
|
4
|
Khot UN, Khot MB, Bajzer CT, Sapp SK,
Ohman EM, Brener SJ, Ellis SG, Lincoff AM and Topol EJ: Prevalence
of conventional risk factors in patients with coronary heart
disease. JAMA. 290:898–904. 2003. View Article : Google Scholar : PubMed/NCBI
|
|
5
|
Goyal A and Yusuf S: The burden of
cardiovascular disease in the Indian subcontinent. Indian J Med
Res. 124:235–244. 2006.PubMed/NCBI
|
|
6
|
Sharma M and Ganguly NK: Premature
coronary artery disease in Indians and its associated risk factors.
Vasc Health Risk Manag. 1:217–225. 2005.PubMed/NCBI
|
|
7
|
Atar AI, Yilmaz OC, Akin K, Selcoki Y, Er
O and Eryonucu B: Association between gamma-glutamyltransferase and
coronary artery calcification. Int J Cardiol. 167:1264–1267. 2013.
View Article : Google Scholar : PubMed/NCBI
|
|
8
|
Poelzl G, Eberl C, Achrainer H, Doerler J,
Pachinger O, Frick M and Ulmer H: Prevalence and prognostic
significance of elevated gamma-glutamyltransferase in chronic heart
failure. Circ Heart Fail. 2:294–302. 2009. View Article : Google Scholar : PubMed/NCBI
|
|
9
|
Paolicchi A, Emdin M, Ghliozeni E, Ciancia
E, Passino C, Popoff G and Pompella A: Images in cardiovascular
medicine. Human atherosclerotic plaques contain gamma-glutamyl
transpeptidase enzyme activity. Circulation. 109:14402004.
View Article : Google Scholar : PubMed/NCBI
|
|
10
|
Shanker J, Maitra A, Rao VS, Mundkur L,
Dhanalakshmi B, Hebbagodi S and Kakkar VV: Rationale, design &
preliminary findings of the Indian atherosclerosis research study.
Indian Heart J. 62:286–295. 2010.PubMed/NCBI
|
|
11
|
Dhingra R, Gona P, Wang TJ, Fox CS,
D'Agostino RB Sr and Vasan RS: Serum gamma-glutamyl transferase and
risk of heart failure in the community. Arterioscler Thromb Vasc
Biol. 30:1855–1860. 2010. View Article : Google Scholar : PubMed/NCBI
|
|
12
|
Emdin M, Passino C, Michelassi C, Donato
L, Pompella A and Paolicchi A: Additive prognostic value of
gamma-glutamyltransferase in coronary artery disease. Int J
Cardiol. 136:80–85. 2009. View Article : Google Scholar : PubMed/NCBI
|
|
13
|
Ruttmann E, Brant LJ, Concin H, Diem G,
Rapp K and Ulmer H: Vorarlberg Health Monitoring and Promotion
Program Study Group: Gamma-glutamyltransferase as a risk factor for
cardiovascular disease mortality: An epidemiological investigation
in a cohort of 163,944 Austrian adults. Circulation. 112:2130–2137.
2005. View Article : Google Scholar : PubMed/NCBI
|
|
14
|
Wannamethee G, Ebrahim S and Shaper AG:
Gamma-glutamyltransferase: Determinants and association with
mortality from ischemic heart disease and all causes. Am J
Epidemiol. 142:699–708. 1995.PubMed/NCBI
|
|
15
|
Karp DR, Shimooku K and Lipsky PE:
Expression of gamma-glutamyl transpeptidase protects ramos B cells
from oxidation-induced cell death. J Biol Chem. 276:3798–3804.
2001. View Article : Google Scholar : PubMed/NCBI
|
|
16
|
Takahashi Y, Oakes SM, Williams MC,
Takahashi S, Miura T and Joyce-Brady M: Nitrogen dioxide exposure
activates gamma-glutamyl transferase gene expression in rat lung.
Toxicol Appl Pharmacol. 143:388–396. 1997. View Article : Google Scholar : PubMed/NCBI
|
|
17
|
Paolicchi A, Tongiani R, Tonarelli P,
Comporti M and Pompella A: gamma-Glutamyl transpeptidase-dependent
lipid peroxidation in isolated hepatocytes and HepG2 hepatoma
cells. Free Radic Biol Med. 22:853–860. 1997. View Article : Google Scholar : PubMed/NCBI
|
|
18
|
Stark AA: Oxidative metabolism of
glutathione by gamma-glutamyl transpeptidase and peroxisome
proliferation: The relevance to hepatocarcinogenesis. A hypothesis.
Mutagenesis. 6:241–245. 1991. View Article : Google Scholar : PubMed/NCBI
|
|
19
|
Stark AA, Russell JJ, Langenbach R, Pagano
DA, Zeiger E and Huberman E: Localization of oxidative damage by a
glutathione-gamma-glutamyl transpeptidase system in preneoplastic
lesions in sections of livers from carcinogen-treated rats.
Carcinogenesis. 15:343–348. 1994. View Article : Google Scholar : PubMed/NCBI
|
|
20
|
Fukami K, Yamagishi S, Iida S, Matsuoka H
and Okuda S: Involvement of iron-evoked oxidative stress in
smoking-related endothelial dysfunction in healthy young men. PLoS
One. 9:e894332014. View Article : Google Scholar : PubMed/NCBI
|
|
21
|
Shanker J, Rao VS, Ravindran V,
Dhanalakshmi B, Hebbagodi S and Kakkar VV: Relationship of
adiponectin and leptin to coronary artery disease, classical
cardiovascular risk factors and atherothrombotic biomarkers in the
IARS cohort. Thromb Haemost. 108:769–780. 2012. View Article : Google Scholar : PubMed/NCBI
|
|
22
|
Kozakova M, Palombo C, Eng MP, Dekker J,
Flyvbjerg A, Mitrakou A, Gastaldelli A and Ferrannini E: RISC
Investigators: Fatty liver index, gamma-glutamyltransferase and
early carotid plaques. Hepatology. 55:1406–1415. 2012. View Article : Google Scholar : PubMed/NCBI
|


