Introduction
Chronic kidney disease (CKD) is associated with
various cardiovascular diseases and increased healthcare costs
(1). The glomerular filtration rate
(GFR) diminishes with age by 0.6 to 1.1 ml/min/year, and the
estimated prevalence of CKD is ~13% in the general population in
Japan (2). In addition, epidemiologic
studies reported that development of CKD leads to progression of
atherosclerosis even during the initial stage (3,4).
Diabetes mellitus (DM) is an established risk factor
for the development of CKD (5). A
large cohort study reported a strong association between fasting
plasma glucose (FPG) level and renal function even in subjects
without DM (6). Furthermore,
hypertension and/or dyslipidemia frequently coexist with CKD, which
are often associated with marked renal impairment (7,8). Given that
risk factor clustering is a strong predictor of future progression
of renal dysfunction, it is important to select appropriate
therapeutic strategies that take into consideration risk
stratification and control of multiple risk profiles. However, the
temporal association between the above-mentioned risk factors and
renal function with aging remains unclear in Japanese patients. The
present large-scale longitudinal study was designed to clarify the
association of renal dysfunction with a multitude of
clinicopathological parameters and conditions, and to define
age-associated changes in these parameters in the general
population.
Materials and methods
Study subjects
A total of 6,027 community-dwelling individuals were
recruited to the Inabe Health and Longevity Study: A longitudinal
epidemiological study of atherosclerosis, and cardiovascular and
metabolic diseases (9–12). The subjects were recruited from among
individuals who visited the health care center of Inabe General
Hospital (Inabe, Japan) for their annual health checkup, and who
were followed up annually. For all participants registered between
March 2010 and September 2012, clinical examination data obtained
from April 2003 to March 2014 (11 years) were entered into a
database. For individuals with two or more medical checkups per
year, data from one time point for each year were entered, so that
each subject had one set of health data for each year they had
attended the clinic. In general, the study participants had
undergone one to 11 clinical examinations, and the mean follow-up
period was 5 years.
The study protocol was complied according to the
Declaration of Helsinki and was approved by the Committees on the
Ethics of Human Research of Mie University Graduate School of
Medicine (Tsu, Japan) and Inabe General Hospital. Written informed
consent was obtained from each subject.
Definition of clinical conditions
The estimated GFR (eGFR) was calculated using a
simplified equation derived from that in the Modification of Diet
in Renal Disease Study and proposed by the Japanese Society of
Nephrology: eGFR (ml/min/1.73 m2)=194 × [age
(years)]−0.287 × [serum creatinine
(mg/dl)]−1.094 × [0.739 for females] (13). Low eGFR represented values <60
ml/min/1.73 m2, based on the National Kidney
Foundation-Kidney Disease Outcomes Quality Initiative (1). Thus, 592 subjects were diagnosed with low
eGFR. The eGFR of the control subjects (n=4,928) was ≥60
ml/min/1.73 m2. Subjects with hypertension either had a
systolic blood pressure (BP) ≥140 mmHg or diastolic BP ≥90 mmHg (or
both) or were currently on antihypertensive medication. DM was
defined as either FPG ≥6.93 mmol/l or blood hemoglobin A1c content
≥47.5 mmol/mol or current use of glucose-lowering agents.
Hypertriglyceridemia was defined as either serum triglyceride
concentration ≥1.65 mmol/l or use of antidyslipidemic medications
for hypertriglyceridemia. Hypo-high-density lipoprotein (HDL)
cholesterolemia was defined as serum HDL-cholesterol concentration
<1.04 mmol/l. Hyper-low-density lipoprotein (LDL)
cholesterolemia was defined as either serum LDL-cholesterol
concentration ≥3.64 mmol/l or current treatment with
antidyslipidemic agents for hyper-LDL-cholesterolemia.
Hyperuricemia was defined as serum concentration of uric acid
>416 µmol/l or current treatment with uric acid-lowering
medication. Obesity was defined as body mass index (BMI) ≥25
kg/m2 and BMI of <25 kg/m2 for the control
individuals, based on the BMI criteria of obesity for Japanese and
Asian populations (14).
Statistical analysis
Categorical data were compared between two groups
using the χ2 test. The distribution of continuous
variables was examined by Shapiro-Wilk test. Comparison between two
groups was conducted using the unpaired Student's t-test (for
variables with normal distribution) or by Mann-Whitney U test (for
variables with skewed distribution). The association between eGFR
and various clinical parameters and conditions was examined based
on a 5-year longitudinal cohort study. Longitudinal changes in
clinical parameters were analyzed with a generalized linear
mixed-effect model (15) after
adjustment for age and gender. Correlations of quantitative data
were examined by simple regression analysis with fitting to a
straight line or quadratic curve. Longitudinal changes in the
prevalence of hypertension, type 2 DM, hypertriglyceridemia,
hypo-HDL-cholesterolemia, hyper-LDL-cholesterolemia, hyperuricemia
and obesity were analyzed with the generalized estimating equation
(16) after adjustment for age and
gender. Subjects with eGFR <40 or >100 ml/min/1.73
m2 were excluded from analysis, as the number of such
subjects was small (40 with eGFR <40 ml/min/1.73 m2;
408 with eGFR >100 ml/min/1.73 m2). Age-associated
changes in the prevalence of hypertension, type 2 DM,
hypertriglyceridemia, hypo-HDL-cholesterolemia,
hyper-LDL-cholesterolemia, hyperuricemia and obesity were compared
between subjects with low eGFR and the control subjects using a
generalized estimating equation. To compensate for multiple
comparisons of variables, Bonferroni's correction was applied for
statistical significance of association. The significance levels
were therefore as follows: P<0.0023 (0.05/22 tests) in Table I; P<0.0017 (0.05/30 tests) in
Table II; P<0.0024 (0.05/21 tests)
in Table III; P<0.0025 (0.05/20
tests) in Table IV; and P<0.0036
(0.05/14 tests) in Table V.
Statistical analysis was performed using the R software version
3.2.1 (the R Project for Statistical Computing; http://ww1.rproject.org/) and JMP version 5.1 software
(SAS Institute, Inc., Cary, NC, USA).
 | Table I.Characteristics of study subjects:
Cross-sectional analysis in March 2014. |
Table I.
Characteristics of study subjects:
Cross-sectional analysis in March 2014.
| Parameter | All, n=5520 | Low eGFR,
n=592 | Control,
n=4928 | P-value |
|---|
| Age (years) |
54.1±12.8 |
66.4±9.3 |
52.8±12.4 |
<0.0001 |
| Male (%) | 55.3 | 64.2 | 55.1 |
<0.0001 |
| Body mass index
(kg/m2) |
23.0±3.4 |
23.6±3.2 |
22.9±3.4 |
<0.0001 |
| Current or former
smoker (%) | 46.6 | 43.4 | 47.0 |
0.0980 |
| Systolic BP
(mmHg) |
120.8±16.0 |
125.2±16.1 |
120.3±15.8 |
<0.0001 |
| Diastolic BP
(mmHg) |
74.9±12.1 |
76.0±12.0 |
74.7±12.1 | 0.0060 |
| Mean BP (mmHg) |
90.2±12.5 |
92.4±12.2 |
90.0±12.5 |
<0.0001 |
| Serum triglycerides
(mmol/l) |
1.3±0.9 |
1.3±0.7 |
1.3±0.9 |
<0.0001 |
| Serum
HDL-cholesterol (mmol/l) |
1.7±0.5 |
1.6±0.5 |
1.7±0.5 |
<0.0001 |
| Serum
LDL-cholesterol (mmol/l) |
3.2±0.8 |
3.1±0.8 |
3.2±0.8 |
0.0610 |
| Fasting plasma
glucose (mmol/l) |
5.6±1.1 |
5.7±1.2 |
5.5±1.1 |
<0.0001 |
| Blood hemoglobin
A1c (mmol/mol) |
38.6±7.2 |
40.4±6.5 |
38.4±7.3 |
<0.0001 |
| Blood urea nitrogen
(mmol/l) |
5.2±2.0 |
6.9±3.6 |
4.9±1.2 |
<0.0001 |
| Serum creatinine
(µmol/l) |
66.8±15.7 |
90.7±19.6 |
63.9±13.1 |
<0.0001 |
| eGFR (ml/min/1.73
m2) |
77.4±15.3 |
52.7±6.8 |
80.3±13.2 |
<0.0001 |
| Serum uric acid
(µmol/l) |
325.2±85.0 |
370.0±89.6 |
319.8±82.7 |
<0.0001 |
| Serum C-reactive
protein (µg/l) |
970.0±3476.4 |
1185.4±3263.3 |
949.6±3496.0 |
0.3496 |
| White blood cells
(103/µl) |
5.4±1.6 |
5.4±1.6 |
5.4±1.6 |
0.8500 |
| Red blood cells
(104/µl) |
437.0±43.6 |
421.7±49.1 |
438.5±42.8 |
0.8500 |
| Hemoglobin
(g/l) |
138.1±15.0 |
135.2±16.8 |
138.4±14.9 |
<0.0001 |
| Hematocrit (%) |
40.3±4.2 |
39.5±4.5 |
40.4±4.1 |
<0.0001 |
| Platelet counts
(104/µl) |
22.4±5.3 |
20.6±5.2 |
22.5±5.4 |
<0.0001 |
| Table II.Longitudinal analysis of the
associations between eGFR and clinical parameters using the
generalized linear mixed-effect model with adjustments for age and
gender. |
Table II.
Longitudinal analysis of the
associations between eGFR and clinical parameters using the
generalized linear mixed-effect model with adjustments for age and
gender.
| Parameter | All | Low eGFR | Control |
|---|
| Systolic BP | 0.0780 | 0.5370 | 0.6650 |
| Diastolic BP | 0.6800 | 0.4500 | 0.0110 |
| Mean BP | 0.3000 | 0.4600 | 0.0024 |
| Serum
triglycerides | 0.0014 | 0.5200 | 0.1900 |
| Serum
HDL-cholesterol |
5.1×10⁻⁵ |
1.6×10⁻⁵ | 0.8400 |
| Serum
LDL-cholesterol |
1.7×10⁻¹¹ | 1.0000 | 0.5405 |
| Blood hemoglobin
A1c |
1.8×10⁻⁶ | 0.5791 | 0.2410 |
| Fasting plasma
glucose |
4.2×10⁻⁷ | 0.0035 | 0.0367 |
| Serum uric
acid |
<2.0×10⁻¹⁶ | 0.5600 |
<2.0×10⁻¹⁶ |
| Body mass
index |
1.3×10⁻¹⁰ | 0.5600 |
2.0×10⁻¹⁵ |
| Table III.Longitudinal analysis of the
associations between eGFR and clinical conditions using the
generalized estimating equation with adjustments for age and
gender. |
Table III.
Longitudinal analysis of the
associations between eGFR and clinical conditions using the
generalized estimating equation with adjustments for age and
gender.
| Parameter | All | Low eGFR | Control |
|---|
| Hypertension | 0.0006 |
5.1×10⁻¹² | 0.1413 |
| Type 2 diabetes
mellitus |
<2.0×10⁻¹⁶ |
1.6×10⁻¹¹ |
<2.0×10⁻¹⁶ |
|
Hypertriglyceridemia | 0.1800 |
5.2×10⁻⁷ | 0.2290 |
|
Hypo-HDL-cholesterolemia |
<2.0×10⁻¹⁶ | 0.0034 | 0.0025 |
|
Hyper-LDL-cholesterolemia | 0.0182 | 0.0912 |
2.8×10⁻¹² |
| Hyperuricemia |
<2.0×10⁻¹⁶ |
<2.0×10⁻¹⁶ |
<2.0×10⁻¹⁶ |
| Obesity |
5.5×10⁻¹⁰ | 0.5065 |
<2.0×10⁻¹⁶ |
| Table IV.Longitudinal analysis of the
associations between clinical parameters and age using the
generalized linear mixed-effect model with adjustment for
gender. |
Table IV.
Longitudinal analysis of the
associations between clinical parameters and age using the
generalized linear mixed-effect model with adjustment for
gender.
| Parameter | Low eGFR | Control |
|---|
| Systolic BP | 0.0097 |
<2.0×10⁻¹⁶ |
| Diastolic BP |
1.6×10⁻⁸ |
<2.0×10⁻¹⁶ |
| Mean BP |
1.7×10⁻⁶ |
<2.0×10⁻¹⁶ |
| Serum
triglycerides | 0.1760 |
<2.0×10⁻¹⁶ |
| Serum
HDL-cholesterol | 0.2200 | 0.0002 |
| Serum
LDL-cholesterol | 0.4100 |
<2.0×10⁻¹⁶ |
| Blood hemoglobin
A1c |
2.8×10⁻⁹ |
<2.0×10⁻¹⁶ |
| Fasting plasma
glucose | 0.0420 |
<2.0×10⁻¹⁶ |
| Serum uric
acid | 0.2100 |
9.2×10⁻⁸ |
| Body mass
index | 0.0004 |
<2.0×10⁻¹⁶ |
| Table V.Longitudinal analysis of the
associations between clinical conditions and age using the
generalized estimating equation with adjustment for gender. |
Table V.
Longitudinal analysis of the
associations between clinical conditions and age using the
generalized estimating equation with adjustment for gender.
| Parameter | Low eGFR | Control |
|---|
| Hypertension | 0.0350 |
<2.0×10⁻¹⁶ |
| Type 2 diabetes
mellitus | 0.9300 | 0.7600 |
|
Hypertriglyceridemia | 0.0760 |
<2.0×10⁻¹⁶ |
|
Hypo-HDL-cholesterolemia | 0.8140 | 0.0068 |
|
Hyper-LDL-cholesterolemia | 0.0126 | 0.8400 |
| Hyperuricemia | 0.5600 | 0.0032 |
| Obesity | 0.7630 | 0.2400 |
Results
Patient characteristics
The baseline characteristics of the study subjects
are presented in Table I. The
prevalence of low eGFR was 10.7% (men, 12.3%; women, 8.7%). In
subjects with low eGFR, age, proportion of men, BMI, systolic and
mean BP, serum concentrations of triglycerides, uric acid, blood
urea nitrogen, and creatinine, FPG level, and blood hemoglobin A1c
content were significantly increased (P<0.0023) when compared
with the control subjects. Whereas serum concentration of
HDL-cholesterol, and blood hemoglobin, hematocrit, and platelet
count were lower in subjects with low eGFR versus the control
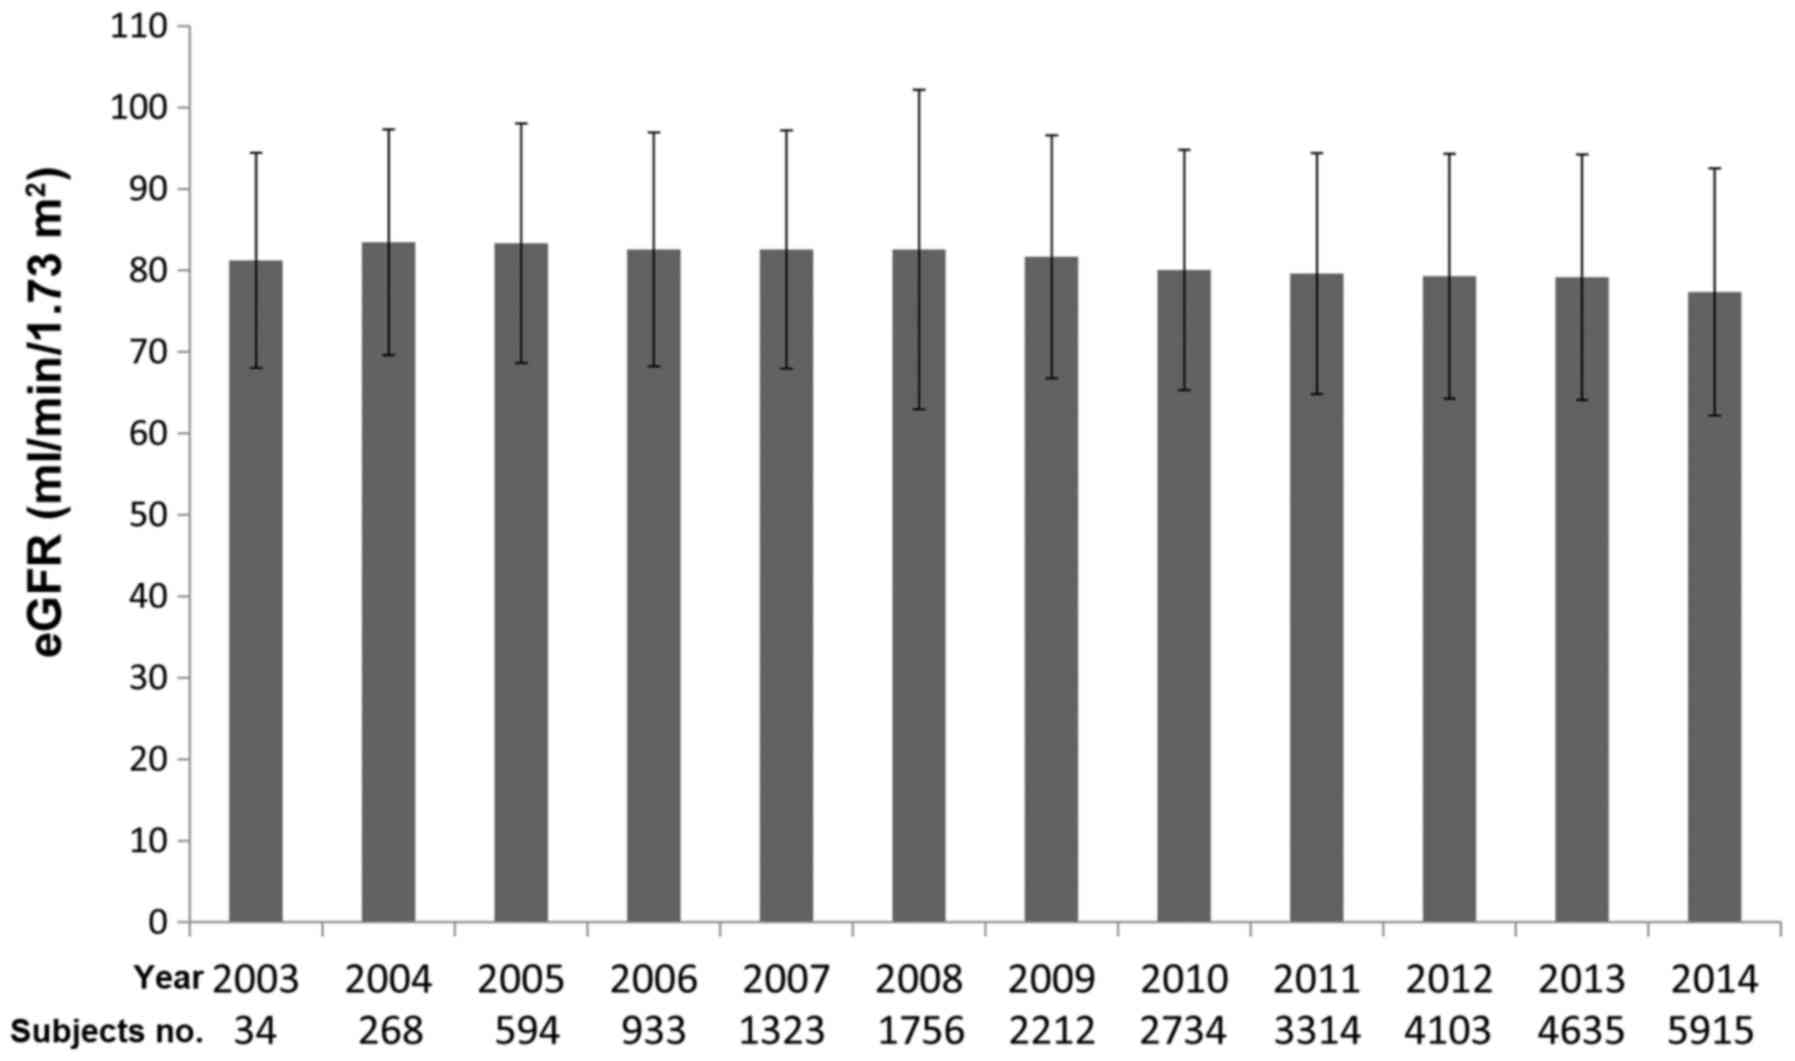
subjects. Since the recruitment period and follow-up period were
different among subjects, it was difficult to evaluate the initial
eGFR on the inclusion point. Therefore, we calculated the mean eGFR
at each year (Fig. 1). No differences
were identified between the mean eGFR among years examined
(P=0.4433, one-way analysis of variance).
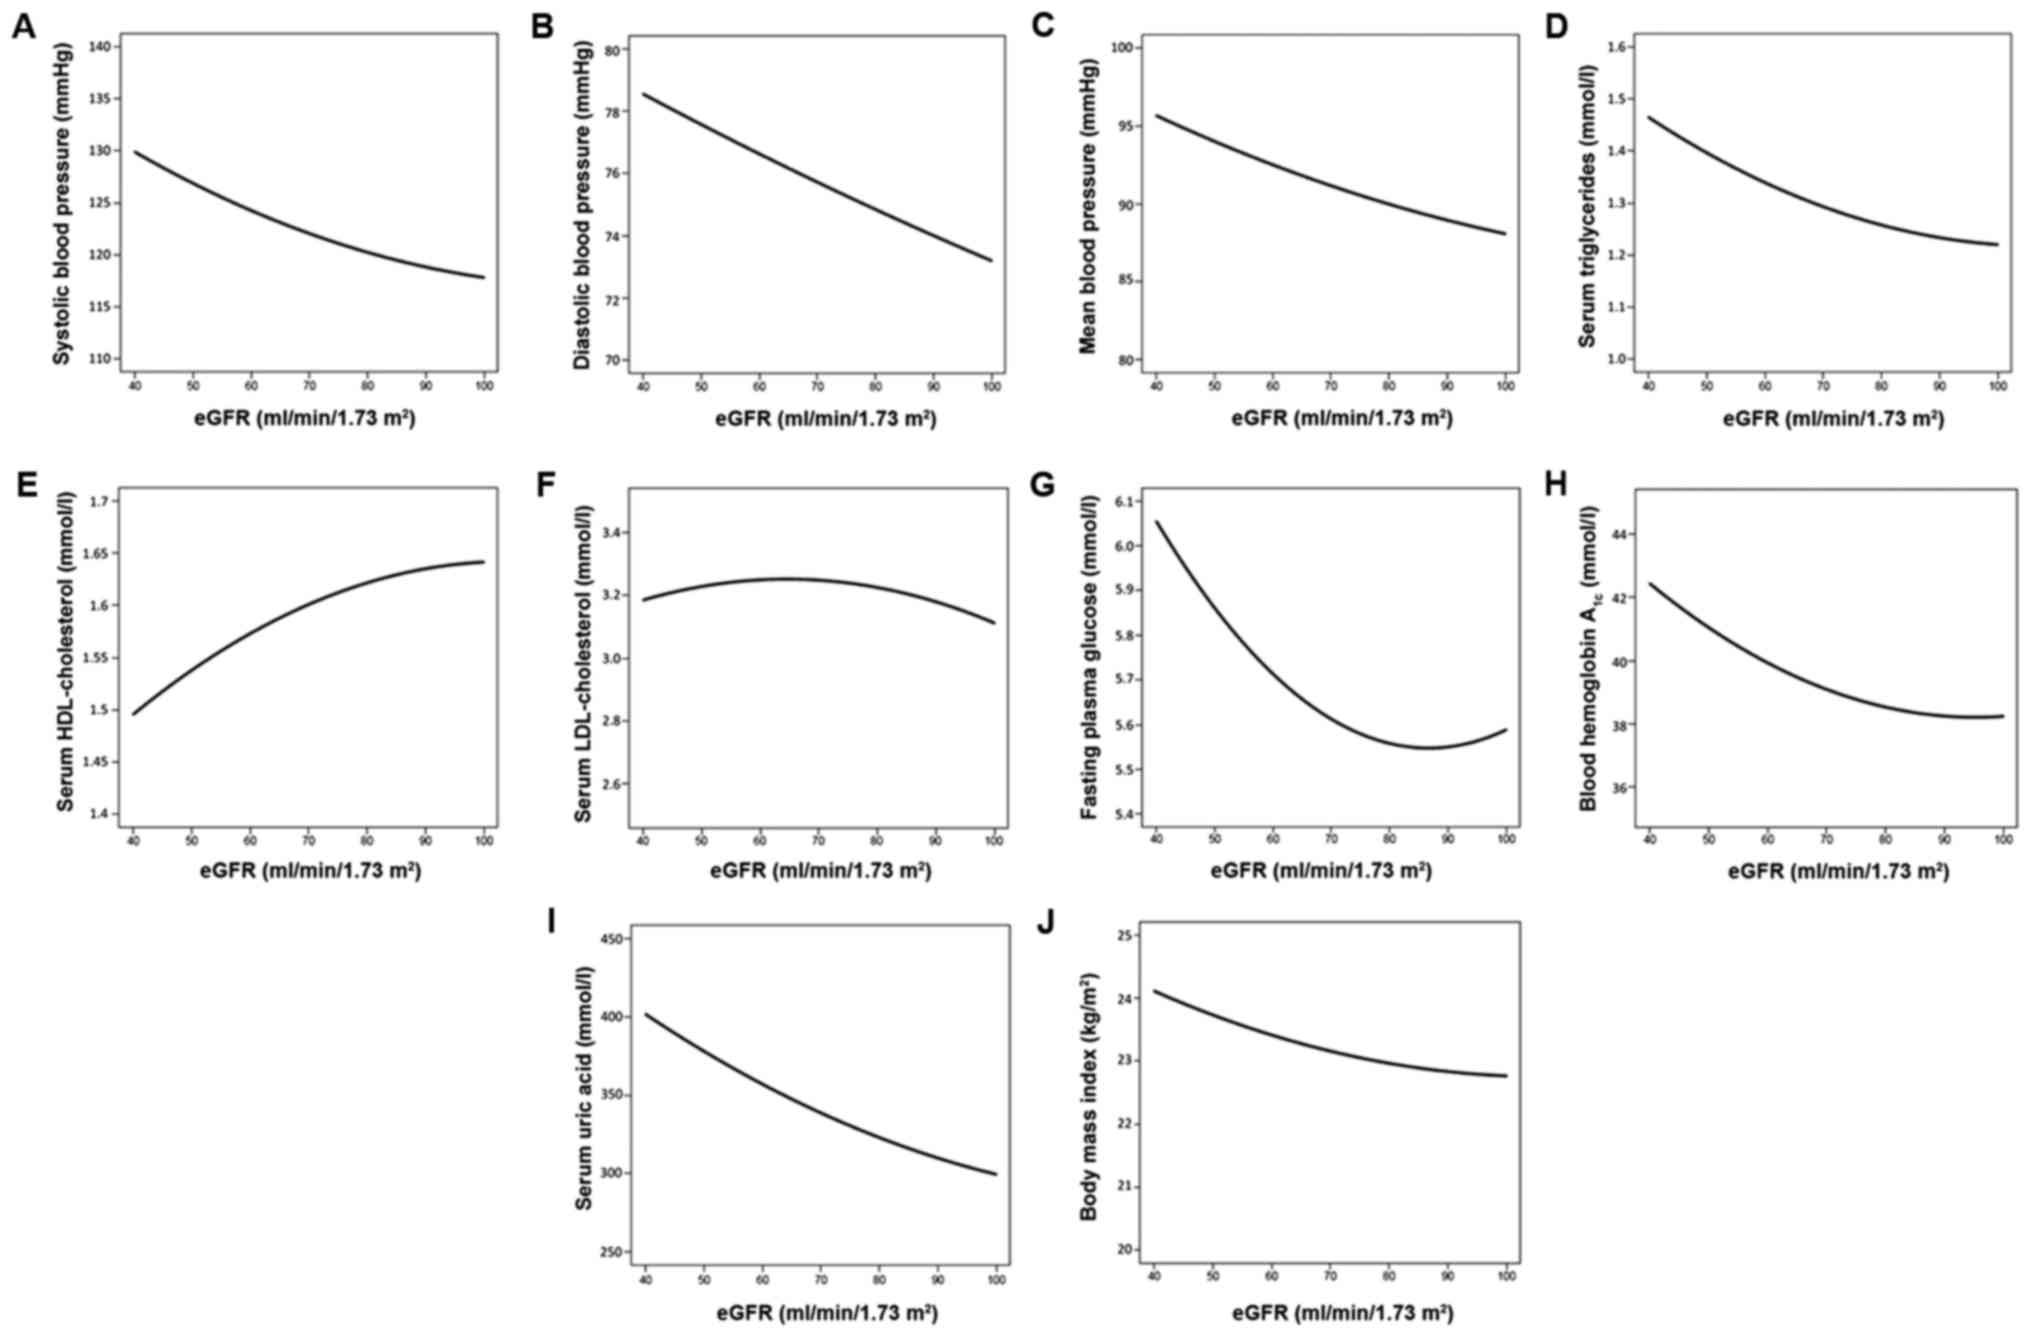
Longitudinal analysis of the
associations between eGFR and clinical parameters
After adjustments for age and gender, longitudinal
analysis using the generalized linear mixed-effect model showed a
significant association (P<0.0017) between eGFR and serum
concentrations of triglycerides, HDL-cholesterol, LDL-cholesterol
and uric acid, blood hemoglobin A1c content, FPG level and BMI
using data from all subjects. Similar analysis indicated that eGFR
was significantly associated with serum concentrations of
HDL-cholesterol in subjects with low eGFR, and to serum
concentrations of uric acid and BMI in the control group (Table II). Systolic (Fig. 2A), diastolic (Fig. 2B), and mean BP (Fig. 2C), serum concentrations of
triglycerides (Fig. 2D) and uric acid
(Fig. 2I), FPG level (Fig. 2G), blood hemoglobin A1c content
(Fig. 2H) and BMI (Fig. 2J) decreased curvilinearly. However, the
serum concentrations of HDL-cholesterol (Fig. 2E) increased as eGFR increased. Serum
concentrations of LDL-cholesterol (Fig.
2F) reduced slightly with increases in eGFR.
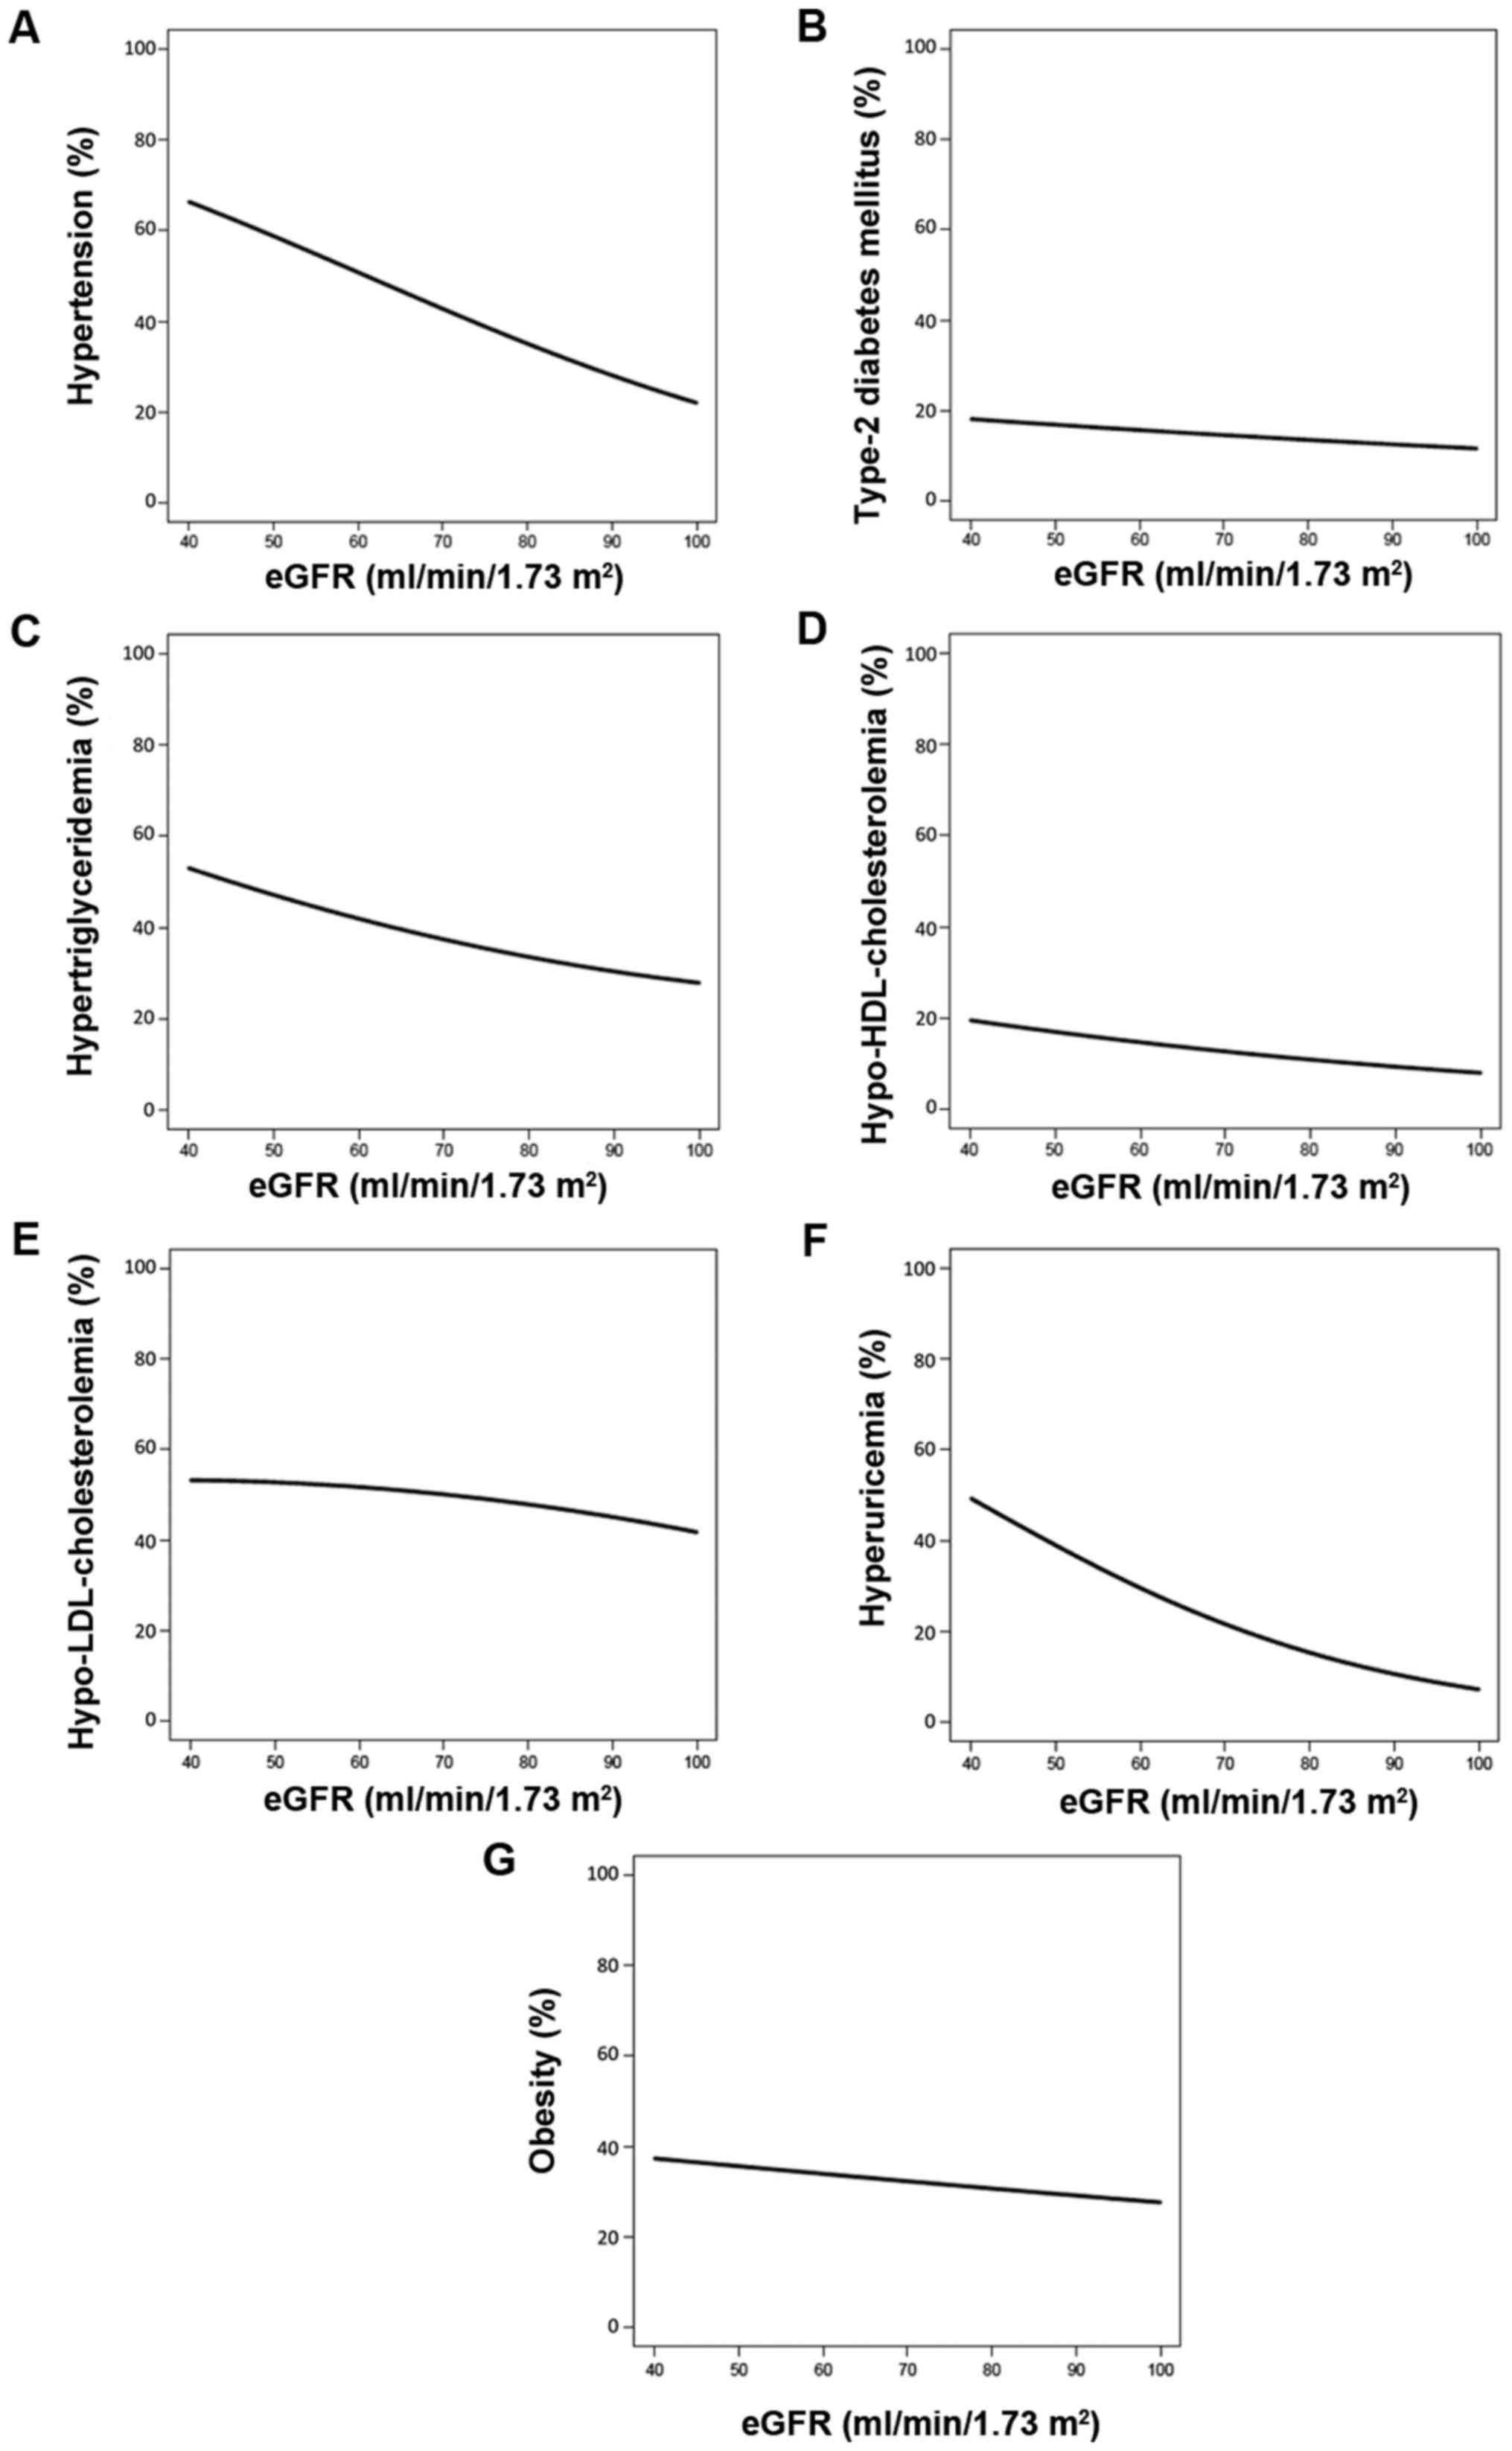
Longitudinal analysis with the generalized
estimating equation following adjustment for age and gender
demonstrated a significant association (P<0.0024) between eGFR
and the prevalence of hypertension, type 2 DM,
hypo-HDL-cholesterolemia, hyperuricemia and obesity based on
analysis of data from all subjects. Similar analysis demonstrated a
significant association between eGFR and prevalence of
hypertension, type 2 DM, hypertriglyceridemia and hyperuricemia in
subjects with low eGFR, and with type 2 DM,
hyper-LDL-cholesterolemia, hyperuricemia and obesity in the control
group (Table III).
The prevalence of hypertension (Fig. 3A), hypertriglyceridemia (Fig. 3C) and hyperuricemia (Fig. 3F) decreased as eGFR increased. The
prevalence of type 2 DM (Fig. 3B),
hypo-HDL-cholesterolemia (Fig. 3D),
hyper-LDL-cholesterolemia (Fig. 3E),
and obesity (Fig. 3G) demonstrated
slight decreases as eGFR increased.
Longitudinal analysis of the
associations between clinical parameters and age
Longitudinal analysis was then performed for the
associations between various clinical parameters and age in
subjects with low eGFR and the control subjects using the
generalized linear mixed-effect model (Table IV). The analysis showed significant
association of diastolic and mean BP, blood hemoglobin A1c content,
and BMI (P<0.0025) with age among the subjects with low eGFR. In
the control group, systolic and mean BP, blood hemoglobin A1c
content, and FPG level were correlated positively with age.
Conversely, diastolic BP, serum concentrations of triglycerides,
HDL- and LDL-cholesterol, uric acid and BMI were negatively
correlated with age.
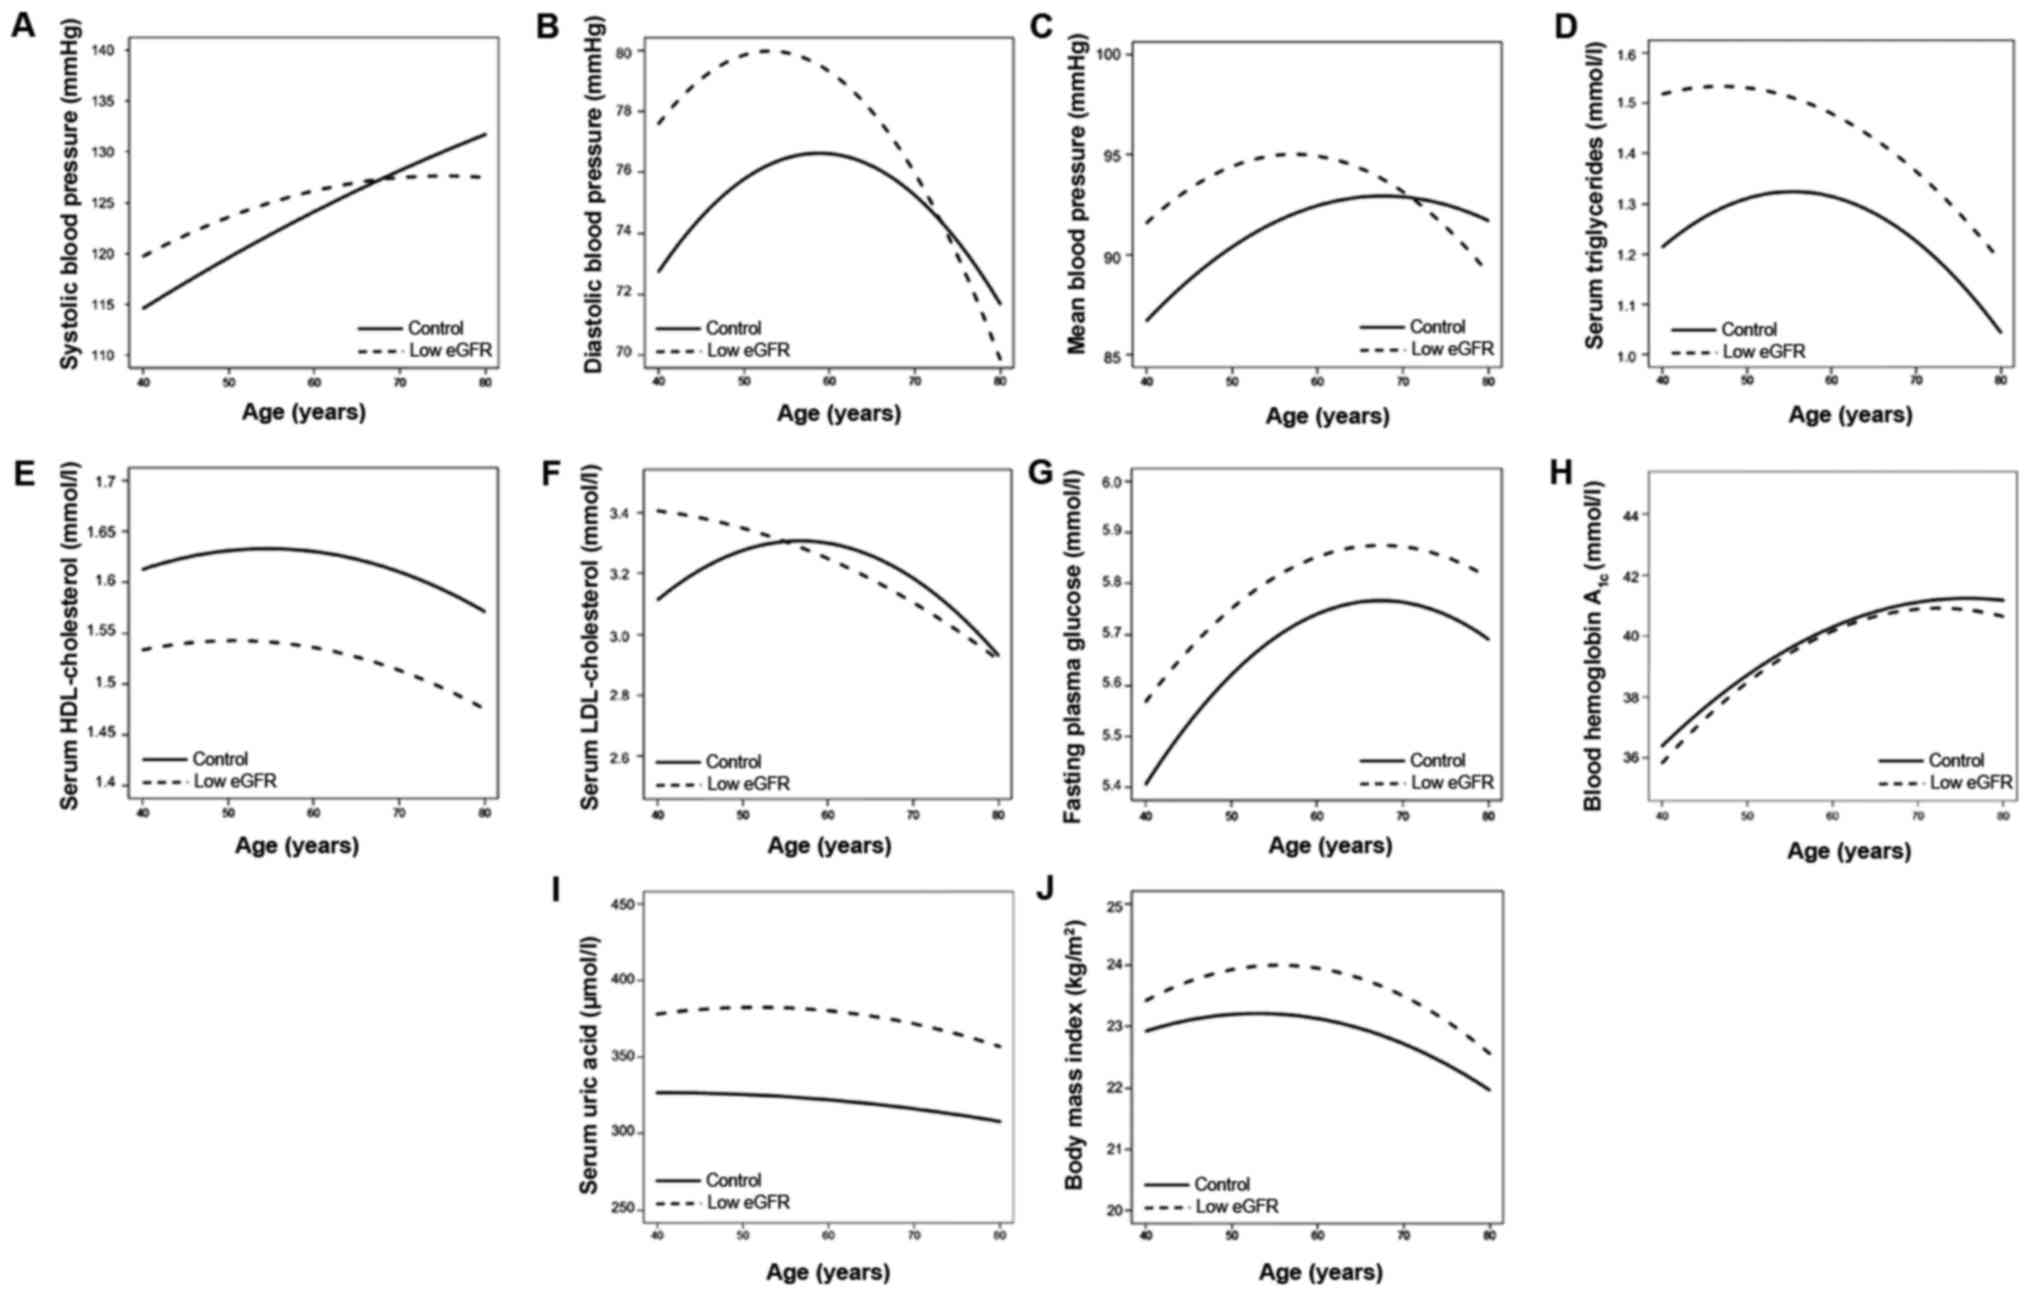
Fig. 4 demonstrates
age-associated changes in various clinical parameters. Systolic BP
increased with age in the two groups (Fig.
4A). Diastolic BP increased with age, up to ~50 and 60 years of
age, in the subjects with low eGFR and the control subjects,
respectively and decreased thereafter (Fig. 4B). Mean BP increased with age up to ~60
years and ~70 years in the subjects with low eGFR and the control
subjects, respectively and decreased thereafter (Fig. 4C). Serum concentrations of
triglycerides (Fig. 4D) and
LDL-cholesterol (Fig. 4F) increased
with age with a peak at 60 years and decreased thereafter in the
control, while they decreased consistently with age in subjects
with low eGFR. Serum concentrations of HDL-cholesterol slightly
increased with age up to ~50 years and ~60 years in the low eGFR
group and the control subjects, respectively and decreased
thereafter (Fig. 4E). FPG level
(Fig. 4G) and blood hemoglobin A1c
content (Fig. 4H) increased with age,
with a peak at 70 years and decreased thereafter in subjects with
low eGFR and in the control subjects. Uric acid decreased gradually
with age (Fig. 4I), while BMI
increased with age with a peak at 60 years and decreased
thereafter, in the two groups (Fig.
4J).
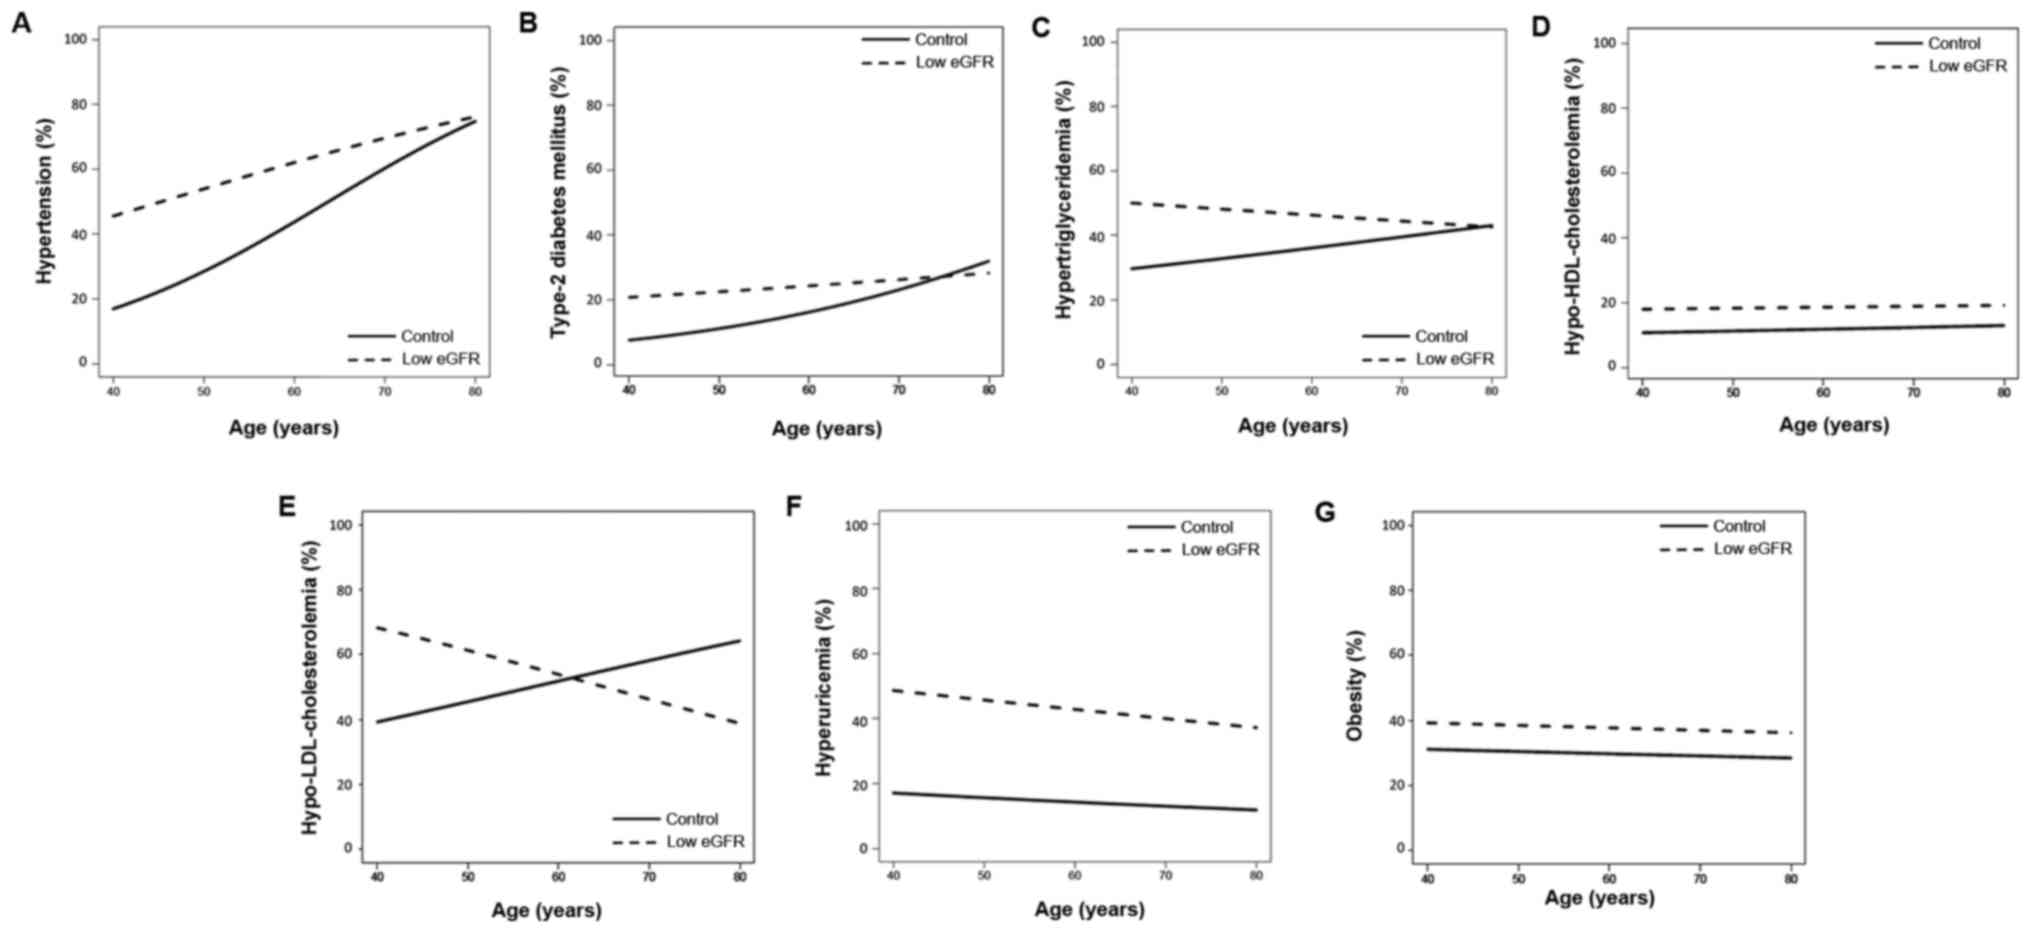
Finally, longitudinal analysis of the associations
between clinical conditions and age was conducted using the
generalized estimating equation. The analysis demonstrated
significant associations between hypertension, hypertriglyceridemia
and hyperuricemia (P<0.0036) and age in the control subjects
(Table V). Fig. 5 demonstrates the age-associated changes
in the prevalence of clinical conditions. The prevalence of
hypertension increased with age in the two groups (Fig. 5A). The prevalence of type 2 DM
increased gradually with age in the two groups (Fig. 5B). The prevalence of
hypertriglyceridemia increased with age in the control subjects,
whereas it decreased with age in the subjects from the low eGFR
group (Fig. 5C). The prevalence of
hyper-LDL-cholesterolemia decreased with age among subjects with
low eGFR, whereas it increased with age in the control subjects
(Fig. 5E). The prevalence of
hyperuricemia decreased marginally in the two groups (Fig. 5F). The prevalence of
hypo-HDL-cholesterolemia and obesity showed no association with age
(Fig. 5D and G).
Discussion
The present study examined the association between
renal dysfunction, and various parameters and clinical status in a
longitudinal epidemiological study. The results indicated that
impairment of renal function had detrimental effects on various
clinical parameters and patient health status.
Hypertension is a frequent complication in patients
with renal impairment, and is present concurrently with other
factors involved in the development of diabetes and/or non-diabetic
CKD progression (8,17,18). The
pathophysiology and mechanisms of hypertension in renal impairment
are complex. Previous studies reported that activation of the
sympathetic nervous system and renin-angiotensin-aldosterone system
contributes to the development of hypertension in individuals with
CKD (19). Furthermore, sodium
retention, volume expansion, and reduced synthesis of vasodilator
substances subsequent to the rise in BP may exacerbate
hypertension. Impairment of autoregulation of glomerular pressure
may also lead to glomerular hypertension (20). Given that activation of the
renin-angiotensin-aldosterone system not only causes a rise in BP,
but also promotes cell proliferation, inflammation, and matrix
accumulation, it may also lead to the progression of CKD (17). Therefore, strict control of BP is
highly recommended for CKD subjects and is expected to delay renal
injury progression. The current results of eGFR correlating
significantly and negatively with the prevalence of hypertension in
the low eGFR group are consistent with the results of previous
studies (8,17,18),
although the exact underlying mechanisms were not evaluated.
In the Framingham Heart Study (21), systolic BP increased with age from 30
to 84 years, whereas diastolic BP increased until the fifth decade,
and subsequently slowly decreased from the ages of 60 to 84 years.
Similar age-associated changes in BP parameters were observed in
the present study. Although a significant association between eGFR
and systolic, diastolic or mean BP was not identified, each BP
parameter was greater in the low eGFR group (even in young
individuals; aged 40–60 years), and each BP parameter peak occurred
earlier in the low eGFR group, when compared with the control
subjects.
Dyslipidemia is also common in patients with CKD
(22). Weiner and Sarnak (23) reported high prevalence of
hyper-LDL-cholesterolemia (~85%) among non-dialysis nephrotic CKD
patients, together with high incidences of hypertriglyceridemia and
hypo-HDL-cholesterolemia. The possible underlying mechanism of
dyslipidemia in CKD patients may be reflected in apolipoprotein
profiles, and lipid profiles vary depending on the level of renal
function and the degree of proteinuria (22). Non-dialysis CKD patients, particularly
those with nephrotic syndrome, exhibit decreased activity of total
and tissue-bound lipoprotein lipase, which is the predominant
enzyme involved in the catabolism of triglycerides, resulting in
high triglycerides levels. In addition, reduced synthesis of
apoprotein A-I and HDL-cholesterol, which correlates with the
decline in GFR, is observed in all spectra of CKD patients
(24). However, serum concentrations
of total and LDL-cholesterol decrease as CKD progresses to kidney
failure (23). The current results
demonstrated that eGFR correlated inversely with
hypertriglyceridemia, and positively with serum HDL-cholesterol in
individuals with low eGFR. In addition, eGFR was observed to
correlate inversely with hyper-LDL-cholesterolemia in the control
subjects. These results were consistent with a previous report
(25), showing a causal association
with early and advanced stages of renal dysfunction.
Dyslipidemia coupled with renal dysfunction enhances
the development of atherosclerosis and cardiovascular diseases
(1). Atherosclerosis of renal arteries
and subsequent damage to marginal cells accelerates renal
dysfunction (26). Previous studies
demonstrated that statin therapy reduce the decline in eGFR in
non-dialysis CKD patients (27,28);
therefore, early detection and intensive treatment are essential
for these patients. The current study found that eGFR was
significantly associated with the prevalence of dyslipidemia, even
in control subjects and in younger individuals, indicating that
aggressive clinical management is required in such populations.
In the present study, although eGFR correlated
negatively with the prevalence of type 2 DM in subjects with low
eGFR and the control subjects, no such correlation was identified
with FPG level or blood hemoglobin A1c content. This discrepancy
between our results and previous studies (29) may be due to treatment of type 2 DM.
Renal dysfunction promotes insulin resistance in patients with mild
to moderate stage of CKD, even when eGFR is maintained within the
normal range (30). In addition,
insulin resistance is associated with increased risk for CKD and is
an independent predictor of cardiovascular diseases (30). Therefore, annual screening for type 2
DM is recommended for all CKD subjects (31).
Glucose intolerance increases progressively with
age. Glucose intolerance in the elderly may be due to impaired
insulin secretion, increased insulin resistance or changes in the
endocrine system, obesity, physical inactivity, reduced dietary
carbohydrate, impaired renal function or administration of certain
therapeutic agents (32,33). The age associated increases in fasting
blood glucose level and blood hemoglobin A1c content observed in
the present study are consistent with previous observations
(34).
Hyperuricemia is common in CKD patients, and the
association between uric acid and worsening renal function is well
established (35). Animal studies have
shown that oxidative stress and endothelial dysfunction due to
hyperuricemia cause renal damage (36). Furthermore, one epidemiological study
suggested that increases in serum uric acid levels precede the
development of CKD (37). In the
present study, eGFR correlated significantly and negatively with
serum uric acid level and the prevalence of hyperuricemia in
control individuals. These findings are consistent with those of a
previous study (37). Inhibition of
uric acid excretion due to renal dysfunction may account for this
association, although the underlying molecular mechanism remains
unclear.
The prevalence of obesity is increasing worldwide,
and is a risk factor of numerous diseases, including CKD (38). Insulin resistance, hyperinsulinemia,
abnormal levels of inflammatory adipokines, and the activated
renin-angiotensin-aldosterone system may contribute to the
development of glomerular injury (39). Furthermore, obesity and CKD may
synergistically affect the occurrence of cardiovascular diseases
(40). In the present study, eGFR
correlated negatively with BMI and the prevalence of obesity in
control subjects. Further studies are required to examine the
importance of BMI control in the prevention of future renal
function loss.
There were certain limitations of the present study.
First, given that we have not performed a replication study,
validation of the current findings will require additional,
independent subject panels. In addition, although the mean
follow-up period was 5 years, the period was heterogeneous and
varied from 1 to 11 years. Furthermore, the number of subjects
varied between the different age groups. The present study also
included subjects who were being treated for hypertension, type 2
DM, dyslipidemia and/or hyperuricemia. Finally, information
regarding the underlying renal disease in each patient with low
eGFR was not evaluated. Such information could be obtained by
detailed clinical examination, including renal biopsy; however,
such diagnostic procedure was not considered to be feasible for a
population-based epidemiological study.
In conclusion, the results of the present study
indicated that low eGFR has detrimental effects on various clinical
parameters and conditions, resulting in increased risk of
hypertension, dyslipidemia, type 2 DM, hyperuricemia and
obesity.
Acknowledgements
The present study was supported by CREST of the
Japan Science and Technology Agent (to Professor Yoshiji Yamada and
Professor Ichiro Takeuchi) as well as by JSPS KAKENHI (grant no.
JP15H04772 to Y.Y.).
References
|
1
|
National Kidney Foundation, . K/DOQI
clinical practice guidelines for chronic kidney disease:
Evaluation, classification, and stratification. Am J Kidney Dis.
39:(Suppl 1). S1–S266. 2002.PubMed/NCBI
|
|
2
|
Sugiyama H, Yokoyama H, Sato H, Saito T,
Kohda Y, Nishi S, Tsuruya K, Kiyomoto H, Iida H, Sasaki T, et al:
Committee for Standardization of Renal Pathological Diagnosis;
Committee for Kidney Disease Registry; Japanese Society of
Nephrology: Japan Renal Biopsy Registry and Japan Kidney Disease
Registry: Committee Report for 2009 and 2010. Clin Exp Nephrol.
17:155–173. 2013. View Article : Google Scholar : PubMed/NCBI
|
|
3
|
Culleton BF, Larson MG, Wilson PW, Evans
JC, Parfrey PS and Levy D: Cardiovascular disease and mortality in
a community-based cohort with mild renal insufficiency. Kidney Int.
56:2214–2219. 1999. View Article : Google Scholar : PubMed/NCBI
|
|
4
|
Mann JF: Cardiovascular risk in patients
with mild renal insufficiency: Implications for the use of ACE
inhibitors. Presse Med. 34:1303–1308. 2005. View Article : Google Scholar : PubMed/NCBI
|
|
5
|
Fox CS, Larson MG, Leip EP, Meigs JB,
Wilson PW and Levy D: Glycemic status and development of kidney
disease: The Framingham Heart Study. Diabetes Care. 28:2436–2440.
2005. View Article : Google Scholar : PubMed/NCBI
|
|
6
|
Selvin E, Ning Y, Steffes MW, Bash LD,
Klein R, Wong TY, Astor BC, Sharrett AR, Brancati FL and Coresh J:
Glycated hemoglobin and the risk of kidney disease and retinopathy
in adults with and without diabetes. Diabetes. 60:298–305. 2011.
View Article : Google Scholar : PubMed/NCBI
|
|
7
|
Moorhead JF, Chan MK, ElNahas M and
Varghese Z: Lipid nephrotoxicity in chronic progressive glomerular
and tubulo-interstitial disease. Lancet. 2:1309–1311. 1982.
View Article : Google Scholar : PubMed/NCBI
|
|
8
|
Bakris GL, Williams M, Dworkin L, Elliott
WJ, Epstein M, Toto R, Tuttle K, Douglas J, Hsueh W and Sowers J:
National Kidney Foundation Hypertension and Diabetes Executive
Committees Working Group: Preserving renal function in adults with
hypertension and diabetes: A consensus approach. Am J Kidney Dis.
36:646–661. 2000. View Article : Google Scholar : PubMed/NCBI
|
|
9
|
Yamada Y, Matsui K, Takeuchi I, Oguri M
and Fujimaki T: Association of genetic variants with hypertension
in a longitudinal population-based genetic epidemiological study.
Int J Mol Med. 35:1189–1198. 2015.PubMed/NCBI
|
|
10
|
Yamada Y, Matsui K, Takeuchi I, Oguri M
and Fujimaki T: Association of genetic variants of the α-kinase 1
gene with type 2 diabetes mellitus in a longitudinal
population-based genetic epidemiological study. Biomed Rep.
3:347–354. 2015.PubMed/NCBI
|
|
11
|
Yamada Y, Matsui K, Takeuchi I and
Fujimaki T: Association of genetic variants with dyslipidemia and
chronic kidney disease in a longitudinal population-based genetic
epidemiological study. Int J Mol Med. 35:1290–1300. 2015.PubMed/NCBI
|
|
12
|
Yamada Y, Matsui K, Takeuchi I and
Fujimaki T: Association of genetic variants with coronary artery
disease and ischemic stroke in a longitudinal population-based
genetic epidemiological study. Biomed Rep. 3:413–419.
2015.PubMed/NCBI
|
|
13
|
Matsuo S, Imai E, Horio M, Yasuda Y,
Tomita K, Nitta K, Yamagata K, Tomino Y, Yokoyama H and Hishida A:
Collaborators developing the Japanese equation for estimated GFR:
Revised equations for estimated GFR from serum creatinine in Japan.
Am J Kidney Dis. 53:982–992. 2009. View Article : Google Scholar : PubMed/NCBI
|
|
14
|
Kanazawa M, Yoshiike N, Osaka T, Numba Y,
Zimmet P and Inoue S: Criteria and classification of obesity in
Japan and Asia-Oceania. Asia Pac J Clin Nutr. 11(s8): S732–S737.
2002. View Article : Google Scholar
|
|
15
|
Cheng J, Edwards LJ, MaldonadoMolina MM,
Komro KA and Muller KE: Real longitudinal data analysis for real
people: Building a good enough mixed model. Stat Med. 29:504–520.
2010.PubMed/NCBI
|
|
16
|
Gibbons RD, Hedeker D and DuToit S:
Advances in analysis of longitudinal data. Annu Rev Clin Psychol.
6:79–107. 2010. View Article : Google Scholar : PubMed/NCBI
|
|
17
|
Maschio G, Oldrizzi L, Marcantoni C and
Rugiu C: Hypertension and progression of renal disease. J Nephrol.
13:225–227. 2000.PubMed/NCBI
|
|
18
|
Staessen JA, Gasowski J, Wang JG, Thijs L,
Den Hond E, Boissel JP, Coope J, Ekbom T, Gueyffier F, Liu L, et
al: Risks of untreated and treated isolated systolic hypertension
in the elderly: Meta-analysis of outcome trials. Lancet.
355:865–872. 2000. View Article : Google Scholar : PubMed/NCBI
|
|
19
|
Taal MW and Brenner BM: Renoprotective
benefits of RAS inhibition: From ACEI to angiotensin II
antagonists. Kidney Int. 57:1803–1817. 2000. View Article : Google Scholar : PubMed/NCBI
|
|
20
|
Ljutić D and Kes P: The role of arterial
hypertension in the progression of non-diabetic glomerular
diseases. Nephrol Dial Transplant. 18:(Suppl 5). v28–v30. 2003.
View Article : Google Scholar : PubMed/NCBI
|
|
21
|
Franklin SS: Ageing and hypertension: The
assessment of blood pressure indices in predicting coronary heart
disease. J Hypertens Suppl. 17:S29–S36. 1999.PubMed/NCBI
|
|
22
|
Kasiske BL: Hyperlipidemia in patients
with chronic renal disease. Am J Kidney Dis. 32:(Suppl 3).
S142–S156. 1998. View Article : Google Scholar : PubMed/NCBI
|
|
23
|
Weiner DE and Sarnak MJ: Managing
dyslipidemia in chronic kidney disease. J Gen Intern Med.
19:1045–1052. 2004. View Article : Google Scholar : PubMed/NCBI
|
|
24
|
Hirano T, Furukawa S, Kurokawa M, Ebara T,
Dixon JL and Nagano S: Intracellular apoprotein B degradation is
suppressed by decreased albumin concentration in Hep G2 cells.
Kidney Int. 47:421–431. 1995. View Article : Google Scholar : PubMed/NCBI
|
|
25
|
Thompson M, Ray U, Yu R, Hudspeth A,
Smillie M, Jordan N and Bartle J: Kidney Function as a Determinant
of HDL and Triglyceride Concentrations in the Australian
Population. J Clin Med. 5:352016. View Article : Google Scholar
|
|
26
|
Schaeffner ES, Kurth T, Curhan GC, Glynn
RJ, Rexrode KM, Baigent C, Buring JE and Gaziano JM: Cholesterol
and the risk of renal dysfunction in apparently healthy men. J Am
Soc Nephrol. 14:2084–2091. 2003.PubMed/NCBI
|
|
27
|
Sandhu S, Wiebe N, Fried LF and Tonelli M:
Statins for improving renal outcomes: A meta-analysis. J Am Soc
Nephrol. 17:2006–2016. 2006. View Article : Google Scholar : PubMed/NCBI
|
|
28
|
Su X, Zhang L, Lv J, Wang J, Hou W, Xie X
and Zhang H: Effect of statins on kidney disease outcomes: A
systematic review and meta-analysis. Am J Kidney Dis. 67:881–892.
2016. View Article : Google Scholar : PubMed/NCBI
|
|
29
|
Lin CC, Chen CC, Chen FN, Li CI, Liu CS,
Lin WY, Yang SY, Lee CC and Li TC: Risks of diabetic nephropathy
with variation in hemoglobin A1c and fasting plasma glucose. Am J
Med. 126:1017.e1–1017.e10. 2013. View Article : Google Scholar
|
|
30
|
Liao MT, Sung CC, Hung KC, Wu CC, Lo L and
Lu KC: Insulin resistance in patients with chronic kidney disease.
J Biomed Biotechnol. 2012:6913692012. View Article : Google Scholar : PubMed/NCBI
|
|
31
|
National Kidney Foundation, . KDOQI
Clinical Practice Guideline for Diabetes and CKD: 2012 Update. Am J
Kidney Dis. 60:850–886. 2012. View Article : Google Scholar : PubMed/NCBI
|
|
32
|
Chang AM and Halter JB: Aging and insulin
secretion. Am J Physiol Endocrinol Metab. 284:E7–E12. 2003.
View Article : Google Scholar : PubMed/NCBI
|
|
33
|
Stout RW: Glucose tolerance and ageing. J
R Soc Med. 87:608–609. 1994.PubMed/NCBI
|
|
34
|
Shimokata H, Muller DC, Fleg JL, Sorkin J,
Ziemba AW and Andres R: Age as independent determinant of glucose
tolerance. Diabetes. 40:44–51. 1991. View Article : Google Scholar : PubMed/NCBI
|
|
35
|
Nacak H, van Diepen M, de Goeji MC,
Rotmans JI and Dekker FW: PREPARE-2 study group: Uric acid:
association with rate of renal function decline and time until
start of dialysis in incident pre-dialysis in incident pre-dialysis
patients. BMC Nephrol. 15:912014. View Article : Google Scholar : PubMed/NCBI
|
|
36
|
Mazzali M, Hughes J, Kim YG, Jefferson JA,
Kang DH, Gordon KL, Lan HY, Kivlighn S and Johnson RJ: Elevated
uric acid increases blood pressure in the rat by a novel
crystal-independent mechanism. Hypertension. 38:1101–1106. 2001.
View Article : Google Scholar : PubMed/NCBI
|
|
37
|
Bo S, CavalloPerin P, Gentile L, Repetti E
and Pagano G: Hypouricemia and hyperuricemia in type 2 diabetes:
Two different phenotypes. Eur J Clin Invest. 31:318–321. 2001.
View Article : Google Scholar : PubMed/NCBI
|
|
38
|
Fox CS, Larson MG, Leip EP, Culleton B,
Wilson PW and Levy D: Predictors of new-onset kidney disease in a
community-based population. JAMA. 291:844–850. 2004. View Article : Google Scholar : PubMed/NCBI
|
|
39
|
Cusumano AM, Bodkin NL, Hansen BC, Iotti
R, Owens J, Klotman PE and Kopp JB: Glomerular hypertrophy is
associated with hyperinsulinemia and precedes overt diabetes in
aging rhesus monkeys. Am J Kidney Dis. 40:1075–1085. 2002.
View Article : Google Scholar : PubMed/NCBI
|
|
40
|
Beddhu S, Kimmel PL, Ramkumar N and Cheung
AK: Associations of metabolic syndrome with inflammation in CKD:
Results From the Third National Health and Nutrition Examination
Survey (NHANES III). Am J Kidney Dis. 46:577–586. 2005. View Article : Google Scholar : PubMed/NCBI
|