Introduction
Hepatitis C virus (HCV) is a human pathogen
responsible for acute and chronic liver disease (1-3). An
estimated 130-180 million individuals are infected worldwide
(1). HCV induced morbidity and
mortality are primarily due to liver complications including liver
cirrhosis and hepatocellular carcinoma (3). In addition, many extrahepatic
manifestations have been linked to chronic HCV infection with
related morbidity and mortality, including cardiovascular disease,
type 2 diabetes mellitus, insulin resistance, neurocognitive
dysfunction, systemic vasculitis, B cell non-Hodgkin lymphoma and
chronic kidney disease (2,3). At present, many parts of the HCV life
cycle, including entry into naïve cells, infectivity, RNA
replication, viral assembly, viral secretion associated with lipid
metabolism (1,4), lipid abnormality and atherosclerosis,
are considered of great importance in chronic HCV infected
patients.
Daclatasvir is a selective nonstructural protein 5A
replication complex inhibitor; asunaprevir is a nonstructural
protein 3 protease inhibitor active against HCV genotypes 1a and 1b
(5). In previous study, Daclatasvir
was dosed as two 30-mg tablets once-daily (5). Asunaprevir was initially dosed as three
200-mg tablets twice-daily; subsequently, the dose was reduced to
200-mg twice-daily after a clinical study reported the elevation of
hepatic enzymes (5). Sustained viral
response (SVR) at week 12 after the start of treatment was achieved
in 89.9% of treatment-naïve patients, 84.7% of interferon
(IFN)-ineligible/intolerant patients, and 81.9% of non-responder
patients. Furthermore, 89.0% of IFN-ineligible/intolerant patients
and 83.1% of non-responder patients achieved SVR24, which indicated
that Daclatasvir/Asunaprevir provided a highly effective and
well-tolerated treatment option for patients with HCV genotype 1b
(5,6).
In an IFN treatment regime, cases of HCV genotype 2
infection may benefit more from viral clearance via metabolic
changes than genotype 1 infections, particularly in those without
baseline insulin resistance (7). In
an IFN-free treatment regime, HCV genotype 3 suppression during
sofosbuvir/ribavirin was indicated to restore distal sterol
metabolites, which indicated viral interference with de novo
lipogenesis or selective retention by hepatocytes (8). Additionally, clearance of HCV genotype 1
using sofosbuvir/ribavirin previously resulted in a rapid change in
peripheral and intrahepatic metabolic pathways, which implicated a
direct effect of HCV replication on lipid homeostasis (9). In another study, increase in serum
low-density lipoprotein (LDL) concentration at 4 weeks during
direct-acting antiviral (DAA) treatment was specifically associated
with ledipasvir/sofosbuvir treatment and a decrease of HCV core
protein (10).
MicroRNA (miR)122 is considered a key component
involved in HCV replication (11) and
in cholesterol metabolism (11,12) in
hepatocytes. Serum miR122 may also be stored in hepatocytes
(13). Protein convertase
subtilisin/kexin 9 (PCSK9) is an LDL regulator, which operates
through LDL receptor (LDLR) degradation (14), and has been associated with HCV entry
into hepatocytes (15-17).
In the present study, variation in the lipid profile following
treatment of HCV genotype 1b by Daclatasvir/Asunaprevir was
evaluated, along with the association between serum PCSK9, miR122
and the variation in LDL.
Patients and methods
Patients
A total of 39 successive patients (Table I) with HCV genotype 1b infection with
chronic hepatitis and compensatory cirrhosis who were admitted for
treatment with the DAA regimen, Daclatasvir/Asunaprevir
(Bristol-Myers Squibb, Princeton, NJ, USA), at Nagasaki Harbor
Medical Center, Nagasaki, Japan were enrolled from June 2014 to
November 2016. The exclusion criteria were non compensatory
cirrhosis and hemodialysis. Combination therapy with
Daclatasvir/Asunaprevir was orally administered for a period of 24
weeks (5). During the treatment
period, serum HCV-RNA was examined every 2-4 weeks; following the
end of the treatment period, these measurements were collected
every 12 weeks. SVR was determined at 24 weeks after the end of
treatment. At week 24 after the end of treatment, SVR was achieved
in 38 patients. Serum levels of HCV-RNA after 4 weeks of treatment
were detected. In the study, 2 patients suffered from diabetes
mellitus and were taking oral medication and 2 patients suffered
from hypercholesterolemia and were taking statin medication.
Patients were observed in the period from the start of treatment to
52 weeks later. Informed consent was obtained from each patient
included in the study, and the study protocol conformed to the
ethical guidelines of the 1975 Declaration of Helsinki, as
evidenced by the approval of the study by the Human Research Ethics
Committee of Nagasaki Harbor Medical Center (approval no. NIRB
1609002).
 | Table I.Clinical profile of 39 patients prior
to direct acting anti-virals treatment. |
Table I.
Clinical profile of 39 patients prior
to direct acting anti-virals treatment.
| Parameter | Total (n=39) | No change
(n=22) | Upregulation
(n=17) | P-value |
|---|
| Age (SD) | 70.92 (11.02) | 73.09 (10.36) | 68.12 (11.54) | 0.1654 |
| Female/male | 25/14 | 15/7 | 10/7 | 0.3432 |
| CH/LC | 25/14 | 13/9 | 12/5 | 0.5722 |
| HCV-RNA (SD) | 5.856 (0.92) | 5.782 (0.95) | 5.953 (0.90) | 0.5731 |
| BMI (SD) | 22.95 (4.907) | 22.48 (4.350) | 23.57 (5.624) | 0.4456 |
| ALT (SD) | 41.90 (35.96) | 38.86 (24.94) | 45.82 (47.18) | 0.5560 |
| Albumin (SD) | 4.054 (0.317) | 4.045 (0.349) | 4.065 (0.280) | 0.8537 |
| Platelet (SD) | 16.74 (6.226) | 16.32 (7.101) | 17.28 (5.035) | 0.6415 |
| LDL (SD) | 101.1 (24.92) | 100.9 (28.52) | 101.2 (20.46) | 0.7056 |
| HDL (SD) | 56.71 (17.33) | 55.05 (12.16) | 58.77 (22.88) | 0.8376 |
| TG (SD) | 110.6 (48.71) | 101.6 (38.27) | 121.6 (58.49) | 0.2336 |
| C-peptide (SD) | 2.390 (0.787) | 2.310 (0.686) | 2.487 (0.908) | 0.7711 |
| FPG (SD) | 103.1 (16.94) | 101.5 (13.37) | 105.3 (20.92) | 0.4557 |
| Insulin (SD) | 10.99 (5.359) | 11.36 (5.854) | 10.51 (4.774) | 0.6289 |
| HbA1c (SD) | 5.536 (0.510) | 5.514 (0.385) | 5.565 (0.650) | 0.7611 |
Laboratory measurements
A total of 10 ml whole blood vena (left or right
arm) sample per a patient was collected to analyze sera. To obtain
the sera, samples were centrifuged at 102 x g for 5 min at room
temperature. Laboratory data and anthropometric measurements were
obtained for each subject every 4 weeks during treatment and every
12 weeks thereafter. The body mass index (BMI) of each patient was
calculated from their weight in kg divided by the square of their
height in meters. Laboratory examinations included assessment of
white blood cell count, platelet count, prothrombin time, levels of
hemoglobin, C-reactive protein, blood urea nitrogen, creatinine,
total protein, albumin, total bilirubin, alanine aminotransferase,
γ-glutamyl transpeptidase, cholinesterase, triglyceride (TG), total
cholesterol (TC), high-density lipoprotein cholesterol (HDL-C), LDL
cholesterol (LDL-C), fasting plasma glucose (FPG), hemoglobin A1c
(HbA1c), insulin and C-peptide. The homeostasis model assessment of
insulin resistance [HOMA-IR; FPG (mg/dl) x insulin at time 0
(µU/ml) /405] and homeostasis model assessment of insulin secretion
[HOMA-β; insulin at time 0 (µU/ml) x 360/FPG (mg/dl) -63] were
calculated for insulin resistance and insulin secretion,
respectively (18). The C-peptide
index [CPI; C-peptide (ng/ml) / FPG x100] was determined a marker
of β cell function (19). TC was
calculated using the Friedewald formula [TC=LDL-C+HDL-C+TG/5]
(20). BMI, insulin and c-peptide
were examined at the start of treatment and 52 weeks after
treatment. PCSK9 was measured by ELISA assay (BML, Inc., Tokyo,
Japan) (21). The concentration of
serum PCSK9 was measured to differentiate the active heterodimer
form (PCSK9-A) from the inactive free-fragment form (PCSK9-I). Both
forms of PCSK9 were measured at the start of treatment, and at
weeks 4, 24, 36 and 52 after treatment in 30 patients with
conserved serum.
miR extraction and quantification
Total RNAs including preserved miRNAs were extracted
from 200-µl serum samples using ISOGEN II (Nippon Gene, Tokyo,
Japan). Synthetic miR39 was added to serum samples prior to RNA
extraction as an internal control (Applied Biosystems, Foster City,
CA, USA). The miR122 obtained by reverse transcription-quantitative
polymerase chain reaction was quantified using TaqMan MicroRNA
assays [has-miR-122-5p (Assay ID 00245) and cel-miR-39-3p (Assay ID
000200) Applied Biosystemsaccording to the manufacturer's protocol.
RT was performed using the High-Capacity cDNA Reverse Transcription
kit (Applied Biosystems) and was conducted at 16˚C for 30 min, 42˚C
for 30 min, 85˚C for 5 min and then hold at 4˚C. miR122 expression
was calculated by the 2-ΔΔCq method (22) and normalized to synthetic-miR39
expression in the serum (23).
Quantitative PCR kit is TaqMan Micro RNA assays (Applied
Biosystems) and DNA polymerase is Taqman Universal Mix II, no UNG
(Applied Biosystems). The sequences of primers are follows:
Has-miR-122-5p: 5'-UGGAGUGUGACAAUGGUGUUUG-3' and cel-miR-39-3p:
5'-UCACCGGGUGUAAAUCAGCU UG-3'. Th thermocycling conditions were
follows: Pre-incubation 95˚C for 10 min; denaturation, 95˚C, 15
sec; annealing/extension, 60˚C, 60 sec; amplification was conducted
for 45 cycles. miR122 was measured at the start of treatment, and
at weeks 4, 24, 36 and 52 after treatment. The miR122 assay
provided quantitative analysis.
Statistical analysis
Data were analyzed using StatView 5.0 software (SAS
Institute, Inc., Cary, NC, USA). Data is presented mean ± standard
deviation. Laboratory result variables were compared using
correlation analysis, t-tests, one way analysis of variance (ANOVA)
and χ2-square tests. Multiple comparisons were not
performed in the ANOVA. Correlation was evaluated based on
Pearson's correlation coefficient. P<0.05 was considered to
indicate statistical significance.
Results
Alterations in lipid profile following
DAA
Changes in lipid profile and metabolic parameters in
patients over the 52-week treatment period were summarized
(Fig. 1). LDL, but not HDL and
triglyceride, exhibited increases over the treatment period
(Fig. 1A, C and D). Since
the LDL/HDL ratio was also increased, DAA treatment affected the
lipid profile (Table II).
Upregulation of LDL continued to the end of observation at week 52.
Patients were categorized in the ‘upregulation group’ if the LDL at
week 52 was equal to, or 10% greater, than the value at week 0. All
other patients were included in the ‘no change group’ (Fig. 1B). A total of 17 patients were in the
upregulation group and 22 were in the no change group. The clinical
characteristics were similar in both groups at week 0 (Table I). One patient of each group on
medication for diabetes was in the no-change group and upregulation
group, respectively, and the 2 patients on medication for
hypercholesteremia were placed in the upregulation group. The
number of anti-diabetic and anti-hypercholesteremic drug users were
not statistically disproportionate in the groups. BMI and HOMA-IR
did not obviously change between weeks 0 and 52 (Fig. 1E and F).
HbA1c exhibited marginal increase at week 36 compared with week 0,
but was similar between weeks 52 and 0 (Fig. 1G). LDL, total cholesterol and at week
52 were higher than that at the start of DAA, but glucose metabolic
markers (FPG, insulin, C-peptide, HOMA-β, and CPI) and lipids (HDL
and TG) were unchanged at weeks 0, 36 and 52 (Table II). HCV-RNA relapse was observed at
week 28 after the start of treatment in 1 patient in upregulation
group; their LDL levels were 65, 94 and 89 mg/dl at weeks 0, 36 and
52, respectively (data not shown). The difference in LDL
cholesterol level after DAA treatment was not measured, since only
2 patients had an LDL value at 1 year after DAA treatment that was
lower than 90% of the value prior to treatment.
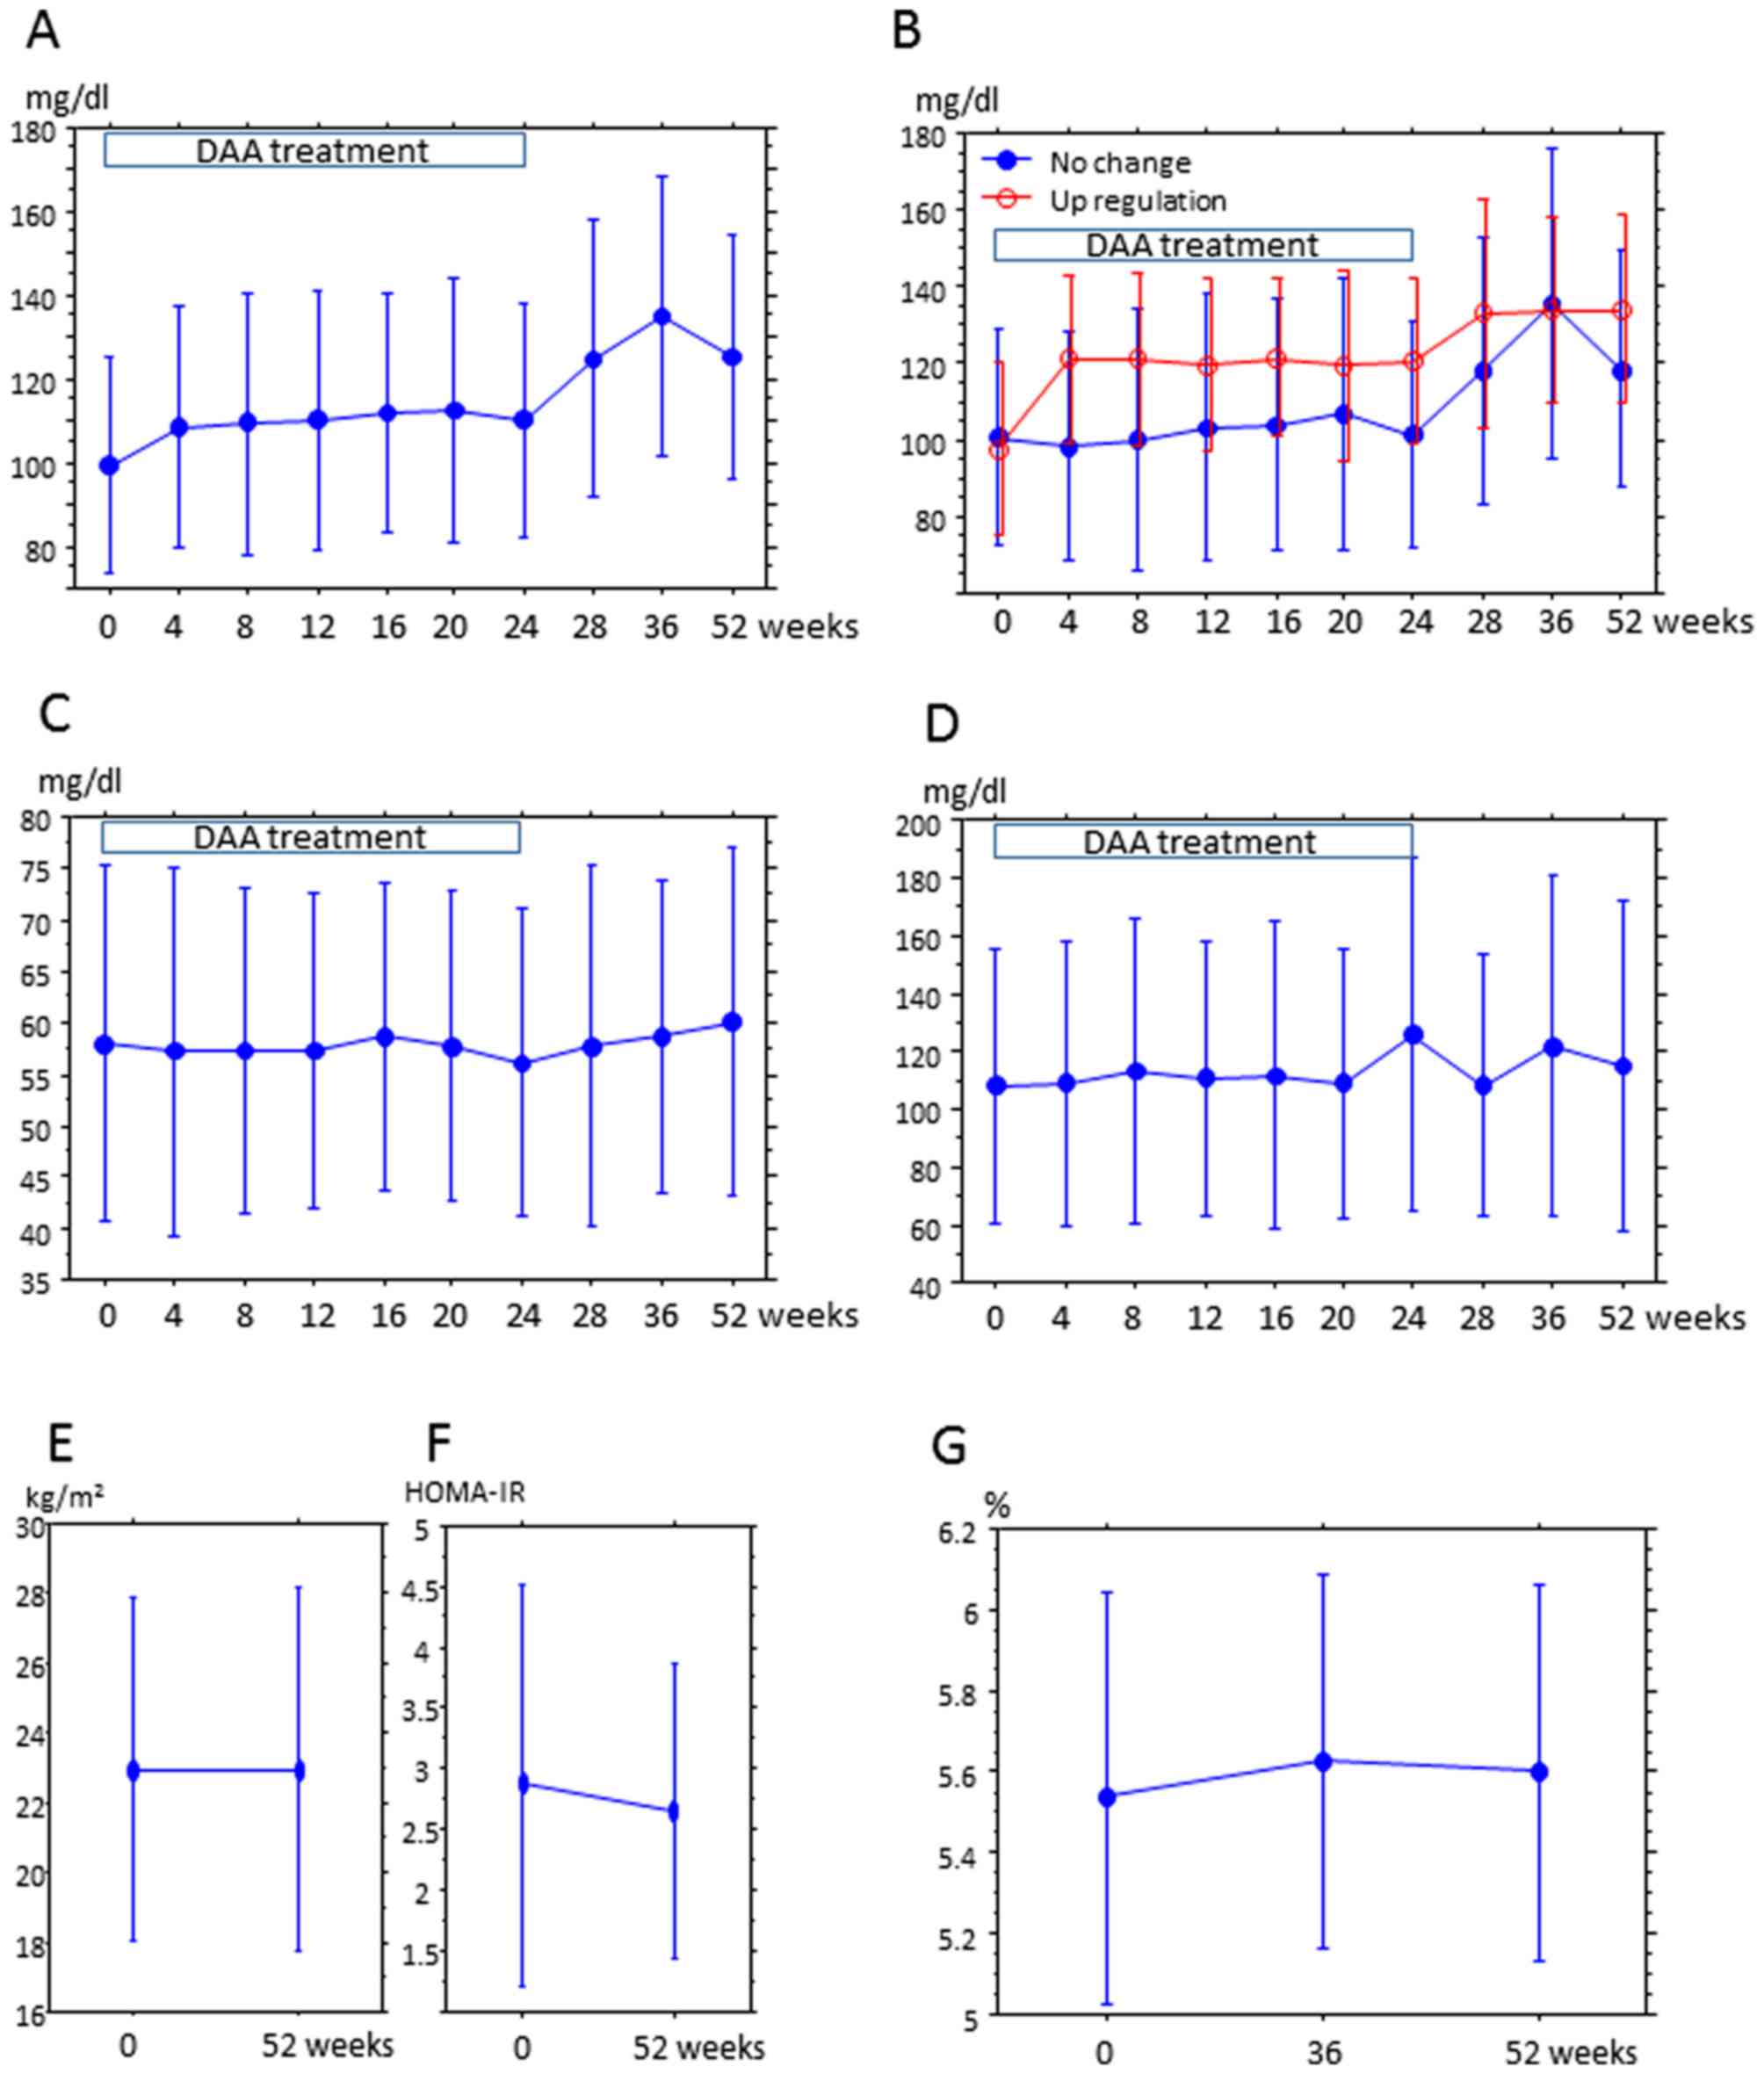 | Figure 1.Changes in serum lipids from the
start of DAA treatment to 52 weeks after treatment. DAA treatment
was terminated after 24 weeks. LDL measurements at weeks 28, 36 and
52 were at weeks 4, 12, and 24 after the end of treatment,
respectively. The y-axis is the mean LDL (A and B), HDL (C) and TG
(D) concentration (mg/dl), and the x-axis is the time after the
start of treatment. Error bars represent the standard deviation.
Differences between time points (0 and other time points) were
evaluated by a paired t-test, and difference among 0, 36 and 52 was
evaluated by analysis of variance and P<0.05 were considered
statistically significant. (A) Trend of LDL concentration in all
patients. LDL at the start of treatment (week 0) was significantly
lower than that at the other time points (week 4-52) (week 4,
P=0.0011, week 8, P=0.0032; week 12, P=0.0027; week 16, P=0.0095;
week 20, P=0.0037; week 24, P=0.0027 and weeks 28-52, P<0.0001).
LDL at weeks 4, 8, 12, 16, 20 and 24 after treatment was
significantly lower than LDL after the end of treatment (weeks 28,
36 and 52; week 4 vs. 28, P=0.0004; week 4 vs. 36-52, P<0.0001;
week 8 vs. 28, P=0.0007; week 8 vs. 36-53, P<0.0001; week 12 vs.
28, P=0.0006, week 12 vs. week 36-53, P=0.0001; week 16 vs. week
28, P<0.0001; week 16 vs. week 36, P=0.0001; week 16 vs. week
52, P=0.0004; week 20 vs. 28-36; P<0.0001; week 20 vs. week 52,
P=0.0008; week 24 vs. 28-36, P<0.0001; week 24 vs. 52,
P=0.0002). LDL at week 36 after treatment was higher than LDL at
week 52 (P=0.0464). (B) Trends of LDL concentration in the ‘no
change’ and ‘upregulation’ groups. In the upregulation group: LDL
at week 0 was lower than that at all other time points (weeks 4, 8,
16, 28, 36 and 52, P<0.0001; week 12, P=0.0003; week 20 and 24,
P=0.0002); LDL at week 4 was lower than that at weeks 28 (P=0.0454)
and 52 (P=0.0373); and LDL at weeks 8, 12, 16, 20 and 24 was lower
than that after the end of treatment (weeks 28, 36, and 52; week 8
vs. 28, P=0.0291, week 8 vs. 36, P=0.0149; week 8 vs. 52, P=0.0134,
week 12 vs. 28, P=0.0291, week 12 vs. 36, P=0.0149; week 12 vs. 52,
P=0.0061, week 16 vs. 28, P=0.0212; week 16 vs. 36, P=0.0162; week
16 vs. 52, P=0.0170, week 20 vs. 28, P=0.0010, week 20 vs. 36,
P=0.0396; week 20 vs. 52, P=0.0338; week 24 vs. 28, P=0.0013; week
24 vs. 36, P=0.0111, week 24 vs. 52, P=0.0308). In the no change
group: LDL at week 0 was lower than that at weeks 28-52 (week 28,
P=0.0067; week 36, P=0.0001 and week 52, P<0.0001); LDL at weeks
4-24 was lower than that at weeks 28, 36 and 52 (week 4 vs. 28,
P=0.0030, week 4 vs. 36, P=0.0002, week 4 vs. 52, P<0.0001; week
8 vs. 24, P=0.0117, week 8 vs. 36, P=0.0002, week 8 vs. 52,
P<0.0001, week 12 vs. 28, P=0.0006; week 12 vs. 36, P=0.0016;
week 12 vs. 52, P=0.0018; week 16 vs. 28, P=0.0005; week 16 vs. 36,
P=0.0019, week 16 vs. 52, P=0.0065; week 20 vs. 28, P=0.0033, week
20 vs. 36, P=0.0006; week 20 vs. 52, P=0.0132; week 24 vs. 28,
P=0.0018; week 24 vs. 36, P=0.0012; week 24 vs. 52; P=0.0031); and
LDL at week 36 was lower than that at week 52 (P=0.0279). (C)
Trends of HDL concentration in all patients. No significant
differences were identified at any time points. (D) Trends of TG
concentration in all patients. No significant differences were
identified at any time points. (E) BMI and (F) HOMA-IR were
compared at weeks 0 and 52. No significant differences were
identified at any time points. (G) Hemoglobin A1c was compared at
weeks 0, 36 and 52. No significant differences were identified at
any time points. DAA, direct acting anti-virals; HDL, high-density
lipoprotein; LDL, low-density lipoprotein; TG, triglyceride; BMI,
body mass index; HOMA-IR, homeostasis model assessment of insulin
resistance; HbA1c, hemoglobin A1c. |
| Table II.Changes in metabolic markers from the
beginning of direct acting anti-virals treatment (week 0), to 12
weeks after the end of treatment (week 36) and 26 weeks after the
end of treatment (week 52). |
Table II.
Changes in metabolic markers from the
beginning of direct acting anti-virals treatment (week 0), to 12
weeks after the end of treatment (week 36) and 26 weeks after the
end of treatment (week 52).
| Marker | Week 0 (SD) | Week 36 (SD) | Week 52 (SD) | P-value |
|---|
| BMI (kg/m/m) | 22.95 (4.907) | NT | 22.9 (5.221) | 0.9765 |
| Insulin
(µIU/ml) | 10.99 (5.359) | NT | 10.1 (3.941) | 0.2038 |
| C-peptide
(ng/ml) | 2.39 (0.787) | NT | 2.197 (0.745) | 0.4162 |
| FPG (mg/dl) | 103.12
(16.930) | NT | 104.82
(14.832) | 0.2803 |
| HOMA-IR | 2.87 (1.659) | NT | 2.658 (1.215) | 0.2704 |
| HOMA-β | 106.6 (53.340) | NT | 93.08 (53.350) | 0.0501 |
| CPI | 2.316 (0.835) | NT | 2.094 (0.708) | 0,2987 |
| HbA1c (%) | 5.536 (0.510) | 5.624 (0.463) | 5.597 (0.468) | 0.1664 |
| TC (mg/dl) | 178.8 (33.811) | 216.9 (42.673) | 208.1 (34.780) | <0.0001 |
| LDL (mg/dl) | 101.1 (24.912) | 129.3 (35.253) | 126.1 (27.781) | <0.0001 |
| HDL (mg/dl) | 56.71 (17.623) | 58.89 (15.170) | 59.89 (17.331) | 0.3466 |
| Triglyceride
(mg/dl) | 110.5 (48.710) | 114.1 (56.672) | 119.0 (57.651) | 0.3625 |
| TG/HDL | 2.279 (1.578) | 2.192 (1.422) | 2.344 (1.736) | 0.7965 |
| LDL/HDL | 1.934 (0.723) | 2.375 (0.967) | 2.305 (0.911) | 0.1150 |
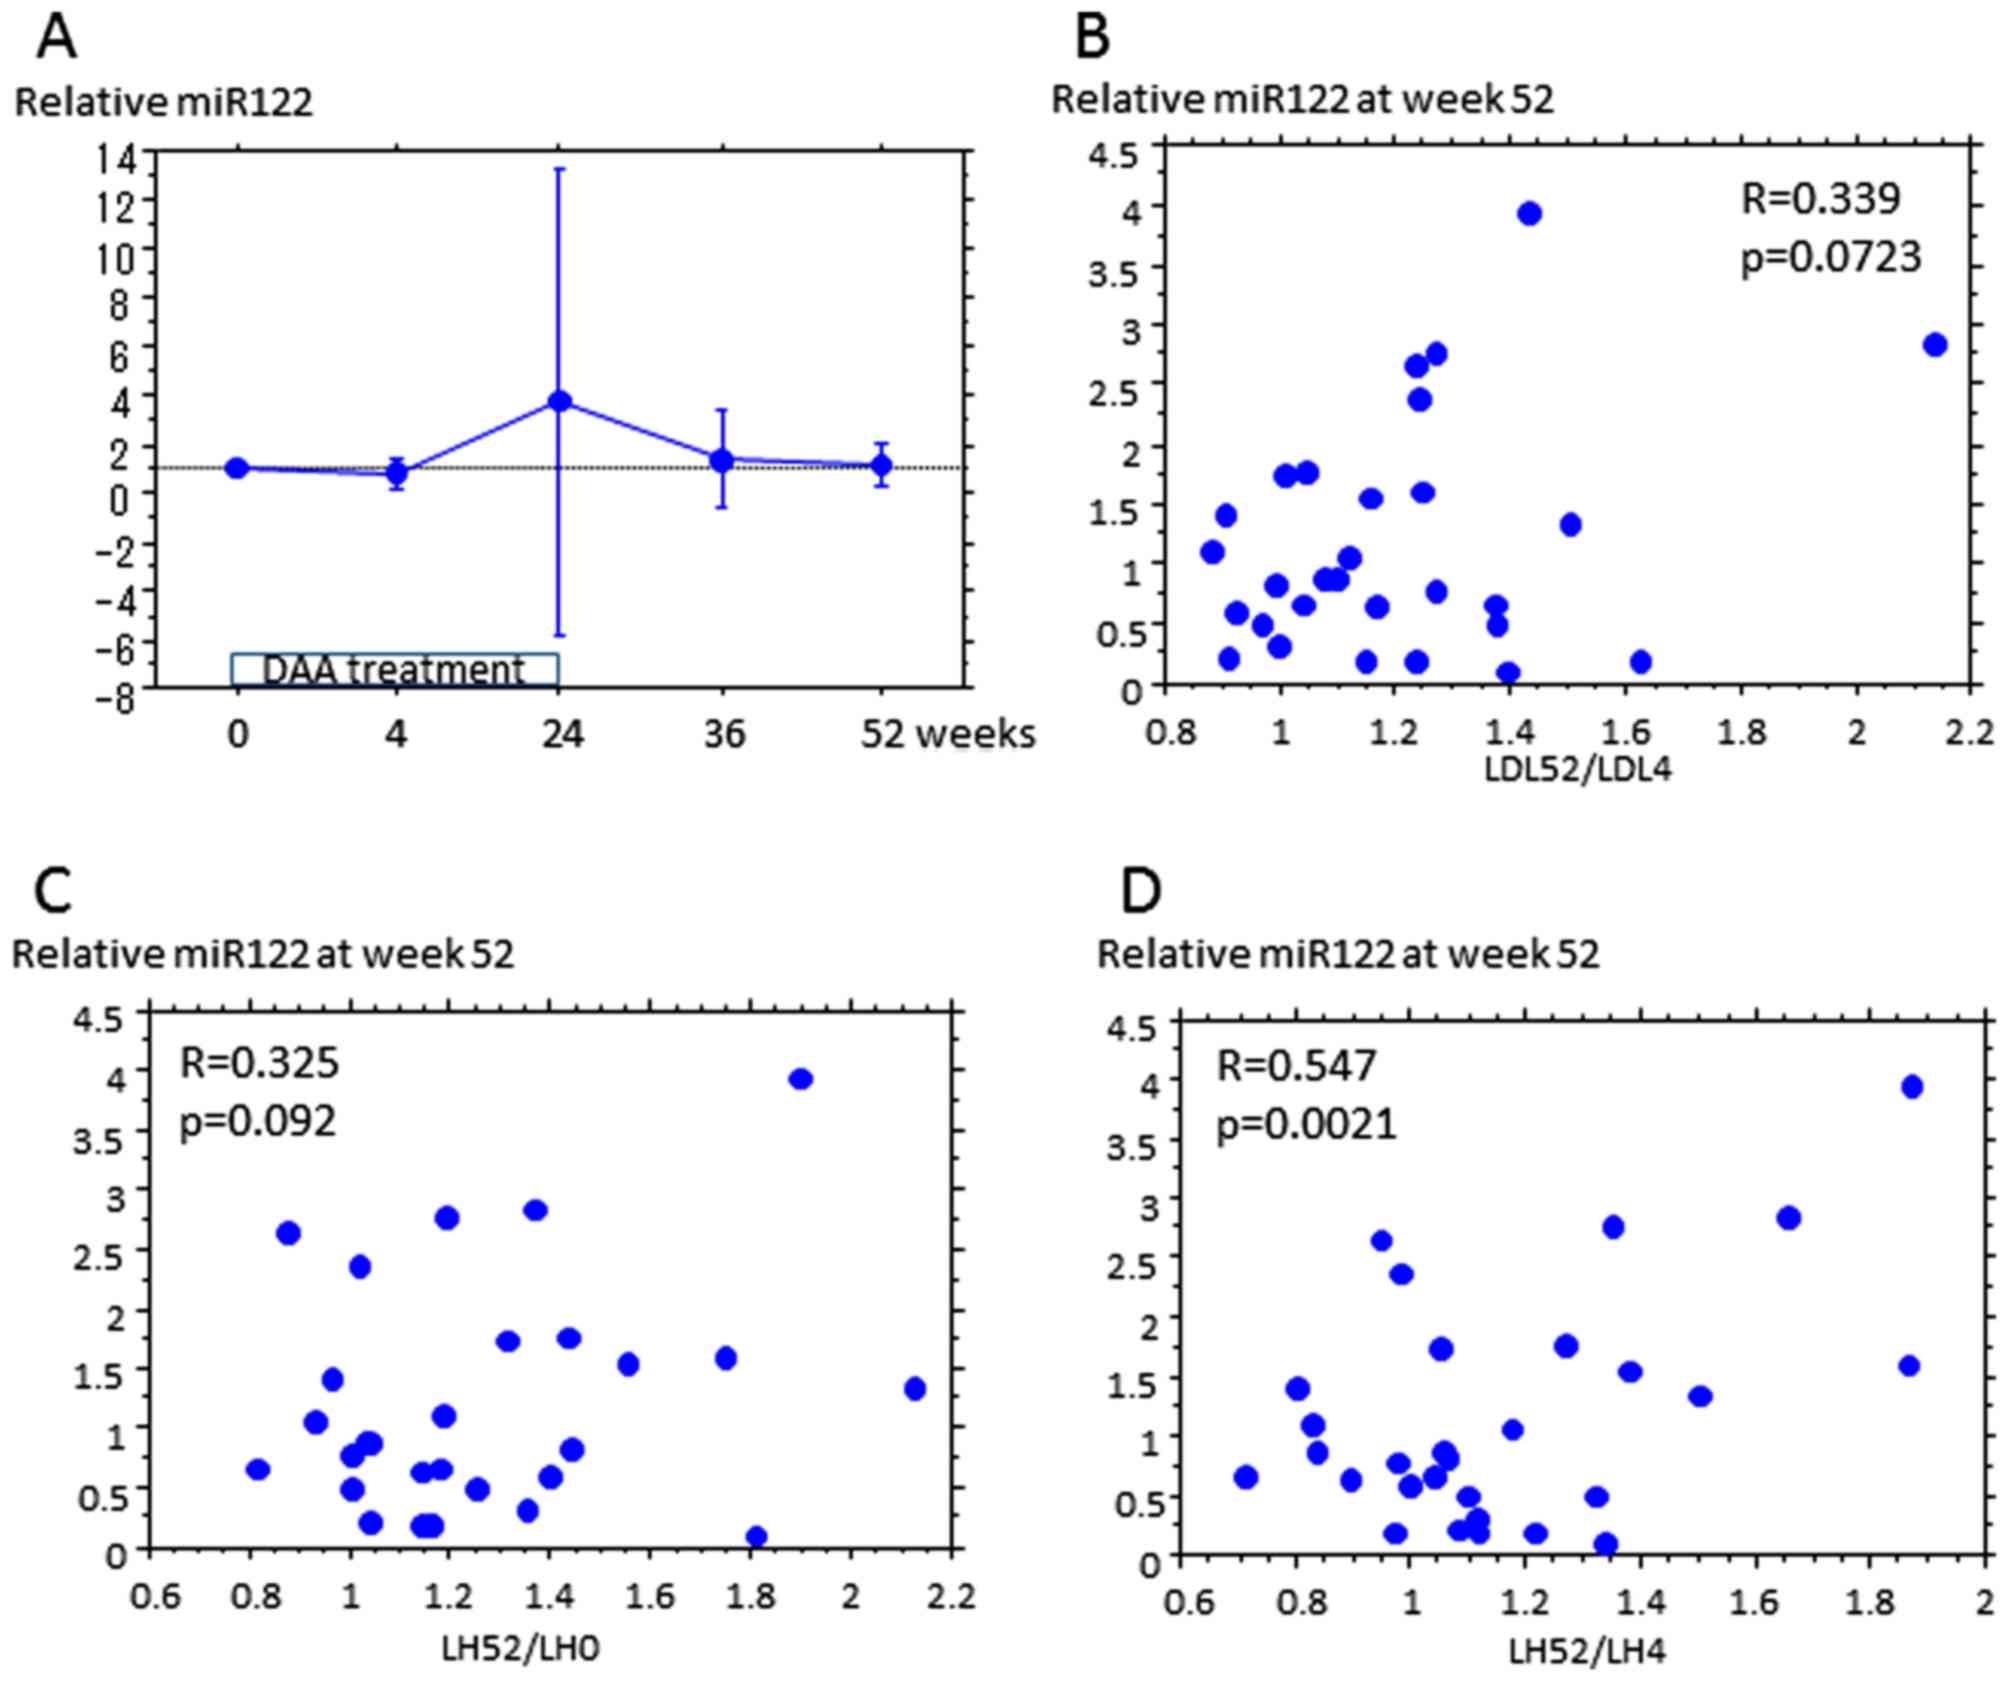
Serum miR122 and LDL
Subsequently, the association of serum miR122 with
upregulation of LDL by DAA treatment in 30 patients was examined.
The miR122 assay provided a quantitative analysis. Relative miR122
at an indicated time represents the increase in expression from the
start of treatment. Relative miR122 did not differ at each time
point (Fig. 2A), or between the no
change and upregulation groups (data not shown). The increase in
LDL from week 4 to 52 appeared to be weakly associated with
relative miR122 at week 52 (Fig. 2B),
and the increase in LDL/HDL ratio from weeks 0 and 4 to week 52 was
also associated with relative miR122 at week 52, which was
indicated to be significant for LDL/HDL increase between weeks 4
and 52 (Fig. 2C and D, and Table
III). Relative miR122 at week 52 was not associated with
increased HDL, TG or total cholesterol (Table III).
| Table III.Association between relative
microRNA122 at week 52 and increased lipids. |
Table III.
Association between relative
microRNA122 at week 52 and increased lipids.
| Increase rate of
PCSK9-A | R | P-value |
|---|
| Week 4-52 |
| LDL | 0.339 | 0.0723 |
| HDL | -0.208 | 0.2243 |
| TG | -0.091 | 0.7817 |
| TC | 0.172 | 0.4325 |
| LDL/HDL | 0.547 | 0.0021 |
| Week 0-52 |
| LDL | 0.082 | 0.7521 |
| HDL | -0.267 | 0.3321 |
| TG | 0.284 | 0.3081 |
| TC | 0.026 | 0.7568 |
| LDL/HDL | 0.325 | 0.0923 |
Finally, the variation of serum PCSK9 in 30 patients
was measured from the start of DAA treatment to 52 weeks thereafter
(Fig. 3). The lower detection limit
of PCSK9-A was 32 ng/ml, and therefore concentrations under the
detection limit were considered as 32 ng/ml. The most noticeable
feature was the variation of PCSK9 at week 4. At week 4, PCSK9-A
was lower than that at any other period (Fig. 3A), and PCSK9-I was the highest
(Fig. 3C). In 10 patients, PCSK9-A at
week 4 was below the lower detection limit. PCSK9-A at week 52 was
higher than that during the treatment period (Fig. 3A), but PCSK9-I at week 52 did not
markedly differ from the other time points, with the exception of
the level at week 4 (Fig. 3C). At the
start of treatment, PCSK9-A was higher in the upregulation group
than that in the no change group, and at week 36, PCSK9-A was
moderately higher in the upregulation group than that in the no
change group (Fig. 3B). Meanwhile,
PCSK9-I at each time point did not differ between the groups
(Fig. 3D). An association between
PCSK9-A and lipids over weeks 0 and 52 was not detected (Table IV).
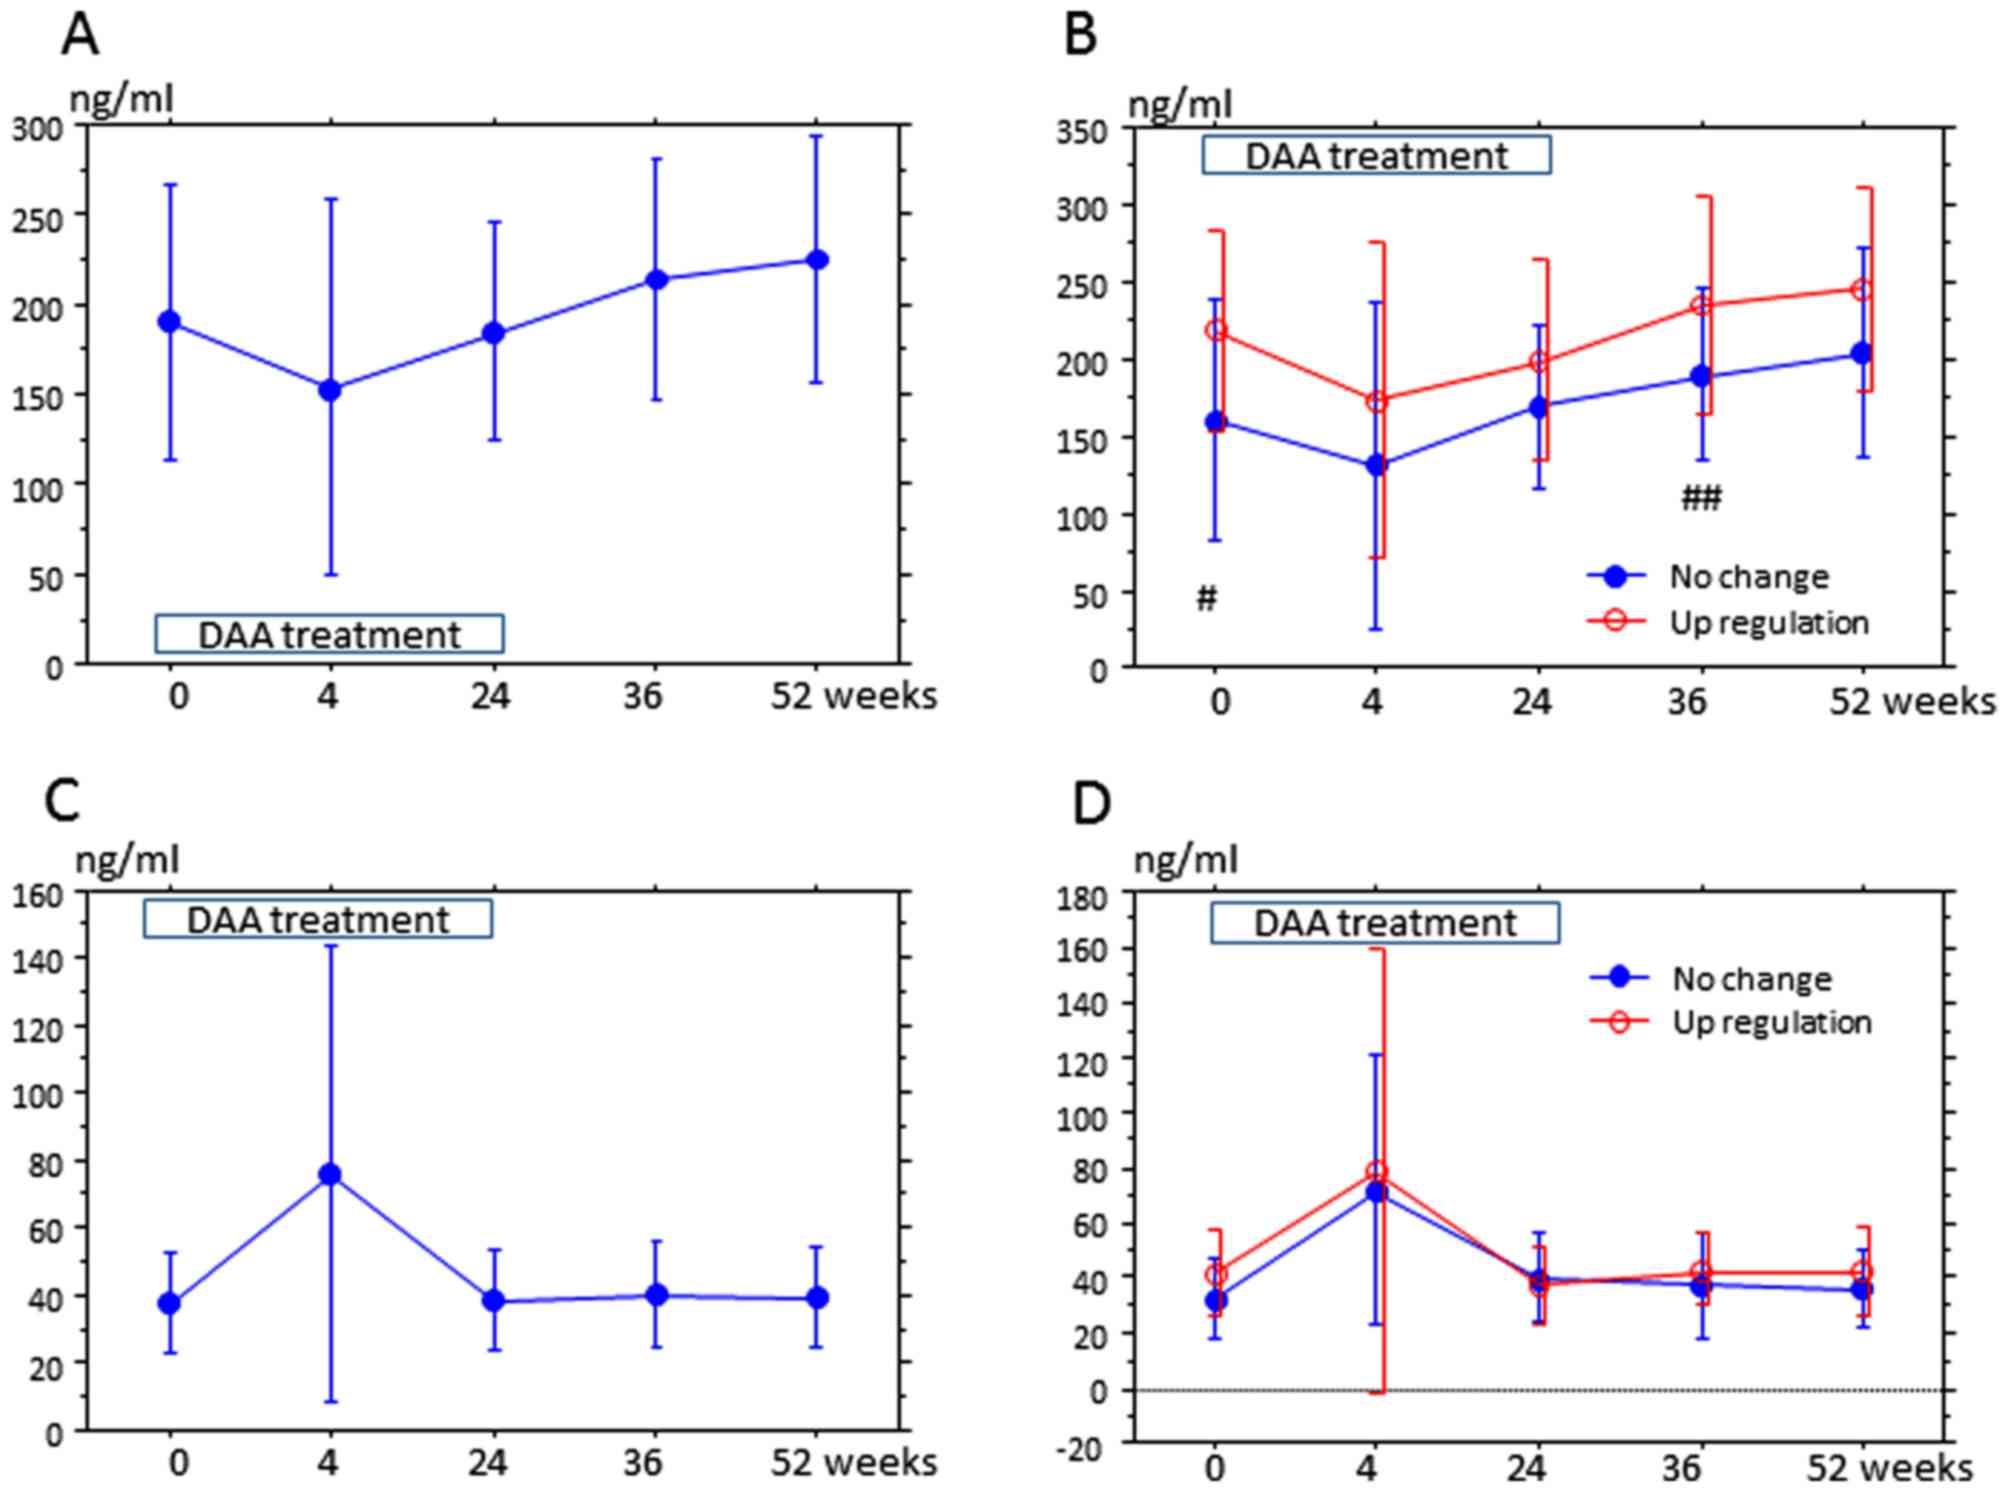 | Figure 3.Serum PCSK9 is associated with
upregulation of LDL at 52 weeks after treatment. Serum PCSK9 was
examined in 30 of 39 patients at 0, 4, 24, 36 and 52 weeks. The
y-axis is the mean PCSK9 concentration (ng/ml), and the x-axis is
the time after the start of treatment. Error bars represent the
standard deviation. (A and B) The trends of PCSK9-A; (C and D) the
trends of PCSK9-I. (A) Compared with other time points, PCSK9-A at
week 4 was significantly lower (week 0, P=0.0492; week 24, P=0.046;
week 36, P=0.046 and week 52, P=0.0111). PCSK9-A at week 52 was
higher than that at weeks 0 (P=0.0184), 4 (P=0.0009) and 24
(P=0.0038); these differences were also statistically significant.
(B) In the upregulation group, PCSK9-A at week 4 was lower than
that at week 0 (P=0.0725), week 36 (P=0.046), and week 52
(P=0.0111); additionally, PCSK9-A at week 24 was lower than that at
weeks 36 (P=0.0488) and 52 (P=0.0457). In the no change group,
PCSK9-A at week 52 was higher than that at weeks 0 (P=0.0725), 4
(P=0.0399) and 24 (P=0.0457). PCSK9-A at week 0 in the upregulation
group was higher than that in the no change group
(#P=0.0413), and PCSK9-A at week 36 in the upregulation
group was higher than that in the no change group
(##P=0.0697). (C) PCSK9-I at week 4 was higher than that
at weeks 0 (P=0.0055), 24 (P=0.0073) and 36 (P=0.0099); these
values were statistically significant. (D) In the upregulation
group, PCSK9-I at week 4 was higher than that at weeks 0 (P=0.09),
24 (P=0.0568) and 52 (P=0.0962). In the no change group, PCSK9-I at
week 4 was higher than that at weeks 0 (P=0.0159), 24 (P=0.0557),
36 (P=0.031) and 52 (P=0.0962). At each time point, PCSK9-I was not
significantly altered between the no change and upregulation
groups. PCSK9-A/I, protein convertase subtilisin/kexin
9-active/inactive; LDL, low-density lipoprotein. DAA, direct acting
anti-virals. |
| Table IV.Association between PCSK9 and
lipids. |
Table IV.
Association between PCSK9 and
lipids.
| | R | P-value |
|---|
| PCSK9-A at week
0 |
| LDL | -0.045 | 0.8193 |
| HDL | -0.045 | 0.6117 |
| TG | -0.091 | 0.4769 |
| LDL/HDL | 0.003 | 0.9873 |
| PCSK9-A at week
52 |
| LDL | 0.167 | 0.6724 |
| HDL | 0.021 | 0.6694 |
| TG | 0.082 | 0.5480 |
| LDL/HDL | 0.110 | 0.5817 |
| PCSK9-A increase
rate over weeks 0-52 |
| LDL | -0.210 | 0.1367 |
| HDL | -0.308 | 0.1145 |
| TG | 0.130 | 0.3332 |
| LDL/HDL | 0.115 | 0.4553 |
Relative miR122 was positively correlated with an
increase of PCSK9-A over several time frames (Table V). Relative miR122 at week 4 was
associated with an increase in PCSK9-A over 0-36 and 0-52 weeks
from the start of treatment (R=0.426, P=0.0112 and R=0.544,
P=0.0025, respectively). Relative miR122 at week 52 was also
positively correlated with an increase in PCSK9-A from week 0 to 4
(R=0.396, P=0.04).
| Table V.Association between relative miR122
and PCSK9-A levels. |
Table V.
Association between relative miR122
and PCSK9-A levels.
| Increase rate of
PCSK9-A | Relative
miR122 | R | P-value |
|---|
| From week 0 to
52 | 4 | 0.476 | 0.0112 |
|
24 | 0.239 | 0.2327 | |
|
36 | 0.216 | 0.2827 | |
|
52 | 0.126 | 0.5362 | |
| From week 0 to
36 | 4 | 0.544 | 0.0028 |
|
24 | 0.304 | 0.1243 | |
|
36 | 0.244 | 0.2242 | |
|
52 | 0.156 | 0.4421 | |
| From week 0 to
24 | 4 | 0.348 | 0.0751 |
|
24 | 0.355 | 0.0693 | |
|
36 | 0.244 | 0.2217 | |
|
52 | 0.036 | 0.8584 | |
| From week 0 to
4 | 4 | 0.159 | 0.4333 |
|
24 | -0.151 | 0.4561 | |
|
36 | 0.213 | 0.2895 | |
|
52 | 0.396 | 0.0400 | |
Discussion
In the present study, LDL in patients with HCV1b was
elevated by DAA treatment from 4 weeks after the start of treatment
to 6 months after the end of treatment. Body weight, HDL, TG and
insulin resistance were not altered during the 1-year period
including DAA treatment. HCV modulates cellular lipid metabolism to
enhance self-replication (4). HCV
infection has also been associated with reduced serum cholesterol
and β-lipoprotein levels; upon successful antiviral IFN treatment,
cholesterol and β-lipoprotein levels were restored to normal, which
suggested that HCV gene expression was responsible for the
alteration (24). DAA treatment, but
not IFN-based treatment, may also cause elevation of LDL in
HCV1b-cleared patients (9,10). A previous study (7) reported that HCV genotype 1 patients with
SVR receiving IFN-based treatment had elevated levels of TG, TC and
LDL, but stable levels of FPG, insulin and HOMA-IR. In particular,
HCV genotype 1 patients with SVR and no insulin resistance
developed elevated TG and insulin resistance (7). In future, variations in the lipid
profile caused by IFN and DAA treatment should be evaluated over
long term follow-up periods.
Several mechanisms associated with elevated LDL and
HCV clearance have been reported. HCV suppression during
sofosbuvir/ribavirin restored distal sterol metabolism, which
indicated viral interference with de novo lipogenesis or
selective retention by hepatocytes (8). The authors also observed an increase in
lanosterol sterol metabolite level in HCV genotype 3 infection, but
not genotype 2 infection, at 12 weeks after the start of treatment,
which further supported genotype-specific regulation (8). In another study, clearance of HCV using
an IFN-free antiviral regimen resulted in rapid changes in
peripheral and intrahepatic metabolic pathways, which implicated a
direct effect of HCV replication on lipid homeostasis (9). Hashimoto et al (10) reported that the increased rate of LDL
during the early period of sofosbuvir/ledipasvir treatment was
associated with a decrease in HCV core protein. Collectively these
reports have indicated that HCV inhibits production of cholesterol,
and that clearance of HCV may contribute to cholesterol
re-production. It may be speculated that the elevation in LDL
following DAA treatment in the present cohort may also have been
caused by the clearance of HCV. To examine the mechanism of this,
miR122 and PCSK9 were detected in serum.
Alterations in miR122 have been established to
affect important regulatory enzymes involved cholesterol
biosynthesis (3-hydroxy-3-methylglutaryl-CoA reductase), very-LDL
secretion (microsomal triglyceride transfer protein) and fatty acid
synthesis (sterol regulatory element-binding transcription factor
1, fatty acid synthase, acetyl-CoA-carboxylase 1 and 2 and
stearoyl-CoA desaturase). As none of these enzymes are believed to
be direct targets of miR122, the mechanism by which it affects
lipid metabolism remain unknown (25). Antagonism of miR122 in chimpanzees by
miravirsen (SPC3649) led to markedly lowered serum cholesterol in
the high-dose group (26). Our
previous report (27) revealed that
high expression of miR122 in liver at the start of interferon
treatment was associated SVR. Previous multivariate analysis has
indicated that miR122 is an independent predictor of SVR (26). miR122 protects the 5' terminal viral
sequences from nucleolytic degradation or from inducing an innate
response to the RNA terminus (28),
and also acts in an unconventional fashion to stabilize HCV-RNA and
slow its decay: an expansion of the usual repertoire of mechanisms
by which miRNAs modulate gene expression (29). In one study, IFN-β treatment for 30
min led to a significant reduction in the expression of
liver-specific miR122 in HCV non-infected HuH-7 cells (30); by contrast, treatment with
polyethylene glycolylated IFN-α for 4 h in HCV infected patients
did not lead to a reduction in the expression of miR122 in liver
biopsy samples (31). Our group
previously reported on a significant positive correlation between
the serum and hepatic levels of miR122(13). The current study did not determine any
significant differences in relative serum miR122 at each time
period; however increased LDL and relative miR122 levels were
somewhat correlated. To our knowledge, it has not been confirmed
whether DAA treatments induce variations in serum miR122 in SVR
patients. Since antagonism of miR122 can induce the suppression of
HCV replication and cholesterol synthesis (26), it may be speculated that upregulation
of miR122 in hepatocytes strengthens lipogenesis and thus elevates
levels of LDL in serum. However, the mechanism by which HCV
clearance increases miR122 is unknown.
Circulating mature PCSK9 (PCSK9-A) has the ability
to degrade cell-surface LDLR, which regulates the levels of
circulating LDL, while furin-cleaved PCSK9 (PCSK9-I) is the
inactive form (32). Here, DAA
treatment decreased PCSK9-A at week 4, while causing an increase in
PCSK9-I. At the start of treatment, PCSK9-A in the LDL upregulation
group was higher than that in the no change group. Acute clearance
of HCV infection in the liver (at week 4) has been reported to
induce an increase in cholesterol synthesis, and PCSK9-A was
downregulated to reduce LDL (33).
However, it may be speculated that continuous elevated LDL (24, 26
and 52 weeks after the start of DAA) induced recovery of PCSK9-A.
HCV downregulates PCSK9 at the protein level (16); therefore, PCSK9-A may be returned to
normal levels by HCV clearance. Since patients in the LDL
upregulation group had a higher level of PCSK9-A at the start of
DAA, it is likely that at 36 weeks later, downregulated LDLR levels
led to increased levels of LDL. Increased PCSK9 levels are
associated with metabolic disease (34), atherosclerosis (35) and hepatic steatosis (36). However, there appeared to be a lack of
reports on the relationship between miR122 and PCSK9. In the
current study, relative miR122 at week 4 was associated with an
increase in PCSK9-A at 0 to 36 weeks and 0 weeks to the end point.
Interestingly, changes in miR122 occurred prior to changes in
PCSK9-A; future exploration of the associated mechanism in
hepatocytes would be of significance. Additionally, LDLRs are the
most effective components for LDL metabolism along with PCSK9-A
(32,33). However, LDLR levels were not evaluated
in the current study. In future studies, LDLR expression should be
investigated for the evaluation of mechanisms resulting in the
elevation of LDL following DAA treatment.
In conclusion, DAA treatment for HCV resulted in
elevated LDL levels, but no changes in HDL, TG, insulin resistance
or body weight. Relative miR122 and PCSK9-A in serum appeared to
have some association with the upregulation of LDL. Since both
miR122 and PCSK9 had association with cholesterol mechanism and HCV
replication, it was speculated that clearance of HCV influenced the
increase in LDL through variations in miR122 and PCSK9-A. Increased
LDL/HDL ratio (37) and
PCSK9(35) are established risk
factors for atherosclerosis. A previous report revealed that there
are lower levels of LDL-cholesterol and a reduced intima-media
thickness (IMT) in HCV patients in comparison with a healthy
population (38). Thus, following
SVR, it is possible that elevated LDL-cholesterol may increase the
IMT. Additionally, the known atherosclerotic markers of hepatic
steatosis (39), IMT (38,40) and
small-dense LDL (40) in patients
with SVR should also be evaluated in the future.
Acknowledgements
Not applicable.
Funding
No funding was received.
Aavailability of data and materials
The datasets used and/or analysed during the current
study are available from the corresponding author on reasonable
request.
Authors' contributions
TI wrote the paper, analyzed the data, and designed
the study. NT, HM, SM, JN and YT made substantial contributions to
the acquisition of data. YM, HA, TH, HY, RU, NH, SN, HT, SS and KN
made substantial contributions to interpreting the data.
Ethics approval and consent to
participate
Informed consent was obtained from each patient
included in the study approval of the study by the Human Research
Ethics Committee of Nagasaki Harbor Medical Center (approval no.
NIRB 1609002).
Patient consent for publication
Not applicable.
Competing interests
The authors declare that they have no competing
interests.
References
|
1
|
Negro F: Abnormalities of lipid metabolism
in hepatitis C virus infection. Gut. 59:1279–1287. 2010.PubMed/NCBI View Article : Google Scholar
|
|
2
|
Cacoub P, Comarmond C, Domont F, Savey L,
Desbois AC and Saadoun D: Extrahepatic manifestations of chronic
hepatitis C virus infection. Ther Adv Infect Dis. 3:3–14.
2016.PubMed/NCBI View Article : Google Scholar
|
|
3
|
Ferri C, Sebastiani M, Giuggioli D, Colaci
M, Fallahi P, Piluso A, Antonelli A and Zignego AL: Hepatitis C
virus syndrome: A constellation of organ- and non-organ specific
autoimmune disorders, B-cell non-Hodgkin's lymphoma, and cancer.
World J Hepatol. 7:327–343. 2015.PubMed/NCBI View Article : Google Scholar
|
|
4
|
Syed GH, Amako Y and Siddiqui A: Hepatitis
C virus hijacks host lipid metabolism. Trends Endocrinol Metab.
21:33–40. 2010.PubMed/NCBI View Article : Google Scholar
|
|
5
|
Chayama K, Takahashi S, Toyota J, Karino
Y, Ikeda K, Ishikawa H, Watanabe H, McPhee F, Hughes E and Kumada
H: Dual therapy with the nonstructural protein 5A inhibitor,
daclatasvir, and the nonstructural protein 3 protease inhibitor,
asunaprevir, in hepatitis C virus genotype 1b-infected null
responders. Hepatology. 55:742–748. 2012.PubMed/NCBI View Article : Google Scholar
|
|
6
|
Wang HL, Lu X, Yang X and Xu N:
Effectiveness and safety of daclatasvir plus asunaprevir for
hepatitis C virus genotype 1b: Systematic review and meta-analysis.
J Gastroenterol Hepatol. 32:45–52. 2017.PubMed/NCBI View Article : Google Scholar
|
|
7
|
Chang ML, Tsou YK, Hu TH, Lin CH, Lin WR,
Sung CM, Chen TH, Cheng ML, Chang KC, Chiu C, et al: Distinct
patterns of the lipid alterations between genotype 1 and 2 chronic
hepatitis C patients after viral clearance. PLoS One.
9(e104783)2014.PubMed/NCBI View Article : Google Scholar
|
|
8
|
Younossi ZM, Stepanova M, Estep M, Negro
F, Clark PJ, Hunt S, Song Q, Paulson M, Stamm LM, Brainard DM, et
al: Dysregulation of distal cholesterol biosynthesis in association
with relapse and advanced disease in CHC genotype 2 and 3 treated
with sofosbuvir and ribavirin. J Hepatol. 64:29–36. 2016.PubMed/NCBI View Article : Google Scholar
|
|
9
|
Meissner EG, Lee YJ, Osinusi A, Sims Z,
Qin J, Sturdevant D, McHutchison J, Subramanian M, Sampson M,
Naggie S, et al: Effect of sofosbuvir and ribavirin treatment on
peripheral and hepatic lipid metabolism in chronic hepatitis C
virus, genotype 1-infected patients. Hepatology. 61:790–801.
2015.PubMed/NCBI View Article : Google Scholar
|
|
10
|
Hashimoto S, Yatsuhashi H, Abiru S,
Yamasaki K, Komori A, Nagaoka S, Saeki A, Uchida S, Bekki S,
Kugiyama Y, et al: Rapid increase in serum low-density lipoprotein
cholesterol concentration during hepatitis C interferon-free
treatment. PLoS One. 11(e0163644)2016.PubMed/NCBI View Article : Google Scholar
|
|
11
|
Janssen HL, Reesink HW, Lawitz EJ, Zeuzem
S, Rodriguez-Torres M, Patel K, van der Meer AJ, Patick AK, Chen A,
Zhou Y, et al: Treatment of HCV infection by targeting microRNA. N
Engl J Med. 368:1685–1694. 2013.PubMed/NCBI View Article : Google Scholar
|
|
12
|
Esau C, Davis S, Murray SF, Yu XX, Pandey
SK, Pear M, Watts L, Booten SL, Graham M, McKay R, et al: miR-122
regulation of lipid metabolism revealed by in vivo antisense
targeting. Cell Metab. 3:87–98. 2006.PubMed/NCBI View Article : Google Scholar
|
|
13
|
Miyaaki H, Ichikawa T, Kamo Y, Taura N,
Honda T, Shibata H, Milazzo M, Fornari F, Gramantieri L, Bolondi L
and Nakao K: Significance of serum and hepatic microRNA-122 levels
in patients with non-alcoholic fatty liver disease. Liver Int.
34:e302–e307. 2013.PubMed/NCBI View Article : Google Scholar
|
|
14
|
Cunningham D, Danley DE, Geoghegan KF,
Griffor MC, Hawkins JL, Subashi TA, Varghese AH, Ammirati MJ, Culp
JS, Hoth LR, et al: Structural and biophysical studies of PCSK9 and
its mutants linked to familial hypercholesterolemia. Nat Struct Mol
Biol. 14:413–419. 2007.PubMed/NCBI View
Article : Google Scholar
|
|
15
|
Labonté P, Begley S, Guévin C, Asselin MC,
Nassoury N, Mayer G, Prat A and Seidah NG: PCSK9 impedes hepatitis
C virus infection in vitro and modulates liver CD81 expression.
Hepatology. 50:17–24. 2009.PubMed/NCBI View Article : Google Scholar
|
|
16
|
Syed GH, Tang H, Khan M, Hassanein T, Liu
J and Siddiqui A: Hepatitis C virus stimulates low-density
lipoprotein receptor expression to facilitate viral propagation. J
Virol. 88:2519–2529. 2014.PubMed/NCBI View Article : Google Scholar
|
|
17
|
Bridge SH, Sheridan DA, Felmlee DJ,
Crossey MM, Fenwick FI, Lanyon CV, Dubuc G, Seidah NG, Davignon J,
Thomas HC, et al: PCSK9, apolipoprotein E and lipoviral particles
in chronic hepatitis C genotype 3: evidence for genotype-specific
regulation of lipoprotein metabolism. J Hepatol. 62:763–770.
2015.PubMed/NCBI View Article : Google Scholar
|
|
18
|
Matthews DR, Hosker JP, Rudenski AS,
Naylor BA, Treacher DF and Turner RC: Homeostasis model assessment:
Insulin resistance and beta-cell function from fasting plasma
glucose and insulin concentrations in man. Diabetologia.
28:412–419. 1985.PubMed/NCBI
|
|
19
|
Asano T, Kawamura M, Watanabe T, Abe M,
Chin R, Miyazaki S and Hirata Y: Indices of urinary and serum
C-peptide corrected with fasting plasma glucose for decision-making
of insulin therapy in type 2 diabetes-validation and comparison. J
Jpn Diabetes Soc. 51:759–763. 2008. View Article : Google Scholar
|
|
20
|
DeLong DM, DeLong ER, Wood PD, Lippel K
and Rifkind BM: A comparison of methods for the estimation of
plasma low- and very low-density lipoprotein cholesterol. The Lipid
Research Clinics Prevalence Study. JAMA. 256:2372–2377.
1986.PubMed/NCBI View Article : Google Scholar
|
|
21
|
Hori M, Ishihara M, Yuasa Y, Makino H,
Yanagi K, Tamanaha T, Kishimoto I, Kujiraoka T, Hattori H and
Harada-Shiba M: Removal of plasma mature and furin-cleaved
proprotein convertase subtilisin/kexin 9 by low-density
lipoprotein-apheresis in familial hypercholesterolemia: Development
and application of a new assay for PCSK9. J Clin Endocrinol Metab.
100:E41–E49. 2015.PubMed/NCBI View Article : Google Scholar
|
|
22
|
Livak KJ and Schmittgen TD: Analysis of
relative gene expression data using real-time quantitative PCR and
the 2(-Delta Delta C(T)) method. Methods. 25:402–408.
2001.PubMed/NCBI View Article : Google Scholar
|
|
23
|
Sohn W, Kim J, Kang SH, Yang SR, Cho JY,
Cho HC, Shim SG and Paik YH: Serum exosomal microRNAs as novel
biomarkers for hepatocellular carcinoma. Exp Mol Med.
47(e184)2015.PubMed/NCBI View Article : Google Scholar
|
|
24
|
Negro F and Sanyal AJ: Hepatitis C virus,
steatosis and lipid abnormalities: clinical and pathogenic data.
Liver Int. 29 (Suppl 2):26–37. 2009.PubMed/NCBI View Article : Google Scholar
|
|
25
|
Rotllan N, Price N, Pati P, Goedeke L and
Fernández-Hernando C: microRNAs in lipoprotein metabolism and
cardiometabolic disorders. Atherosclerosis. 246:352–360.
2016.PubMed/NCBI View Article : Google Scholar
|
|
26
|
Lanford RE, Hildebrandt-Eriksen ES, Petri
A, Persson R, Lindow M, Munk ME, Kauppinen S and Ørum H:
Therapeutic silencing of microRNA-122 in primates with chronic
hepatitis C virus infection. Science. 327:198–201. 2010.PubMed/NCBI View Article : Google Scholar
|
|
27
|
Kamo Y, Ichikawa T, Miyaaki H, Uchida S,
Yamaguchi T, Shibata H, Honda T, Taura N, Isomoto H, Takeshima F
and Nakao K: Significance of miRNA-122 in chronic hepatitis C
patients with serotype 1 on interferon therapy. Hepatol Res.
45:88–96. 2015.PubMed/NCBI View Article : Google Scholar
|
|
28
|
Machlin ES, Sarnow P and Sagan SM: Masking
the 5' terminal nucleotides of the hepatitis C virus genome by an
unconventional microRNA-target RNA complex. Proc Natl Acad Sci U S
A. 108:3193–3198. 2011.PubMed/NCBI View Article : Google Scholar
|
|
29
|
Shimakami T, Yamane D, Jangra RK, Kempf
BJ, Spaniel C, Barton DJ and Lemon SM: Stabilization of hepatitis C
virus RNA by an Ago2-miR-122 complex. Proc Natl Acad Sci U S A.
109:941–946. 2012.PubMed/NCBI View Article : Google Scholar
|
|
30
|
Pedersen IM, Cheng G, Wieland S, Volinia
S, Croce CM, Chisari FV and David M: Interferon modulation of
cellular microRNAs as an antiviral mechanism. Nature. 449:919–922.
2007.PubMed/NCBI View Article : Google Scholar
|
|
31
|
Sarasin-Filipowicz M, Krol J, Markiewicz
I, Heim MH and Filipowicz W: Decreased levels of microRNA miR-122
in individuals with hepatitis C responding poorly to interferon
therapy. Nat Med. 15:31–33. 2009.PubMed/NCBI View Article : Google Scholar
|
|
32
|
Benjannet S, Rhainds D, Hamelin J,
Nassoury N and Seidah NG: The proprotein convertase (PC) PCSK9 is
inactivated by furin and/or PC5/6A: Functional consequences of
natural mutations and post-translational modifications. J Biol
Chem. 281:30561–30572. 2006.PubMed/NCBI
|
|
33
|
Lagace TA: PCSK9 and LDLR degradation:
Regulatory mechanisms in circulation and in cells. Curr Opin
Lipidol. 25:387–393. 2014.PubMed/NCBI View Article : Google Scholar
|
|
34
|
Girona J, Ibarretxe D, Plana N,
Guaita-Esteruelas S, Amigo N, Heras M and Masana L: Circulating
PCSK9 levels and CETP plasma activity are independently associated
in patients with metabolic diseases. Cardiovasc Diabetol.
15(107)2016.PubMed/NCBI View Article : Google Scholar
|
|
35
|
Wang S, Cheng ZY, Zhao ZN, Quan XQ, Wei Y,
Xia DS, Li JQ and Hu JL: Correlation of serum PCSK9 in CHD patients
with the severity of coronary arterial lesions. Eur Rev Med
Pharmacol Sci. 20:1135–1139. 2016.PubMed/NCBI
|
|
36
|
Ruscica M, Ferri N, Macchi C, Meroni M,
Lanti C, Ricci C, Maggioni M, Fracanzani AL, Badiali S, Fargion S,
et al: Liver fat accumulation is associated with circulating PCSK9.
Ann Med. 48:384–391. 2016.PubMed/NCBI View Article : Google Scholar
|
|
37
|
Tamada M, Makita S, Abiko A, Naganuma Y,
Nagai M and Nakamura M: Low-density lipoprotein cholesterol to
high-density lipoprotein cholesterol ratio as a useful marker for
early-stage carotid atherosclerosis. Metabolism. 59:653–657.
2010.PubMed/NCBI View Article : Google Scholar
|
|
38
|
Miyajima I, Kawaguchi T, Fukami A, Nagao
Y, Adachi H, Sasaki S, Imaizumi T and Sata M: Chronic HCV infection
was associated with severe insulin resistance and mild
atherosclerosis: A population-based study in an HCV hyperendemic
area. J Gastroenterol. 48:93–100. 2013.PubMed/NCBI View Article : Google Scholar
|
|
39
|
Negro F: Facts and fictions of HCV and
comorbidities: Steatosis, diabetes mellitus, and cardiovascular
diseases. J Hepatol. 61 (Suppl 1):S69–S78. 2014.PubMed/NCBI View Article : Google Scholar
|
|
40
|
Shen H, Xu L, Lu J, Hao T, Ma C, Yang H,
Lu Z, Gu Y, Zhu T and Shen G: Correlation between small dense
low-density lipoprotein cholesterol and carotid artery intima-media
thickness in a healthy Chinese population. Lipids Health Dis.
14(137)2015.PubMed/NCBI View Article : Google Scholar
|