Introduction
Metabolic syndrome (MetS) describes a complex
metabolic condition, involving abnormal adipose deposition and
function, dyslipidemia and hyperglycemia (1). To identify novel therapeutic strategies,
microRNAs (miRNAs or miRs) have received attention as potential
targets due to their involvement in gene networks regulating the
metabolism, including lipid and glucose homeostasis (2). Increasing evidence suggests that
circulating miRNAs are involved in the regulation of obesity,
diabetes and MetS (3-5).
Evaluation of connections between circulating miRNA levels with
MetS and insulin sensitivity may lead to novel insight into the
pathophysiology of the condition.
Mammalian circulating miRNAs are packaged inside
lipid or lipid-protein complexes, such as microvesicles, exosomes
or apoptotic bodies (6). Urinary
miRNAs are present in cells originating from the kidney or in cells
that infiltrated the renal tissue and were excreted into the urine
(7). Additionally, miRNAs bound to
proteins or incorporated in extracellular vesicles may be released
from kidney cells or enter the urine by glomerular filtration
(8). Previous literature has
demonstrated that endogenous urinary miRNAs are sufficiently stable
and quantifiable to serve as clinical biomarkers (9). Mitchell et al (10) reported that the abundance of miRNAs in
urine and plasma were strongly correlated.
Considering that clinical specimens of urinary
samples are more plentiful in most clinical sample repositories
than plasma samples, urinary samples are suitable for miRNA
investigations to replace the need for the analysis of certain
blood-based biomarkers (11). In
diabetic rodent models and patients with diabetes, an increase in
miR-29 is reported for skeletal muscle, liver, pancreas and white
adipose tissues (12-16).
Liang et al (17) reported
that miR-29a is associated with decreased fasting blood glucose
levels through negatively regulating hepatic gluconeogenesis in
db/db diabetic and diet-induced obese mouse models. Interestingly,
an increase in miR-29 levels is observed in the serum of children
diagnosed with type 1 and adults diagnosed with type 2 diabetes
mellitus (18). In the current study
it was assessed if a high level of urinary miR-29a-3p correlated
with the incidence of MetS. The present study aimed to investigate
the potential prognostic value and regulatory mechanism of urinary
miR-29a-3p level in patients with MetS, which may allow clinicians
to identify a more appropriate treatment for patients to improve
therapeutic outcomes.
Materials and methods
Study subjects
The study was conducted between March and May 2010
in the Caihe community of Hangzhou (Zhejiang, China). A total of
624 eligible Han Chinese participants (age, 40-65 years) were
recruited. The Medical Ethics Committee of Sir Run Run Shaw
Hospital affiliated to School of Medicine, Zhejiang University
(Hangzhou, China) approved the present study. Written informed
consent was obtained from the patients. Participants were
56.80±6.54 years and 51.25% were male. All patients completed a
population-based cross-sectional survey and were assigned a number.
Random numbers were generated electronically and 40 patients with
MetS (56.78±6.69 years; 45% male) and 40 control subjects
(56.83±6.00 years; 57.5% male) were selected. Baseline
anthropometric and metabolic measures were recorded using
standardized methods (19,20). Participants were interviewed
face-to-face, completing a questionnaire regarding demographic
data, life style, present and past illness, medical therapy and
other health-associated information. All measurements were referred
to as previously reported (19,20).
Diagnosis of MetS
MetS was diagnosed according to criteria established
by the Joint Committee for Developing Chinese Guidelines on
Prevention and Treatment of Dyslipidemia in Adults (21). Individuals with ≥3 of the following
abnormalities were considered to have MetS: Central obesity [waist
circumference (WC), >90 cm for men and >85 cm for women];
hypertriglyceridemia (≥1.70 mmol/l); high density
lipoprotein-cholesterol (HDL-c; <1.04 mmol/l); blood pressure
(BP; ≥130/85 mmHg or ongoing treatment for hypertension); and
hyperglycemia [fasting plasma glucose (FPG) ≥6.1 mmol/l or 2 h
postprandial glucose ≥7.8 mmol/l]. Patients suffering from abnormal
renal function or renal dysfunction at the time of recruitment were
excluded. Patients fulfilling none of the above criteria were
selected as healthy controls.
Patient data
Baseline anthropometric and metabolic measures were
collected from all patients. Anthropometric data included height,
weight, WC, hip circumference, heart rate and BP. The body mass
index (BMI) was calculated as weight (kg)/[height (m)]2.
Systolic (S) BP and diastolic BP were calculated as the mean of
three measurements, using a mercury sphygmomanometer at 3-min
intervals. The body fat (%) was assessed using a Tanita Body
Composition Analyzer TBF-300 (Tanita Corporation, Tokyo, Japan).
All subjects underwent abdominal magnetic resonance imaging (MRI)
using a whole-body imaging system (SMT-100; Shimadzu Corporation,
Kyoto, Japan) with TR-500 and TE-200 of spin-echo sequences
(22). MRI scans were performed at
the level of umbilicus between L4 and L5 with the subject in the
supine position. Abdominal visceral fat area (VFA) and subcutaneous
fat area (SFA) were calculated using Slice O'matic software
(version 4.2; TomoVision, Magog, Canada). Following overnight
fasting, blood and urine samples were collected; 5 ml blood were
stored in collection tubes with EDTA as an anticoagulant.
FPG, 2 h postprandial glucose, triglyceride (TG),
total cholesterol, aspartate aminotransferase, alanine
aminotransferase, low-density lipoprotein-cholesterol (LDL-c) and
HDL-c were measured using an auto-analyzer (Abbott Pharmaceutical
Co. Ltd., Lake Bluff, IL, USA). Fasting serum insulin levels
(FINS), 2h postprandial insulin levels were measured by using an
insulin detection kit (cat. no. 2400218; Beijing North Institute
Biological Technology, Beijing, China). Insulin sensitivity was
assessed by homeostasis model assessment for insulin resistance
(HOMA-IR) based on FPG and insulin measurements as follows: [FINS
(mU/l) x FPG (mmol/l) /22.5(23).
Glycosylated hemoglobin A1c (HbA1c) values were tested using
ion-exchange high-performance liquid chromatography VARIANT II
(D-100TM Hemoglobin Testing System; Bio-Rad Laboratories, Inc.,
Hercules, CA, USA) as described previously (24).
Urinary miRNA microarray
Genome-wide urinary miRNA profiles were detected
using a microarray in whole urinary samples from 4 patients with
MetS and 4 controls. Patients for the microarray analysis were
selected at random out of the 40 patients previously identified per
group. Comprehensive coverage was ensured using the
TaqMan® Array Human MicroRNA Cards B v3 (cat. no.
4444910; Thermo Fisher Scientific, Inc., Waltham, MA, USA),
resulting in a total of 377 unique assays specific for human
miRNAs. A total of 8 RNA samples were analyzed by Kangchen BioTech
Co., Ltd. (Shanghai, China) according to manufacturers'
instructions.
Urinary miRNA detection
Total RNA was extracted from urine using miRNeasy
kit (Qiagen Inc.) and purified using the Urine RNA Purification kit
(Abnova, Taipei, Taiwan) according to manufacturers' instructions.
For each reaction, 0.5-1 µg of total RNA isolated from 5-10 ml of
whole urine samples was used. MiDETECT A TrackTM miRNA
RT-PCR Start kit (R10048.3; Guangzhou RiboBio Co., Ltd., Guangzhou,
China) was used for validating miR-29a-3p and U6 expression via
stem-loop-based reverse transcription-quantitative polymerase chain
reaction (RT-qPCR) following the manufacturers' instructions and
the following thermocycling conditions: 95˚C for 5 min followed by
35 cycles of 95˚C for 10 sec, 60˚C for 20 sec and 70˚C for 10 sec.
miRNA expression was normalized to U6 using the 2-ΔΔCq
method (25). Primer details are
presented in Table I.
 | Table IPolymerase chain reaction assays
primers. |
Table I
Polymerase chain reaction assays
primers.
| Gene | Primer sequences
(5'-3') |
|---|
| miR-29a-3p | |
|
RT |
GTCGTATCCAGTGCAGGGTCCGAGGTATTCGCACTGGATACGACTAACCG |
|
qPCR
forward |
GCGCGTAGCACCATCTGAAAT |
|
qPCR
reverse |
CAGTGCAGGGTCCGAGGT |
| U6 | |
|
RT |
TCGTATCCAGTGCAGGGTCCGAGGTATTCGCACTGGATACGACAAAATATG |
|
qPCR
forward |
GCGCGTCGTGAAGCGTTC |
|
qPCR
reverse |
CAGTGCAGGGTCCGAGGT |
Cell culture and treatments
293 cells were selected for the transfection
experiments. Cells were purchased from the American Type Culture
Collection (Manassas, VA, USA) and cultured in Dulbecco's modified
Eagle's medium (DMEM; 11965-092; Thermo Fisher Scientific, Inc.)
containing 10% fetal bovine serum (FBS; Bio-Rad Laboratories, Inc.)
and 100 IU/ml penicillin/streptomycin (Sigma-Aldrich; Merck KGaA,
Darmstadt, Germany) at 37˚C with 5% CO2.
Cholesterol-conjugated 2'-O-methyl-modified mimics
agomir-29a-3p (cat. no. miR40000210), agomir-NC (cat. no.
miR04101), antagomir-29a-3p (cat. no. miR30000256) and antagomir-NC
(cat. no. miR03101) were synthesized by Guangzhou RiboBio Co., Ltd.
and used in transfection experiments. 293 cells were grown to
30-40% confluence and agomir-29a-3p (100 nM) or antagomir-29a-3p
(200 nM) or respective controls were transiently transfected using
riboFECTTM CP transfection kit (cat. no. R10035.3; RiboBio Co.,
Ltd, Guangzhou, China) according to the manufacturer's instructions
(26). Cells were harvested at 48 h
following treatment and RT-qPCR analysis was performed to assess
transfection efficiency.
Dual-luciferase reporter assays
The homo sapiens insulin-like growth factor 1
(IGF1) 3'-untranslated region (3'UTR) was amplified from 293 cells
and cloned into the XhoI/HindIII sites of the
pGL4-basic vector (Promega Corporation, Madison, WI, USA). Cloning
products were verified by sequencing and primer sequences were as
follows: Forward, 5'-CCGCTCGAGACC ATCTCATGCTCTGTGGC-3' and reverse,
5'-CCCAAG CTTCTTTGCAAGGGAGGGGCATA-3'. 293 cells (5x10⁴)
were seeded in 24-well plates 24 h prior to transfection. IGF1
plasmid (500 ng) and internal control Renilla luciferase
plasmid (200 ng) were co-transfected using Lipofectamine 2000
(Invitrogen; Thermo Fisher Scientific, Inc.). Following 6-8 h, 100
nM agomir-29a-3p and agomir-NC were transiently transfected into
the cells using the riboFECTTM CP transfection kit. Cells were
harvested at 48 h post-transfection and assayed for luciferase
activity using the Dual-Luciferase Reporter Assay System (Promega
Corporation). Activities were normalized to Renilla and all
experiments were repeated four times.
RNA extraction and RT-qPCR
Total RNA was isolated from 293 cells using TRIzol
reagent (Invitrogen; Thermo Fisher Scientific, Inc.) and RT was
performed using a reverse transcription reagent kit (Takara Bio,
Inc., Otsu, Japan) to generate the cDNA and samples were incubated
for 30 min at 16˚C, followed by 30 min at 42˚C and 5 min at 85˚C.
qPCR was performed using a PCR kit containing SYBR Green (Takara
Bio, Inc.) and a 7500 real-time PCR detection system (Applied
Biosystems; Thermo Fisher Scientific, Inc.). Thermocycling
conditions were as follows: 95˚C for 30 sec followed by 40 cycles
of 95˚C for 5 sec, 60˚C for 30 sec and 70˚C for 10 sec. IGF1
(forward, 5'-GGAGGCTGGAGATGTATTGC-3'and reverse,
5'-ACTTGCTTCTGTCCCCTCCT-3') expression was normalized to GAPDH
(forward, 5'-AGCAGTCCCGTACAC TGGCAAAC-3'and reverse,
5'-TCTGTGGTGATGTAAAT GTCCTCT-3') and samples were quantified as
described above. Measurements were conducted in triplicate.
Western blotting
Whole cell extracts were obtained by lysing cells in
buffer (50 mM Tris pH 7.4, 150 mM NaCl, 1 mM EDTA, 10 mM sodium
pyrophosphate, 0.5% Triton X-100, 1 mM sodium vanadate and 25 mM
sodium fluoride) containing protease inhibitors (5 µg/ml
phenylmethylsulfonyl fluoride, 0.5 µg/ml leupeptin, 0.7 µg/ml
pepstatin and 0.5 µg/ml aprotinin). Protein concentrations were
determined using a bicinchoninic acid protein assay. Equal amounts
of protein (50 µg) were denatured by boiling, separated using 10%
SDS-PAGE gels and transferred to polyvinylidene membranes.
Membranes were blocked with 5% non-fat milk for 1 h at room
temperature. Membranes were then incubated with primary antibodies,
including polyclonal rabbit anti-IGF1 (cat. no. ab40657; 1:1,000;
Abcam, Cambridge, UK) and monoclonal mouse anti-β-actin (cat. no.
A5316; 1:5,000; Sigma-Aldrich; Merck KGaA) at 4˚C overnight
followed by incubation with horseradish peroxidase-conjugated goat
anti-rabbit/mouse secondary IgG antibodies (cat. nos. ab6721 and
ab6789; 1:10,000; Abcam) at room temperature for 1 h.
Immunoreactive proteins were detected using a chemiluminescent
assay kit (EMD Millipore, Billerica, MA, USA). Quantity One
software (v4.6.2; Bio-Rad Laboratories, Inc.) was used to quantify
expression levels and normalize to β-actin.
Bioinformatics databases
To search for the enrichment of specific target
genes associated with insulin signaling and the glucose and lipid
metabolism, the Database for Annotation, Visualization and
Integrated Discovery (https://david.ncifcrf.gov) were used. To
predict target genes of miR-29a-3p, bioinformatics databases
miRanda (http://www.microrna.org), mirBase
(http://www.mirbase.org) and Targetscan
(http://www.targetscan.org) were
used.
Statistical analysis
For the patient study, all the continuous variables
were tested for normal distribution and normally distributed
variables are expressed as the mean ± standard deviation and
variables with a skewed distribution are presented as the median
with 25-75% interquartile range. Categorical variables were
presented as frequencies and percentages. Differences in baseline
characteristics were analyzed by two-sided Student's t-test for
continuous variables and chi-square test for categorical variables.
Correlation between urinary miR-29a-3p and metabolic parameters was
determined using a Spearman correlation analysis. MetS incidence at
different levels of urinary miR-29a-3p was analyzed by chi-square
test. Logistic regression analysis and multiple stepwise regression
analysis were applied in the analysis of the adjusted variables. A
receiver operating characteristic (ROC) analysis was conducted and
areas under the curve and optimal sensitivity and specificity
levels were calculated. SPSS 17.0 (SPSS, Inc., Chicago, IL, USA)
was used for statistical analyses. Cell experiments were evaluated
using independent two-sided Student's t-test and one-way analysis
of variance followed by Tukey's test for pairwise or multiple group
comparisons, respectively. Data are presented as the mean ±
standard deviation, representative of three replicates. P<0.05
was considered to indicate a statistically significant
difference.
Results
Baseline patient characteristics
Anthropometric and metabolic characteristics of the
study population at baseline are presented in Table II. Participants with MetS exhibited
increased cardiovascular risk factors compared with the controls,
including significantly higher BMI, waist-to-hip ratio, body fat,
FINS levels, HOMA-IR, HbA1c, SFA, VFA, and MetS indicators,
including significantly higher WC, blood glucose, TG, BP and
significantly lower HDL-c (P<0.05).
| Table IIClinical characteristics of the
participants included in the validation study. |
Table II
Clinical characteristics of the
participants included in the validation study.
| Characteristic | Total | Control | MetS | P-value |
|---|
| N | 80 | 40 | 40 | |
| Age (years) | 56.80±6.54 | 56.83±6.00 | 56.78±6.69 | 0.743 |
| Male, n(%) | 41(51.25) | 18(45.00) | 23(57.50) | 0.532 |
| Current smoker,
n(%) | 34(42.5) | 8(10) | 26(32.5) | <0.001 |
| Alcohol drinker,
n(%) | 25(31.25) | 13(16.25) | 12(15) | 0.117 |
| BMI
(kg/m2) | 23.78±3.04 | 21.99±2.24 | 25.28±2.50 | <0.001 |
| WC (cm) |
80.54(68.13-91.00) |
73.00(68.13-83.00) |
86.50(83.25-91.00) | <0.001 |
| WHR |
0.88(0.80-0.97) |
0.85(0.80-0.89) |
0.92(0.89-0.97) | <0.001 |
| Body fat (%) | 28.68±6.47 | 26.26±5.65 | 30.87±6.39 | 0.001 |
| SBP (mmHg) |
123.41(110.00-141.42) |
116.67(110.00-123.30) |
124.67(118.84-141.42) | <0.001 |
| DBP (mmHg) | 81.34±9.21 | 78.32±7.88 | 84.10±8.71 | <0.001 |
| HbA1c (%) |
5.65(5.30-6.00) |
5.50(5.13-5.70) |
5.70(5.40-6.20) | 0.012 |
| ALT (U/l) |
18.00(14.00-26.00) |
17.70(10.90-25.50) |
29.10(16.90-33.30) | 0.001 |
| AST (U/l) |
19.00(16.00-23.00) |
19.70(14.70-24.70) |
23.50(17.50-29.50) | 0.174 |
| FPG (mmol/l) |
5.23(4.60-5.52) |
6.71(6.44-7.40) |
7.42(6.85-7.81) | 0.002 |
| 2 h postprandial
glucose (mmol/l) |
6.03(4.82-7.11) | 7.58(6.4-8.4) |
10.17(7.65-15.26) | <0.001 |
| FINS (µU/ml) |
10.66(8.18-13.87) | 11.48±3.18 | 18.23±4.01 | <0.001 |
| 2 h postprandial
insulin (µU/ml) |
57.25(37.32-87.80) |
54.35(36.39-83.57) |
81.68(47.75-155.18) | <0.001 |
| HOMA-IR |
2.77(1.73-3.13) |
2.10(1.68-2.87) |
3.52(2.55-5.26) | <0.001 |
| TC (mmol/l) | 5.52±1.02 | 5.37±0.88 | 5.74±1.07 | 0.301 |
| LDL-c (mmol/l) |
2.25(2.00-2.64) |
2.34(1.90-2.78) |
2.29(1.71-2.87) | 0.807 |
| HDL-c (mmol/l) |
1.31(1.03-1.66) |
1.65(1.35-1.95) |
1.10(0.86-1.34) | <0.001 |
| TG (mmol/l) |
1.57(0.88-2.21) |
1.03(0.61-1.45) |
3.23(1.81-3.26) | <0.001 |
| SFA
(cm2) |
152.70(122.53-192.35) |
150.68(105.75-205.05) |
170.43(122.25-228.14) | <0.001 |
| VFA
(cm2) |
70.58(47.18-122.17) |
55.47(23.23-87.53) |
118.24(72.22-164.34) | <0.001 |
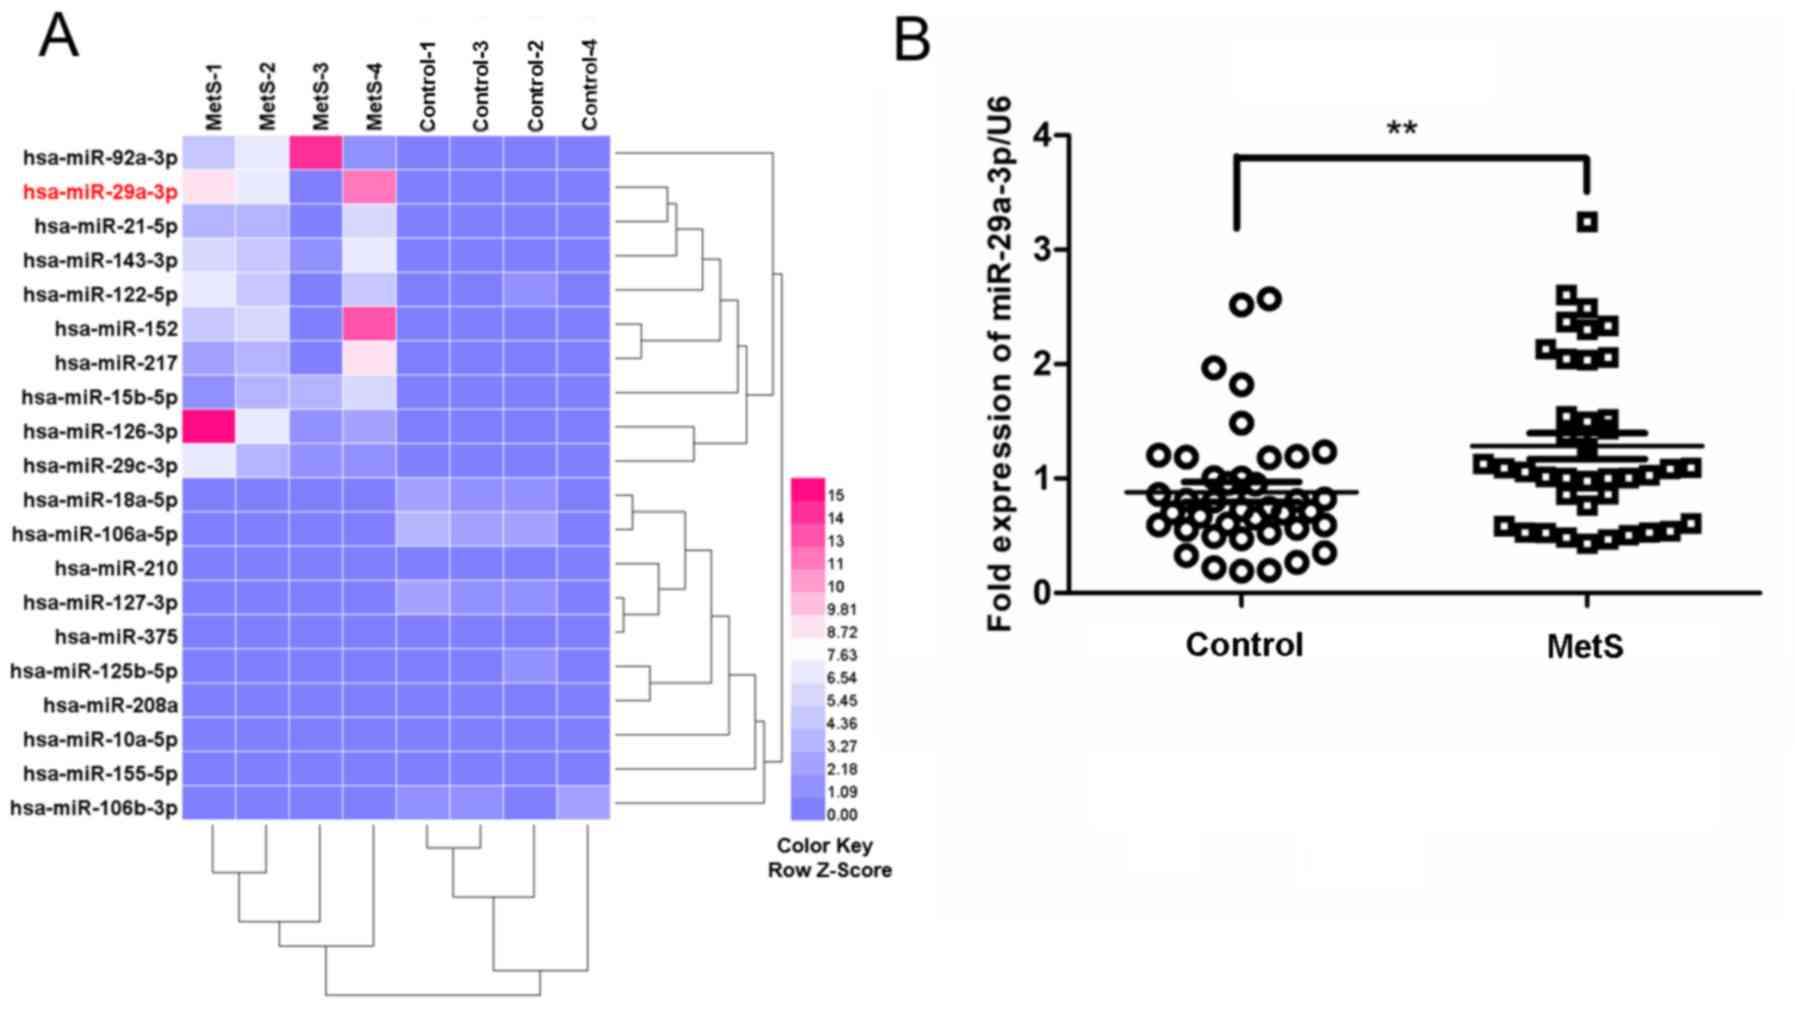
Microarray analysis reveals that
urinary miR-29a-3p is upregulated in patients with MetS
Urine samples from 4 patients with MetS and 4
controls were analyzed using a microarray evaluating a total of 377
unique assays specific to human miRNAs. Among the 377 screened
miRNAs, 20 were identified as differentially expressed in the urine
of patients with MetS compared with the controls (fold change
>2; P<0.05; Fig. 1A). Based on
the microarray analysis, miR-29a-3p was selected for further
validation by RT-qPCR using a larger sample size (n=40/group).
RT-qPCR analyses confirmed that urinary miR-29a-3p levels were
significantly increased in patients with MetS compared with the
controls (P<0.01; Fig. 1B).
Furthermore, participants with MetS had significantly increased
urinary miR-29a-3p levels compared with the control (0.51±0.17 vs.
0.34±0.20; P<0.01).
Correlation between urinary miR-29a-3p
and metabolic parameters
Associations between urinary miR-29a-3p levels and
parameters associated to adiposity, insulin resistance, lipid
profiles and hepatic enzymes were further assessed. Spearman
correlation analyses of urinary miR-29a-3p with metabolic risks
were performed. As presented in Table
III, following an adjustment for gender, age, smoking and
drinking, urinary miR-29a-3p levels were correlated with HOMA-IR
(r=0.2713; P<0.001), FINS (r=0.643; P<0.001) and HDL-c
(r=0.242; P<0.001). Additionally, urinary miR-29a-3p levels were
correlated with BMI, SBP, FPG and body fat (p<0.05; Table III).
| Table IIISpearman correlation analyses of
urinary microRNA-29a-3p with metabolic parameters prior to and
following age-, sex-, smoking- and drinking-adjustments. |
Table III
Spearman correlation analyses of
urinary microRNA-29a-3p with metabolic parameters prior to and
following age-, sex-, smoking- and drinking-adjustments.
| | Unadjusted | Age, sex, smoking
and drinking-adjusted |
|---|
| Parameter | r | P-value | r | P-value |
|---|
| BMI
(kg/m2) | 0.334 | 0.002 | 0.345 | 0.002 |
| WC (cm) | 0.250 | 0.025 | 0.271 | 0.018 |
| WHR | 0.147 | 0.193 | 0.212 | 0.066 |
| Body fat (%) | 0.302 | 0.009 | 0.354 | 0.008 |
| SBP (mmHg) | 0.331 | 0.003 | 0.370 | 0.001 |
| DBP (mmHg) | 0.098 | 0.386 | 0.087 | 0.457 |
| ALT (U/l) | 0.023 | 0.818 | 0.047 | 0.653 |
| AST (U/l) | -0.002 | 0.980 | -0.009 | 0.929 |
| FPG (mmol/l) | 0.234 | 0.037 | 0.277 | 0.015 |
| 2 h postprandial
glucose (mmol/l) | 0.001 | 0.993 | 0.153 | 0.187 |
| FINS (µU/ml) | 0.624 | <0.001 | 0.634 | <0.001 |
| 2h postprandial
insulin (µU/ml) | 0.307 | 0.006 | 0.275 | 0.056 |
| HOMA-IR | 0.707 | <0.001 | 0.726 | <0.001 |
| HbA1C (%) | 0.193 | 0.086 | 0.175 | 0.130 |
| TC (mmol/l) | 0.054 | 0.633 | 0.014 | 0.905 |
| LDL-c (mmol/l) | 0.132 | 0.242 | 0.042 | 0.718 |
| HDL-c (mmol/l) | -0.437 | <0.001 | -0.497 | <0.001 |
| TG (mmol/l) | 0.377 | <0.001 | 0.042 | 0.721 |
| SFA
(cm2) | 0.189 | 0.093 | 0.226 | 0.050 |
| VFA
(cm2) | 0.287 | 0.010 | 0.272 | 0.017 |
Urinary miR-29a-3p levels are
independently associated with FINS, HDL-c and BMI
Furthermore, it was assessed whether a high level of
urinary miR-29a-3p may be used to predict the incidence of further
metabolism subgroups, including central obesity, hypertension,
hyperglycemia, dyslipidemia, and low HDL-c in patients with MetS.
Multiple stepwise regression analysis using urinary miR-29a-3p
levels as the dependent variable following the adjustment for
gender, age, smoking and drinking revealed that urinary miR-29a-3p
levels were independently associated with FINS (β=0.561;
P<0.001), HDL-c (β=0.242; P<0.001) and BMI (β=-0.141;
P<0.05; Table IV).
| Table IVMultiple stepwise regression analyses
of independent factors associated with urinary microRNA-29a-3p
levels. |
Table IV
Multiple stepwise regression analyses
of independent factors associated with urinary microRNA-29a-3p
levels.
| Variable | β | P-value |
|---|
| FINS | 0.561 | <0.001 |
| HDL-c | 0.245 | 0.001 |
| BMI | -0.141 | 0.025 |
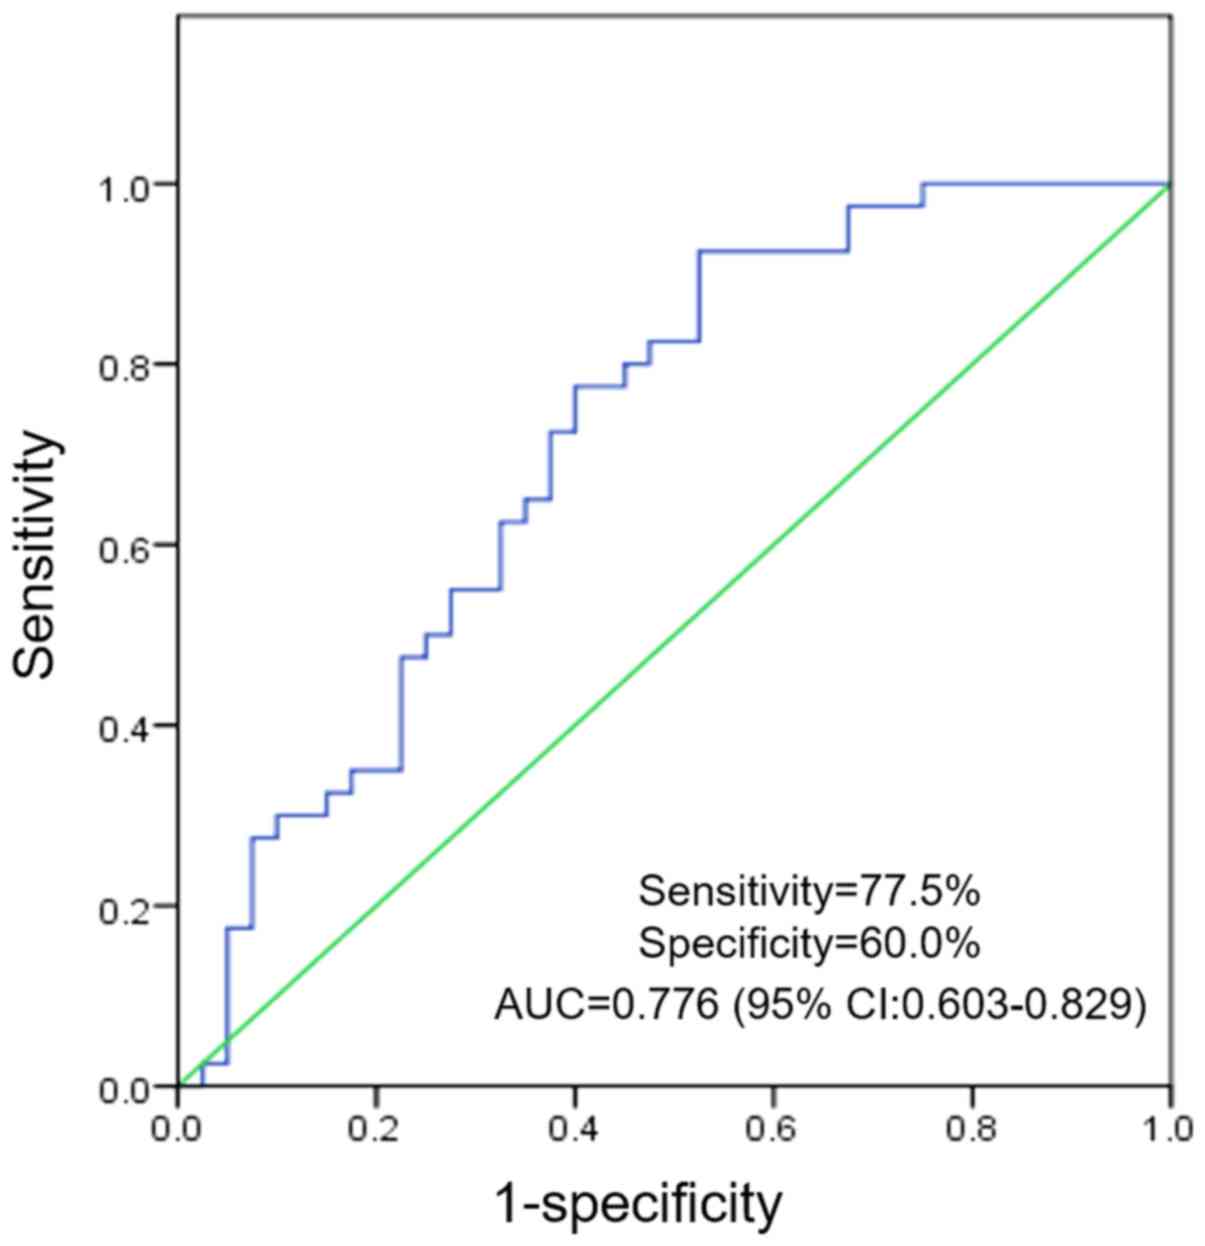
Urinary miR-29a-3p levels have a
diagnostic value for MetS
To assess the accuracy and clinical utility of
urinary miR-29a-3p levels in differentiating between patients with
MetS and control subjects in the validation phase (n=40/group), a
ROC curve analysis was performed using urinary miR-29a-3p levels.
Using a logistic regression model, analysis indicated that urinary
miR-29a-3p may be a valuable biomarker in patient with MetS
compared with healthy controls, with an area under the curve of
0.776 (95% CI, 0.603-0.829). The cut-off value for urinary
miR-29a-3p levels was 0.375 and the optimal sensitivity and
specificity were 77.5 and 60.0%, respectively (Fig. 2).
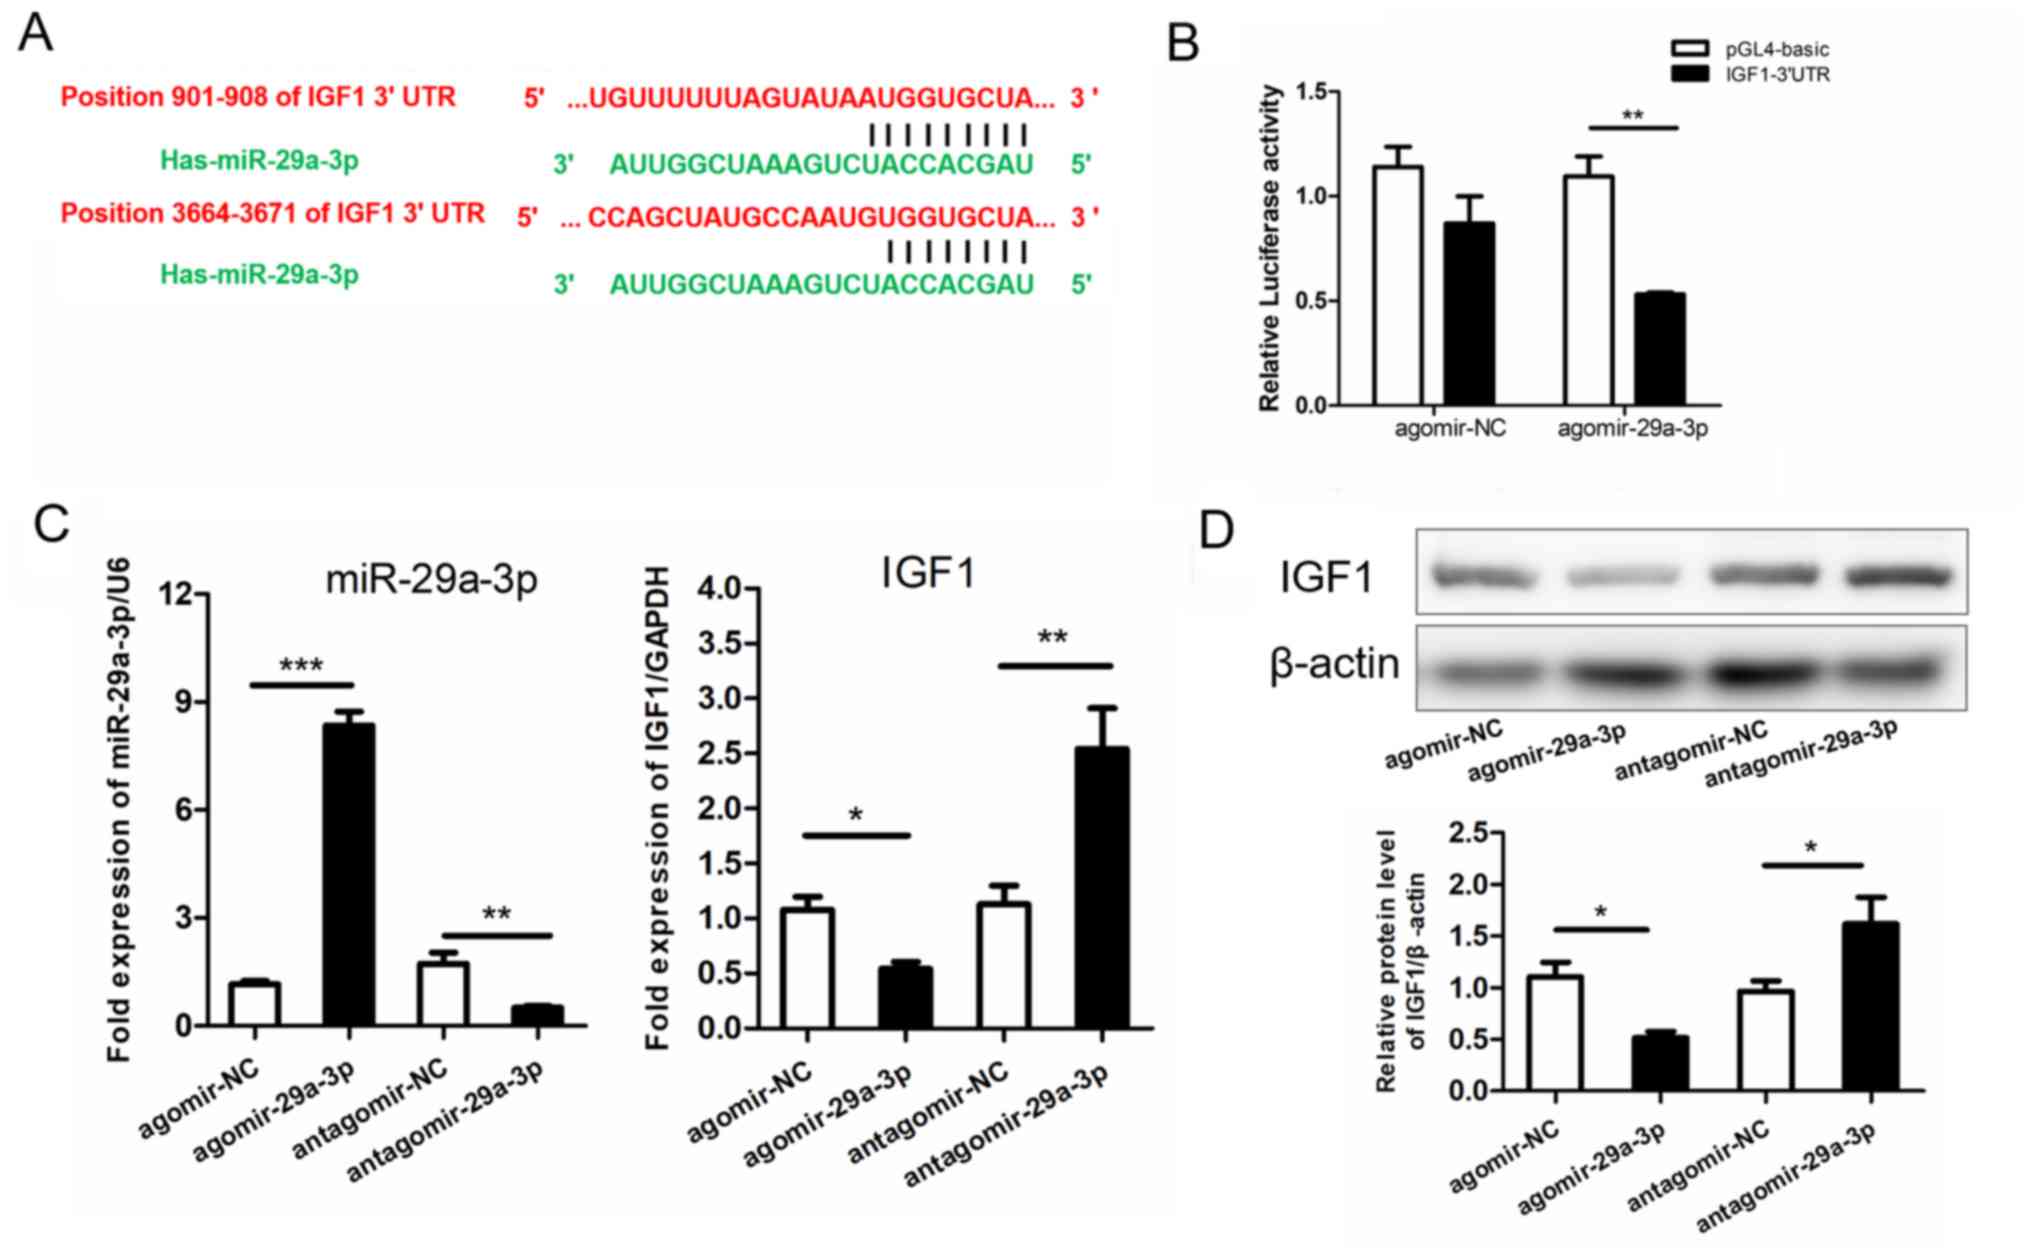
IGF1 is a target gene of
miR-29a-3p
To identify potential molecular targets of
miR-29a-3p in patients with MetS, gene ontology and biological
association analyses using the Database for Annotation,
Visualization and Integrated Discovery Bioinformatics Resources
were performed (27) and searched for
enrichment of specific target genes associated with insulin
signaling, as well as glucose and lipid metabolism. Following
evaluation of three widely used bioinformatics databases (20), it was determined that IGF1 was a
potential target of miR-29a-3p (Fig.
3A).
Subsequently, a dual-reporter constructs was
generated by fusion of the luciferase coding sequence to the 3'UTR
of IGF1. Luciferase activity of the reporter constructs containing
the predicted miR-29a-3p binding sites was determined. The
dual-reporter luciferase assay revealed that agomir-29a-3p
treatment significantly repressed luciferase activity of IGF1
compared with the control (48.97% reduction; P<0.01; Fig. 3B) and agomir-NC treatment had no
significant effect. The results suggested that IGF1 was a direct
target of miR-29a-3p.
To investigate whether miR-29a-3p expression effects
to IGF1 levels, 293 cells were treated with miR-29a-3p agomir and
antagomir for upregulation and knockdown of miR-29a-3p,
respectively. Agomir-29a-3p significantly upregulated miR-29a-3p
levels compared with the agomir-NC treated cells (7.24-fold
increase; P<0.001; Fig. 3C).
Antagomir-29a-3p treatment significantly reduced miR-29a-3p levels
compared with antagomir-NC treated cells (~70% reduction;
P<0.01; Fig. 3C). mRNA expression
of IGF1was assessed following miR-29a-3p agomirs and antagomirs
treatment. Compared with the negative controls, IGF1 levels were
significantly reduced by agomir-29a-3p (P<0.05) and
significantly increased by antagomir-29a-3p treatment (P<0.01;
Fig. 3C). Results were confirmed by
western blot analysis, exhibiting that protein levels of IGF1 were
significantly downregulated by agomir-29a-3p and upregulated by
antagomir-29a-3p compared with the controls (P<0.05; Fig. 3D).
Discussion
The diagnostic role of urinary miRNAs has been
successfully explored in several conditions, including type 2
diabetic kidney disease (9,28,29). A
meta-analysis revealed that urinary and blood miR-126 and miR-770
are potential noninvasive biomarker candidates for diabetic
nephropathy (30). Deli et al
(28) suggested that in patients with
type 2 diabetic nephropathy the urinary exosomal miRNA signature of
miR-320c may function as a novel marker. Peng et al
(31) revealed urinary miR-29 as a
novel biomarker for diabetic nephropathy and atherosclerosis in
patients with type 2 diabetes. Liu et al (32) observed that miR-29b was upregulated in
the renal medulla of Dahl salt-sensitive (SS) rats and that miR-29b
affects numerous collagens and genes associated with the
extracellular matrix, suggesting an involvement of miR-29b in the
protection from renal medullary injury in SS rats. Here, a
microarray analysis revealed that urine levels of miR-29a-3p were
significantly increased in patients with MetS compared with
controls (n=4/group) and results were validated using RT-qPCR
analysis in a larger cohort (n=40/group). Urinary miR-29a-3p levels
were further correlated with independent parameters associated with
the metabolism, including FINS, HDL-c and BMI.
In addition to using urinary miRNAs as potential
clinical biomarker, Zavesky et al (33) demonstrated urinary miRNA expression
analysis has potential in identifying novel diagnostic and
prognostic markers. Particularly due to stability and accessible
nature, urinary miRNAs may be used as noninvasive biomarkers for
graft injury. Using urinary miRNA expression levels as diagnostic
tools remains challenging and the process is still in its infancy
regarding detection techniques and costs (7,34,35). In the current study, ROC curve
analysis assessed the accuracy and clinical applicability of
evaluating urinary miR-29a-3p levels in patients with MetS.
Elevated urinary miR-29a-3p levels were positively associated with
MetS and may have a predictive value as biomarkers in the diagnosis
of MetS.
The current study had several limitations. Urinary
miRNA levels were detected in whole urine samples, raising the
question whether whole urine samples should be used. Due to the
unclear origin of the miRNAs detected in the urine (35,36),
results need to be regarded with caution. Until now, numerous
studies investigating urinary miRNA levels used urinary cell
pellets; however, no consistent procedure for obtaining these
pellets was followed (37,38). To avoid contamination with cells from
the lower urinary tract, midstream urine samples function as
sources in biomarker analysis for kidney pathology (7). In the current study, patients that
suffered from abnormal renal function or renal dysfunction were
excluded; however, it was not accounted for other inflammatory or
autoimmune disorders at the time of recruitment.
The present study identified and confirmed IGF1 as a
target of miR-29a-3p. Ligands of the IGF system, including insulin,
IGF1 and IGF2, exert their biological effects by binding to the
insulin receptor (39). Previous
research revealed that IGF1 levels are associated with the
prevalence of MetS and increases in triglyceride levels in elderly
patients (40,41). Decreased IGF1 levels are associated
with increased metabolic burden (42,43). The
findings of the current study provided evidence for miR-29a-3p
involvement in regulating IGF1 expression in a 293 cell model and
as no patient-derived cells were utilized conclusions may not be
applicable and/or validated in in vivo settings.
In summary, the presented study suggested an
association between urinary miR-29a-3p and IGF1 in patients with
MetS. Urinary miR-29a-3p may accelerate obesity-induced insulin
resistance, glucose tolerance and lipid accumulation via regulation
of the IGF1. These findings further suggested that urinary
miR-29a-3p may have potential as novel targets in the treatment of
MetS. Elevated urinary miR-29a-3p levels were positively correlated
with MetS and may be considered as predictive biomarkers in
diagnosis of MetS.
Acknowledgements
Not applicable.
Funding
This project was supported by the Zhejiang
Provincial Medical Science and Technology Program (grant nos.
2015DTA009, 2013RCA028 and 2018KY484), the National Science and
Technology Support Program (grant no. 2009BAI80B02) and the
National Natural Science Foundation of China (grant no.
81600667).
Availability of data and materials
The datasets used and/or analyzed during the current
study are available from the corresponding author on reasonable
request.
Authors' contributions
XHL and JQZ contributed to the conception and design
of the study. CL, DJH and HL coordinated the study. XHL, DJH, EM,
QLC and CL were involved in data acquisition and interpretation.
XHL and EM drafted the manuscript. All authors read and approved
the final manuscript.
Ethics approval and consent to
participate
The Medical Ethics Committee of Sir Run Run Shaw
Hospital affiliated to School of Medicine, Zhejiang University
(Hangzhou, China) approved the current study.
Patient consent for publication
Not applicable.
Competing interests
The authors declared that they have no competing
interests.
References
|
1
|
Shab-Bidar S, Golzarand M, Hajimohammadi M
and Mansouri S: A posteriori dietary patterns and metabolic
syndrome in adults: A systematic review and meta-analysis of
observational studies. Public Health Nutr. 21:1681–1692.
2018.PubMed/NCBI View Article : Google Scholar
|
|
2
|
Krützfeldt J and Stoffel M: MicroRNAs: A
new class of regulatory genes affecting metabolism. Cell Metab.
4:9–12. 2006.PubMed/NCBI View Article : Google Scholar
|
|
3
|
Dehwah MA, Xu A and Huang Q: MicroRNAs and
type 2 diabetes/obesity. J Genet Genomics. 39:11–18.
2012.PubMed/NCBI View Article : Google Scholar
|
|
4
|
Carreras-Badosa G, Bonmatí A, Ortega FJ,
Mercader JM, Guindo-Martínez M, Torrents D, Prats-Puig A,
Martinez-Calcerrada JM, Platero-Gutierrez E, De Zegher F, et al:
Altered Circulating miRNA Expression Profile in Pregestational and
Gestational Obesity. J Clin Endocrinol Metab. 100:E1446–E1456.
2015.PubMed/NCBI View Article : Google Scholar
|
|
5
|
Liang Z, Gao KP, Wang YX, Liu ZC, Tian L,
Yang XZ, Ding JY, Wu WT, Yang WH, Li YL, et al: RNA sequencing
identified specific circulating miRNA biomarkers for early
detection of diabetes retinopathy. Am J Physiol Endocrinol Metab.
315:E374:–Ε385. 2018.PubMed/NCBI View Article : Google Scholar
|
|
6
|
Rayner KJ and Hennessy EJ: Extracellular
communication via microRNA: Lipid particles have a new message. J
Lipid Res. 54:1174–1181. 2013.PubMed/NCBI View Article : Google Scholar
|
|
7
|
van de Vrie M, Deegens JK, Eikmans M, van
der Vlag J and Hilbrands LB: Urinary MicroRNA as Biomarker in Renal
Transplantation. Am J Transplant. 17:1160–1166. 2017.PubMed/NCBI View Article : Google Scholar
|
|
8
|
Endzeliņš E, Berger A, Melne V,
Bajo-Santos C, Soboļevska K, Ābols A, Rodriguez M, Šantare D,
Rudņickiha A, Lietuvietis V, et al: Detection of circulating
miRNAs: Comparative analysis of extracellular vesicle-incorporated
miRNAs and cell-free miRNAs in whole plasma of prostate cancer
patients. BMC Cancer. 17(730)2017.PubMed/NCBI View Article : Google Scholar
|
|
9
|
Xie Y, Jia Y, Xie C, Hu F, Xue M and Xue
Y: Corrigendum to Urinary Exosomal MicroRNA Profiling in Incipient
Type 2 Diabetic Kidney Disease. J Diabetes Res.
2018(5969714)2018.PubMed/NCBI View Article : Google Scholar
|
|
10
|
Mitchell PS, Parkin RK, Kroh EM, Fritz BR,
Wyman SK, Pogosova-Agadjanyan EL, Peterson A, Noteboom J, O'Briant
KC, Allen A, et al: Circulating microRNAs as stable blood-based
markers for cancer detection. Proc Natl Acad Sci USA.
105:10513–10518. 2008.PubMed/NCBI View Article : Google Scholar
|
|
11
|
Redova M, Sana J and Slaby O: Circulating
miRNAs as new blood-based biomarkers for solid cancers. Future
Oncol. 9:387–402. 2013.PubMed/NCBI View Article : Google Scholar
|
|
12
|
He A, Zhu L, Gupta N, Chang Y and Fang F:
Overexpression of micro ribonucleic acid 29, highly up-regulated in
diabetic rats, leads to insulin resistance in 3T3-L1 adipocytes.
Mol Endocrinol. 21:2785–2794. 2007.PubMed/NCBI View Article : Google Scholar
|
|
13
|
Song H, Ding L, Zhang S and Wang W: miR-29
family members interact with SPARC to regulate glucose metabolism.
Biochem Biophys Res Commun. 497:667–674. 2018.PubMed/NCBI View Article : Google Scholar
|
|
14
|
Bagge A, Clausen TR, Larsen S, Ladefoged
M, Rosenstierne MW, Larsen L, Vang O, Nielsen JH and Dalgaard LT:
MicroRNA-29a is up-regulated in beta-cells by glucose and decreases
glucose-stimulated insulin secretion. Biochem Biophys Res Commun.
426:266–272. 2012.PubMed/NCBI View Article : Google Scholar
|
|
15
|
Herrera BM, Lockstone HE, Taylor JM, Wills
QF, Kaisaki PJ, Barrett A, Camps C, Fernandez C, Ragoussis J,
Gauguier D, et al: MicroRNA-125a is over-expressed in insulin
target tissues in a spontaneous rat model of Type 2 Diabetes. BMC
Med Genomics. 2(54)2009.PubMed/NCBI View Article : Google Scholar
|
|
16
|
Pandey AK, Verma G, Vig S, Srivastava S,
Srivastava AK and Datta M: miR-29a levels are elevated in the db/db
mice liver and its overexpression leads to attenuation of insulin
action on PEPCK gene expression in HepG2 cells. Mol Cell
Endocrinol. 332:125–133. 2011.PubMed/NCBI View Article : Google Scholar
|
|
17
|
Liang J, Liu C, Qiao A, Cui Y, Zhang H,
Cui A, Zhang S, Yang Y, Xiao X, Chen Y, et al: MicroRNA-29a-c
decrease fasting blood glucose levels by negatively regulating
hepatic gluconeogenesis. J Hepatol. 58:535–542. 2013.PubMed/NCBI View Article : Google Scholar
|
|
18
|
Ślusarz A and Pulakat L: The two faces of
miR-29. J Cardiovasc Med (Hagerstown). 16:480–490. 2015.PubMed/NCBI View Article : Google Scholar
|
|
19
|
Xueyao Y, Saifei Z, Dan Y, Qianqian P,
Xuehong D, Jiaqiang Z, Fenping Z and Hong L: Circulating
fractalkine levels predict the development of the metabolic
syndrome. Int J Endocrinol. 2014(715148)2014.PubMed/NCBI View Article : Google Scholar
|
|
20
|
Xihua L, Shengjie T, Weiwei G, Matro E,
Tingting T, Lin L, Fang W, Jiaqiang Z, Fenping Z and Hong L:
Circulating miR 143 3p inhibition protects against insulin
resistance in Metabolic Syndrome via targeting of the insulin like
growth factor 2 receptor. Transl Res. 2018.PubMed/NCBI View Article : Google Scholar
|
|
21
|
Chinese guidelines on prevention treatment
of dyslipidemia in adults. Zhonghua Xin Xue Guan Bing Za Zhi 35:
390 419, 2007 (In Chinese).
|
|
22
|
Yin XY, Zheng FP, Zhou JQ, Du Y, Pan QQ,
Zhang SF, Yu D and Li H: Central obesity and metabolic risk factors
in middle-aged Chinese. Biomed Environ Sci. 27:343–352.
2014.PubMed/NCBI View Article : Google Scholar
|
|
23
|
Emoto M, Nishizawa Y, Maekawa K, Hiura Y,
Kanda H, Kawagishi T, Shoji T, Okuno Y and Morii H: Homeostasis
model assessment as a clinical index of insulin resistance in type
2 diabetic patients treated with sulfonylureas. Diabetes Care.
22:818–822. 1999.PubMed/NCBI View Article : Google Scholar
|
|
24
|
Jaisson S, Leroy N, Guillard E, Desmons A
and Gillery P: Analytical performances of the D-100TM hemoglobin
testing system (Bio-Rad) for HbA1c assay. Clin Chem Lab Med.
53:1473–1479. 2015.PubMed/NCBI View Article : Google Scholar
|
|
25
|
Liu S, Li W, Xu M, Huang H, Wang J and
Chen X: Micro-RNA 21Targets dual specific phosphatase 8 to promote
collagen synthesis in high glucose-treated primary cardiac
fibroblasts. Can J Cardiol. 30:1689–1699. 2014.PubMed/NCBI View Article : Google Scholar
|
|
26
|
Hu XX, Xu XN, He BS, Sun HL, Xu T, Liu XX,
Chen XX, Zeng KX, Wang SK and Pan YQ: MicroRNA-485-5p Functions as
a Tumor Suppressor in Colorectal Cancer Cells by Targeting CD147. J
Cancer. 9:2603–2611. 2018.PubMed/NCBI View Article : Google Scholar
|
|
27
|
Dennis G Jr, Sherman BT, Hosack DA, Yang
J, Gao W, Lane HC and Lempicki RA: DAVID: Database for Annotation,
Visualization, and Integrated Discovery. Genome Biol.
4(3)2003.PubMed/NCBI
|
|
28
|
Delić D, Eisele C, Schmid R, Baum P, Wiech
F, Gerl M, Zimdahl H, Pullen SS and Urquhart R: Urinary Exosomal
miRNA Signature in Type II Diabetic Nephropathy Patients. PLoS One.
11(e0150154)2016.PubMed/NCBI View Article : Google Scholar
|
|
29
|
Eissa S, Matboli M, Aboushahba R, Bekhet
MM and Soliman Y: Urinary exosomal microRNA panel unravels novel
biomarkers for diagnosis of type 2 diabetic kidney disease. J
Diabetes Complications. 30:1585–1592. 2016.PubMed/NCBI View Article : Google Scholar
|
|
30
|
Park S, Moon S, Lee K, Park IB, Lee DH and
Nam S: Urinary and Blood MicroRNA-126 and -770 are Potential
Noninvasive Biomarker Candidates for Diabetic Nephropathy: A
Meta-Analysis. Cell Physiol Biochem. 46:1331–1340. 2018.PubMed/NCBI View Article : Google Scholar
|
|
31
|
Peng H, Zhong M, Zhao W, Wang C, Zhang J,
Liu X, Li Y, Paudel SD, Wang Q and Lou T: Urinary miR-29 correlates
with albuminuria and carotid intima-media thickness in type 2
diabetes patients. PLoS One. 8(e82607)2013.PubMed/NCBI View Article : Google Scholar
|
|
32
|
Liu Y, Taylor NE, Lu L, Usa K, Cowley AW
Jr, Ferreri NR, Yeo NC and Liang M: Renal medullary microRNAs in
Dahl salt-sensitive rats: miR-29b regulates several collagens and
related genes. Hypertension. 55:974–982. 2010.PubMed/NCBI View Article : Google Scholar
|
|
33
|
Zavesky L, Jandakova E, Turyna R,
Langmeierova L, Weinberger V, Minar L and Kohoutova M: New
perspectives in diagnosis of gynaecological cancers: Emerging role
of circulating microRNAs as novel biomarkers. Neoplasma.
62:509–520. 2015.PubMed/NCBI View Article : Google Scholar
|
|
34
|
Campion CG, Sanchez-Ferras O and Batchu
SN: Potential Role of Serum and Urinary Biomarkers in Diagnosis and
Prognosis of Diabetic Nephropathy. Can J Kidney Health Dis.
4(2054358117705371)2017.PubMed/NCBI View Article : Google Scholar
|
|
35
|
Mall C, Rocke DM, Durbin-Johnson B and
Weiss RH: Stability of miRNA in human urine supports its biomarker
potential. Biomarkers Med. 7:623–631. 2013.PubMed/NCBI View Article : Google Scholar
|
|
36
|
Ben-Dov IZ, Tan YC Morozov P, Wilson PD,
Rennert H, Blumenfeld JD and Tuschl T: Urine microRNA as potential
biomarkers of autosomal dominant polycystic kidney disease
progression: Description of miRNA profiles at baseline. PLoS One.
9(e86856)2014.PubMed/NCBI View Article : Google Scholar
|
|
37
|
Abulaban KM, Fall N, Nunna R, Ying J,
Devarajan P, Grom A, Bennett M, Ardoin SP and Brunner HI:
Relationship of cell-free urine MicroRNA with lupus nephritis in
children. Pediatr Rheumatol Online J. 14(4)2016.PubMed/NCBI View Article : Google Scholar
|
|
38
|
Lv LL, Cao Y, Liu D, Xu M, Liu H, Tang RN,
Ma KL and Liu BC: Isolation and quantification of microRNAs from
urinary exosomes/microvesicles for biomarker discovery. Int J Biol
Sci. 9:1021–1031. 2013.PubMed/NCBI View Article : Google Scholar
|
|
39
|
Lelbach A, Muzes G and Feher J: The
insulin-like growth factor system: IGFs, IGF-binding proteins and
IGFBP-proteases. Acta Physiol Hung. 92:97–107. 2005.PubMed/NCBI View Article : Google Scholar
|
|
40
|
van Bunderen CC, Oosterwerff MM, van
Schoor NM, Deeg DJ, Lips P and Drent ML: Serum IGF1, metabolic
syndrome, and incident cardiovascular disease in older people: A
population-based study. Eur J Endocrinol. 168:393–401.
2013.PubMed/NCBI View Article : Google Scholar
|
|
41
|
van Nieuwpoort IC, Vlot MC, Schaap LA,
Lips P and Drent ML: The relationship between serum IGF-1, handgrip
strength, physical performance and falls in elderly men and women.
Eur J Endocrinol. 179:73–84. 2018.PubMed/NCBI View Article : Google Scholar
|
|
42
|
Lam CS, Chen MH, Lacey SM, Yang Q,
Sullivan LM, Xanthakis V, Safa R, Smith HM, Peng X, Sawyer DB, et
al: Circulating insulin-like growth factor-1 and its binding
protein-3: Metabolic and genetic correlates in the community.
Arterioscler Thromb Vasc Biol. 30:1479–1484. 2010.PubMed/NCBI View Article : Google Scholar
|
|
43
|
Saydah S, Ballard-Barbash R and Potischman
N: Association of metabolic syndrome with insulin-like growth
factors among adults in the US. Cancer Causes Control.
20:1309–1316. 2009.PubMed/NCBI View Article : Google Scholar
|