Introduction
Training programs are designed and performed to
enhance both muscle strength and endurance in humans or to limit
changes associated with immobilization or disease (1,2). Training
induces numerous physiological adaptations that facilitate exercise
capacity and the ability to sustain a workload or achieve greater
power output (3,4). Studies have shown that training is
associated with structural changes in skeletal muscle tissue,
including increased muscle length, increased thickness of fibers,
increased number of myofibrils and changes in the type of muscle
fibers (5-9).
There is also substantial evidence showing that training induces
significant changes in myoglobin content, in mitochondrial
function, in oxidative enzymes and substrate metabolism in skeletal
muscle tissue (10-14).
Training increases muscle power and size, and increased chronic
aerobic exercise improves muscle size induced by resistance
training (15,16).
In humans, two approaches are frequently used for
aerobic training, continuous training and interval training. The
continuous training approach includes Uniform Continuous (UC),
Varying Continuous (VC) and Progressive Continuous (PC) modalities.
It has been demonstrated that the VC modality results in higher
VO2max volumes and an improved metabolic profile in
humans with metabolic syndrome (17).
Previous studies have also shown that VC training is associated
with improved myocardial function and higher HDL levels in subjects
with coronary heart disease (18-20).
Taken together these data suggest that VC may be superior to other
continuous training modalities in enhancing aerobic performance.
Whilst the aforementioned studies have shown that continuous
training may exert specific clinical effects, their role in
inducing differential changes in muscle morphology and function is
not fully established.
In the present study, the structural and biochemical
adaptation of skeletal muscles following various continuous
training modalities in a murine mouse model was analyzed using a
RotaRod system (21).
The aim of the present study was to determine
whether UC, VC and PC resulted in differential changes to muscle
structure, plasticity and function thus providing insight into the
biological effects and therefore possibilities for the use of each
modality in training.
Materials and methods
Experimental animals
In the present study, a total of 16 BALB/c male mice
were divided into 4 groups; a control group and 3 groups of mice
trained with either a UC, VC or PC protocol. Animal experiments
were performed in accordance with the guidelines and regulations of
the European Union Council Directive (22) and all experimental protocols were
approved by the Italian Ministry of Public Health (approval no.
86/2018-PR). All efforts were made to minimize the number of
animals used and their suffering. The mice started the training
protocol on day 30 (±2) after birth, 6 days after weaning. The
animals were well nourished and were allowed to eat until 30 min
prior to the start of each training session. At the end of the
training period, which lasted 3 months, all the mice were
sacrificed on day 120 (±4) after birth. Animals were sacrificed
following anesthetization with halothane as described previously
(23). Muscle tissue fibers were
collected from the posterior extensor, sural triceps, tibial muscle
and brachial triceps.
Training system
A RotaRod 47600 (Ugo Basile Srl) was used for
training animals. The RotaRod consisted of 5 cylinders covered by
rubber in order to ensure optimal grip for the rodents. A total of
6 panels with a diameter of 25 cm divided the 5 lanes, each with a
57 mm width, allowing 5 animals to run simultaneously. An attached
display showed types and speeds of rotation, time lapsed from the
start of the training session and time from the last fall. A
control panel allowed for varying angular speed within a range
(2-80 RPM) and time intervals for increasing speed modes from 6 sec
to 10 min. The diameter of the 5 cylinders was 3 cm with a
circumference of 9.42 cm (1 RPM 9.42 cm x min).
Incremental test
To set up the correct speed of rotation (RPM) on the
RotaRod for each protocol of training, an incremental test was
performed before the training period with all the animals. The
incremental test was useful for obtaining data regarding the mean
number of falls in 1 min for each speed between 7-34 RPM of each
untrained group.
Training schedule
Before starting the experimental training session
period, all animals were exercised using a dynamometer and three
trials for each animal were recorded. On the same day, an
incremental test on the RotaRod was performed to allow animals to
familiarize themselves with the machinery and the data were
recorded. On day 2, all animals were submitted to an endurance test
on the RotaRod for 30 min at 10 RPM; on day 3, an incremental test
on the RotaRod; and from day 4 onwards, specific training was
started. Animals in each group were then trained three times per
week for 12 weeks. Workloads for each training session was (341±3)
RPM for all the three training regimens with a final distance for
each group of 3214.266±28.278 cm. The mean speed during UC was 64.8
and 68.4% of that recorded during VC and PC, respectively.
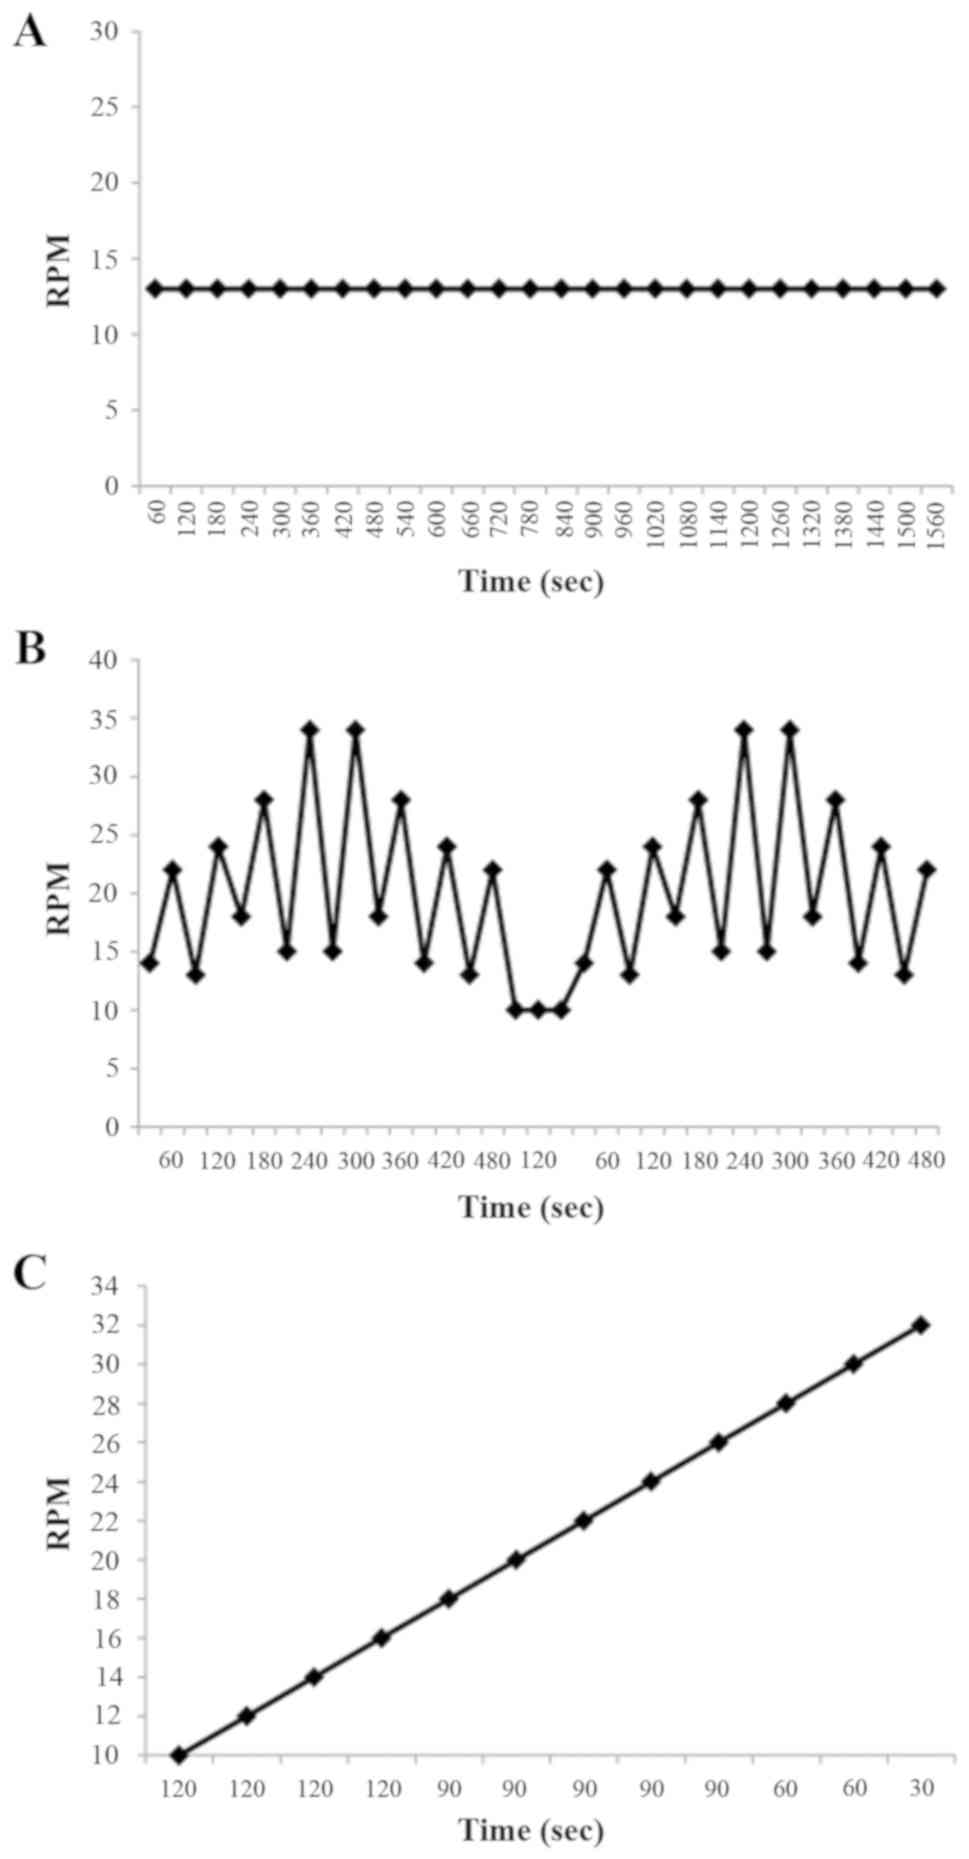
Fig. 1 shows the three
training protocols compared in terms of speed and speed variations.
During the UC training protocol a rate of 13 RPM was set for 26
min. During the VC protocol two speeds were used, with a higher
intensity recovery period. A total of four training series were
repeated within this protocol arranged into two 8 min sessions
(inversion bi-pyramidal exercise). Between the two sessions a 2 min
recovery rate of 10 RPM was set with a total session duration of 18
min. Fig. 1 demonstrates how the two
8 min series were scheduled. The PC training protocol was based on
a progressive 2 RPM increase rate speed from 10 RPM to 32 RPM, with
12 speed changes. The duration of the PC protocol was 18 min.
Cross-over tests
After 10 weeks of training, all mice from each group
were trained using one of the two other training schedules for one
training session to determine their performance with a different
protocol. Table I shows the number of
falls in mice crossed-over to a different training. The number of
falls was recorded after two weeks of cross-over and compared with
the animals not included in the cross-over schedule.
 | Table INumber of falls in mice crossed-over
to a different training protocol. |
Table I
Number of falls in mice crossed-over
to a different training protocol.
| | Number of falls |
|---|
| Groups | Mouse 1 | Mouse 2 | Mouse 3 | Mouse 4 | Mean |
|---|
| UC |
|
VC
crossover | 55 | 5 | 43 | 25 | 32.00 |
|
PC
crossover | 17 | 2 | 25 | 24 | 17.00 |
| VC |
|
UC
crossover | 2 | 1 | 0 | 3 | 1.50 |
|
PC
crossover | 1 | 7 | 2 | 10 | 5.00 |
| PC |
|
UC
crossover | 4 | 3 | 2 | 0 | 2.25 |
|
VC
crossover | 11 | 11 | 25 | 14 | 15.25 |
Animal assessment
Animal weight was measured throughout the training
protocols. Animals underwent a strength-endurance test using a
force transducer (AdInstruments, Ltd.; cat. no. MLT050/D), where
the mouse was suspended by its front legs whilst the posterior
limbs were immobilized. The force transducer was connected to a
computer running MLS060 Lab Chart CD 252717 (ADInstruments, Ltd.)
for data recording and analysis. The time interval between the
start of the test and a fall was measured, and two tests were
performed for each animal prior to beginning the training protocol
and following the last training session. Every test was performed
three times for each animal.
Transmission electron microscopy
Muscle tissues from the left side of the animals
were collected. Samples were taken from the posterior extensor,
sural triceps, tibial muscle and brachial triceps. A total of 84
samples of muscle tissues were available for ultrastructure
analysis. The ultrastructure analysis was performed on the extensor
muscles and the samples were processed as previously described
(24). Briefly, samples were fixed
with 2.5% glutaraldehyde in PBS (pH 7.4), at 4˚C for 48 h and then
post-fixed in 1.33% osmium tetroxide for 1 h at 4˚C, dehydrated
using a series of increasing concentrations of ethanol at 4˚C,
transferred to toluene at room temperature and finally embedded in
EPON 812 (Electron Microscopy Sciences) for 18 h at 60˚C. Thin and
ultrathin sections were obtained using a Reichert ultramicrotome
(Leica Microsystems GmbH). Thin sections (1-1.5 µm) were stained
with toluidine blue (Sigma Aldrich; Merck KGaA) for 2 min at 70˚C
and examined under a Zeiss Axioscope (Carl Zeiss Microscopy, Inc.)
light microscope at x200 magnification. Ultrathin sections (900 Å)
were obtained using a diamond knife (Diatome, Ltd.). Ultrathin
sections were placed on copper grids, stained for 5 min at room
temperature with uranyl acetate/lead citrate and observed using a
Philips Morgagni 268D transmission electron microscope (Philips
Medical Systems, Inc.) at various magnification (x9,000, x11,000 or
x22,000). The length of at least 40 different sarcomeres were
evaluated in images acquired using AnalySIS® software
(Philips Medical Systems, Inc.).
Western blotting
Muscle tissues from the right part of the animals
were collected. Samples were taken from the posterior extensor,
sural triceps and brachial triceps. Whole mounts of these muscles
were taken, cut in two pieces, placed in sterile plastic tubes and
stored in liquid nitrogen. Two samples from each muscles were taken
(6 samples from each animal), thus a total of 96 samples were
available for biochemistry. Proteins were extracted from muscle
tissues using a lysis buffer (10 mmol/l HEPES, 1 mmol/l EDTA, 60
mmol/l KCl, CA-630 0.2% Igepal, 1 mmol/l sodium fluoride, 10 µg/ml
aprotinin, 10 µg/ml leupeptin, 1 mmol/l DTT, 1 mmol/l PMSF).
Protein concentrations were quantified by spectrophotometry at a
wavelength of 595 nm (PerkinElmer, Inc.). Proteins from each sample
(50-100 µg/sample) were denatured for 5 min at 100˚C in the
β-mercaptoethanol, loaded on a 15% SDS gel and resolved using
SDS-PAGE. Following electrophoresis, the proteins were transferred
to a nitrocellulose membrane, which was stained with Ponceau S (0.2
g Ponceau, 1 ml acetic acid in H2O 100 ml at room
temperature for 5 min) which binds to the amino groups of proteins.
After 2-3 washes in 1X TBS to remove the Ponceau stain, the
membrane was blocked in 10 ml 5% non-fat milk in TBS-0.025% Tween
(TBS-T) for 1 h at room temperature. Subsequently, membranes were
incubated overnight at 4˚C with constant agitation with the
anti-myoglobin antibody [myoglobin (A-9), sc-74525, Santa Cruz
Biotechnology, Inc.] at 1:1,000 dilution in TBS-T and the anti-SDHA
antibody [SDHA (B-1), sc-166909, Santa Cruz Biotechnology, Inc.] at
1:1,000 dilution in TBS-T. The following day, after 3x10 min washes
with TBS-T, the membranes were incubated for 1 h at room
temperature with a peroxidase-conjugated secondary antibody and
subsequently washed with TBS-T three times. Signals were visualized
using a chemiluminescence kit (Pierce; Thermo Fisher Scientific,
Inc.). After developing the blots, each membrane was stripped of
bound antibodies and reprobed several times. The membrane was
submerged in stripping buffer (100 mM 2-Mercaptoehanol, 2% SDS,
62.5 mM Tris HCl, pH 6.7) and incubated at 50˚C for 30 min with
occasional agitation. Then, the membrane was washed for 2x10 min in
TBS-T at room temperature. The membrane was blocked by immersion in
5% non-fat dried milk in TBS-T for 1 h at room temperature. To
ensure equal loading, membranes were incubated with a
mouse-anti-human monoclonal β-actin antibody (1:5,000;
Sigma-Aldrich; Merck KGaA) at room temperature for 1 h.
Computer-assisted scanning densitometry (Total lab, AB.EL
Science-Ware Srl) was used to analyze the intensity of the
immunoreactive bands, relative to β-actin.
Statistical analysis
Data are presented as the mean ± standard error of
the mean. Comparisons between multiple groups were performed using
an ANOVA, with either a post-hoc Dunnett's or Tukey's test.
P<0.05 was considered to indicate a statistically significant
difference. Statistical analyses were carried out using the
GraphPad Prism software version 3.02 (GraphPad Software, Inc.).
Microsoft Office Excel 5.0 software (Microsoft Corporation) was
used for generation of graphs.
Results
Training increases the body weight of
mice
Mice weight was measured throughout the entire
experimental procedure and is shown in Fig. 2A. At 1 month of age, mean body weight
prior to initiation of the training sessions was 18.5±0.6 g in the
control group, 19.2±1.9 g in the UC group, 18.2±0.9 g in the VC
group and 22±0.6 g in the PC group. At the age of 4 months, after
training sessions were completed, mean body weight was 21±0.8 g in
the sedentary group, 29.6±1.1 g in the UC group, 28±1.6 g in the VC
group and 33±1.1 g in the PC group. The mean body weight increase
following training was 54% in the UC group, 53% in the VC group and
50% in the PC group, whereas in the sedentary group, an increase of
only 13.5% was observed. These data show that training was
associated with an increase in body weight that was statistically
significant in the three training protocols compared with the
control sedentary group (P<0.001).
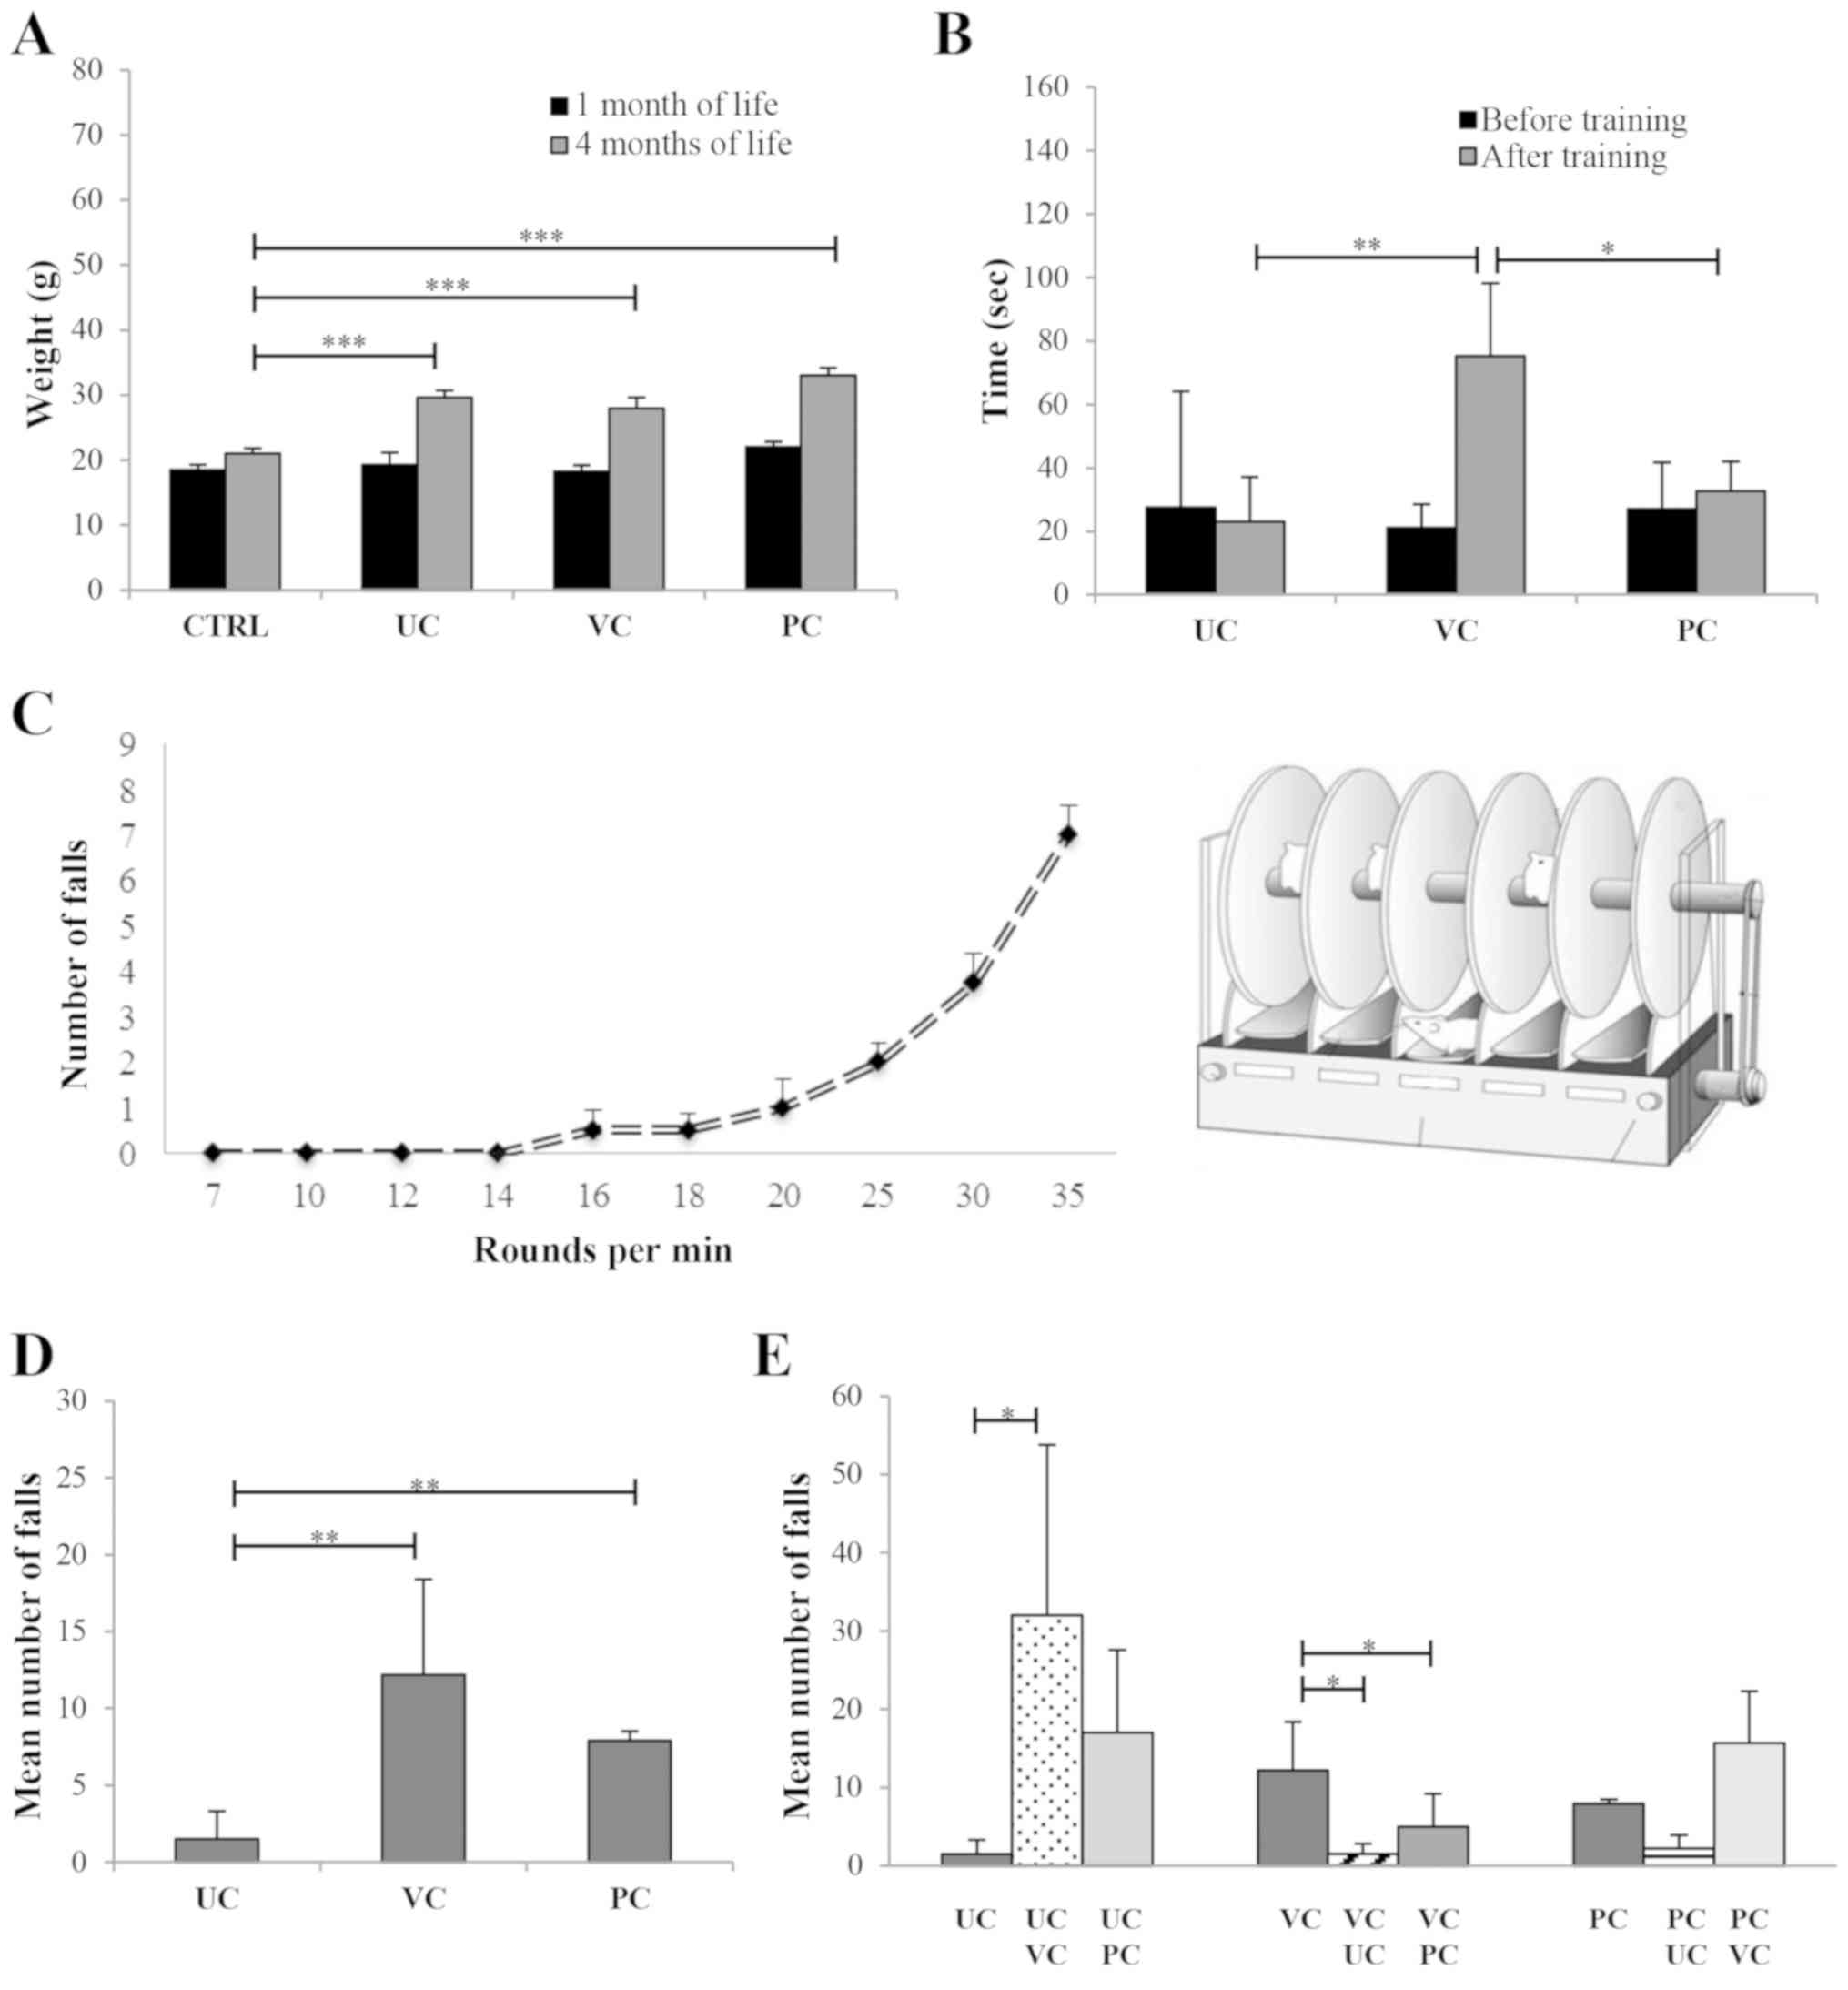 | Figure 2Effects of different training
protocols on physical and performance parameters. (A) Weight
variations in control and trained mice 1 and 4 months after birth.
The mean body weight in the control group was 18.5±0.6 g after 1
month and 21±0.8 g after 4 months. In the mice that were to be
trained, the mean body weight was 19.2±1.9 g in the UC group,
18.2±0.9 g in the VC group and 22±0.6 g in the PC group 1 month
after birth and did not differ significantly from either the
control or each other. After 4 months, the mean body weight was
29.6±1.1 g in the UC group, 28±1.6 g in the VC group and 33±1.1 g
in the PC group, and was significantly higher in all the training
groups compared with the control. (B) Mean suspension time on the
dynamometer test before and after training. The mean suspension
times prior to training were 27.5±36.6 sec in the UC group,
18.4±8.2 sec in the VC group and 27±14.8 sec in the PC group, and
there was no significant differences between the times. At the end
of training, the mean suspension times were 23±14.1, 75.3±23 and
32.7±9.4 sec, in the UC, VC and PC groups, respectively. The
difference in the mean suspension time of VC vs. UC and VC vs. PC
was significant. (C) Incremental test performed prior to the
initiation of training. There were 4 speed zones on the RotaRod:
Low intensity, >7 and ≤14 RPM; average intensity, >14 and ≤20
RPM; high intensity, >20 and ≤30 RPM; and very high intensity,
>30 RPM. (D) Mean number of falls during the training protocol
in each of the three training groups were 1.5±1.8 in the UC group,
12.2±6.2 in the VC group and 7.9±0.6 in the PC group. The mean
number of falls was significantly higher in the VC and PC training
group compared with the UC training group. (E) Mean number of falls
in mice crossed-over a different protocol. The mean number of falls
in the UC animals crossed over to VC training was 32±21.8, total
falls 128; and when crossed-over to PC training it was 17±10.6,
total falls 68. When VC trained mice were crossed over to UC
training, the mean number of falls was 1.5±1.3, total falls 6; and
when crossed-over to PC training the mean number of falls was
5±4.2, total falls 20. Mean number of falls in the PC animals
crossed-over to UC training was 2.25±1.70, total falls 9; and when
crossed-over to VC training, the mean number of falls was
15.75±6.60, total falls 63. *P<0.05, **P<0.01 and
***P<0.001. CTRL, control; UC, uniform continuous; VC, varying
continuous; PC, progressive continuous. |
Effects of different training
protocols on strength
On the first and last day of training, the strength
of each mouse was assessed using a dynamometer three times. The
time in sec during which the animal remained suspended with their
forelegs without falling was measured. Fig. 2B shows the comparison of mean
suspension times before and after training. Before training, mean
suspension time was 27.5±36.6 sec in the UC group, 18.4±8.2 sec in
the VC group and 27±14.8 sec in the PC group, and there were no
significant differences between the groups. After training, mean
suspension time was 23±14.1, 75.3±23 and 32.7±9.4 sec,
respectively. The differences in the mean suspension time of VC
compared with UC, and in VC compared with PC were significant
(P<0.01 and P<0.05, respectively; Fig. 2B). Training significantly increased
suspension time in the VC group (255% increase), whereas in the
other two groups the increase was minimal and not significant.
These results suggest that the VC training protocol was associated
with increased muscle efficiency and strength endurance.
Incremental test identifies four
ranges of speed
To set up the correct speed of rotation, an
incremental test was performed prior to the training period with
all the animals used in the experiments. Data presented in Fig. 2C were used to determine the four
ranges of speed on the RotaRod: Low intensity, >7 and ≤14 RPM;
average intensity, >14 and ≤20 RPM; high intensity, >20 and
≤30 RPM; and very high intensity, >30 RPM.
Cross-over tests show that VC training
is the most efficient
During the 12 weeks of training, the number of falls
for every type of protocol was evaluated. The mean number of falls
during the training period were, 1.5±1.8 in the UC group, 12.2±6.2
in the VC group and 7.9±0.6 in the PC group with a significantly
lower number of falls in the UC group compared with both the VC and
PC groups (both P<0.01). These results suggest that the VC
protocol was the most challenging training protocol. After an
adaptation period of 10 weeks, mice were enrolled in a cross-over
experiment to test their performance when switched to a different
training protocol. When UC animals were crossed over to VC
training, their mean number of falls was 32±21.8 (total falls 128;
P<0.05 compared with UC alone). When the UC mice were crossed
over to PC training, the mean number of falls was 17±10.6 (total
falls 68), which did not differ significantly compared with the
mean number of falls in the UC mice. When VC animals were crossed
over to UC training, their mean number of falls was significantly
decreased to 1.5±1.3 (total falls 6); and after crossing over to PC
training, the mean number of falls was significantly decreased to
5±4.2 (total falls 20) (both P<0.05 compared with VC alone).
Finally, when PC animals were crossed over to UC training, their
mean number of falls was 2.2±1.7 (total falls 9), while crossing
over to VC training resulted in a mean number of falls of 15.7±6.6
(total falls 63) and neither differed significantly from PC alone.
Comparison data of the number of falls following crossovers in the
three groups are presented in Fig.
2E. Results of the crossover experiments suggested that the VC
trained mice exhibited the most notable improvement in performance
compared with the other two groups.
Muscle plasticity following
training
To evaluate the adaptation of muscular plasticity
following training with each protocol, ultrastructural analysis and
measurement of sarcomere length of muscle tissues was performed
(Fig. 3A-E). The length of 40
sarcomeres was quantified in each muscle sample. As shown in
Fig. 3A, the ultrastructural analysis
of the extensor muscle from the sedentary control mice showed a
correct organization of myofibrils with normal alignment of
sarcomeres (3A-a, -b, -d and -e). The mitochondria were primarily located
at the periphery of the fibers and were predominantly in the
condensed phase (Fig. 3A-a, -b, -d
and -e). The sarcomere showed a
regular organization of actin and myosin filaments and a
well-preserved ultrastructure. The Z, I, A, H and M bands were
clearly discernable as indicated in Fig.
3A-c and -f. A small dilatation
of the sarcoplasmic reticulum was observed (Fig. 3A-b). The average length of sarcomeres
from sedentary mice was 1.92±0.13 µm. The ultrastructural analysis
of the extensor muscle from mice trained with the UC training
showed a more compact muscle tissue with an enlargement and
shortening of the sarcomeres that appeared perfectly aligned
(Fig. 3B-a, -b and -c). The sarcomeres were significantly
shortened compared with the sarcomeres of the untrained control
mice, with an average length of 1.75±0.19 µm (P<0.0001; Fig. 3E). Mitochondria were located in the
periphery and interposed between the myofibrils (Fig. 3B-a and -b). The actin and myosin filaments appeared
regularly organized with a well-preserved ultrastructure. The Z, I,
A, H and M bands were clearly discernable (Fig. 3B-c). The ultrastructural analysis of
the extensor muscle from mice trained with the VC protocol showed
proper organization of the myofibrils with a correct alignment of
the sarcomeres (Fig. 3C).
Condensation of the mitochondria was slightly increased and they
were located in the periphery and between the myofibrils, and a
small dilatation of the sarcoplasmic reticulum was observed
(Fig 3C-a and -b). The sarcomeres were well organized with
proper repetition of the bands (Fig.
3C-c). The average length of sarcomeres of the VC trained mice
was 1.96±0.12 µm (P=0.12; Fig. 3E).
The ultrastructural analysis of the extensor muscle from the mice
trained with the PC protocol (Fig.
3D) showed the organization of the tissue was correct, and the
presence of elongated fusiform sarcomeres was observed (Fig. 3D-a and -b). The sarcomeres were significantly
elongated compared with the untrained mice, with an average length
of 2.14±0.25 µm (P<0.0001; Fig.
3E). There was a slight dilatation of the sarcoplasmic
reticulum and the sarcomeres showed correct repetition of the bands
(Fig. 3D-c). These results suggest
that exposure to different experimental training protocols induced
different patterns of muscle plasticity.
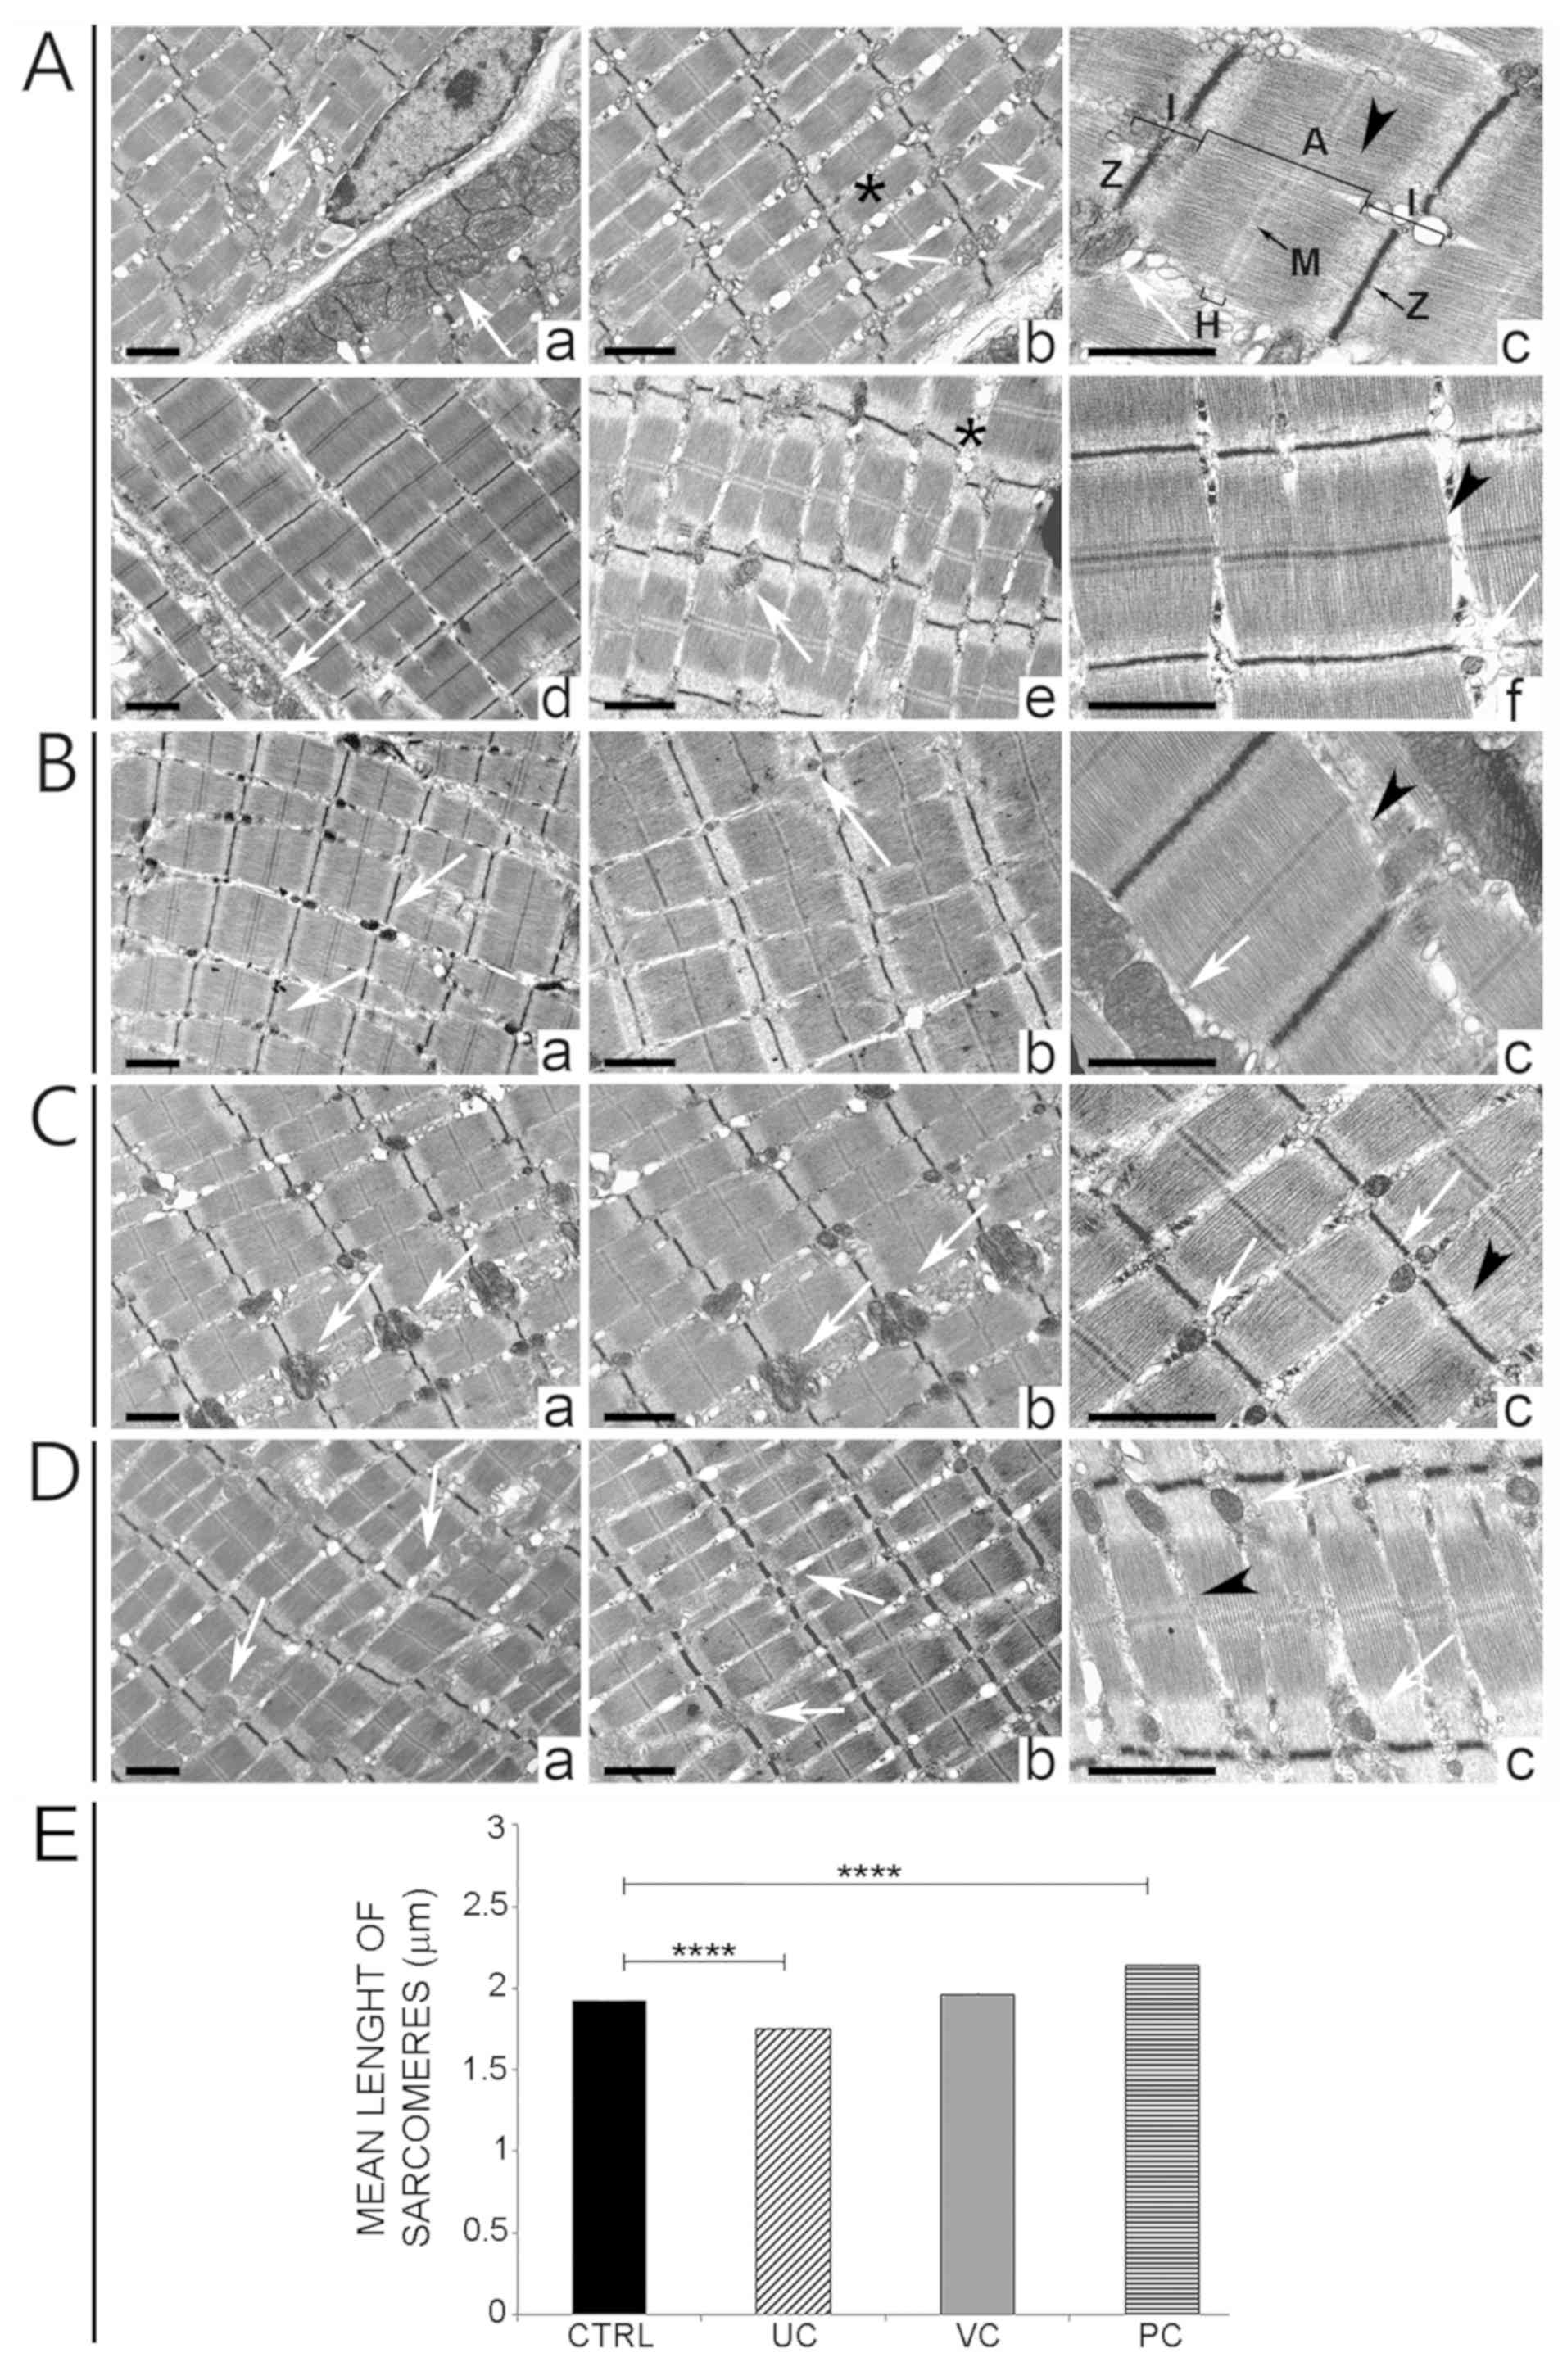 | Figure 3Muscular plasticity adaptation
following training with the different protocols. (A)
Ultrastructural analysis of tissue samples from extensor muscles of
the control group 4 months after birth (a-f). Myofibrils were well
organized, the sarcomeres were well aligned (a-f) and the
mitochondria were peripherally distributed (white arrows in a-f). A
small dilatation of the sarcoplasmic reticulum (in b and e) was
evident. The arrowhead indicates the sarcomere between two Z bands
and encompassing the Z and M bands (black arrows) and the I, A and
H bands, as indicated. (B) Ultrastructural analysis of tissue
samples from extensor muscles of the UC group (a-c). Several
mitochondria were located between the fibers (white arrows in a-c).
The arrowhead indicates the sarcomere (c). (C) Ultrastructural
analysis of tissue samples from extensor muscles of the VC group
(a-c). An increase in the density of mitochondria was visible
amongst the fibers (white arrows in a-c). The arrowhead indicates
the sarcomere (c). (D) Ultrastructural analysis of tissue samples
from extensor muscles of the PC group (a-c). Elongated and fusiform
sarcomeres are visible (arrowhead in c). Mitochondria were visible
amongst the fibers (white arrows in a-c). Scale bar, 1 µm. (E)
Differences in sarcomere lengths among the different training
protocols. The mean lengths of sarcomeres were 1.92±0.13 µm in
control animals, 1.75±0.19 µm in the UC group, 1.96±0.12 µm in the
VC group and 2.14±0.25 µm in the PC group. ****P<0.0001. CTRL,
control; UC, uniform continuous; VC, varying continuous; PC,
progressive continuous. |
Effect of training protocols on
myoglobin and SDHA expression
The effects of the three training protocols on the
expression of myoglobin and SDHA were examined and compared with
the control in a total of 96 tissue samples from the posterior
extensor, sural triceps and brachial triceps. As shown in Fig. 4A, the extensor muscle of the anterior
limb exhibited an increase in tissue myoglobin content in all
trained mice groups, but this increase was not statistically
significant. The mean densitometric value of myoglobin measured in
the anterior limb muscle was 1±0.5 in the control group, 1.8±0.8 in
the UC group, 2.4±1.1 in the VC group and 2.6±1.9 in the PC group.
Corresponding figures for posterior limb muscles were, 1.1±0.5,
0.9±0.5, 1.5±0.6 and 1.5±0.5, respectively (Fig. 4B), and no significant differences were
observed in the myoglobin content between sedentary control and
trained mice.
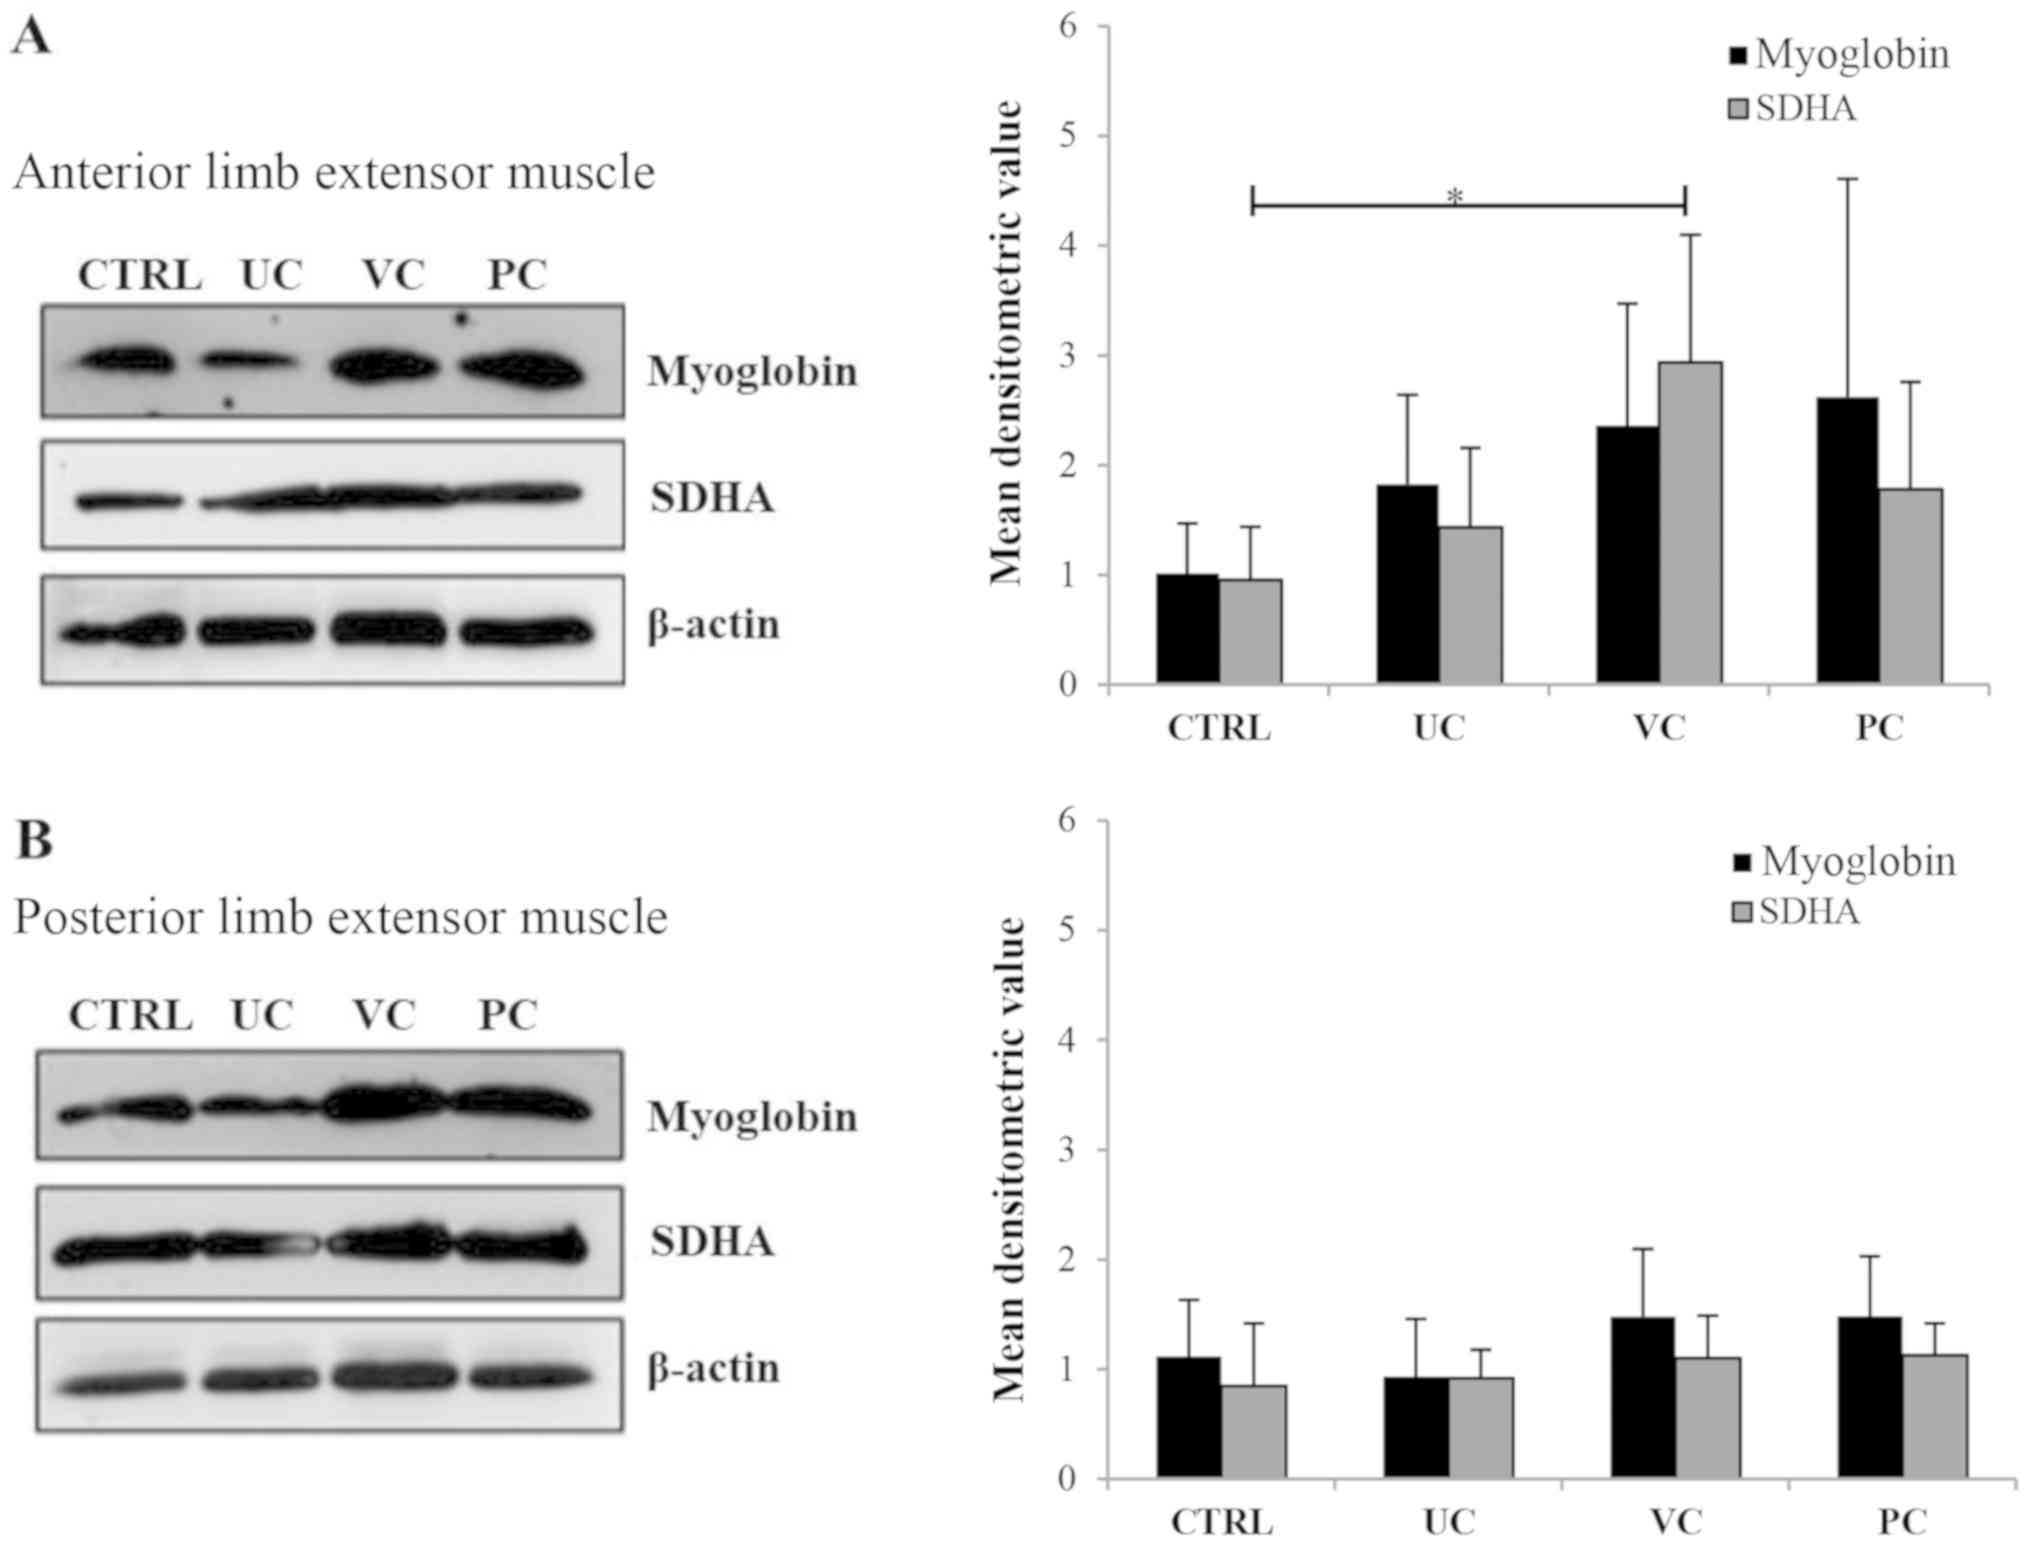 | Figure 4Effects of the three training
protocols on myoglobin and SDHA expression. (A) Left,
representative western blotting of myoglobin and SDHA expression in
the anterior limb muscle of mice from each of the four experimental
groups; right, densitometry analysis of protein expression based on
western blotting. Arbitrary densitometry values for myoglobin
(black bars) were: Control group, 1±0.5; UC group, 1.8±0.8; VC
group, 2.4±1.1; and PC group, 2.6±1.9. Values for SDHA (grey bars)
were: Control group, 0.9±0.5; UC group, 1.4±0.7; VC group, 2.9±1.2;
and PC group, 1.8±0.9. SDHA expression in the anterior limb
extensor muscles of the VC trained mice was significantly higher
compared with the control mice. *P<0.05. (B) Left,
representative western blot of myoglobin and SDHA expression in the
posterior limb muscles of mice from each of the four experimental
groups; right, densitometry analysis of protein expression based on
western blotting. Arbitrary densitometry values for myoglobin
(black bars) were: Control group, 1.1±0.5; UC group, 0.9±0.5; VC
group, 1.5±0.6; and PC group, 1.5±0.5; and there was no
statistically significant differences between any of the groups.
Values for SDHA (gray bars) were: Control group, 0.8±0.6; UC group,
0.9±0.3; VC group, 1.1±0.4; and PC group, 1.1±0.3; and there was no
statistically significant differences between any of the groups.
For all densitometry analysis, β-actin was used as the loading
control. UC, uniform continuous; VC, varying continuous; PC,
progressive continuous; SDHA, succinate dehydrogenase complex
flavoprotein subunit A. |
Expression of SDHA was increased in the anterior
limb extensor muscles of trained mice. Mean densitometric values in
these samples were 0.9±0.5 in control animals, 1.4±0.7 in the UC
group, 2.9±1.2 in the VC group and 1.8±0.9 in the PC group; and the
increase in SDHA in the VC group was significant compared with the
untrained mice (P<0.05; Fig. 4B).
No differences were observed in samples taken from the posterior
limb extensor muscle (Fig. 4B), where
the values were 0.8±0.6 in the control group, 0.9±0.3 in the UC
group, 1.1±0.4 in the VC group and 1.1±0.3 in the PC group. These
results show that only SDHA was increased significantly in muscle
tissues from animals trained with VC protocols in the anterior
limb.
Discussion
The present study was designed to examine the
structural and biochemical adaptation of skeletal muscle to
different continuous types of training modalities in a murine mouse
model. The effects of continuous training modalities on muscle
ultrastructure, plasticity and functional properties in mice were
examined and the morphological and functional changes in
experimental animals exposed to different types of continuous
training were compared.
The results of the present study showed that
VC-training resulted in higher efficiency gains for animals. This
was particularly true in the cross-over tests and was also
supported by the results of the dynamometer tests which showed that
suspension times in the VC-trained animals was 255% longer than
prior to training, whereas in the PC group the increase was only
21% and in the UC group, the suspension time was worse than before
training, suggesting that the UC training modality may result in a
decrease in strength endurance. The VC protocol was the most
challenging protocol as demonstrated by the higher number of falls
recorded in VC group during the twelve weeks of training. This
increase in difficulty may be due to the 33 speed changes during
each VC training session and the fact that the mean speed was
slightly higher compared with the other groups. The higher
challenge posed by the VC protocol was confirmed in the cross-over
tests which showed that the number of falls of PC and UC trained
mice was higher when crossed-over to the VC training protocol.
Taken together, these data indicated that VC training induced
higher functional efficiency as it exhibited the best results in
the cross-over test and the highest improvement in the strength
endurance test on the dynamometer.
While a relatively large number of studies are
available on muscle hypertrophy in different clinical conditions
(25,26), less is known regarding the
ultrastructural changes which occur in normal skeletal muscles
during and after continuous training modalities. In the present
study, the ultrastructural analysis of lower limb extensor muscles
of mice trained with different protocols was assessed, and it
showed a well-organized structure of myofibrils and sarcomeres. A
small increase in the condensation of mitochondria was evident in
the muscles of all trained mice, and dilatation of the sarcoplasmic
reticulum was also observed, although this may have been due to the
increased energy demands (27).
Analyzing the length of the sarcomeres following the
different protocols showed that there was a significant decrease in
sarcomere length in the UC-trained mice, and a significant
elongation in the PC-trained mice. The shortening of sarcomeres
observed in the UC mice may suggest an impaired capacity to
generate short bursts of high energy muscle contractions and
reduced muscle tissue flexibility; whereas the elongation of the
sarcomeres in the PC group may have improved flexibility and
preserved the capacity to generate short bursts of high energy
muscle contractions. The length of sarcomeres in the VC group was
similar to that of the control group, thus suggesting that both
flexibility and short burst generation capacity are preserved
(5,6,28,29). The variations in length of the
sarcomere might be related to the motor efficiency as also
suggested by the in vivo results of the cross over test.
These results appear to support the view that
different patterns of muscle plasticity may evolve in response to
different types of aerobic training, and that based on sarcomere
length in muscle cells in the different training groups, muscle
plasticity may largely depend on long term training methods. This
is shown in the PC animals which exhibited a lesser enlargement of
muscle tissues with little to no evidence of stress at the
sub-cellular level.
In the present study, the levels of myoglobin and
SDHA in the extensor muscles of both lower and front limbs in each
experimental group were also assessed. Changes in myoglobin and
SDHA expression was sensitive to training with the different
protocols, and the relevance of these changes requires further
investigation. Expression of SDHA was significantly increased only
in the anterior limb muscles of the VC-trained mice. This latter
observation may possibly be associated with the increased energy
requirements in the VC protocol. Comparing the three training
protocols directly showed that there were differences in the end
results observed. The UC protocol appeared to result in less
efficient coordination, strength endurance and performance on the
RotaRod. The observation that sarcomere length in samples from
UC-trained animals was shorter compared with the control may
underlie the less efficient response in terms of strength endurance
in this group. The VC protocol resulted in higher efficiency
coordination, strength endurance and RotaRod test results leading
to a higher performance status. The data show that mice trained
with the VC protocol exhibited significantly increased levels of
SDHA in the anterior limb muscle tissues compared with the control
mice, suggesting enhanced aerobic metabolism (30). The PC training protocol was less
efficient compared with the VC protocol in terms of coordination,
strength endurance and RotaRod exercise performance, whereas the
PC-trained animals performed considerably better compared with the
mice trained using the UC protocol.
Whilst the data from the present study may not
directly relate to humans, based on the data presented, a VC-like
protocol may be proposed as a first choice approach to training
when a pronounced improvement of motor efficiency is required,
although additional studies in humans are required to confirm the
potential beneficial effects of such a training regimen. The
present study provides further evidence that varying stimulation is
important for skeletal muscle adaptation, as also suggested by
human-based studies on interval training (31). Additionally, studies designed to
understand muscle responses to various training modalities and to
explore underlying mechanisms and influencing variables may assist
in optimizing exercise interventions in humans for different
outcomes in different settings (32,33).
Acknowledgements
The authors would like to thank Professor Andrea
Modesti, Department of Clinical Sciences and Translational
Medicine, Faculty of Medicine, University of Rome Tor Vergata, for
the precious advice in performing ultrastructural analysis.
Funding
No funding was received.
Availability of data and materials
The datasets used and/or analyzed during the present
study are available from the corresponding author on reasonable
request.
Authors' contributions
GP and MP performed the animal experiments. IC
performed the western blotting experiments. LM and RB performed
transmission electron microscopy analysis. RB, GDA and VT wrote and
edited the manuscript. GDA and VT conceived and supervised the
study. All authors read and approved the final manuscript.
Ethics approval and consent to
participate
Animal experiments were performed in accordance with
the guidelines and regulations of the European Union Council
Directive (86/609/European Economic Community) and all experimental
protocols were approved by the Italian Ministry of Public Health
(approval no. 86/2018-PR).
Patients consent for publication
Not applicable.
Competing interests
The authors declare that they have no competing
interests.
References
|
1
|
Costill DL, Daniels J, Evans W, Fink W,
Krahenbuhl G and Saltin B: Skeletal muscle enzymes and fiber
composition in male and female track athletes. J Appl Physiol.
40:149–154. 1976.PubMed/NCBI View Article : Google Scholar
|
|
2
|
Harber M and Trappe S: Single muscle fiber
contractile properties of young competitive distance runners. J
Appl Physiol (1985). 105:629–636. 2008.PubMed/NCBI View Article : Google Scholar
|
|
3
|
Coyle EF: Integration of the physiological
factors determining endurance performance ability. Exerc Sport Sci
Rev. 23:25–63. 1995.PubMed/NCBI
|
|
4
|
Hawley JA: Adaptations of skeletal muscle
to prolonged, intense endurance training. Clin Exp Pharmacol
Physiol. 29:218–222. 2002.PubMed/NCBI View Article : Google Scholar
|
|
5
|
Fitts RH, McDonald KS and Schluter JM: The
determinants of skeletal muscle force and power: Their adaptability
with changes in activity pattern. J Biomech. 1:111–122.
1991.PubMed/NCBI View Article : Google Scholar
|
|
6
|
Fitts RH and Widrick JJ: Muscle mechanics:
Adaptations with exercise-training. Exerc Sport Sci Rev.
24:427–473. 1996.PubMed/NCBI
|
|
7
|
Goldspink G: Malleability of the motor
system: A comparative approach. J Exp Biol. 115:375–391.
1985.PubMed/NCBI
|
|
8
|
Hegarty PV and Hooper AC: Sarcomere length
and fibre diameter distributions in four different mouse skeletal
muscles. J Anat. 110:249–257. 1971.PubMed/NCBI
|
|
9
|
Widrick JJ, Stelzer JE, Shoepe TC and
Garner DP: Functional properties of human muscle fibers after
short-term resistance exercise training. Am J Physiol Regul Integr
Comp Physiol. 283:R408–R416. 2002.PubMed/NCBI View Article : Google Scholar
|
|
10
|
Fitts RH: New insights on sarcoplasmic
reticulum calcium regulation in muscle fatigue. J Appl Physiol
(1985). 111:345–346. 2011.PubMed/NCBI View Article : Google Scholar
|
|
11
|
Groennebaek T and Vissing K: Impact of
resistance training on skeletal muscle mitochondrial biogenesis,
content, and function. Front Physiol. 8(713)2017.PubMed/NCBI View Article : Google Scholar
|
|
12
|
Holloszy JO and Coyle EF: Adaptations of
skeletal muscle to endurance exercise and their metabolic
consequences. J Appl Physiol Respir Environ Exerc Physiol.
56:831–838. 1984.PubMed/NCBI View Article : Google Scholar
|
|
13
|
Hood DA: Contractile activity-induced
mitochondrial biogenesis in skeletal muscle. J Appl Physiol (1985).
90:1137–1157. 2001.PubMed/NCBI View Article : Google Scholar
|
|
14
|
Schantz PG: Plasticity of human skeletal
muscle with special reference to effects of physical training on
enzyme levels of the NADH shuttles and phenotypic expression of
slow and fast myofibrillar proteins. Acta Physiol Scand Suppl.
558:1–62. 1986.PubMed/NCBI
|
|
15
|
Lundberg TR, Fernandez-Gonzalo R,
Gustafsson T and Tesch PA: Aerobic exercise does not compromise
muscle hypertrophy response to short-term resistance training. J
Appl Physiol (1985). 114:81–89. 2013.PubMed/NCBI View Article : Google Scholar
|
|
16
|
Konopka AR and Harber MP: Skeletal muscle
hypertrophy after aerobic exercise training. Exerc Sport Sci Rev.
42:53–61. 2014.PubMed/NCBI View Article : Google Scholar
|
|
17
|
Tjønna AE, Lee SJ, Rognmo Ø, Stølen TO,
Bye A, Haram PM, Loennechen JP, Al-Share QY, Skogvoll E, Slørdahl
SA, et al: Aerobic interval training versus continuous moderate
exercise as a treatment for the metabolic syndrome: A pilot study.
Circulation. 118:346–354. 2008.PubMed/NCBI View Article : Google Scholar
|
|
18
|
Wisløff U, Støylen A, Loennechen JP,
Bruvold M, Rognmo Ø, Haram PM, Tjønna AE, Helgerud J, Slørdahl SA,
Lee SJ, et al: Superior cardiovascular effect of aerobic interval
training versus moderate continuous training in heart failure
patients: A randomized study. Circulation. 115:3086–3094.
2007.PubMed/NCBI View Article : Google Scholar
|
|
19
|
Alansare A, Alford K, Lee S, Church T and
Jung HC: The effects of high-intensity interval training vs.
Moderate-Intensity continuous training on heart rate variability in
physically inactive adults. Int J Environ Res Public Health.
15(E1508)2018.PubMed/NCBI View Article : Google Scholar
|
|
20
|
Gaitán JM, Eichner NZM, Gilbertson NM,
Heiston EM, Weltman A and Malin SK: Two weeks of interval training
enhances fat oxidation during exercise in obese adults with
prediabetes. J Sports Sci Med. 18:636–644. 2019.PubMed/NCBI
|
|
21
|
D'Arcangelo G, Triossi T, Buglione A,
Melchiorri G and Tancredi V: Modulation of synaptic plasticity by
short-term aerobic exercise in adult mice. Behav Brain Res.
332:59–63. 2017.PubMed/NCBI View Article : Google Scholar
|
|
22
|
Louhimies S: Directive 86/609/EEC on the
protection of animals used for experimental and other scientific
purposes. Altern Lab Anim. 2:217–219. 2002.PubMed/NCBI View Article : Google Scholar
|
|
23
|
D'Arcangelo G, Grossi D, Racaniello M,
Cardinale A, Zaratti A, Rufini S, Cutarelli A, Tancredi V, Merlo D
and Frank C: Miglustat reverts the impairment of synaptic
plasticity in a mouse model of NPC disease. Neural Plast.
2016(3830424)2016.PubMed/NCBI View Article : Google Scholar
|
|
24
|
Masuelli L, Focaccetti C, Cereda V, Lista
F, Vitolo D, Trono P, Gallo P, Amici A, Monaci P, Mattei M, et al:
Gene-Specific inhibition of breast carcinoma in BALB-neuT mice by
active immunization with rat neu or human ErbB receptors. Int J
Oncol. 30:381–392. 2007.PubMed/NCBI
|
|
25
|
Ballesta García I, Rubio Arias JÁ, Ramos
Campo DJ, Martínez González-Moro I and Carrasco Poyatos M:
High-Intensity interval training dosage for heart failure and
coronary artery disease cardiac rehabilitation. A systematic review
and meta-analysis. Rev Esp Cardiol (Engl Ed). 72:233–243.
2019.PubMed/NCBI View Article : Google Scholar
|
|
26
|
Ballesta-García I, Martínez González-Moro
I, Rubio-Arias JÁ and Carrasco-Poyatos M: High-Intensity interval
circuit training versus moderate-intensity continuous training on
functional ability and body mass index in middle-aged and older
women: A randomized controlled trial. Int J Environ Res Public
Health. 16(E4205)2019.PubMed/NCBI View Article : Google Scholar
|
|
27
|
Mannella CA: Structural diversity of
mitochondria: Functional implications. Ann NY Acad Sci.
1147:171–179. 2008.PubMed/NCBI View Article : Google Scholar
|
|
28
|
Gordon AM, Huxley AF and Julian FJ: The
variation in isometric tension with sarcomere length in vertebrate
muscle fibres. J Physiol. 184:170–192. 1966.PubMed/NCBI View Article : Google Scholar
|
|
29
|
Herzog W and Leonard TR: Force enhancement
following stretching of skeletal muscle: A new mechanism. J Exp
Biol. 205:1275–1283. 2002.PubMed/NCBI
|
|
30
|
Riis S, Christensen B, Nellemann B, Møller
AB, Husted AS, Pedersen SB, Schwartz TW, Jørgensen JOL and Jessen
N: Molecular adaptations in human subcutaneous adipose tissue after
ten weeks of endurance exercise training in healthy males. J Appl
Physiol (1985). 126:569–577. 2019.PubMed/NCBI View Article : Google Scholar
|
|
31
|
Cochran AJ, Percival ME, Tricarico S,
Little JP, Cermak N, Gillen JB, Tarnopolsky MA and Gibala MJ:
Intermittent and continuous high-intensity exercise training induce
similar acute but different chronic muscle adaptations. Exp
Physiol. 99:782–791. 2014.PubMed/NCBI View Article : Google Scholar
|
|
32
|
Aisbett B, Condo D, Zacharewicz E and
Lamon S: The impact of shiftwork on skeletal muscle health.
Nutrients. 9(E248)2017.PubMed/NCBI View Article : Google Scholar
|
|
33
|
Dobbins M, Husson H, DeCorby K and LaRocca
RL: School-Based physical activity programs for promoting physical
activity and fitness in children and adolescents aged 6 to 18.
Cochrane Database Syst Rev. 2(CD007651)2013.PubMed/NCBI View Article : Google Scholar
|