Introduction
Osteoarthritis (OA) is the most common joint
disorder that results from a degradation of the articular
cartilage, osteophyte formation and subchondral bone sclerosis
(1). The symptoms of the disease
include pain, decreased range of motion and physical function that
leads to mobility impairment later in life (2). Knee OA remains a major cause of lower
limb disability, particularly in the elderly, and has been
recognized as a major global health problem. The prevalence of knee
OA in people aged >55 years is 15.6% in male and 30.5% in female
(3). Moreover, there are multiple
factors that can affect OA pathogenesis such as aging, mechanical
stress, low level inflammation, environmental factors and genetic
factors (4).
Telomere length is a potential valuable biomarker
for biological age and several age-related chronic degenerative
diseases (5,6). Telomeres are tandem repeats at the
chromosomal ends, consisting of repetitive DNA sequences of TTAGGG,
that serve a critical role in maintaining the integrity of the
genome (6). The capping function of
telomeres protects chromosomes from degrading and prevents the
recombination and end-to-end fusion between chromosomes (6). When cells divide, the telomere shortens
as DNA polymerases are not capable of completely replicating the
chromosomes; this phenomenon was revealed to be the end-replication
issue that causes the cells to enter into a state of senescence,
apoptosis and inability to replicate (6,7).
Therefore, telomere length has been suggested as a biomarker for
cellular aging and health status, and is associated with mortality
(5,8). In a previous cardiovascular health
study, telomere length was revealed to be associated with physical
activity and physical fitness (9,10).
Previous studies have reported that OA is closely
associated with telomere shortening in the blood and cartilage of
patients with different forms of OA (11,12).
However, to the best of our knowledge, the relationships between
telomere length, muscle strength and physical performance in
patients with knee OA have not been previously investigated. Thus,
it was hypothesized that telomere shortening may be associated with
poor muscle strength and physical performance in patients with knee
OA. Therefore, the present study investigated the relationship
between leukocyte telomere length, muscle strength and physical
performance in patients with knee OA.
Materials and methods
Ethics
The study protocol conformed to the ethical
standards outlined in the Declaration of Helsinki and was approved
by the Institutional Review Board on Human Research of the Faculty
of Medicine, Chulalongkorn University. Patients that were eligible
for the study were approached. Knee OA participants who met the
criteria of American College of Rheumatology (13) and were aged 50-80 years were enrolled
in the present study. Information pertaining to the study was
provided to all patients, and written informed consent was obtained
from all participants.
Study participants
A cross-sectional study was conducted in 202
patients with knee OA (181 females; 21 males; aged 50-80 years,
mean age, 65.35 years). All procedures were performed at the
outpatient clinic of the Department of Orthoapedics, King
Chulalongkorn Memorial Hospital between January and December 2015.
The exclusion criteria for knee OA participants included the
Kellgren-Lawrence grading >3(14), history of knee surgery and other
forms of arthritis than OA (such as septic arthritis, rheumatoid
arthritis and gout). In total, 60 healthy volunteers with no
clinical or radiographic evidence of OA (34 females; 26 males; aged
50-80 years; mean age, 62.25 years) were enrolled in the current
study.
Clinical parameter assessment
Knee OA participants completed a self-report pain
questionnaire designed by the Western Ontario and McMaster
Universities Osteoarthritis Index (WOMAC) (15) and health-related quality of life
questionnaire (16). WOMAC was used
to assess the pain (15), stiffness
and physical disability of the patient, based on a scale that
ranged between 0-10. A total WOMAC score was created by summing the
items for all three subscales and a high score indicated worst
pain, stiffness and physical disability (15). The Thai version of the Short Form
Health Survey (SF-12) was used to evaluate the health-related
quality of life, which included physical health composite scores
and mental health composite scores (MCS) that ranged between 0-100;
higher scores indicated improved health (16).
Anthropometric measurements and
skeletal muscle index (SMI)
The participant's height and weight were measured to
calculate the participant's body mass index (BMI; weight in
kg/height in m2). The waist circumference (WC) was also
measured. Bioelectrical impedance analysis (BIA; Tanita BC-418;
Tanita) was used to evaluate the percentage of total fat mass (Fat
%), fat mass (FM) and visceral fat rate. The SMI was obtained from
the sum of the percentages of the skeletal muscle mass of the arms
and legs, excluding the trunk, that were divided by the body weight
(%).
Muscle strength
Grip strength of the dominant (preferred) and
non-dominant (not preferred) hands was examined using a grip
strength dynamometer (Takei Scientific Instruments Co., Ltd.). The
force was recorded in kg. The best of the three trials was
presented as the maximal squeeze.
Quadriceps strength in symptomatic and
non-symptomatic legs was assessed with a hand-held dynamometer
(MicroFET 2; Hoggan). The force was recorded in Newtons (N). The
participants were seated on the examination table and their knees
were flexed to 90˚. The lower legs were vertical to the floor and
the quadriceps strength was assessed when the knees were flexed at
90˚. The participants then raised their lower legs and held this
position against the maximum persistent force (5 sec) applied by
the physical therapist via the hand-held dynamometer, which was
pointed on the anterior part of the lower leg, 5-cm above the
proximal ankle and on a vertical line to the tibia crest. The mean
of the three trials represented the maximum quadriceps
strength.
Physical performance
To assess the usual 4 m gait speed, the participants
were instructed to walk at a normal pace. The time to walk 4 m was
recorded with a standard stopwatch and the gait speed was
calculated as the walking distance divided by the time. The gait
speed was measured twice, and the fastest time was used.
As for the timed up and go test (TUGT), the
participants sat in a standard chair. Then, the participants were
requested to stand up from the chair and walk a distance of 3 m at
a comfortable pace, and then return to the chair to sit down
again.
For the Sit to stand test (STS), the participants
performed five consecutive chair stands from a standard chair that
was 45-cm high as quickly as possible with their arms across their
chest. This activity was measured in sec.
With regards to the 6-min Walk (6MWT) test, the
participants were requested to cover as much distance as possible
at a self-paced walking velocity within 6 min on a flat surface
that was 25 m long.
Measurement of the telomere
length
Genomic DNA was extracted from peripheral blood
leukocytes (3 ml whole blood) using a commercial DNA isolation kit
(GF-1 blood DNA extraction kit; Vivantis Technologies Sdn Bhd).
Leukocyte telomere length was measured as a ratio of the telomere
repeat copy number (T) to the single-copy gene copy number (S; T/S
ratio) using quantitative real time PCR (qPCR) as described
previously (17).
qPCR was performed using a StepOnePlus Real Time PCR
system (Applied Biosystems; Thermo Fisher Scientific, Inc.) with
SYBR-Green fluorescence (RBC Bioscience). Briefly, two pairs of
primers were used to amplify the telomere repeats copy number
relative to another 36B4 for the amplification of the single-copy
nuclear gene. The primers utilized for telomere repeat copy number
were as follows: Telomere forward,
5'-CGGTTTGTTTGGGTTTGGGTTTGGGTTTGGGTTTGGGTT-3' and reverse,
5'-GGCTTGCCTTACCCTTACCCTTACCCTTACCCTTACCCT-3'. For the single-copy
gene, the following primers were used: 36B4 forward,
5'-CAGCAAGTGGGAAGGTGTAATCC-3' and reverse,
5'-CCCATTCTATCATCAACGGGTACAA-3'. The thermocycling conditions for
the telomeres and single copy genes included: Initial denaturation
at 95˚C for 10 min, followed by 40 cycles of 15 sec at 95˚C and 1
min at 54˚C. All samples were performed in duplicate for both
telomere and 36B4 reactions in the same run using 2 ng DNA per 10
µl reaction. The relative T/S ratio was calculated by using the
2-ΔΔCq method (18,19).
Statistical analysis
Experiments were performed in triplicate and
repeated at least twice. Statistical analyses were performed using
the SPSS software v.22.0 for Windows (IBM Corp.). Statistical
significance between baseline variables of the healthy controls and
OA participants was determined using χ2 test and
unpaired Student's t-test. Comparisons between the means of
the quartile of RTL were performed using one-way ANOVA with Tukey's
post hoc test if ANOVA showed significance. Correlations were
analyzed using Spearman's rank correlation and multivariate linear
regression analysis. Multiple logistic regression analysis was
performed to determine the strength of association between RTL,
muscle strength and physical performance using the age, sex, WC,
BMI, FM, SMI and total of WOMAC as the covariates and odds ratio
(OR) with a 95% CI. Data are presented as the mean ± SEM. P<0.05
was considered to indicate a statistically significant
difference.
Results
Participant characteristics
A total of 202 patients with knee OA and 60 healthy
controls were age-matched (P=0.5) and sex-matched (P=0.4), and the
baseline characteristics are presented in Table I. The female:male ratio was 181:21
for knee OA participants and 34:26 for the controls (P=0.4). The
mean blood leukocyte RTL in knee OA subjects was significantly
lower compared with the healthy controls (0.59±0.10 vs. 1.31±0.30;
P<0.001). Moreover, there was no significant difference in the
BMI between the OA participants and the controls (P>0.05).
 | Table IBaseline characteristics of 202
patients with knee OA. |
Table I
Baseline characteristics of 202
patients with knee OA.
|
Characteristics | Patients with knee
OA | Healthy
controls | P-value |
|---|
| Age, years | 65.35±5.1 | 62.25±6.42 | 0.5 |
| Sex | | | 0.4 |
|
Female | 181 | 34 | |
|
Male | 21 | 26 | |
| RTL, T/S ratio | 0.59±0.10 | 1.31±0.30 | <0.001 |
| BMI,
kg/m2 | 25.50±0.29 | 25.55±1.21 | 0.6 |
| Waist
circumference, cm | 87.99±0.70 | NA | NA |
| Body
composition |
|
Fat % | 35.22±0.52 | NA | NA |
|
Fat mass,
kg | 22.59±0.60 | NA | NA |
|
Visceral fat
rating, % | 9.70±0.29 | NA | NA |
|
SMI, % | 28.55±0.28 | NA | NA |
| WOMAC |
|
Pain,
0-10 | 2.64±0.14 | NA | NA |
|
Stiffness,
0-10 | 2.75±0.17 | NA | NA |
|
Physical
disability, 0-10 | 3.08±0.15 | NA | NA |
|
Total score,
0-10 | 2.80±0.13 | NA | NA |
| SF-12 |
|
PCS,
0-100 | 38.04±0.65 | NA | NA |
|
MCS,
0-100 | 49.03±0.65 | NA | NA |
The OA participants were subsequently classified
into the good outcome group (n=135) and the poor outcome group
(n=67), as previously described by Colbert et al (20). There was no statistically significant
difference in the mean leukocyte RTL between knee OA participants
with good and poor outcomes (0.59±0.02 vs. 0.58±0.02; P=0.948).
Comparison between female and male
knee OA participants
In the stratified analysis, according to sex
(Table II), there were no
significant differences in age and the mean leukocyte RTL, WOMAC,
SF-12 and physical performance between female and male participants
(P>0.05). However, male participants had significantly higher
BMI, WC, visceral fat rating, SMI and muscle strength compared with
the female participants (P<0.05). In contrast, Fat % and FM were
significantly greater in females compared with male participants
(P<0.05).
| Table IIComparison of the characteristics
between female and male patients with knee OA. |
Table II
Comparison of the characteristics
between female and male patients with knee OA.
| Patients with knee
OA | |
|---|
| Variables | Females
(n=181) | Males (n=21) | P-value |
|---|
| Age, years | 65.32±0.53 | 65.71±1.86 | 0.81 |
| RTL, T/S ratio | 0.58±0.01 | 0.59±0.05 | 0.86 |
| BMI,
kg/m2 | 25.17±0.29 | 28.31±1.18 | 0.001 |
| Waist
circumference, cm | 86.79±0.68 | 98.33±2.58 | <0.001 |
| Body
composition |
|
Fat % | 36.14±0.51 | 27.52±1.75 | <0.001 |
|
Fat mass,
kg | 27.66±0.62 | 22.11±2.25 | 0.04 |
|
Visceral fat
rating, % | 8.91±0.24 | 16.28±1.09 | <0.001 |
|
SMI, % | 27.78±0.23 | 35.02±0.97 | <0.001 |
| WOMAC |
|
Pain,
0-10 | 2.67±0.15 | 2.09±0.38 | 0.20 |
|
Stiffness,
0-10 | 2.75±0.18 | 2.48±0.49 | 0.64 |
|
Physical
disability, 0-10 | 3.11±0.15 | 2.51±0.45 | 0.21 |
|
Total score,
0-10 | 2.81±0.14 | 2.36±0.40 | 0.29 |
| SF-12 |
|
PCS,
0-100 | 37.83±0.70 | 40.40±1.81 | 0.22 |
|
MCS,
0-100 | 48.98±0.71 | 49.82±1.60 | 0.69 |
| Muscle
strength |
|
Grip
strength, kg |
|
Dominant | 21.03±0.30 | 32.72±1.45 | <0.001 |
|
Non-dominant | 19.02±0.30 | 30.52±1.39 | <0.001 |
| Knee extension
force, N |
|
Symptomatic
leg | 365.49±7.16 | 432.75±20.83 | 0.003 |
|
Non-symptomatic
leg | 417.31±7.71 | 478.15±20.43 | 0.01 |
| Physical
performance |
|
Gait speed,
m/sec | 0.93±0.01 | 1.01±0.04 | 0.09 |
|
TUGT,
sec | 9.96±0.19 | 9.46±0.48 | 0.40 |
|
STS,
sec | 15.21±0.35 | 12.64±0.611 | 0.01 |
|
6MWT, m | 365.84±6.09 | 382.90±21.38 | 0.38 |
Quartile of blood leukocyte RTL of
knee OA participants
The RTL values were further separated into quartile
levels. Participants with RTL values in the 1st quartile had the
shortest telomere length. If the RTL values were in the 4th
quartile, then it indicated that the telomere length was the
longest. Table III presents the
characteristics of the participants in each group. There were no
significant differences between participants with short telomere
lengths (1st quartile) or long telomere lengths (4th quartile) for
age, BMI, WC, body composition using BIA analysis, WOMAC and muscle
strength (P>0.05). However, the participants with RTL values in
the 1st quartile had the lowest MCS scores for SF-12, slowest gait
speed and longer time for TUGT compared with the other
quartiles.
| Table IIIDemographic characteristics of
patients with knee osteoarthritis according to the quartile of
RTL. |
Table III
Demographic characteristics of
patients with knee osteoarthritis according to the quartile of
RTL.
| RTL | |
|---|
| Variables | 1st quartile
(n=53) | 2nd quartile
(n=51) | 3rd quartile
(n=50) | 4th quartile
(n=48) | P-value |
|---|
| RTL, T/S ratio | 0.33±0.01 | 0.49±0.01 | 0.64±0.01 | 0.90±0.02 | <0.001 |
| Age, years | 66.62±0.93 | 65.24±0.87 | 65.28±1.17 | 64.13±1.11 | 0.39 |
| BMI,
kg/m2 | 25.69±0.60 | 25.38±0.48 | 24.67±0.59 | 26.27±0.69 | 0.30 |
| Waist
circumference, cm | 89.14±1.44 | 87.66±1.12 | 85.86±1.53 | 89.34±1.44 | 0.28 |
| Body
composition |
|
Fat % | 34.76±1.14 | 36.17±0.87 | 34.13±1.18 | 35.88±0.97 | 0.48 |
|
Fat mass,
kg | 22.24±1.17 | 23.13±1.03 | 21.33±1.28 | 23.75±1.34 | 0.52 |
|
Visceral fat
rating, % | 9.92±0.56 | 9.26±0.45 | 9.23±0.60 | 10.41±0.70 | 0.44 |
|
SMI, % | 29.26±0.64 | 27.67±0.46 | 28.81±0.60 | 28.44±0.52 | 0.23 |
| WOMAC |
|
Pain,
0-10 | 2.48±0.33 | 3.05±0.26 | 2.33±0.26 | 2.70±0.27 | 0.31 |
|
Stiffness,
0-10 | 2.71±0.37 | 2.93±0.34 | 2.81±0.32 | 2.54±0.37 | 0.88 |
|
Physical
disability, 0-10 | 3.32±0.33 | 3.27±0.27 | 2.84±0.26 | 3.05±0.30 | 0.38 |
|
Total score,
0-10 | 2.84±0.30 | 3.04±0.26 | 2.55±0.23 | 2.76±0.27 | 0.64 |
| SF-12 |
|
PCS,
0-100 | 38.25±1.36 | 35.42±1.16 | 40.10±1.29 | 38.42±1.35 | 0.09 |
|
MCS,
0-100 | 46.30±1.05 | 51.40±1.33 | 48.96±1.47 | 49.70±1.31 | 0.04a |
| Muscle
strength |
|
Grip
strength, kg |
|
Dominant | 22.17±0.90 | 22.04±0.53 | 22.00±0.75 | 23.01±0.95 | 0.69 |
|
Non-dominant | 19.96±0.84 | 19.76±0.58 | 19.99±0.77 | 21.06±0.98 | 0.67 |
| Knee extension
force, N |
|
Symptomatic
leg | 361.03±16.32 | 378.63±14.30 | 363.78±12.79 | 382.74±11.25 | 0.61 |
|
Non-symptomatic
leg | 412.51±16.28 | 427.39±15.3 | 421.97±14.75 | 429.23±12.06 | 0.85 |
| Physical
performance |
|
Gait speed,
m/sec | 0.87±0.02 | 0.93±0.03 | 0.99±0.02 | 0.98±0.01 | 0.006b |
|
TUGT,
sec | 10.76±0.40 | 9.82±0.36 | 9.57±0.29 | 9.42±0.29 | 0.03b |
|
STS,
sec | 15.58±0.68 | 15.75±0.70 | 14.67±0.57 | 13.59±0.56 | 0.07 |
|
6MWT, m | 344.49±11.89 | 370.60±12.03 | 376.86±11.66 | 380.73±10.47 | 0.11 |
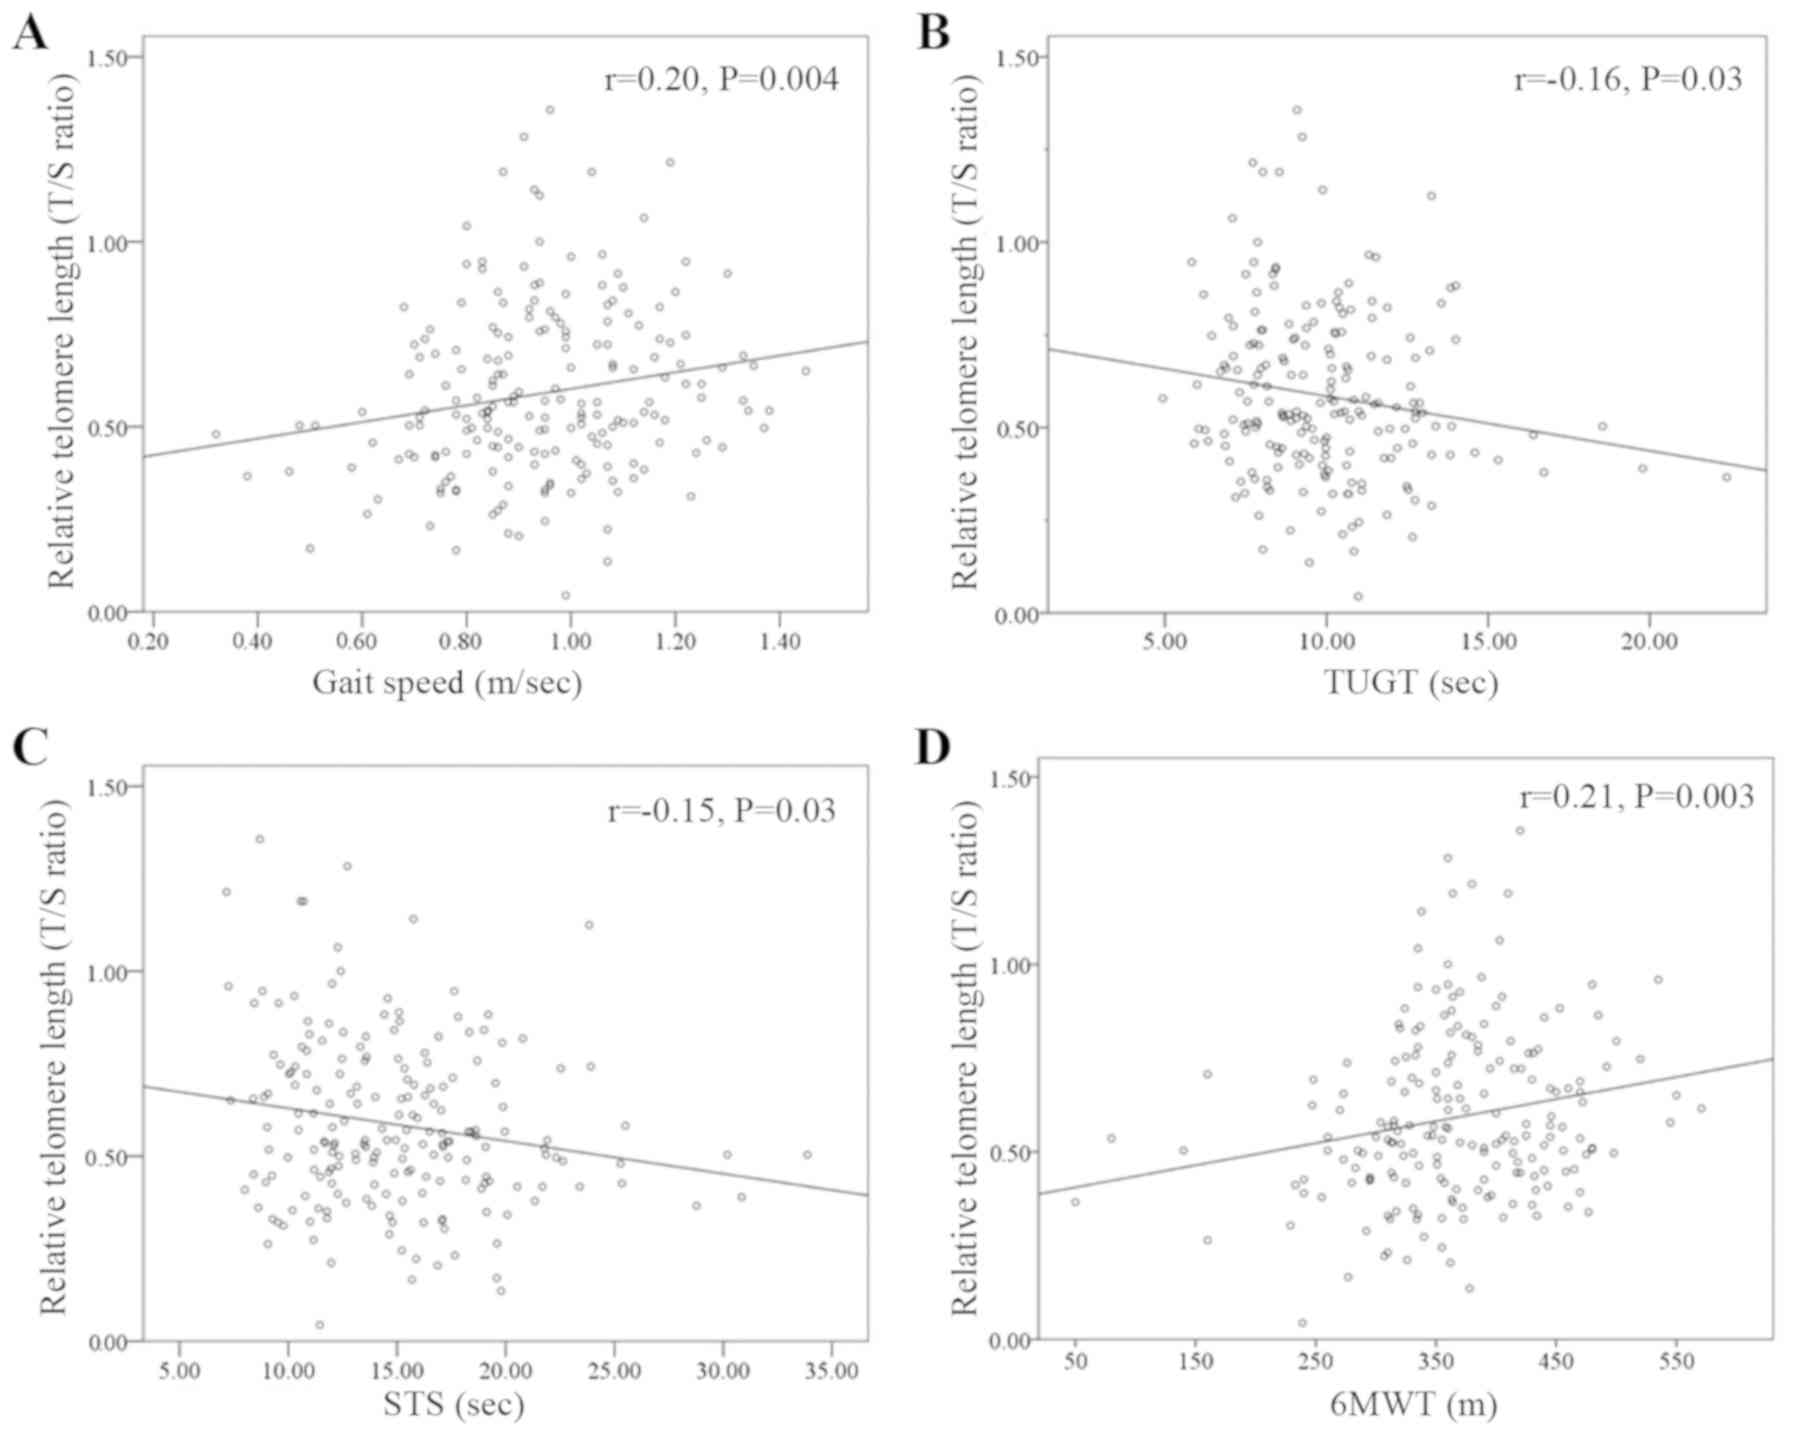
Relationship of RTL, muscle strength
and physical performance in patients with knee OA
There were no correlations between blood leukocyte
RTL with grip strength (rho=0.04, P=0.53) and knee extension force
(rho=0.02, P=0.77). However, there was a weak correlation between
blood leukocyte RTL and physical performance. Leukocyte RTL was
also demonstrated to be weakly positively correlated (21) with gait speed (rho=0.20; P=0.004) and
6MWT (rho=0.21; P=0.003). In addition, leukocyte RTL were
negatively weakly correlated with TUTG (rho=-0.16; P=0.03) and STS
(rho=-0.15; P=0.03) (Fig. 1).
Multiple linear regression models of
blood leukocyte RTL and physical performance
Subsequently, multivariate linear regression
analysis of leukocyte RTL was performed, after adjustment for age,
sex, WC, BMI, FM, skeletal muscle index and total of WOMAC, to
estimate the interaction between RTL and physical performance
(Table IV). Blood leukocyte RTL was
positively associated with gait speed (β coefficient=0.185;
P=0.023) and 6MWT (β coefficient=0.191; P=0.022). In contrast, RTL
was found to be negatively associated with TUGT (β
coefficient=-0.189; P=0.025) and STS (β coefficient=-0.231;
P=0.004).
| Table IVMultiple linear regression analysis
of RTL, muscle strength and physical performance. |
Table IV
Multiple linear regression analysis
of RTL, muscle strength and physical performance.
| Multivariate
adjusteda |
|---|
| Variables | β coefficients (95%
CI) | P-value |
|---|
| Muscle
strength |
|
Grip
strength, kg | 0.032
(-0.007-0.009) | 0.752 |
|
Knee
extension force, N | 0.004
(-0.008-0.008) | 0.948 |
| Physical
performance |
|
Gait speed,
m/sec | 0.185
(0.031-0.407) | 0.023 |
|
TUGT,
sec | -0.189
(-0.032-0.002) | 0.025 |
|
STS,
sec | -0.231
(-0.019-0.004) | 0.004 |
|
6MWT, m | 0.191
(0.000-0.001) | 0.022 |
Multiple logistic regression analysis
between RTL, muscle strength and physical performance
The multiple logistic regression models were used to
estimate the impact of muscle strength and physical performance on
RTL based on the potential influential covariates (Table V). After adjusting for age and sex, a
significant effect of physical performance on RTL was identified;
gait speed and 6MWT were significant predictors of RTL
(P-trend<0.05). Multivariate-adjusted models
controlled for age, sex, WC, BMI, FM, SMI and the total WOMAC
demonstrated that gait speed, TUGT and 6MWT were associated with
longer RTL (P-trend<0.05).
| Table VMultivariate logistic regression
examining the odds ratio of upper and lower quartile of RTL based
on the muscle strength and physical performancea. |
Table V
Multivariate logistic regression
examining the odds ratio of upper and lower quartile of RTL based
on the muscle strength and physical performancea.
| Age and sex
adjusted | Multivariate
adjustedb |
|---|
| Variables | OR (95% CI) | OR (95% CI) |
|---|
| Grip strength,
kg |
|
<18.60c | 1 | 1 |
|
18.60-21.55 | 1.74
(0.52-5.78) | 1.30
(0.36-4.60) |
|
21.56-24.55 | 0.90
(0.28-2.86) | 0.89
(0.26-3.04) |
|
>24.55 | 1.4
(0.37-5.26) | 1.13
(0.27-4.72) |
|
P-trend | 0.24 | 0.22 |
| Knee extension
force, N |
|
<344c | 1 | 1 |
|
344-421.25 | 1.07
(0.32-3.53) | 1.16
(0.33-4.01) |
|
421.26-485.5 | 1.52
(0.48-4.83) | 1.70
(0.48-6.06) |
|
>485.5 | 0.77
(0.24-2.51) | 0.95
(0.28-3.24) |
|
P-trend | 0.14 | 0.24 |
| Gait speed,
m/sec |
|
<0.83c | 1 | 1 |
|
0.83-0.94 | 5.31
(1.47-19.19) | 5.27
(1.33-20.82) |
|
0.95-1.07 | 4.79
(1.33-17.16) | 4.88
(1.29-18.38) |
|
>1.07 | 5.06
(1.35-0.18.87) | 5.36
(1.32-21.75) |
|
P-trend | 0.04 | <0.05 |
| Timed up and go
test, sec |
|
>10.63c | 1 | 1 |
|
9.72-10.62 | 2.33
(0.69-7.81) | 3.99
(1.01-15.73) |
|
8.04-9.71 | 1.57
(0.50-4.93) | 2.10
(0.59-7.43) |
|
<8.04 | 3.68
(1.18-11.49) | 6.07
(1.64-22.48) |
|
P-trend | 0.14 | 0.04 |
| Sit to Stand,
sec |
|
>17.35c | 1 | 1 |
|
14.62-17.35 | 1.02
(0.30-3.43) | 1.79
(0.44-7.23) |
|
11.59-14.61 | 2.96
(0.08-9.94) | 5.20
(1.25-21.65) |
|
<11.59 | 2.43
(0.78-7.59) | 4.07
(1.00-16.48) |
|
P-trend | 0.16 | 0.08 |
| 6-min walk test,
m |
|
<320c | 1 | 1 |
|
320-364 | 9.32
(2.22-39.09) | 12.05
(2.37-61.08) |
|
365-425 | 12.20
(2.30-45.14) | 17.85
(3.39-95.68) |
|
>425 | 7.47
(1.60-34.71) | 11.11
(2.01-61.31) |
|
P-trend | 0.01 | 0.007 |
Discussion
The current cross-sectional study investigated the
potential relationship between RTL, muscle strength and physical
performance in patients with knee OA to determine whether physical
disability may impact telomere length. It was found that patients
with OA in the 1st quartile of telomere length had lower MCS scores
for SF-12, slower gait speed and a longer time in the TUGT.
Furthermore, from the multivariate linear regression model, gait
speed, TUGT and 6MWT were associated with longer RTL. Therefore,
the present results support the hypothesis that shorter RTL was
associated with physical performance. However, the current data do
not support the hypothesis that telomere length was associated with
muscle strength. To the best of our knowledge, this study was the
first to demonstrate the relationship between telomere length and
physical performance in patients with knee OA.
Telomere shortening is a natural process of the
somatic cells (22). Aging has been
shown to accelerate the shortening of the telomeres, which can be
observed in several age-related diseases, such as diabetes, cancer
and diseases of the immune system (6). In addition, multiple factors such as
age, obesity, genetic and environmental factors can cause OA
(23). Previous studies have
reported that OA is closely related to shorter telomere length
(24). For instance, McAlindon et
al (12) measured the leucocyte
telomere length in patients with symptomatic hand OA, and revealed
that there were strong associations in the telomere length of
leukocytes with the incident of radiographic OA in the
interphalangeal joints of the hands. Moreover, Tamayo et al
(11) analyzed the telomere length
of human chondrocytes and peripheral blood leukocytes. In patients
with OA, the telomere length in chondrocytes was 1.6 times longer
compared with that in leukocytes, whereas telomere length in
chondrocytes was shorter compared with healthy volunteers (11). It was also shown that the frequency
of numerical chromosomal abnormalities from leukocytes in patients
with OA was higher compared with the healthy volunteers. Previous
studies have revealed that there are no differences in the telomere
length in peripheral blood leukocytes between patients with OA and
healthy volunteers (11,25). However, in the current study, blood
leukocyte RTL in knee OA participants was significantly lower than
that in the healthy controls. These findings support the hypothesis
that patients with OA had shorter RTL compared with controls, and
were in line with previous reports that the shortening of telomere
length could be associated with age-related diseases (5,6).
The current study identified a relationship between
telomere length and physical performance in patients with knee OA,
which was in line with the results reported by Soares-Miranda et
al (9) who investigated the
association between physical activity, physical performance and
telomere length in older adults; a decline in the walking distance
and a long time chair test were found to be associated with shorter
telomeres. Furthermore, Lee et al (26) identified that elderly women with
declining gait speed had shorter telomeres in their leukocytes. It
has also been shown that slow gait speed, physical inactivity or a
sedentary lifestyle can affect the length of the telomere, and its
shortening is accelerated via the aging process that promotes
cellular senescence (27,28).
The present results indicated that the telomere
length was not associated with muscle mass and muscle strength,
such as grip strength and knee extension force. These findings
support results from previous studies, which revealed that telomere
length was not associated with handgrip strength and physical
health (29-31).
However, Woo et al (32)
reported that longer telomere length was associated with slower
decline in grip strength in community-dwelling older individuals.
It has also been shown that there are no correlations between
telomere length, sarcopenia, muscle mass, walking speed and chair
stand test (32). In contrast,
Marzetti et al (33) reported
that telomere length was only related to muscle mass; short
telomeres were observed in outpatients with sarcopenic geriatric.
These conflicting findings indicate that additional studies are
warranted to clarify the relationship between the telomere length,
muscle mass, muscle strength, handgrip strength, sarcopenia,
walking speed and chair stand test.
The precise mechanism of short telomeres in OA
remains unknown. However, it has been suggested that the
progressive degeneration of OA may be closely associated with
oxidative stress and chronic inflammation (24). Reactive oxygen species (ROS) causes
DNA damage when there are high levels of ROS, which occurs when
there are single strand breaks (24), and accumulated levels of ROS may
accelerate telomere shortening. Telomeric DNA sequences, TTAGGG
repeats, are particularly sensitive to base oxidation due to the
large number of guanine nucleotides that are readily oxidatively
modified to 8-oxyguanosine (34,35). In
human chondrocytes, ROS have been shown to induce telomere
instability and result in replicative senescence and dysfunction
(36,37). Obesity and excessive mechanical
loading on joints or malalignment can increase the production of
oxidative stress, which can decrease the function of chondrocytes
and induce chondrocyte senescence (38,39). In
addition, environmental and lifestyle factors may accelerate
telomere shortening. For example, low levels of physical activity
are associated with shorter telomere length (9), and the benefits of regular physical
activity can upregulate antioxidant systems and reduce chronic
systemic inflammation (9).
Accordingly, the balance between factors that promote oxidative
stress and antioxidative defense may potentially influence the
length of the telomeres. Moreover, the current results support the
hypothesis that physical performance is significantly associated
with blood leukocyte telomere length.
The present study has some limitations. First, this
was a cross-sectional study, and the determination of direct cause
and effect relationships could not be established. In addition, the
timing of blood collection varied with respect to time since
diagnosis and treatment, which introduces uncertainty regarding
associations between telomere length and physical performance.
Therefore, the associations identified in blood leukocyte DNA may
indicate either casual, consequential or coincidental
relationships. Thus, further cohort investigations are required to
validate the cause-effect of telomere length on the changes in
physical performance parameters. Second, the sample size was
relatively small; this limits the statistical power of the current
findings. Moreover, it was not possible to collect physical
performance data in the controls. The subjects who participated in
this study were specific to patients with OA, in which elderly
women have a high prevalence of knee OA (3), and thus it is challenging to compare
results across studies, especially in male OA participants or in
non-OA individuals. Third, several variables including age,
genetic, physical exercise and/or lifestyle behaviors can influence
the findings of the study. Due to the attempt to match the age
between OA participants and the controls, the age range of the
individuals enrolled into this study was narrow. As a result of
this, the association between age and blood leukocyte RTL cannot be
determined. Therefore, additional prospective longitudinal studies
with a larger sample size are necessary to investigate the
association between telomere shortening and the physical
performance of participants with knee OA.
In conclusion, blood leukocyte RTL in patients with
knee OA was significantly lower than that in the healthy controls.
Moreover, shorter leukocyte RTL was associated with slow gait
speed, a long time TUGT and 6MWT in these patients. The current
results suggested that telomere shortening could be related to
physical disability in participants with knee OA. These findings
also supported the hypothesis that blood leukocyte telomere length
may be a non-invasive biomarker that could provide information
relating to the physical performance of the patient, and could
predict physical activity in patients with knee OA.
Acknowledgements
The authors are grateful to Ms. Borwarnluck
Thongtha, Mr. Surasit Suwannasin and Ms. Nungruthai Nilsri (Faculty
of Medicine, Chulalongkorn University) for their technical
assistance. The authors would also like to thank Ms. June Ohata and
Dr Thananya Thongtan (Faculty of Medicine, Chulalongkorn
University) for reviewing and proof-reading the manuscript.
Funding
The present was supported by the Osteoarthritis and
Musculo skeleton Research Unit, 90th Anniversary Chulalongkorn
University Fund and the Ratchadapiseksompotch Fund, Chulalongkorn
University: CU_GR_63_95_30_02.
Availability of data and materials
The datasets used and/or analyzed during the current
study are available from the corresponding author on reasonable
request.
Authors' contributions
PM, PY, AT, TT, TI and SH conceived and designed the
experiments as well as performed the experiments and analyzed the
data. PM and SH provided the reagents, materials and tools for
analysis. PY, AT, TT, TI and SH enrolled the participants, obtained
the written informed consents and collected the clinical data. PM
and SH wrote and revised the manuscript. All authors have reviewed
and approved the final version of this manuscript.
Ethics approval and consent to
participate
The study protocol was approved by the Institutional
Review Board on Human Research of the Faculty of Medicine,
Chulalongkorn University. Information regarding the study was
provided to the patients who were eligible to participate in the
study. Written informed consent was obtained from the
participants.
Patient consent for publication
Not applicable.
Competing interests
The authors declare that they have no competing
interests.
References
|
1
|
Manoy P, Anomasiri W, Yuktanandana P,
Tanavalee A, Mabey T and Honsawek S: Relationship of serum leptin
and 25-hydroxyvitamin D in knee osteoarthritis patients. Chula Med
J. 62:1037–1047. 2018.
|
|
2
|
Zhan D and Honsawek S: Reduction of
leukocyte mitochondrial DNA copy number in knee osteoarthritis.
Chula Med J. 63:207–209. 2019.PubMed/NCBI View Article : Google Scholar
|
|
3
|
Litwic A, Edwards MH, Dennison EM and
Cooper C: Epidemiology and burden of osteoarthritis. Br Med Bull.
105:185–199. 2013.PubMed/NCBI View Article : Google Scholar
|
|
4
|
Kuszel L, Trzeciak T, Richter M and
Czarny-Ratajczak M: Osteoarthritis and telomere shortening. J Appl
Genet. 56:169–176. 2015.PubMed/NCBI View Article : Google Scholar
|
|
5
|
Mather KA, Jorm AF, Parslow RA and
Christensen H: Is telomere length a biomarker of aging? A review. J
Gerontol A Biol Sci Med Sci. 66:202–213. 2011.PubMed/NCBI View Article : Google Scholar
|
|
6
|
Xi H, Li C, Ren F, Zhang H and Zhang L:
Telomere, aging and age-related diseases. Aging Clin Exp Res.
25:139–146. 2013.PubMed/NCBI View Article : Google Scholar
|
|
7
|
Li D, Yuan Q and Wang W: The role of
telomeres in musculoskeletal diseases. J Int Med Res. 40:1242–1250.
2012.PubMed/NCBI View Article : Google Scholar
|
|
8
|
Fossel M: Use of telomere length as a
biomarker for aging and age-related disease. Curr Transl Geriatrics
Exp Gerontology Rep. 1:121–127. 2012. View Article : Google Scholar
|
|
9
|
Soares-Miranda L, Imamura F, Siscovick D,
Jenny NS, Fitzpatrick AL and Mozaffarian D: Physical activity,
physical fitness, and leukocyte telomere length: The cardiovascular
health study. Med Sci Sports Exerc. 47:2525–2534. 2015.PubMed/NCBI View Article : Google Scholar
|
|
10
|
Loprinzi PD: Cardiorespiratory capacity
and leukocyte telomere length among adults in the United States. Am
J Epidemiol. 182:198–201. 2015.PubMed/NCBI View Article : Google Scholar
|
|
11
|
Tamayo M, Mosquera A, Rego I, Blanco FJ,
Gosálvez J and Fernández JL: Decreased length of telomeric DNA
sequences and increased numerical chromosome aberrations in human
osteoarthritic chondrocytes. Mutat Res. 708:50–58. 2011.PubMed/NCBI View Article : Google Scholar
|
|
12
|
McAlindon T, Roberts M, Driban J, Schaefer
L, Haugen IK, Smith SE, Duryea J, Cunha D, Blanco F,
Fernández-Garcia JL and Eaton C: Incident hand OA is strongly
associated with reduced peripheral blood leukocyte telomere length.
Osteoarthritis Cartilage. 26:1651–1657. 2018. View Article : Google Scholar
|
|
13
|
Altman R, Asch E, Bloch D, Bole G,
Borenstein D, Brandt K, Christy W, Cooke TD, Greenwald R and
Hochberg M: Development of criteria for the classification and
reporting of osteoarthritis. Classification of osteoarthritis of
the knee. Diagnostic and therapeutic criteria committee of the
American rheumatism association. Arthritis Rheum. 29:1039–1049.
1986.PubMed/NCBI View Article : Google Scholar
|
|
14
|
Spector TD and Cooper C: Radiographic
assessment of osteoarthritis in population studies: Whither
kellgren and lawrence? Osteoarthritis Cartilage. 1:203–206.
1993.PubMed/NCBI View Article : Google Scholar
|
|
15
|
Teerawattanapong N, Udomsinprasert W,
Ngarmukos S, Tanavalee A and Honsawek S: Blood leukocyte LINE-1
hypomethylation and oxidative stress in knee osteoarthritis.
Heliyon. 5(e01774)2019. View Article : Google Scholar
|
|
16
|
Sakthong P, Kasemsup V and Winit-Watjana
W: Assessment of health-related quality of life in thai patients
after heart surgery. Asian Biomed. 9:203–210. 2015. View Article : Google Scholar
|
|
17
|
Udomsinprasert W, Poovorawan Y,
Chongsrisawat V, Vejchapipat P, Zhan D and Honsawek S: Telomere
length in peripheral blood leukocytes is associated with severity
of biliary atresia. PLoS One. 10(e0134689)2015. View Article : Google Scholar
|
|
18
|
Livak KJ and Schmittgen TD: Analysis of
relative gene expression data using real-time quantitative PCR and
the 2(-Delta Delta C(T)) method. Methods. 25:402–408.
2001.PubMed/NCBI View Article : Google Scholar
|
|
19
|
Poonpet T, Saetan N, Tanavalee A,
Wilairatana V, Yuktanandana P and Honsawek S: Association between
leukocyte telomere length and angiogenic cytokines in knee
osteoarthritis. Int J Rheum Dis. 21:118–125. 2018.PubMed/NCBI View Article : Google Scholar
|
|
20
|
Colbert CJ, Song J, Dunlop D, Chmiel JS,
Hayes KW, Cahue S, Moisio KC, Chang AH and Sharma L: Knee
confidence as it relates to physical function outcome in persons
with or at high risk of knee osteoarthritis in the osteoarthritis
initiative. Arthritis Rheum. 64:1437–1446. 2012.PubMed/NCBI View Article : Google Scholar
|
|
21
|
Schober P, Boer C and Schwarte LA:
Correlation coefficients: Appropriate use and interpretation.
Anesth Analg. 126:1763–1768. 2018.PubMed/NCBI View Article : Google Scholar
|
|
22
|
Shammas MA: Telomeres, lifestyle, cancer,
and aging. Curr Opin Clin Nutr Metab Care. 14:28–34.
2011.PubMed/NCBI View Article : Google Scholar
|
|
23
|
Ding C, Jones G, Wluka AE and Cicuttini F:
What can we learn about osteoarthritis by studying a healthy person
against a person with early onset of disease? Curr Opin Rheumatol.
22:520–527. 2010.PubMed/NCBI View Article : Google Scholar
|
|
24
|
Fragkiadaki P, Nikitovic D, Kalliantasi K,
Sarandi E, Thanasoula M, Stivaktakis PD, Nepka C, Spandidos DA,
Tosounidis T and Tsatsakis A: Telomere length and telomerase
activity in osteoporosis and osteoarthritis. Exp Ther Med.
19:1626–1632. 2020.PubMed/NCBI View Article : Google Scholar
|
|
25
|
Tamayo M, Mosquera A, Rego JI,
Fernández-Sueiro JL, Blanco FJ and Fernandez JL: Differing patterns
of peripheral blood leukocyte telomere length in rheumatologic
diseases. Mutat Res. 683:68–73. 2010.PubMed/NCBI View Article : Google Scholar
|
|
26
|
Lee JY, Bang HW, Ko JH, Kim JH and Lee DC:
Leukocyte telomere length is independently associated with gait
speed in elderly women. Maturitas. 75:165–169. 2013.PubMed/NCBI View Article : Google Scholar
|
|
27
|
Sassenroth D, Meyer A, Salewsky B, Kroh M,
Norman K, Steinhagen-Thiessen E and Demuth I: Sports and exercise
at different ages and leukocyte telomere length in later life-data
from the Berlin aging study II (BASE-II). PLoS One.
10(e0142131)2015.PubMed/NCBI View Article : Google Scholar
|
|
28
|
Cherkas LF, Hunkin JL, Kato BS, Richards
JB, Gardner JP, Surdulescu GL, Kimura M, Lu X, Spector TD and Aviv
A: The association between physical activity in leisure time and
leukocyte telomere length. Arch Intern Med. 168:154–158.
2008.PubMed/NCBI View Article : Google Scholar
|
|
29
|
Bekaert S, Van Pottelbergh I, De Meyer T,
Zmierczak H, Kaufman JM, Van Oostveldt P and Goemaere S: Telomere
length versus hormonal and bone mineral status in healthy elderly
men. Mech Ageing Dev. 126:1115–1122. 2005. View Article : Google Scholar
|
|
30
|
Harris SE, Deary IJ, MacIntyre A, Lamb KJ,
Radhakrishnan K, Starr JM, Whalley LJ and Shiels PG: The
association between telomere length, physical health, cognitive
ageing, and mortality in non-demented older people. Neurosci Lett.
406:260–264. 2006. View Article : Google Scholar
|
|
31
|
Mather KA, Jorm AF, Milburn PJ, Tan X,
Easteal S and Christensen H: No associations between telomere
length and age-sensitive indicators of physical function in mid and
later life. J Gerontol A Biol Sci Med Sci. 65:792–799.
2010.PubMed/NCBI View Article : Google Scholar
|
|
32
|
Woo J, Yu R, Tang N and Leung J: Telomere
length is associated with decline in grip strength in older persons
aged 65 years and over. Age (Dordr). 36(9711)2014.PubMed/NCBI View Article : Google Scholar
|
|
33
|
Marzetti E, Lorenzi M, Antocicco M,
Bonassi S, Celi M, Mastropaolo S, Settanni S, Valdiglesias V, Landi
F, Bernabei R and Onder G: Shorter telomeres in peripheral blood
mononuclear cells from older persons with sarcopenia: Results from
an exploratory study. Front Aging Neurosci. 6(233)2014.PubMed/NCBI View Article : Google Scholar
|
|
34
|
Singh A, Kukreti R, Saso L and Kukreti S:
Oxidative stress: Role and response of short guanine tracts at
genomic locations. Int J Mol Sci. 20(4258)2019. View Article : Google Scholar
|
|
35
|
Fouquerel E, Lormand J, Bose A, Lee HT,
Kim GS, Li J, Sobol R, Freudenthal BD, Myong S and Opresko PL:
Oxidative guanine base damage regulates human telomerase activity.
Nat Struct Mol Biol. 23:1092–1100. 2016.PubMed/NCBI View Article : Google Scholar
|
|
36
|
Brandl A, Hartmann A, Bechmann V, Graf B,
Nerlich M and Angele P: Oxidative stress induces senescence in
chondrocytes. J Orthop Res. 29:1114–1120. 2011.PubMed/NCBI View Article : Google Scholar
|
|
37
|
Yudoh K, van Nguyen T, Nakamura H,
Hongo-Masuko K, Kato T and Nishioka K: Potential involvement of
oxidative stress in cartilage senescence and development of
osteoarthritis: Oxidative stress induces chondrocyte telomere
instability and downregulation of chondrocyte function. Arthritis
Res Ther. 7(R380-R391)2005.PubMed/NCBI View
Article : Google Scholar
|
|
38
|
Martin JA, Brown TD, Heiner AD and
Buckwalter JA: Chondrocyte senescence, joint loading and
osteoarthritis. Clin Orthop Relat Res. (427
Suppl)(S96-S103)2004.PubMed/NCBI View Article : Google Scholar
|
|
39
|
Martin JA, Brown T, Heiner A and
Buckwalter JA: Post-traumatic osteoarthritis: The role of
accelerated chondrocyte senescence. Biorheology. 41:479–491.
2004.PubMed/NCBI
|