Introduction
Pre-diabetes represents a condition of intermediate
hyperglycaemia in which blood glucose levels are higher than
normal, but below the diagnostic levels of type 2 diabetes mellitus
(T2D). It can be diagnosed using an impaired fasting glucose (IFG)
test, impaired glucose tolerance (IGT) test and elevated glycated
haemoglobin (HbA1c) levels (1).
These glucometabolic abnormalities often precede T2D (2,3), and
most individuals with pre-diabetes eventually develop T2D (2,3). In
addition to the risk of progression to T2D, pre-diabetes is
associated with cardiovascular disease (CVD) (4,5) and
other vascular complications (6).
The pathophysiology of pre-diabetes is similar to T2D in that the
pathological basis is insulin resistance and impaired β-cell
function (7). Insulin resistance
occurs several years prior to the development of T2D, and is
evident in individuals with both IFG and IGT results (7,8). This is
followed by a compensatory increased rate of insulin secretion by
the β-cells as an adaptive response. Over time, the β-cells fail to
fully compensate for insulin resistance, leading to changes in
their function accompanied by a reduction in insulin secretion,
thus fasting and post-load glucose levels are not adequately
maintained (7,8). When the function β-cells deteriorates,
hyperglycaemia occurs, and pre-diabetes progresses to overt T2D
(9). Lifestyle modifications and
therapeutic interventions may reverse pre-diabetes and prevent it
from proceeding to T2D, and other related devastating complications
(10,11). Early and accurate identification of
the pre-diabetic stage is the gold standard for preventing T2D and
its consequences.
MicroRNAs (miRNAs/miRs) are an abundant class of
small non-coding RNAs that act as post-transcriptional regulators
of gene expression (12). They serve
important roles in a wide range of cellular functions, such as
proliferation, differentiation and other metabolic processes
(13). A single miRNA can target
multiple genes, and hence a large number of human genes are
predicted to be regulated by miRNAs (14). miRNAs are increasingly being
recognized as fine-tuning regulators of glucose metabolism, β-cell
function and insulin signalling, and their dysfunction has been
implicated in the development of T2D (15,16).
miRNAs are also present in human bio-fluids, including in the blood
in a highly stable form that is protected from endogenous RNase
activity (17). These circulating
miRNAs act as intercellular mediators, and can be used to identify
the states of several cellular pathophysiological processes, and
thus represent a further novel subclass of biomarkers (17,18). An
altered circulating miRNA profile that reflects changes in
diabetes-related tissues, such as the pancreas, liver, skeletal and
heart muscle, and adipose tissue, has shown promise as biomarkers
for diagnosis of T2D (19).
Additionally, the alterations in circulating miRNAs may appear at
early stages of diabetes progression, supporting their use as early
candidate biomarkers for detection of a pre-diabetic state. For
example, miR-15a and miR-375, which are associated with β-cell
injury, have been suggested as potential biomarkers for diagnosis
of pre-diabetes, as well as for evaluating the risk of developing
T2D (20-22).
In addition, the endothelial-specific miR-126, which is implicated
in CVD, has been reported as a biomarker for screening for
pre-diabetes and newly diagnosed T2D (23).
In our previous study, it was shown that miR-1 and
miR-133 were upregulated in the peripheral blood of patients with
T2D, and this upregulation was associated with the risk of coronary
artery disease (24). These two
miRNAs belong to the myomiR family, and are specifically expressed
in skeletal muscle and cardiomyocytes, and are highly enriched in
the latter (25). Notably, skeletal
muscle is the major site of postprandial insulin-mediated glucose
uptake, and insulin resistance in this tissue is considered as the
primary defect prior to the development of T2D (26). Therefore, dysregulation in the
expression of skeletal muscle-related mRNAs is central to the
pathogenies of diabetes and other metabolic disorders (27). Studies in human and animal models
have shown that changes in the circulating levels of miR-1 and
miR-133 are associated with insulin resistance or T2D progression.
Higher levels of miR-1 and miR-133 have been described in patients
with T2D and in a murine model of insulin resistance (28). Progressive increases in the plasma
levels of miR-133 have been reported in Zucker diabetic rats during
the natural progression of T2D from pre-diabetes and initial
hyperinsulinemia to β-cell failure and late-stage diabetes
(29).
There is an urgent need for new options to treat T2D
during the early stages due to the ineffective control of its
development in patients. Given the role of circulating miRNAs as
promising biomarkers, it was hypothesized that the increased
expression of peripheral blood miR-1 and miR-133 may appear prior
to the occurrence of T2D, and thus, they may serve as biomarkers
for pre-diabetes. Therefore, the expression levels of miR-1 and
miR-133 in whole blood from pre-diabetes individuals with IFG and
IGT, as well as in healthy controls was quantified. Additionally,
the relationship between these two miRNAs and clinical
characteristics as well as their diagnostic values were
evaluated.
Materials and methods
Study subjects
The present study included 55 subjects, 28
individuals with pre-diabetes with IFG and IGT (18 males and 11
females; mean age 50±5.6 years; age range 43-59 years; median age
49.5) and 27 healthy controls (13 males and 14 females; mean age
54±4.4 years; age range; 47-61 years, median age 50). The sample
size was calculated as the minimum number of subjects in each group
with sufficient statistical power (two-sided significance at 0.05
with a power of 80%) to detect a 20% difference between the mean
miR-1 and miR-133 expression levels of the groups. Subjects were
recruited from King Abdullah University Medical City in the Kingdom
of Bahrain. They were randomly selected irrespective of age and
sex. All diagnoses were confirmed by the FG test after 12 h of
fasting, 2-h oral glucose tolerance test (OGTT) and glycated
haemoglobin A1c (HbA1c) levels, according to the World Health
Organization (30) and American
Diabetes Association (31) criteria.
Therefore, pre-diabetes was defined as IFG with FG levels between
5.6-6.9 mmol/l, IGT with 2-h OGTT glucose levels between 7.8-11.0
mmol/l and HbA1c between 5.7-6.4%. Healthy control subjects had FG
levels between 4.8-5.2 mmol/l, 2-h OGTT glucose levels between
7.8-11.0 mmol/l and HbA1c <5.7%. The healthy controls were
randomly selected during their routine check-up visits to the
medical centre. Insulin resistance in the Homeostasis Model
Assessment-Insulin Resistance (HOMA-IR) index was calculated using
the following formula: [Fasting plasma glucose (mmol/l) x fasting
serum insulin (mU/l)]/22.5, as described by Matthews et al
(32). Accordingly, a low HOMA-IR
was indicative of high insulin sensitivity, whereas a high HOMA-IR
was indicative of low insulin sensitivity (insulin resistance).
Other clinical parameters including age, sex, body mass index
(BMI), mean blood pressure, low-density lipoprotein-cholesterol
(LDL-C), high-density lipoprotein-cholesterol (HDL-C), triglyceride
and total cholesterol levels were collected from the medical
records of participants. As the focus of the present study was the
expression of circulating miR-1 and miR-133 in pre-diabetes, and as
our previous study showed changes in the circulating levels of
these two miRNAs in T2D patients with and without CVD (24), patients diagnosed with T2D and those
with diabetes complications including CVD (evident by
electrocardiogram, echocardiogram and other tests) were excluded
from the present study.
Ethics statement
The present study was performed in accordance with
the relevant ethical guidelines and regulations of clinical
research of Arabian Gulf University (agu.edu.bh/en/Research/Colleges/CMMS/Pages/Research-&-Ethics.aspx),
and approved by the Medical Research and Ethics Committee at the
College of Medicine and Medical Sciences, Arabian Gulf University,
Kingdom of Bahrain. All participants were informed regarding the
study procedures and provided written consent.
Blood collection and miRNA
isolation
Whole blood samples from participants were collected
in EDTA tubes (BD Biosciences). For pre-diabetes individuals, blood
samples were collected at the time of diagnosis, prior to
initiation of the treatment. To ensure RNA stabilization, RNA later
(1.3 ml; Thermo Fisher Scientific, Inc.) was added to aliquots of
0.5 ml EDTA-blood, and blood samples were stored at -80˚C until
required for analysis. miRNAs were extracted from 200 µl whole
blood and eluted in 30 µl RNase-free water using the miRNeasy Mini
kit (Qiagen, Inc.) according to manufacturer's protocol and as
previously described (21,22,24). The
concentration and purity of RNA samples were assessed using a
NanoDrop ND-1000 spectrophotometer (Thermo Fisher Scientific,
Inc.).
cDNA synthesis and miRNA
quantification
The miRNAs isolated from whole blood were reverse
transcribed to cDNAs using an Applied Biosystems TaqMan MicroRNA RT
kit (Applied Biosystems; Thermo Fisher Scientific, Inc.). The
reaction mix contained 20 ng RNA (5 µl), specific stem-loop RT
primers (3 µl), 100 mM dNTPs (0.15 µl), 10X RT buffer (1.5 µl), 20
U/µl RNase inhibitor (0.19 µl), 50 U/ml MultiScribe™ Reverse
Transcriptase (1 µl) and nuclease-free water (4.16 µl) to a final
volume of 15 µl. The reaction mix was incubated in a
GeneAmp® PCR system 9700 thermal cycler (Applied
Biosystems; Thermo Fisher Scientific, Inc.) at 16˚C for 30 min,
42˚C for 30 min, 85˚C for 5 min and 4˚C. All cDNA samples were
stored at -20˚C until required. For miRNA quantification, reverse
transcription-quantitative (RT-q)PCR was performed in duplicate
using TaqMan microRNAs assays, with miR-1 and miR-133 as the
targets and RNU6B as the reference (Applied Biosystems; Thermo
Fisher Scientific, Inc.). The reaction mix consisted of 1.33 µl
cDNA, 10 µl TaqMan 2X Universal PCR MasterMix II, 1 µl
gene-specific primers and 7.67 µl nuclease-free water to a final
volume of 20 µl. PCR amplification was carried out in an ABI 7900HT
Fast thermocycler (Applied Biosystems; Thermo Fisher Scientific,
Inc.). The thermocycling conditions were: 95˚C for 10 min; followed
by 35 cycles of 95˚C for 15 sec and 60˚C for 60 sec. The sequences
of the primers for miR-1, miR-133 and RNU6B are shown in Table I (24). The data were analysed using the
Sequence Detection relative quantification software version 1.4,
(Applied Biosystems; Thermo Fisher Scientific, Inc.). The fold
change of relative expression was calculated as 2-∆∆Cq
(21,22,24).
 | Table ISequences of primers used for PCR
amplification. |
Table I
Sequences of primers used for PCR
amplification.
| Target | Sequence,
5'-3' |
|---|
| miR-1 | |
|
Forward |
CTCGACAAACGTCTAAATGCT |
|
Reverse |
TCAACTGGTGTCGTGGAGTC |
| miR-133 | |
|
Forward |
CAGGTTTGGTCCCCTTCAA |
|
Reverse |
TCAACTGGTGTCGTGGAGTC |
| RNU6B | |
|
Forward |
GCTTCGGCAGCACATATACTAAAAT |
|
Reverse |
CGCTTCACGAATTTGCGTGTCAT |
miRNA target prediction
The miRDB online database for miRNA target
prediction (mirdb.org/index.html) was used to search for target
genes for human miR-1 (hsa-miR-1) and human miR-133 (hsa-miR-133).
The miRNA sequences and nomenclatures were downloaded from miRBase
for target prediction (33), and
mRNA sequences and annotation files were downloaded from NCBI. All
transcript 3'UTR sequences and their isoforms from five species
(human, mouse, rat, dog and chicken) were analysed from the GenBank
files using BioPerl (bioperl.org).
Statistical analysis
All data were analysed using the SPSS version 27
(IBM Corp.). Differences in the expression of miRNAs and other
clinical parameters between the prediabetes individuals and healthy
controls were evaluated using an independent samples t-test for
continuous variables and χ2 test for categorical
variables. Pearson's correlation coefficient analysis was used to
assess the relationship between miRNAs and clinical variables.
Multivariate logistic regression analysis was performed to estimate
odds ratios (ORs) and 95% confidence intervals (CIs) for the
association of miR-1 and miR-133 with the presence of prediabetes.
This analysis was performed before and after adjustment for
possible confounders. Linear regression analysis with defined
clinical variables was performed to identify the predictors of
miRNAs. Receiver operating characteristic (ROC) analysis was
performed to evaluate the diagnostic performances of miRNAs and the
areas under the curve (AUCs) were calculated. The sensitivity and
specificity for each miRNA were obtained from the optimal cut-off
values of the ROC curves. The data are presented as the mean ±
standard deviation. P<0.05 was considered to indicate a
statistically significant difference.
Results
Clinical characteristics of the study
subjects
Table II illustrates
the clinicopathological characteristics of the study subjects which
included 28 pre-diabetes individuals and 27 healthy controls. A
significant difference was observed in the mean age between the
pre-diabetes and the control subjects (P=0.017), but not in the sex
distribution (P>0.05). There was no significant difference in
BMI between the pre-diabetes and the control subjects (P>0.05).
However, the prediabetes individuals were slightly overweight (BMI,
25.4±4.5 kg/m2) compared with the healthy controls (BMI,
24.1 ± 4.4 kg/m2). Also, no significant difference was
observed between the mean blood pressure in the study subjects
(P>0.05). Blood glucose parameters including FG, 2-h OGTT and
HbA1c differed significantly between the study subjects, and were
significantly higher in the pre-diabetes individuals than in the
controls (all P<0.001). In addition, insulin sensitivity based
on the HOMO-IR index were significantly higher in the pre-diabetes
individuals compared with the healthy controls (P<0.001). For
the lipid profile analysis, no significant differences were found
in triglyceride, total cholesterol, LDL-C and HDL-C levels between
the pre-diabetes and control subjects (P>0.05).
| Table IIClinicopathological characteristics
of the study subjects. |
Table II
Clinicopathological characteristics
of the study subjects.
|
Characteristics | Healthy
groupc | Pre-diabetes
groupc | P-value |
|---|
| Number of
subjects | 27 | 28 | |
| Age, years | 54±4.4 | 50±5.6 |
0.017a |
| Sex | | | 0.333 |
|
Male | 13 | 18 | |
|
Female | 14 | 11 | |
| BMI,
kg/m2 | 24.1±4.4 | 25.4±4.5 | 0.209 |
| Mean blood
pressure, mmHg | 87±4.2 | 88±5.4 | 0.19 |
| FG, mmol/l | 4.3±4.8 | 6.4±5.8 |
<0.001b |
| 2-h OGTT,
mmol/l | 6.2±1.04 | 8.9±2.0 |
<0.001b |
| HbA1c, % | 5.1±1.0 | 6.7±0.5 |
<0.001b |
| Insulin, mU/l | 6.5±0.9 | 9.5±1.3 |
<0.001b |
| HOMO-IR | 1.25±0.2 | 2.7±0.4 |
<0.001b |
| LDL-C, mmol/l | 2.2±0.8 | 2.1±0.4 | 0.434 |
| HDL-C, mmol/l | 1.3±0.3 | 1.3±0.4 | 0.813 |
| Triglyceride,
mmol/l | 1.5±0.6 | 1.5±0.6 | 0.654 |
| Total cholesterol,
mmol/l | 4.3±0.6 | 4.1±1.3 | 0.402 |
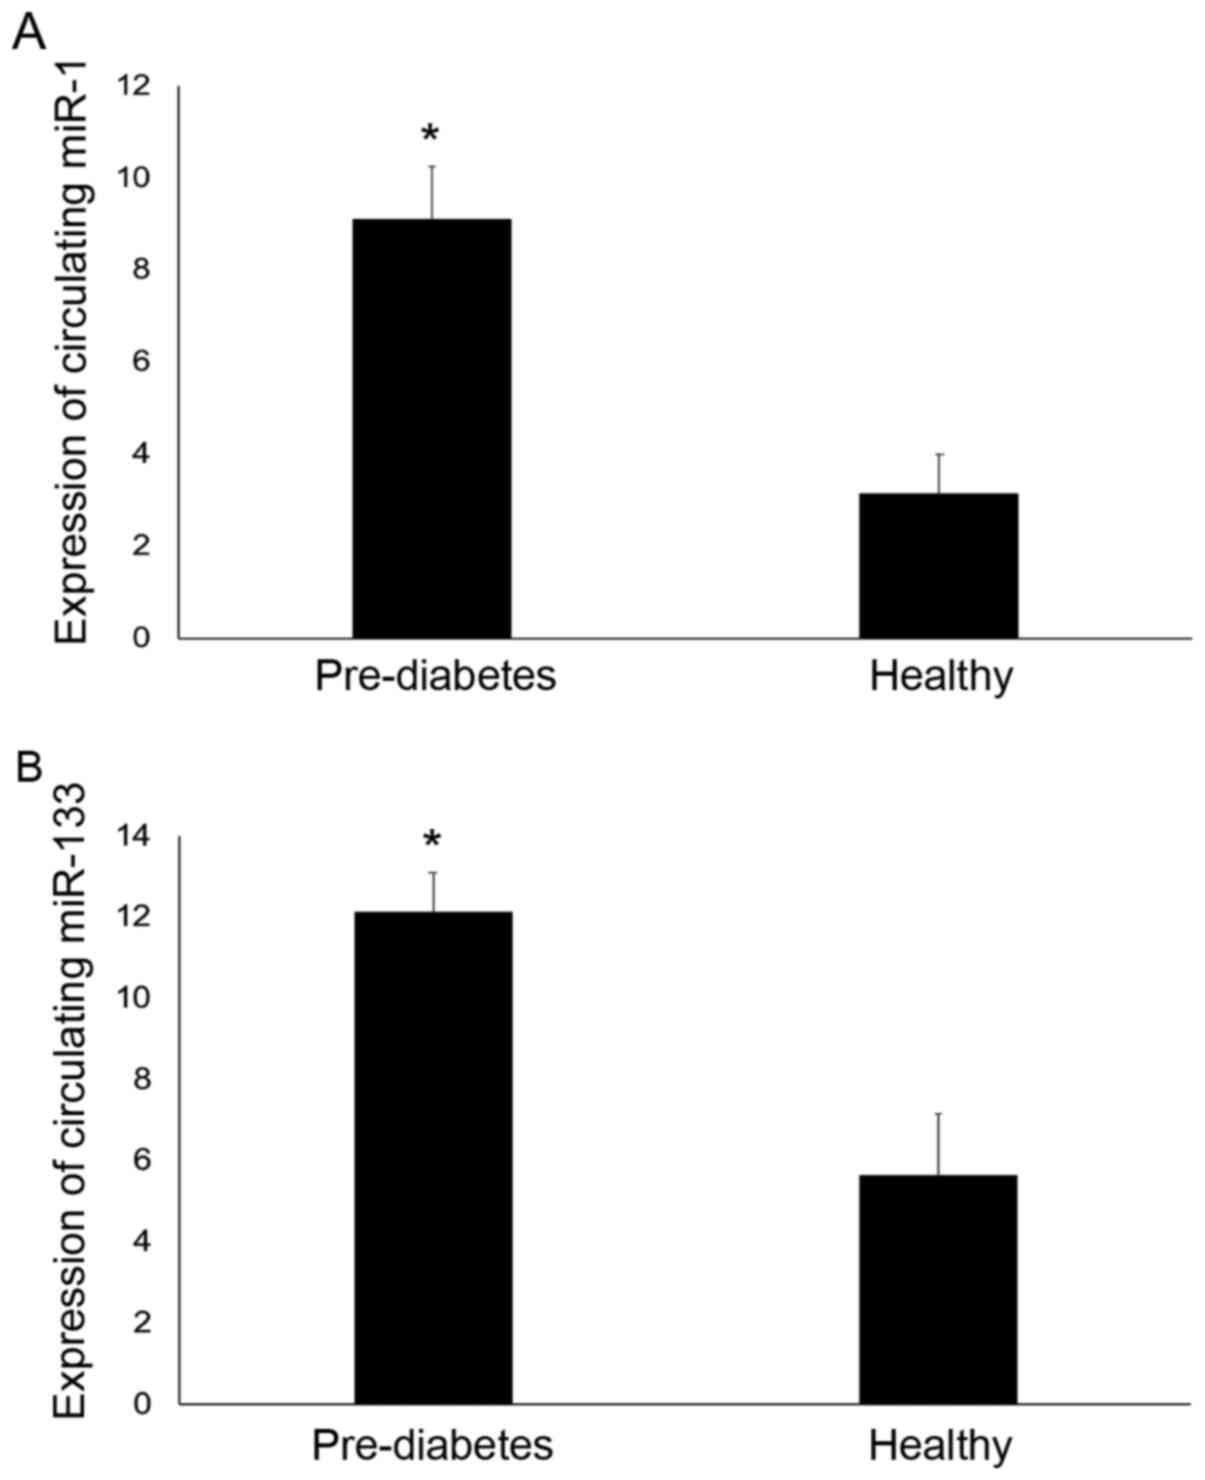
Expression of circulating miR-1 and
miR-133
TaqMan-based RT-qPCR was used to determine the
expression of circulating miR-1 and miR-133 relative to the
expression of RNU6B in whole blood from individuals with
pre-diabetes and healthy controls. Significant differences in the
expression of both miR-1 and miR-133 were observed between the
pre-diabetes and control subjects (Fig.
1). miR-1 expression levels were 2.8-fold higher in the
pre-diabetes individuals compared with the controls (P<0.05).
The mean fold increase in the relative expression of miR-1 was
9.09±1.17 in the pre-diabetes individuals compared with 3.13±0.86
in the control group. In addition, miR-133 expression was 2.2-fold
higher in the pre-diabetes individuals compared with the controls
(P<0.05). The mean fold increase in the relative expression of
miR-133 was 12.13±0.95 in the pre-diabetes individuals compared
with 5.64±1.5 in the control group.
miRNA target prediction
miRDB (mirdb.org/index.html) was used to identify targets for
human miR-1 (hsa-miR-1) and human miR-133 (hsa-miR-133). In total
>900 predicted targets for hsa-miR-1 and >600 predicted
targets were identified in the miRDB database. several of these
targets were found to be related to T2D. These included IGF-1,
SLC7A2, SLC45A4, SLC8A2, HSPD1 and CDK14 for hsa-miR-1; and IGF-1,
SLC7A8, SLC46A1, SLC2A12 and CD47 for hsa-miR-133.
Correlation analysis
The relationship between circulating miR-1 and
miR-133 and clinical parameters in the pre-diabetes subjects was
evaluated using Pearson's correlation coefficient analysis
(Table III). miR-1 was found to be
positively correlated with FG (r=0.512; P<0.001), 2-h OGTT
(r=0.411; P=0.002) and HbA1c (r=0.466; P<0.001). miR-1 was also
positively correlated with insulin levels (r=0.426; P=0.001) and
the HOMO-IR index (r=0.477; P=0.001). A similar trend of
correlation was found for miR-133. It was positively correlated
with FG (r=0.342; P=0.011), 2-h OGTT (r=0.39; P=0.032), HbA1c
(r=0.299; P=0.009), insulin level (r=0.325; P=0.016) and the
HOMO-IR index (r=0.342; P=0.017). No significant correlations were
found for miR-1 or miR-133 with any of the other clinical
parameters (P>0.05).
| Table IIICorrelation analysis. |
Table III
Correlation analysis.
| | miR-1 | miR-133 |
|---|
| Variables | r | P-value | r | P-value |
|---|
| Age, years | 0.195 | 0.154 | 0.102 | 0.087 |
| BMI,
kg/m2 | 0.008 | 0.954 | 0.041 | 0.766 |
| Mean blood
pressure, mmHg | 0.097 | 0.483 | 0.056 | 0.689 |
| FG, mmol/l | 0.512 |
<0.001c | 0.342 |
0.011a |
| 2-h OGTT,
mmol/l | 0.411 |
0.002b | 0.383 |
0.032a |
| HbA1c, % | 0.466 |
<0.001c | 0.299 |
0.009b |
| Insulin, mU/l | 0.426 |
0.001b | 0.325 |
0.016a |
| HOMO-IR | 0.477 |
0.001b | 0.342 |
0.017a |
| LDL-C, mmol/l | 0.197 | 0.166 | 0.235 | 0.097 |
| HDL-C, mmol/l | 0.261 | 0.067 | 0.029 | 0.839 |
| Triglyceride,
mmol/l | 0.004 | 0.975 | 0.218 | 0.117 |
| Total cholesterol,
mmol/l | 0.1 | 0.944 | 0.16 | 0.243 |
Multivariate logistic regression
analysis
Multivariate logistic regression was used to explore
the association between miR-1 or miR-133a and pre-diabetes
outcomes. As shown in Table IV
(Model 1) a direct association was found between miR-1 and
pre-diabetes (OR, 1.200; 95% CI, 1.061-1.357; P=0.004). Similarly,
a direct association was observed between miR-133 and pre-diabetes
(OR, 1.160; 95% CI, 1.053-1.276; P=0.003). In order to establish
whether the association between miR-1 or miR-133a and pre-diabetes
could be influenced by possible confounders, associations were also
adjusted for different clinical parameters, which were subsequently
entered as independent variables into Model 1. Adjustment for age
and sex (Model 2), for age, sex, BMI and blood pressure (Model 3),
and for age, sex, BMI, blood pressure, total cholesterol,
triglyceride and LDL-C levels (Model 4) had no effect on the
association between miR-1 and prediabetes (all P<0.05; Table IV). Similarly, the observed
association between miR-133 and pre-diabetes remained statistically
significant after the same adjustments in all 4 models (all
P<0.05; Table IV)
| Table IVMultivariate regression analysis. |
Table IV
Multivariate regression analysis.
| | miR-1 | miR-133 |
|---|
| Model | OR | 95% CI | P-value | OR | 95% CI | P-value |
|---|
| Model 1 | 1.2 | 1.061-1.357 | 0.004 | 1.16 | 1.053-1.276 | 0.003 |
| Model 2 | 1.179 | 1.041-1.334 | 0.009 | 1.16 | 1.049-1.283 | 0.004 |
| Model 3 | 1.235 | 1.063-1.4636 | 0.006 | 1.164 | 1.047-1.293 | 0.005 |
| Model 4 | 1.251 | 1.070-1.462 | 0.005 | 1.175 | 1.048-1.319 | 0.006 |
Linear regression analysis
Linear regression analysis was performed to identify
predictors of miR-1 and miR-133. In this analysis, miR-1 and
miR-133 were used as dependent variables and all clinical
parameters (Table V) were entered as
independent variables. As shown in Table
V, HOMO-IR (β=0.647, 95% CI, 0.503-5.268; P<0.001) was the
only significant predictor that remained positively associated with
miR-1. Similarly, the HOMO-IR index was found to be the only
significant and positive predictor associated with miR-133
(β=0.406, 95% CI, 0.26-5.466; P=0.005).
| Table VLinear regression analysis. |
Table V
Linear regression analysis.
| miRNA | Variable | β | 95% CI | P-value |
|---|
| miR-1 | HOMO-IR | 0.647 | 0.503-5.268 |
<0.001b |
| miR-133 | HOMO-IR | 0.406 | 0.26-5.466 |
0.005a |
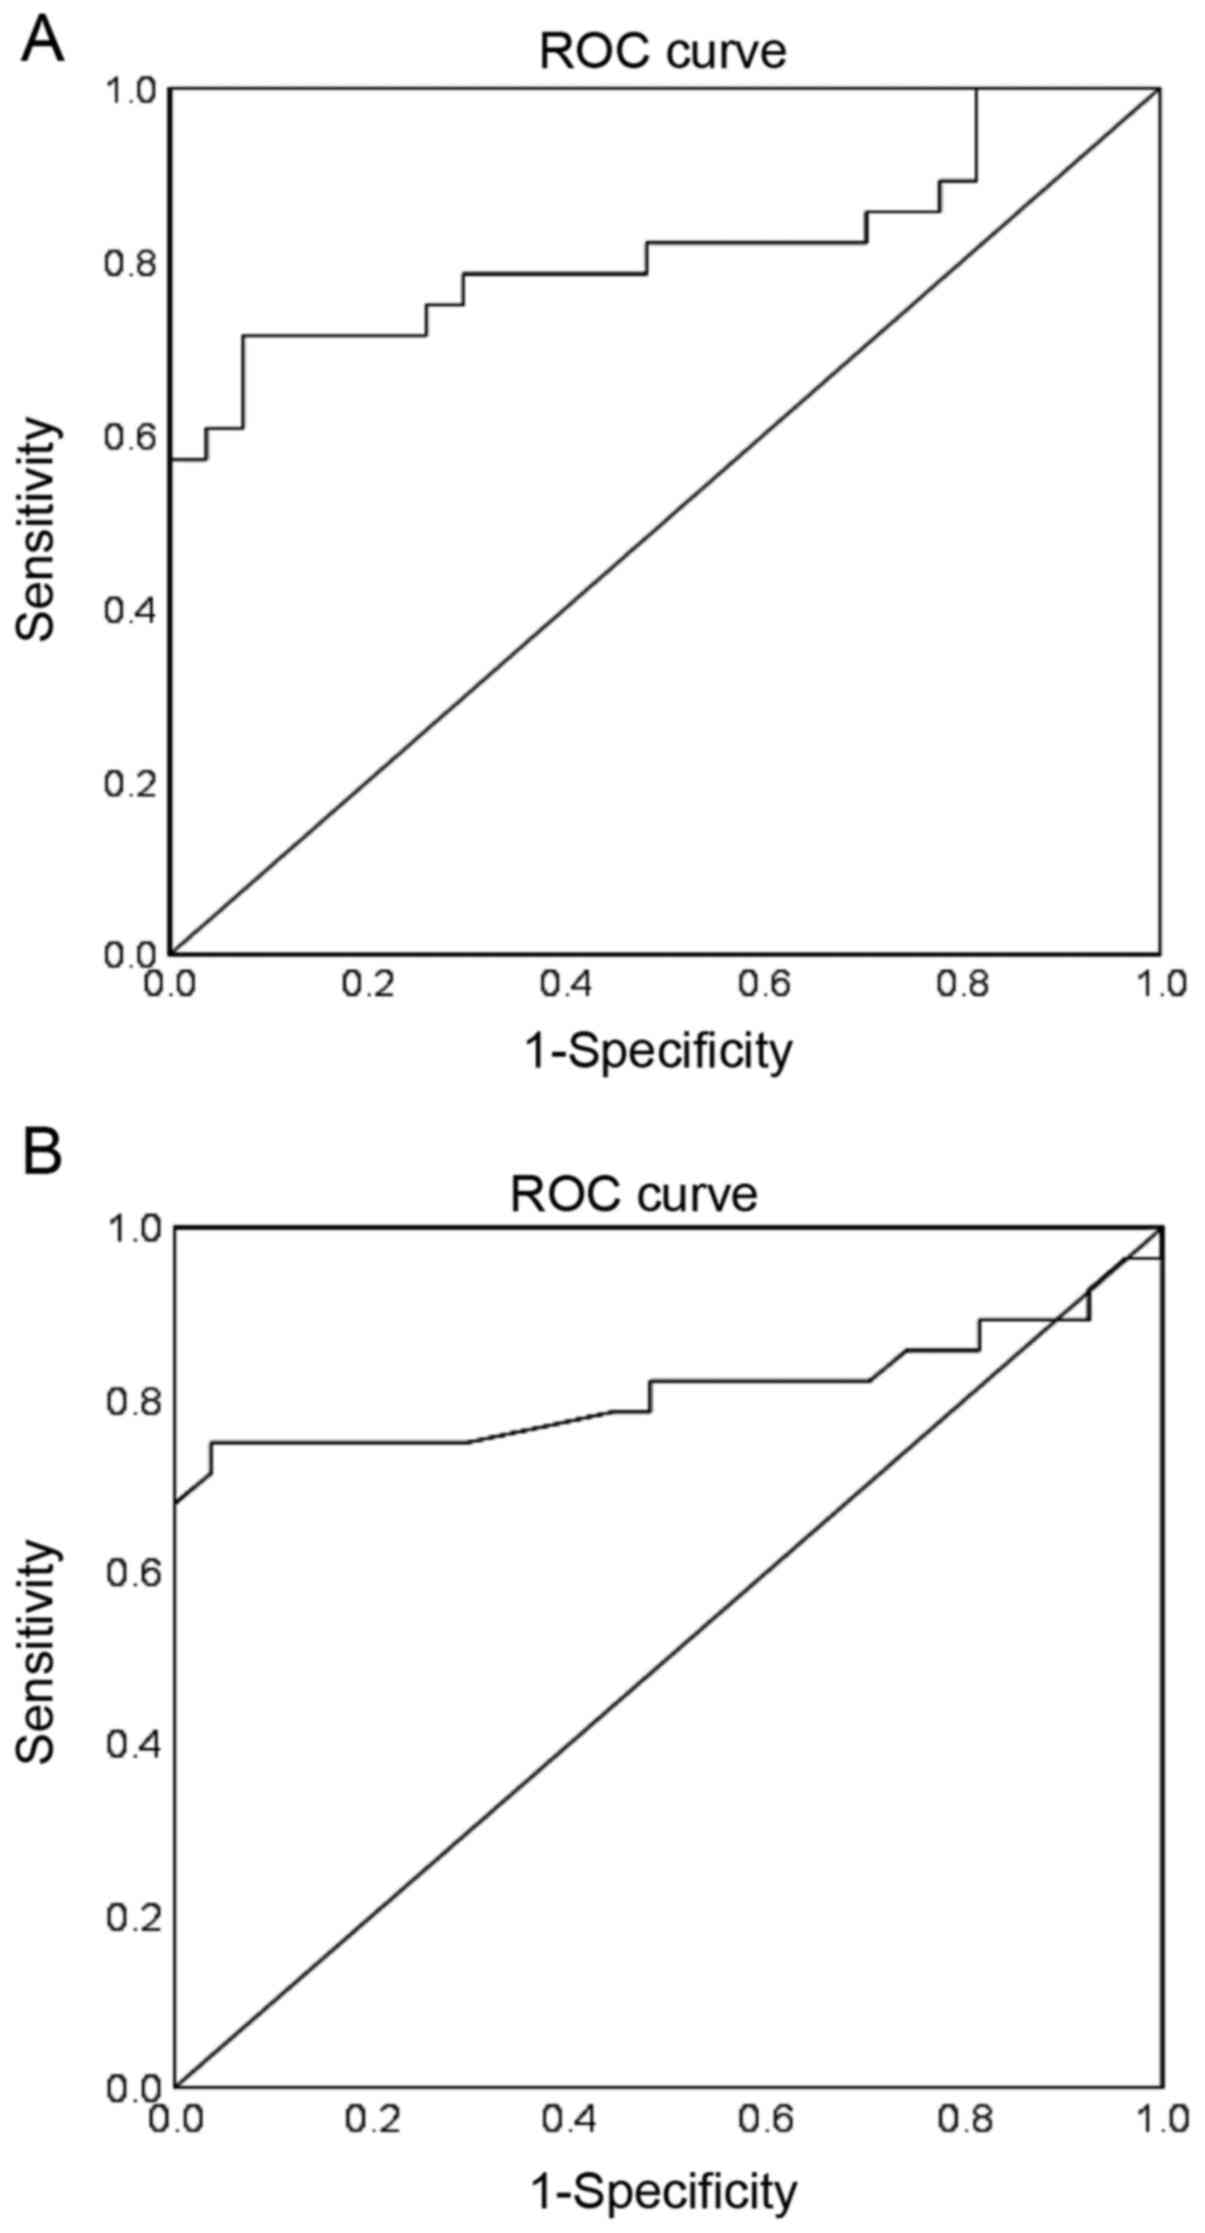
ROC analysis
ROC analysis was performed to evaluate the
diagnostic performance of circulating miR-1 and miR-133 for
pre-diabetes. The AUCs and 95% CIs were obtained. Cut-off points
with the values of sensitivity and specificity considered to be
maximal for miR-1 and miR-133 were also obtained. For miR-1, an AUC
of 0.813 (95% CI, 0.693-0.934; P<0.001) was obtained for
discriminating pre-diabetes from controls (Fig. 2A). At a cut-off value of 15.579, the
sensitivity and specificity of miR-1 were 96.4 and 81.5%
respectively. For miR-133, an AUC of 0.810 (95% CI, 0.680-0.940;
P<0.001) was obtained for discriminating pre-diabetes
individuals from controls (Fig. 2B).
The sensitivity and specificity of miR-133 were 89.3 and 92.6% at a
cut off value of 20.674.
Discussion
Circulating miRNAs have been widely investigated as
possible biomarkers for T2D and disease progression. Profiling
studies have shown that altered expression of circulating miRNAs
can be detected during the early stages of diabetes, supporting
their use as candidate biomarkers for pre-diabetes (20-23).
The present study investigated changes in the
expression of circulating miR-1 and miR-133 before the clinical
diagnosis of T2D, in individuals with IFG and IGT, and in healthy
controls, and evaluated their clinical utility as biomarkers for
pre-diabetes. Using RT-qPCR, the expression levels of circulating
miR-1 and miR-133 in the blood were found to be significantly
higher in the pre-diabetes individuals compared with the healthy
controls. While no previous studies have investigated the
circulating levels of miR-1 and miR-133 in pre-diabetes
individuals, de Gonzalo-Calvo et al (28) found significant increases in the
serum levels of miR-1 and miR-133 in T2D patients, and in a murine
model of insulin resistance. Delic et al (29) reported progressive increases in the
plasma levels of miR-133 in Zucker diabetic rats from the early
stages of pre-diabetes to progression towards T2D.
miR-1 and miR-133 are clustered on the same
chromosomal loci and transcribed together as a single transcript,
in a tissue-specific manner (25).
These two miRNAs are members of the myomiR family. They are
considered muscle-specific miRNAs due to their high expression in
both cardiac and skeletal muscle, and serve a critical regulatory
role in muscle development and remodelling (25). Thus, dysregulation of their
expression is frequently observed in cardiac and muscle diseases
(34-36).
The target prediction performed in the present study supported this
hypothesis. Both miR-1 and miR-133 were predicted to target several
pathways involved in the pathophysiology of diabetes. A previous
study by Granjon et al (27)
showed that miR-1 and miR-133 are regulated by insulin in human
skeletal muscle via sterol regulatory element-binding protein 1c
and myocyte enhancer factor 2C, and both miRNAs were associated
with impaired insulin response in the skeletal muscle of T2D
patients. In the same study, it was also shown that insulin
treatment in insulin-deficient mice resulted in the downregulation
of both miRNAs (27). Moreover,
miR-1 and miR-133 have been also found to be dysregulated in the
skeletal muscle of insulin-resistant mice through altered
insulin-like growth factor 1 (IGF-1)-mediated signalling (37). IGF-1 is one of the validated targets
of miR-1 and miR-133, and both miRNAs negatively regulate its
expression (38,39). Whereas miR-1 has been suggested as an
early-stage marker for the development of insulin resistance
through regulating the IGF-1 pathway in skeletal muscle (37), miR-133 has been shown to repress the
expression of IGF-1R and signalling pathway during skeletal
myogenesis, and is thus proposed as a potential therapeutic target
for management of muscle diseases (38). IGF-1 is a polypeptide hormone that
serves a key role in growth, development and metabolism (40,41). It
shares amino acid sequence homology with insulin and exerts an
insulin-like effect through the stimulation of glucose uptake by
peripheral tissues (40,41). Notably, low IGF-1 levels are
associated with insulin resistance, and with the subsequent
development of IFG/IGT and T2D (42-44).
IFG and IGT are two states of abnormal glucose
metabolism in the early stages of development of T2D (3,4).
Individuals with both IFG and IGT exhibit β-cell dysfunction and
insulin resistance, the core defects seen in T2D patients (7,8). Insulin
resistance serves a major role in the pathophysiology and
development of pre-diabetes and is thought to precede the
manifestation of T2D by several years (7-10).
Particularly, insulin resistance in skeletal muscle is considered
as the primary defect that is evident years before the development
of T2D (26). As with all miRNAs
(18), myomiRs can be released into
the blood circulation (45), acting
as cell-cell communicators to reflect several physiological and
pathological processes.
In the present study, increased expression of miR-1
and miR-133 was observed in the blood of pre-diabetes individuals
with IFG and IGT compared to the healthy controls, further
supporting their potential involvement in insulin resistance and
the pathogenesis of pre-diabetes. In our previous study, it was
demonstrated that miR-1 and miR-133 levels were upregulated in the
blood of T2D patients with and without CVD (24). These previous results and the data
reported in the present study suggest that the higher expression
levels of circulating miR-1 and miR-133 possibly reflect
pathophysiological complications in skeletal muscle and cardiac
tissue. These observations may also suggest that upregulated miR-1
and miR-133 levels in the blood circulation occurs during the
pre-diabetic stage as a result of altered glucose metabolism, and
may persist through to the development of T2D. It is worth noting
that several post-transcriptional modifications can alter miRNA
actions during circulation. Indeed, it has been recently shown that
position-specific oxidation of miR-1 could serve as an
epitranscriptional mechanism to coordinate pathophysiological
redox-mediated gene expression (46). This observation should be further
investigated in patients with prediabetes.
In the present study, the results of Pearson's
correlation coefficient analysis indicated that circulating miR-1
and miR-133 levels, which were higher in the pre-diabetes
individuals, were positively correlated with FG, 2-h OGTT and HbA1c
levels. They were also positively correlated with insulin levels
and the HOMO-IR index. The positive relationship between increased
miR-1 and miR-133 with glycaemic parameters and insulin resistance
suggests their contribution to the metabolic abnormalities
associated with pre-diabetes.
Excess body fat is a potent factor in the
development of glucose intolerance and T2D (47,48). The
pre-diabetes individuals in the present study were slightly
overweight with an average BMI of 25.4 kg/m2. However,
there were no significant correlations between miR-1 and miR-133
levels with BMI. However, changes in the levels of these two miRNAs
have been reported in the skeletal muscle (37) and serum (28) of a mouse model of diet-induced
obesity. It is worth mentioning that the period of high-fat diet
employed to induce obesity in these animals as well as the degree
of obesity can affect the expression of miR-1 and miR-133, and may
account for the discrepancies between studies.
The logistical regression analysis performed in the
present revealed a direct association between upregulated miR-1 and
miR-133 levels with the presence of pre-diabetes. Interestingly,
the association between miR-1 and miR-133 with prediabetes remained
statistically significant after adjustment for age, sex, BMI, blood
pressure, total cholesterol, triglyceride and LDL-C. These results
indicate that higher miR-1 and miR-133 levels were independent of
potential confounders in pre-diabetes. Additionally, the results of
the linear regression analysis identified HOMO-IR as a significant
and positive predictor of miR-1 and miR-133 levels amongst other
clinical variables, suggesting a role of these two miRNAs in
insulin resistance in pre-diabetes.
Pre-diabetes is a high-risk state for the
development of T2D (2,3) and related vascular complications
(4-6).
Intervention strategies such as lifestyle modifications and
medications can reduce the risk of progression of pre-diabetes to
T2D (10,11). Early identification of pre-diabetes
is therefore the gold standard for preventing disease progression.
In the absence of reliable and accurate tests that can identify
pre-diabetes, circulating miRNAs may serve as suitable biomarkers.
Based on previous studies from our group and others, altered levels
of circulating miRNAs that reflect changes in diabetes-related
tissues, such as the pancreatic β cell-related miRNAs (miR-15a and
miR-375) (20-22)
and endothelium-enriched miRNAs (miR-126) (23) have been proposed as biomarkers for
detection of pre-diabetes. In the present study, ROC curve analysis
showed a promising ability of the cardiac and skeletal muscle
specific miR-1 and miR-133 levels in whole blood samples to
distinguish between pre-diabetes individuals and healthy controls,
with high sensitivities and specificities, suggesting the potential
clinical use of these two miRNAs as biomarkers for
pre-diabetes.
Despite the small sample size of the participants,
which limits the statistical power of the study, these results are
promising as miR-1 and miR-133 could be developed as diagnostic
biomarkers for the early identification of individuals with
pre-diabetes. Therefore, these data should be further verified in
larger clinical samples. Additional experiments using two blood
samples from each participant are required to confirm the
expression levels of these two miRNAs. Additionally, it would be
valuable to evaluate the levels IGF-1 and other target genes of
miR-1 and miR-133 in pre-diabetes and T2D patients, and correlate
their expression levels to the levels of these two miRNAs.
In conclusion, the present study showed that
circulating miR-1 and miR-133 levels in whole blood samples were
significantly elevated in individuals with pre-diabetes compared
with the controls. They were positively associated with important
characteristics of pre-diabetes, including glycaemic abnormalities
and insulin resistance, suggesting their involvement in disease
pathogenesis. The present study also revealed that these two miRNAs
could potentially act as clinical diagnostic biomarkers for
pre-diabetes.
Acknowledgements
Not applicable.
Funding
The present study was supported by a research grant
from the College of Medicine and Medical Sciences, Arabian Gulf
University, Kingdom of Bahrain (grant no. 81).
Availability of data and materials
The datasets used and/or analysed during the present
study are available from the corresponding author on reasonable
request.
Authors' contributions
GAK collected and analysed the data, and wrote and
edited the manuscript. HAAM collected and analysed the data, and
wrote the manuscript. AHS analysed the data and wrote the
manuscript. GAK and HAAM confirmed the authenticity of all the raw
data. All authors have read and approved the final manuscript.
Ethics approval and consent to
participate
Ethical approval was obtained from the Medical
Research and Ethics Committee of the College of Medicine and
Medical Sciences, Arabian Gulf University, Kingdom of Bahrain. All
participants in the current study provided informed consent for the
use of their blood samples and data.
Patient consent for publication
Not applicable.
Competing interests
The authors declare that they have no competing
interests.
References
|
1
|
Di Pino A, Urbano F, Piro S, Purrello F
and Rabuazzo AM: Update on pre-diabetes: Focus on diagnostic
criteria and cardiovascular risk. World J Diabetes. 7:423–432.
2016.PubMed/NCBI View Article : Google Scholar
|
|
2
|
Nathan DM, Davidson MB, DeFronzo RA, Heine
RJ, Henry RR, Pratley R and Zinman B: American Diabetes
Association. Impaired fasting glucose and impaired glucose
tolerance: Implications for care. Diabetes Care. 30:753–759.
2007.PubMed/NCBI View Article : Google Scholar
|
|
3
|
Tabák AG, Herder C, Rathmann W, Brunner EJ
and Kivimäki M: Prediabetes: a high-risk state for diabetes
development. Lancet. 379:2279–2290. 2012.PubMed/NCBI View Article : Google Scholar
|
|
4
|
DeFronzo RA and Abdul-Ghani M: Assessment
and treatment of cardiovascular risk in prediabetes: Impaired
glucose tolerance and impaired fasting glucose. Am J Cardiol. 108
(Suppl 3):3B–24B. 2011.PubMed/NCBI View Article : Google Scholar
|
|
5
|
Huang Y, Cai X, Mai W, Li M and Hu Y:
Association between prediabetes and risk of cardiovascular disease
and all cause mortality: systematic review and meta-analysis. BMJ.
355(i5953)2016.PubMed/NCBI View Article : Google Scholar
|
|
6
|
Brannick B, Wynn A and Dagogo-Jack S:
Prediabetes as a toxic environment for the initiation of
microvascular and macrovascular complications. Exp Biol Med
(Maywood). 241:1323–1331. 2016.PubMed/NCBI View Article : Google Scholar
|
|
7
|
Abdul-Ghani MA and DeFronzo RA:
Pathophysiology of prediabetes. Curr Diab Rep. 9:193–199.
2009.PubMed/NCBI View Article : Google Scholar
|
|
8
|
Bergman M: Pathophysiology of prediabetes
and treatment implications for the prevention of type 2 diabetes
mellitus. Endocrine. 43:504–513. 2013.PubMed/NCBI View Article : Google Scholar
|
|
9
|
Fonseca VA: Defining and characterizing
the progression of type 2 diabetes. Diabetes Care 32 Suppl. 2
(Suppl 2):S151–S156. 2009.PubMed/NCBI View Article : Google Scholar
|
|
10
|
Tuso P: Prediabetes and lifestyle
modification: Time to prevent a preventable disease. Perm J.
18:88–93. 2014.PubMed/NCBI View Article : Google Scholar
|
|
11
|
Portero McLellan KC, Wyne K, Villagomez ET
and Hsueh WA: Therapeutic interventions to reduce the risk of
progression from prediabetes to type 2 diabetes mellitus. Ther Clin
Risk Manag. 10:173–188. 2014.PubMed/NCBI View Article : Google Scholar
|
|
12
|
Bartel DP: MicroRNAs: genomics,
biogenesis, mechanism, and function. Cell. 116:281–297.
2004.PubMed/NCBI View Article : Google Scholar
|
|
13
|
Kloosterman WP and Plasterk RH: The
diverse functions of microRNAs in animal development and disease.
Dev Cell. 11:441–450. 2006.PubMed/NCBI View Article : Google Scholar
|
|
14
|
Bartel DP: MicroRNA: Target recognition
and regulatory functions. Cell. 136:215–233. 2009.PubMed/NCBI View Article : Google Scholar
|
|
15
|
Tang X, Tang G and Ozcan S: Role of
microRNAs in diabetes. Biochim Biophys Acta. 1779:697–701.
2008.PubMed/NCBI View Article : Google Scholar
|
|
16
|
Deng J and Guo F: MicroRNAs and type 2
diabetes. ExRNA. 1(36)2019.
|
|
17
|
Mitchell PS, Parkin RK, Kroh EM, Fritz BR,
Wyman SK, Pogosova-Agadjanyan EL, Peterson A, Noteboom J, O'Briant
KC, Allen A, et al: Circulating microRNAs as stable blood-based
markers for cancer detection. Proc Natl Acad Sci USA.
105:10513–10518. 2008.PubMed/NCBI View Article : Google Scholar
|
|
18
|
Chen X, Liang H, Zhang J, Zen K and Zhang
CY: Secreted microRNAs: A new form of intercellular communication.
Trends Cell Biol. 22:125–132. 2012.PubMed/NCBI View Article : Google Scholar
|
|
19
|
Vienberg S, Geiger J, Madsen S and
Dalgaard LT: MicroRNAs in metabolism. Acta Physiol (Oxf).
219:346–361. 2017.PubMed/NCBI View Article : Google Scholar
|
|
20
|
Jiménez-Lucena R, Camargo A, Alcalá-Diaz
JF, Romero-Baldonado C, Luque RM, van Ommen B, Delgado-Lista J,
Ordovás JM, Pérez-Martínez P, Rangel-Zúñiga OA and López-Miranda J:
A plasma circulating miRNAs profile predicts type 2 diabetes
mellitus and prediabetes: from the CORDIOPREV study. J Exp Mol Med.
50:1–12. 2018.PubMed/NCBI View Article : Google Scholar
|
|
21
|
Al-Kafaji G, Al-Mahroos G, Alsayed NA,
Hasan ZA, Nawaz S and Bakhiet M: Peripheral blood microRNA-15a is a
potential biomarker for type 2 diabetes mellitus and pre-diabetes.
Mol Med Rep. 12:7485–7490. 2015.PubMed/NCBI View Article : Google Scholar
|
|
22
|
Al-Muhtaresh H and Al-Kafaji G: Evaluation
of two-diabetes related microRNAs suitability as earlier blood
biomarkers for detecting prediabetes and type 2 diabetes mellitus.
J Clin Med. 7(12)2018.PubMed/NCBI View Article : Google Scholar
|
|
23
|
Zhang T, Li L, Shang Q, Lv C, Wang C and
Su B: Circulating miR-126 is a potential biomarker to predict the
onset of type 2 diabetes mellitus in susceptible individuals.
Biochem Biophys Res Commun. 463:60–63. 2015.PubMed/NCBI View Article : Google Scholar
|
|
24
|
Al-Muhtaresh HA, Salem AH and Al-Kafaji G:
Upregulation of circulating cardiomyocyte-enriched miR-1 and
miR-133 associate with the risk of coronary artery disease in type
2 diabetes patients and serve as potential biomarkers. J Cardiovasc
Transl Res. 12:347–357. 2019.PubMed/NCBI View Article : Google Scholar
|
|
25
|
Mitchelson KR and Qin WY: Roles of the
canonical myomiRs miR-1, -133 and -206 in cell development and
disease. World J Biol Chem. 6:162–208. 2015.PubMed/NCBI View Article : Google Scholar
|
|
26
|
DeFronzo RA and Tripathy D: Skeletal
muscle insulin resistance is the primary defect in type 2 diabetes.
Diabetes Care. 32 (Suppl 2):S157–S163. 2009.PubMed/NCBI View Article : Google Scholar
|
|
27
|
Granjon A, Gustin MP, Rieusset J, Lefai E,
Meugnier E, Güller I, Cerutti C, Paultre C, Disse E, Rabasa-Lhoret
R, et al: The microRNA signature in response to insulin reveals its
implication in the transcriptional action of insulin in human
skeletal muscle and the role of a sterol regulatory element-binding
protein-1c/myocyte enhancer factor 2C pathway. Diabetes.
58:2555–2564. 2009.PubMed/NCBI View Article : Google Scholar
|
|
28
|
de Gonzalo-Calvo D, van der Meer RW,
Rijzewijk LJ, Smit JW, Revuelta-Lopez E, Nasarre L, Escola-Gil JC,
Lamb HJ and Llorente-Cortes V: Serum microRNA-1 and microRNA-133a
levels reflect myocardial steatosis in uncomplicated type 2
diabetes. Sci Rep. 7(47)2017.PubMed/NCBI View Article : Google Scholar
|
|
29
|
Delic D, Eisele C, Schmid R, Luippold G,
Mayoux E and Grempler R: Characterization of micro-RNA changes
during the progression of type 2 diabetes in zucker diabetic fatty
rats. Int J Mol Sci. 17(665)2016.PubMed/NCBI View Article : Google Scholar
|
|
30
|
World Health Organization (WHO):
Definition and diagnosis of diabetes mellitus and intermediate
hyperglycaemia: report of a WHO/IDF consultation. WHO, Geneva,
2006. https://apps.who.int/iris/handle/10665/43588?locale%E2%80%91attribute=es&show=full.
Accessed June 16, 2012.
|
|
31
|
American Diabetes Association. Diagnosis
and classification of diabetes mellitus. Diabetes Care. 33 (Suppl
1):S62–S69. 2010.PubMed/NCBI View Article : Google Scholar
|
|
32
|
Matthews DR, Hosker JP, Rudenski AS,
Naylor BA, Treacher DF and Turner RC: Homeostasis model assessment:
Insulin resistance and β-cell function from fasting plasma glucose
and insulin concentrations in man. Diabetologia. 28:412–419.
1985.PubMed/NCBI View Article : Google Scholar
|
|
33
|
Griffiths-Jones S, Grocock RJ, van Dongen
S, Bateman A and Enright AJ: miRBase: microRNA sequences, targets
and gene nomenclature. Nucleic Acids Res. 34:D140–D144.
2006.PubMed/NCBI View Article : Google Scholar
|
|
34
|
Horak M, Novak J and Bienertova-Vasku J:
Muscle-specific microRNAs in skeletal muscle development. Dev Biol.
410:1–13. 2016.PubMed/NCBI View Article : Google Scholar
|
|
35
|
Colpaert RMW and Calore M: MicroRNAs in
cardiac diseases. Cells. 8(737)2019.PubMed/NCBI View Article : Google Scholar
|
|
36
|
Chen JF, Callis TE and Wang DZ: microRNAs
and muscle disorders. J Cell Sci. 122 (Pt 1):13–20. 2009.PubMed/NCBI View Article : Google Scholar
|
|
37
|
Frias Fde T, de Mendonça M, Martins AR,
Gindro AF, Cogliati B, Curi R and Rodrigues AC: MyomiRs as markers
of insulin resistance and decreased myogenesis in skeletal muscle
of diet-induced obese mice. Front Endocrinol (Lausanne).
7(76)2016.PubMed/NCBI View Article : Google Scholar
|
|
38
|
Huang MB, Xu H, Xie SJ, Zhou H and Qu LH:
Insulin-like growth factor-1 receptor is regulated by microRNA-133
during skeletal myogenesis. PLoS One. 6(e29173)2011.PubMed/NCBI View Article : Google Scholar
|
|
39
|
Elia L, Contu R, Quintavalle M, Varrone F,
Chimenti C, Russo MA, Cimino V, De Marinis L, Frustaci A, Catalucci
D and Condorelli G: Reciprocal regulation of microRNA-1 and
insulin-like growth factor-1 signal transduction cascade in cardiac
and skeletal muscle in physiological and pathological conditions.
Circulation. 120:2377–2385. 2009.PubMed/NCBI View Article : Google Scholar
|
|
40
|
Clemmons DR: Metabolic actions of
insulin-like growth factor-I in normal physiology and diabetes.
Endocrinol Metab Clin North Am. 41:425–443, vii-viii.
2012.PubMed/NCBI View Article : Google Scholar
|
|
41
|
Rajpathak SN, Gunter MJ, Wylie-Rosett J,
Ho GY, Kaplan RC, Muzumdar R, Rohan TE and Strickler HD: The role
of insulin-like growth factor-I and its binding proteins in glucose
homeostasis and type 2 diabetes. Diabetes Metab Res Rev. 25:3–12.
2009.PubMed/NCBI View Article : Google Scholar
|
|
42
|
Dunger D, Yuen K and Ong K: Insulin-like
growth factor I and impaired glucose tolerance. Horm Res. 62 (Suppl
1):101–107. 2004.PubMed/NCBI View Article : Google Scholar
|
|
43
|
Sandhu MS, Heald AH, Gibson JM,
Cruickshank JK, Dunger DB and Wareham NJ: Circulating
concentrations of insulin-like growth factor-I and development of
glucose intolerance: A prospective observational study. Lancet.
359:1740–1745. 2002.PubMed/NCBI View Article : Google Scholar
|
|
44
|
Aguirre GA, De Ita JR, de la Garza RG and
Castilla-Cortazar I: Insulin-like growth factor-1 deficiency and
metabolic syndrome. J Transl Med. 14(3)2016.PubMed/NCBI View Article : Google Scholar
|
|
45
|
Siracusa J, Koulmann N and Banzet S:
Circulating myomiRs: A new class of biomarkers to monitor skeletal
muscle in physiology and medicine. J Cachexia Sarcopenia Muscle.
9:20–27. 2018.PubMed/NCBI View Article : Google Scholar
|
|
46
|
Seok H, Lee H, Lee S, Ahn SH, Lee HS, Kim
GD, Peak J, Park J, Cho YK, Jeong Y, et al: Position-specific
oxidation of miR-1 encodes cardiac hypertrophy. Nature.
584:279–285. 2020.PubMed/NCBI View Article : Google Scholar
|
|
47
|
Gómez-Ambrosi J, Silva C, Galofré JC,
Escalada J, Santos S, Gil MJ, Valentí V, Rotellar F, Ramírez B,
Salvador J, et al: Body adiposity and type 2 diabetes: Increased
risk with a high body fat percentage even having a normal BMI.
Obesity (Silver Spring). 19:1439–1444. 2011.PubMed/NCBI View Article : Google Scholar
|
|
48
|
Khaodhiar L, Cummings S and Apovian CM:
Treating diabetes and prediabetes by focusing on obesity
management. Curr Diab Rep. 9:348–354. 2009.PubMed/NCBI View Article : Google Scholar
|