Introduction
Diabetes mellitus (DM) is a common chronic metabolic
disease, which is primarily characterized by an increase in blood
glucose levels and its complications are usually caused by insulin
resistance or deficiency (1). In
China, ~11% of the population are diagnosed with DM at present, and
the age of onset has been decreasing in recent years (2). As the most common type of diabetes,
type 2 DM (T2DM) accounts for 90-95% of all DM cases (3). It has been confirmed that abnormal
glucose metabolism in the liver is one of the primary pathological
factors of T2DM, and diabetic patients often exhibit disrupted
glycogenesis and glycogenolysis, with the role of glycogenesis
being particularly important (4). In
the process of gluconeogenesis, phosphoenolpyruvate carboxylase
(PEPCK) and glucose-6-phosphatase (G6Pase) are the key enzymes in
the liver regulating the conversion of non-sugar substances into
glucose. The increase in their expression is associated with the
enhancement of gluconeogenesis (5).
Therefore, PEPCK and G6Pase are important targets for diabetes
treatment and development of novel drugs.
The insulin signaling pathway serves an important
role in T2DM. Normal insulin signaling can inhibit the occurrence
of gluconeogenesis in hepatocytes, reduce the output of glucose,
and increase the utilization of glucose by peripheral tissues
(6). AKT is a key downstream
molecule in the insulin signaling pathway, and its abnormal
phosphorylation is closely associated with insulin resistance and
gluconeogenesis, which is considered as a marker of T2DM (7). Therefore, screening drugs that target
AKT based on traditional Chinese herbal medicines that exhibit
anti-gluconeogenic or anti-insulin resistance properties may be
useful for the treatment of diabetes.
Oxymatrine is an important active component of the
traditional Chinese herbal medicine Sophora flavescens Ait.
It has a variety of pharmacological effects, such as
anti-inflammatory, antiallergic, antiviral, antifibrotic, blood
sugar- and blood lipid-lowering properties (8-13).
It was previously demonstrated that oxymatrine has anti-T2DM
properties and may be used for obesity-related diseases as an
adjuvant therapy (14,15). Its mechanism is associated with the
regulation of the PI3K/AKT pathway (15); however, the exact mechanism remains
to be elucidated. It was demonstrated that oxymatrine can
effectively improve the sensitivity of T2DM rats to insulin,
indicating that oxymatrine may be a new therapeutic strategy for
anti-gluconeogenesis in patients with T2DM (16). However, few studies to date have
explored whether the protective mechanism of oxymatrine on diabetes
is associated with the phosphorylation of AKT and the regulation of
the expression of gluconeogenesis-related genes.
The aim of the present study was to explore the
effect of oxymatrine on gluconeogenesis in T2DM rats, and to
determine whether its mechanism of action is associated with the
regulation of PEPCK and G6Pase expression, as well as AKT
phosphorylation in the liver.
Materials and methods
Animal experiments
A total of 40 male Sprague-Dawley rats (8 weeks old;
weight, 270±20 g) were provided by Hunan SJA Laboratory Animal Co.,
Ltd. All rats were raised according to the standard conditions:
12-h light/dark cycle, 25˚C ambient temperature and 60% humidity.
All rats were provided ad libitum access to food and water.
The study was performed in accordance with the National Research
Council (US) Committee guidelines for the care and use of
experimental animals (16), and was
approved by the Veterinary Animal Care and use Committee of Hunan
Normal University (approval no. 2019111).
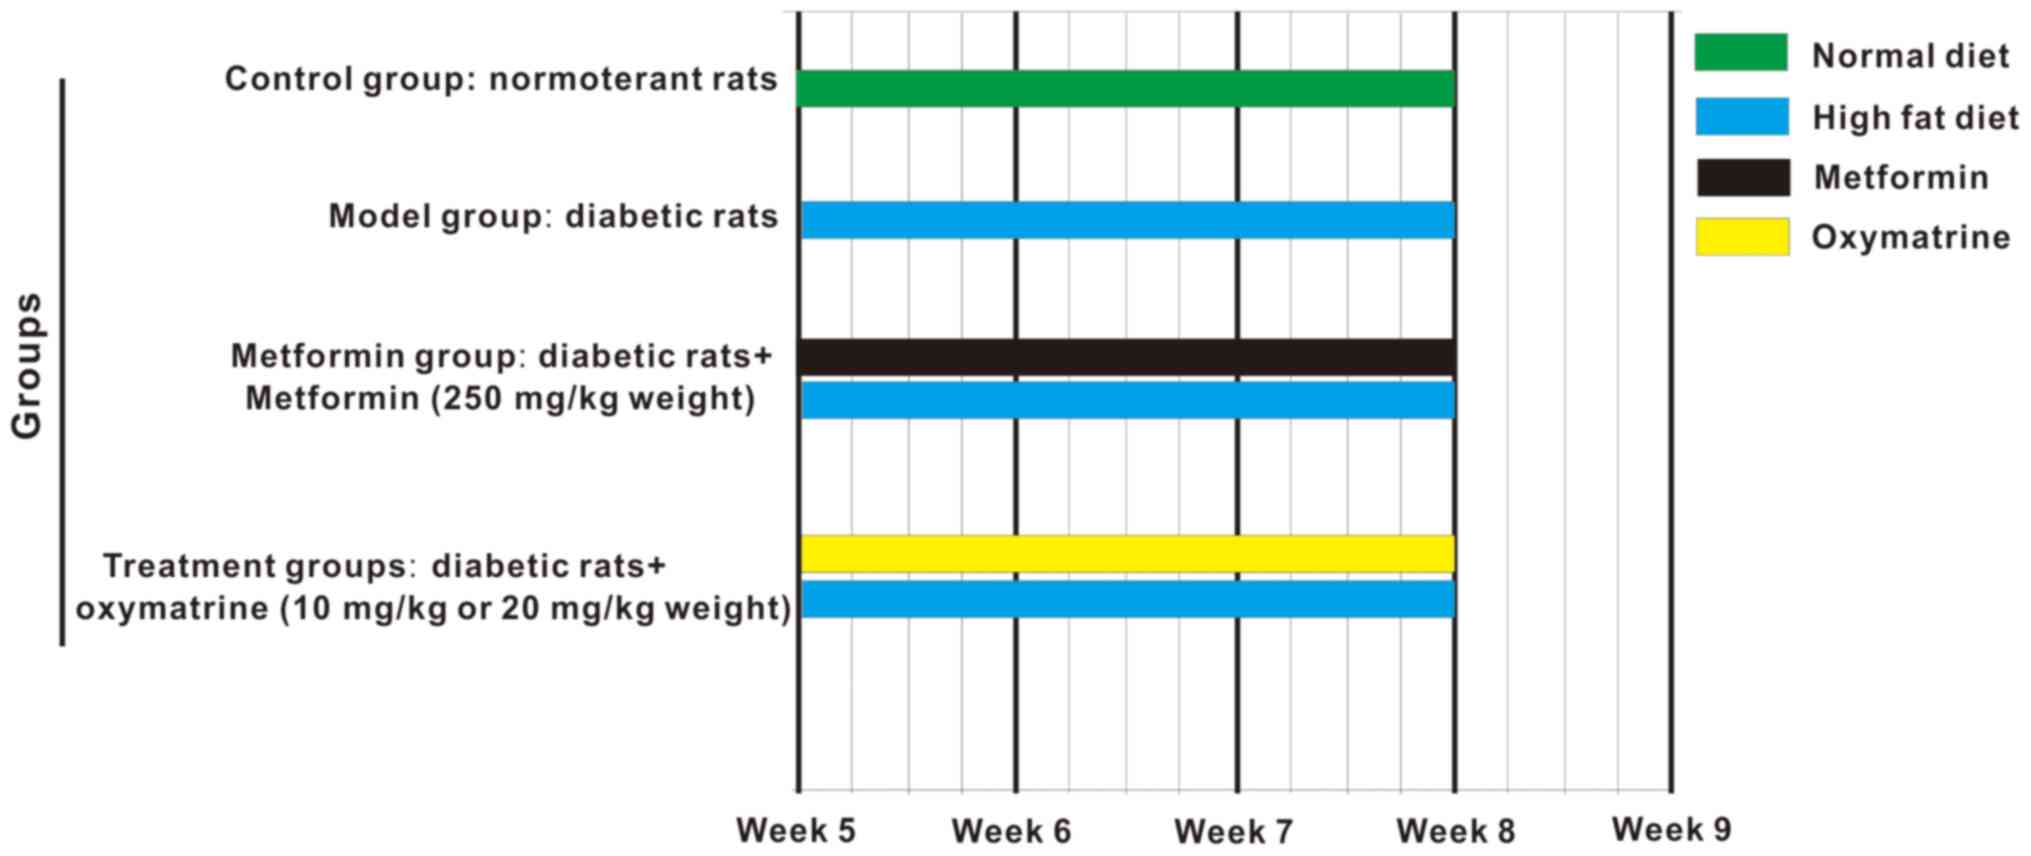
The T2DM rat model was established as described by
Ma et al (17) with some
modifications: The rats were fed a high-fat diet from the beginning
of the experiments, and were administered streptozotocin by
intraperitoneal injection (from week 1 to 4) every 2 days, at a
dose of 15 mg/kg body weight. At the end of the 4th
week, 500 µl blood was collected from the tail vein to evaluate
glucose levels, and a fasting glucose of ≥11.1 mmol/l indicated
that the T2DM model was successfully established. From the 5th to
the 8th week, the diabetic rats were administered oxymatrine once
per day (Fig. 1). The chemical
structure of oxymatrine is shown in Fig. S1. The animals were randomly divided
into 5 groups (n=8 per group) as follows: Control group, rats were
fed a normal diet and injected with normal saline; model group,
T2DM group; high-dose oxymatrine (CAS registry no. 2318-18-5;
XiXisys Group Co., Ltd.); intervention group, T2DM rats were given
oxymatrine at 20 mg/kg body weight by gavage; low-dose oxymatrine
intervention group, T2DM rats were given oxymatrine at 10 mg/kg
body weight by gavage; and metformin group, T2DM rats were given
metformin at 25 mg/kg body weight. The levels of blood glucose and
insulin sensitivity were assessed at the end of the 8th week. At
the end of the experiments, all rats were sacrificed by acute blood
loss by severing the femoral artery under anesthesia via
intraperitoneal injection of 3% pentobarbital sodium (40 mg/kg
weight). After death was confirmed by lack of heartbeat and
breathing, the liver tissues were collected and stored in liquid
nitrogen for mRNA and protein analysis.
Measurement of fasting blood glucose
levels
Blood samples of 500 µl were obtained from the
caudal vein of each rat using a needle (size 7) and the blood
glucose levels were measured by a blood glucose meter (Sano).
Insulin sensitivity test in rats
A glucose-insulin tolerance test was used for the
analysis of insulin sensitivity of rats. The rats were anesthetized
by intraperitoneal injection of sodium pentobarbital at a dose of
50 mg/kg body weight following 8 h of fasting. The femoral vein and
femoral artery were intubated following administration of glucose
and insulin at 700 mg/kg and 0.175 U/kg, respectively. Blood
samples were collected from the femoral artery 3, 6, 9, 12 and
15-min after insulin injection, and the blood glucose levels were
measured. The K-value was used for the analysis of sensitivity to
insulin, which reflects the reduction rate of blood glucose between
3 and 15 min (18).
Determination of body weight and liver
index
The weights of the body and liver were measured
using an electronic scale. The liver index was calculated as the
ratio of liver weight to body weight.
Hematoxylin and eosin (HE)
staining
The liver tissues were subjected to the following
process: They were fixed in Carnoy's solution at 4˚C for 20 min,
dehydrated in ethanol, transparentized in xylene, embedded in
paraffin and cut into 5-µm sections. The paraffin sections were
then dewaxed and subjected to HE staining at 4˚C for 10 min. Then,
morphological analysis was performed under a light microscope
(magnification, x200; Olympus IX71, Olympus Corporation).
Cell culture and protocols
The HepG2 cell line was provided by China Center for
Type Culture Collection. The cells were cultured in DMEM (Gibco;
Thermo Fisher Scientific, Inc.) supplemented with 10% FBS (Gibco;
Thermo Fisher Scientific, Inc.), 100 U/ml penicillin and 100 µg/ml
streptomycin, and cultured in a humidified incubator with 95% air
and 5% CO2 at 37˚C. The cells were subjected to
different treatments after they had reached 70% confluence as
follows: i) Control group, cells were cultured in DMEM containing
5.5 mM glucose for 24 h; ii) high-glucose group, cells were
cultured in DMEM containing 55 mM glucose for 24 h; iii) low-dose
oxymatrine treatment group, cells were cultured in DMEM containing
55 mM glucose and 0.1 µM oxymatrine for 24 h; iv) high-dose
oxymatrine treatment group, cells were cultured in DMEM containing
55 mM glucose and 1 µM oxymatrine for 24 h; v) metformin treatment
group, cells were cultured in DMEM containing 55 mM glucose and 0.1
µM metformin for 24 h; vi) oxymatrine and MK2206 combination
treatment group, cells were cultured in DMEM containing 55 mM
glucose, 0.1 µM oxymatrine and 3 µM MK-2206 (AKT inhibitor; cat.
no. SF2712, Beyotime Institute of Biotechnology) for 24 h. Then,
the cells were collected for mRNA and protein expression analysis,
or glucose production and uptake assays.
Glucose production and uptake assays
of HepG2 cells
For the glucose production assay, the HepG2 cells
were rinsed with PBS to remove glucose and then incubated in
glucose production assay medium (glucose- and phenol red-free DMEM)
for 3 h. Subsequently, the supernatant was collected for glucose
concentration measurement by using a commercial colorimetric
glucose assay kit (Sigma-Aldrich; Merck KGaA). The readings were
then normalized to the total protein content determined from the
whole-cell lysates.
The glucose uptake rate was measured using the
methods established by Yoshioka et al (19) with slight modifications. Briefly,
HepG2 cells were washed twice with PBS and then incubated with 200
µM 2-NBDG in glucose-free culture medium for 30 min. Cells
incubated with glucose-free medium without 2-NBDG served as a
negative control. Finally, the cells were rinsed with PBS and
fluorescence was determined using a microplate reader (Infinite
M1000, Tecan Austria GmbH) with excitation at 488 nm and emission
at 520 nm.
RNA extraction and reverse
transcription-quantitative PCR (RT-qPCR) analysis
Total RNA from liver tissues was separated and
extracted using an RNA extraction buffer (TRIzol®,
Takara Bio, Inc.), and the concentration and purity of RNA were
determined by spectrophotometry. According to the operating
instructions of the transcription kit (cat. no. DRR037A; Takara
Bio, Inc.), 200 ng RNA was extracted from each sample for reverse
transcription amplification. The 10-µl reverse transcription
reaction system consisted of random primers (0.5 µl), Oligo dT
Primer (0.5 µl), 5X PrimeScript buffer (2 µl), RT Enzyme (0.5 µl),
RNase-Free dH2O (4.5 µl) and RNA (2 µl). The reverse
transcription reaction conditions were 37˚C for 10 min, followed by
85˚C for 5 sec. Subsequently, the cDNA was mixed with SYBR premix
reagent (Takara Bio, Inc.) and primers to create a 25-µl reaction
system (10 µl SYBR Premix Ex Taq™, 0.5 µl forward
primer, 0.5 µl reverse primer, 0.5 µl 50X ROX Reference Dye, 4 µl
RNA and 4.5 µl RNase-Free dH2O). The thermocycling
conditions were as follows: Pre-denaturation (95˚C, 30 sec),
denaturation (95˚C, 30 sec), annealing (60˚C, 30 sec) and
elongation (70˚C, 31 sec), for a total of 35 cycles. The sequences
of the PCR primers used were as follows: PEPCK forward,
5'-GGATGTGGCCAGGATCGAAA-3' and reverse, 5'-ATACATGGTGCGGCCTTTCA-3';
G6Pase forward, 5'-GATTCCGGTGCTTGAATGTCG-3' and reverse,
5'-GCATTGTAGATGCCCCGGAT-3'; and β-actin forward,
5'-CCCATCTATGAGGGTTACGC-3' and reverse,
5'-TTTAATGTCACGCACGATTTC-3'. The mRNA levels of PEPCK and G6Pase in
the liver were analyzed using an ABI 7300 amplifier (Thermo Fisher
Scientific, Inc.). The 2-ΔΔCq method was used for data
analysis and results were normalized to β-actin (20).
Western blot analysis
Tissues or cells were treated with lysis buffer
containing PMSF (1% mmol/l; cat. no. ST505, Beyotime Institute of
Biotechnology) and Phosphatase inhibitor cocktail A (cat. no.
P1081, Beyotime Institute of Biotechnology), and total protein was
obtained. A BCA protein assay kit (cat. no. P0001, Beyotime
Institute of Biotechnology) was used for protein concentration
determination. Then, the proteins were denatured at 99˚C for 5 min.
Following denaturation, 40 µg protein from each sample was loaded
per lane, subjected to 10% SDS-PAGE and transferred to a PVDF
membrane, which was then blocked using 20% skimmed milk powder in
TBS-T. Subsequently, the membrane was rinsed with water and
incubated with primary antibodies (dilution 1:1,000) against PEPCK
(cat. no. sc-271029, Santa Cruz Biotechnology, Inc.), G6Pase (cat.
no. sc-25840, Santa Cruz Biotechnology, Inc.), AKT (cat. no.
sc-81434, Santa Cruz Biotechnology, Inc.), pAKT (cat. no.
sc-514032, Santa Cruz Biotechnology, Inc.) and β-actin (cat. no.
AF5001, Beyotime Institute of Biotechnology) overnight at 4˚C.
Then, the membrane was rinsed with Tris-EDTA buffer and water,
followed by a 2-h incubation at 25˚C with horseradish
peroxidase-conjugated secondary antibodies (cat. no. A0208, goat
anti-rabbit IgG; cat. no. A0216, goat anti-mouse IgG; dilution
1:2,000, Beyotime Institute of Biotechnology). The signals were
visualized using an enhanced chemiluminescence kit (GE Healthcare).
ImageJ version 1.43 (National Institutes of Health) was used for
optical density analysis. In order to ensure the accuracy of sample
addition, β-actin was used as the loading control.
Statistical analysis
SPSS software (version 17; SPSS, Inc.) was used for
statistical analysis. The data are expressed as the mean ± standard
deviation. A one-way ANOVA followed by a Tukey's post hoc test was
used for comparison between multiple groups. All experiments were
repeated three times. P<0.05 was considered to indicate a
statistically significant difference.
Results
Effects of oxymatrine on fasting blood
glucose in T2DM rats
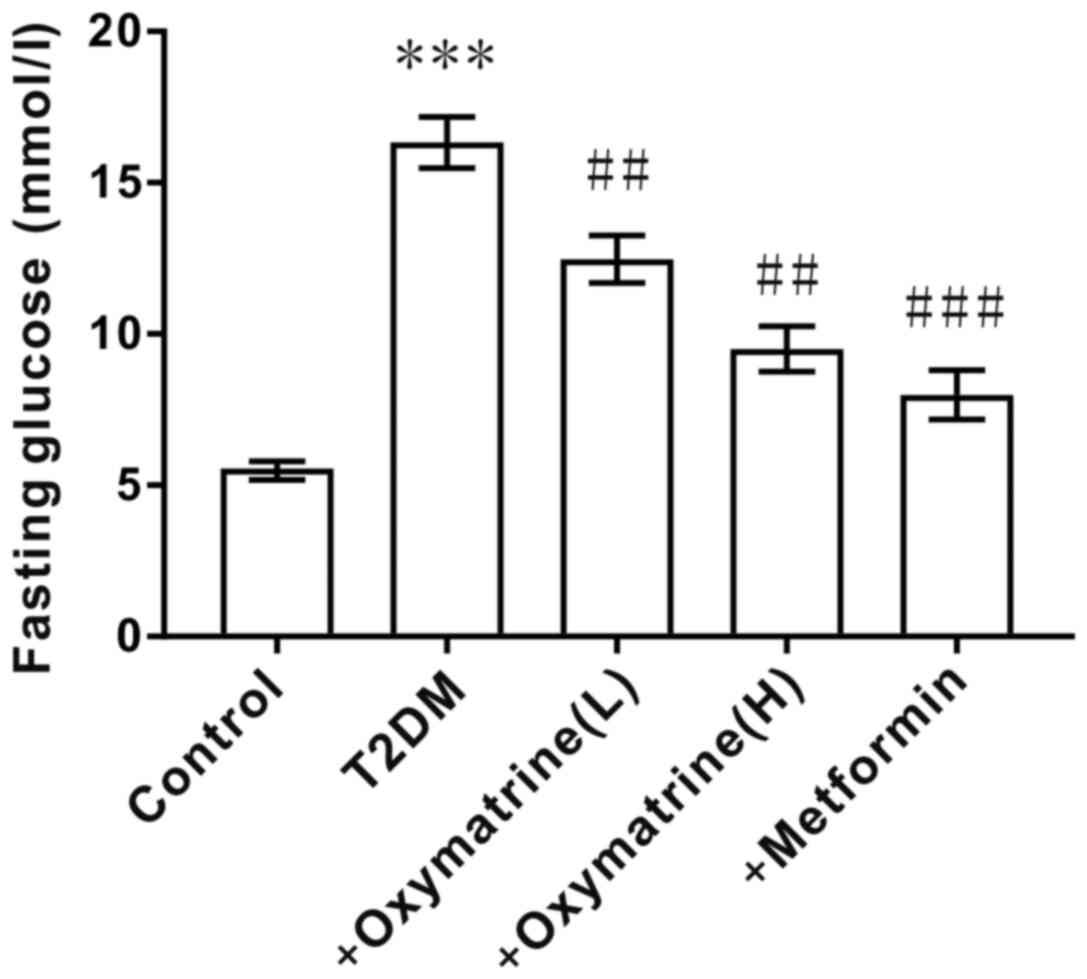
After inducing T2DM in SD rats with a high-fat diet
and intraperitoneal injection of streptozotocin, the fasting blood
glucose levels of the rats was measured. As shown in Fig. 2, compared with the control group (6.1
mmol/l), the fasting blood glucose levels of T2DM rats were
increased significantly (16.5 mmol/l), indicating that the T2DM
model was successfully established. Then, the T2DM rats were
administered oxymatrine and it was observed that oxymatrine could
reduce the fasting blood glucose levels in a dose-dependent manner
(Fig. 2). This suggested that
oxymatrine may be effective for lowering blood glucose
concentration.
Effects of oxymatrine on insulin
sensitivity in T2DM rats
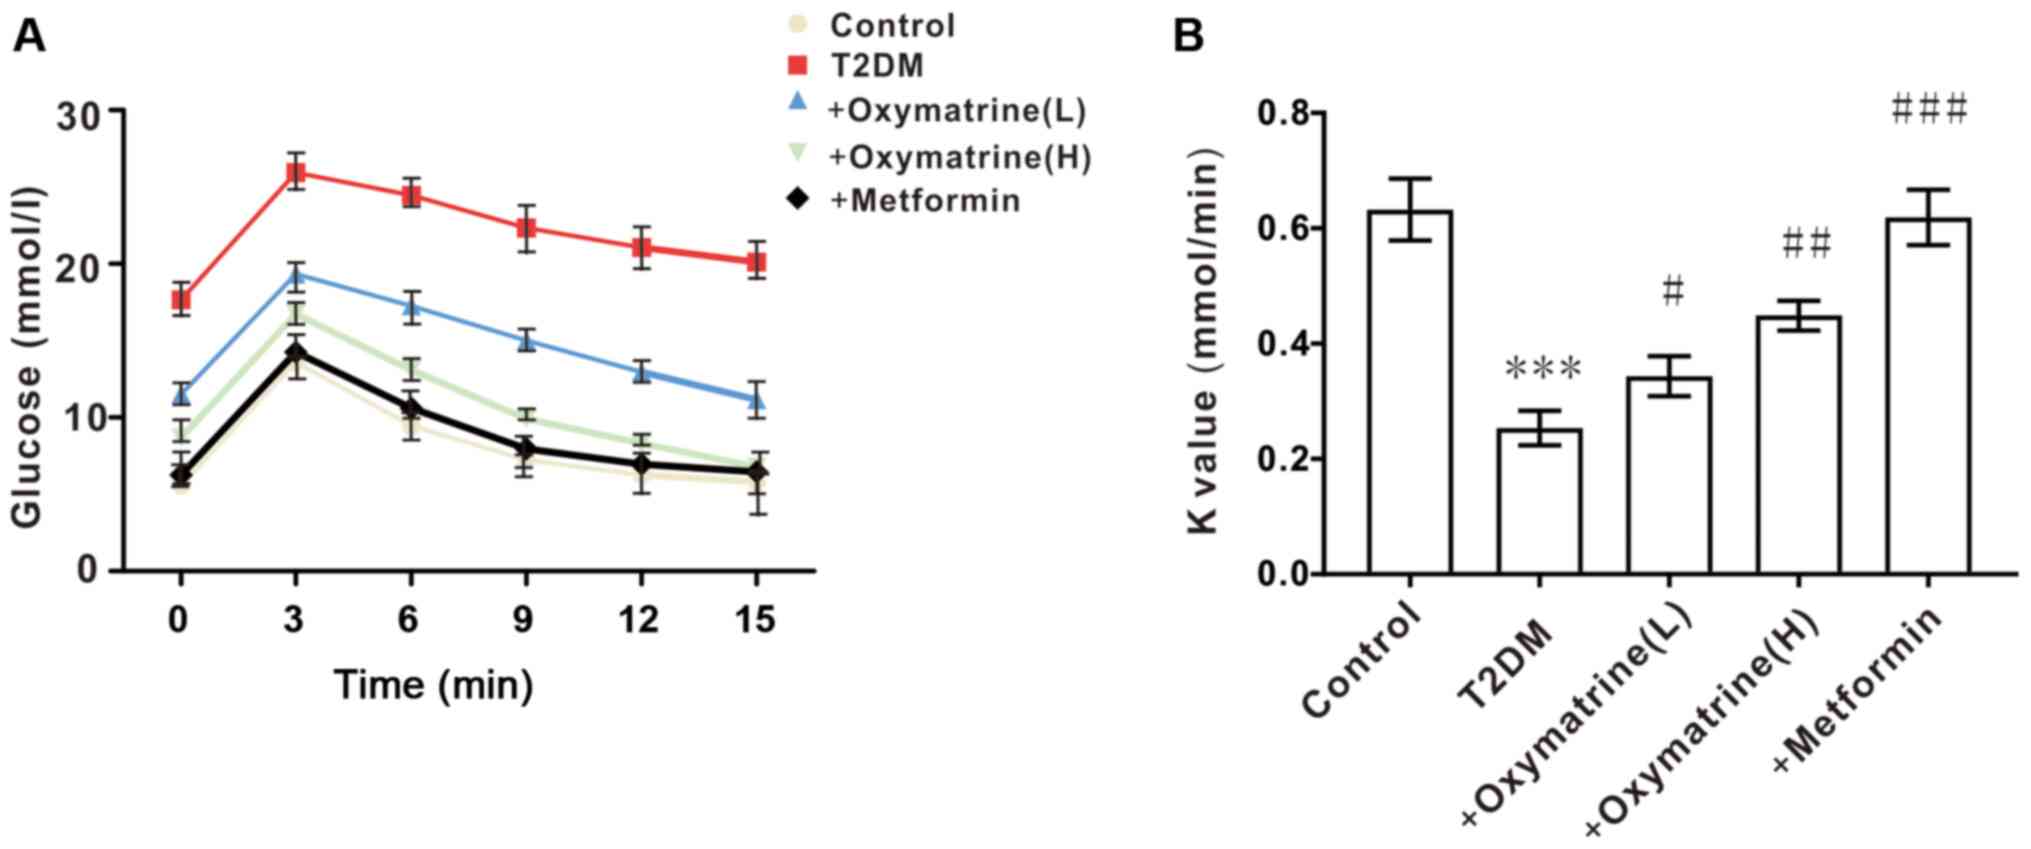
Considering that the levels of blood glucose are
closely associated with insulin activity, the next experiment was
designed to observe the role of oxymatrine in the insulin
sensitivity of T2DM rats. As shown in Fig. 3, compared with the control, the
insulin sensitivity of T2DM rats was significantly decreased, while
oxymatrine improved the insulin sensitivity of T2DM rats in a
dose-dependent manner. These results indicated that oxymatrine may
increase the sensitivity of insulin in T2DM rats.
Effects of oxymatrine on the
expression of AKT, PEPCK and G6Pase in the liver of T2DM rats
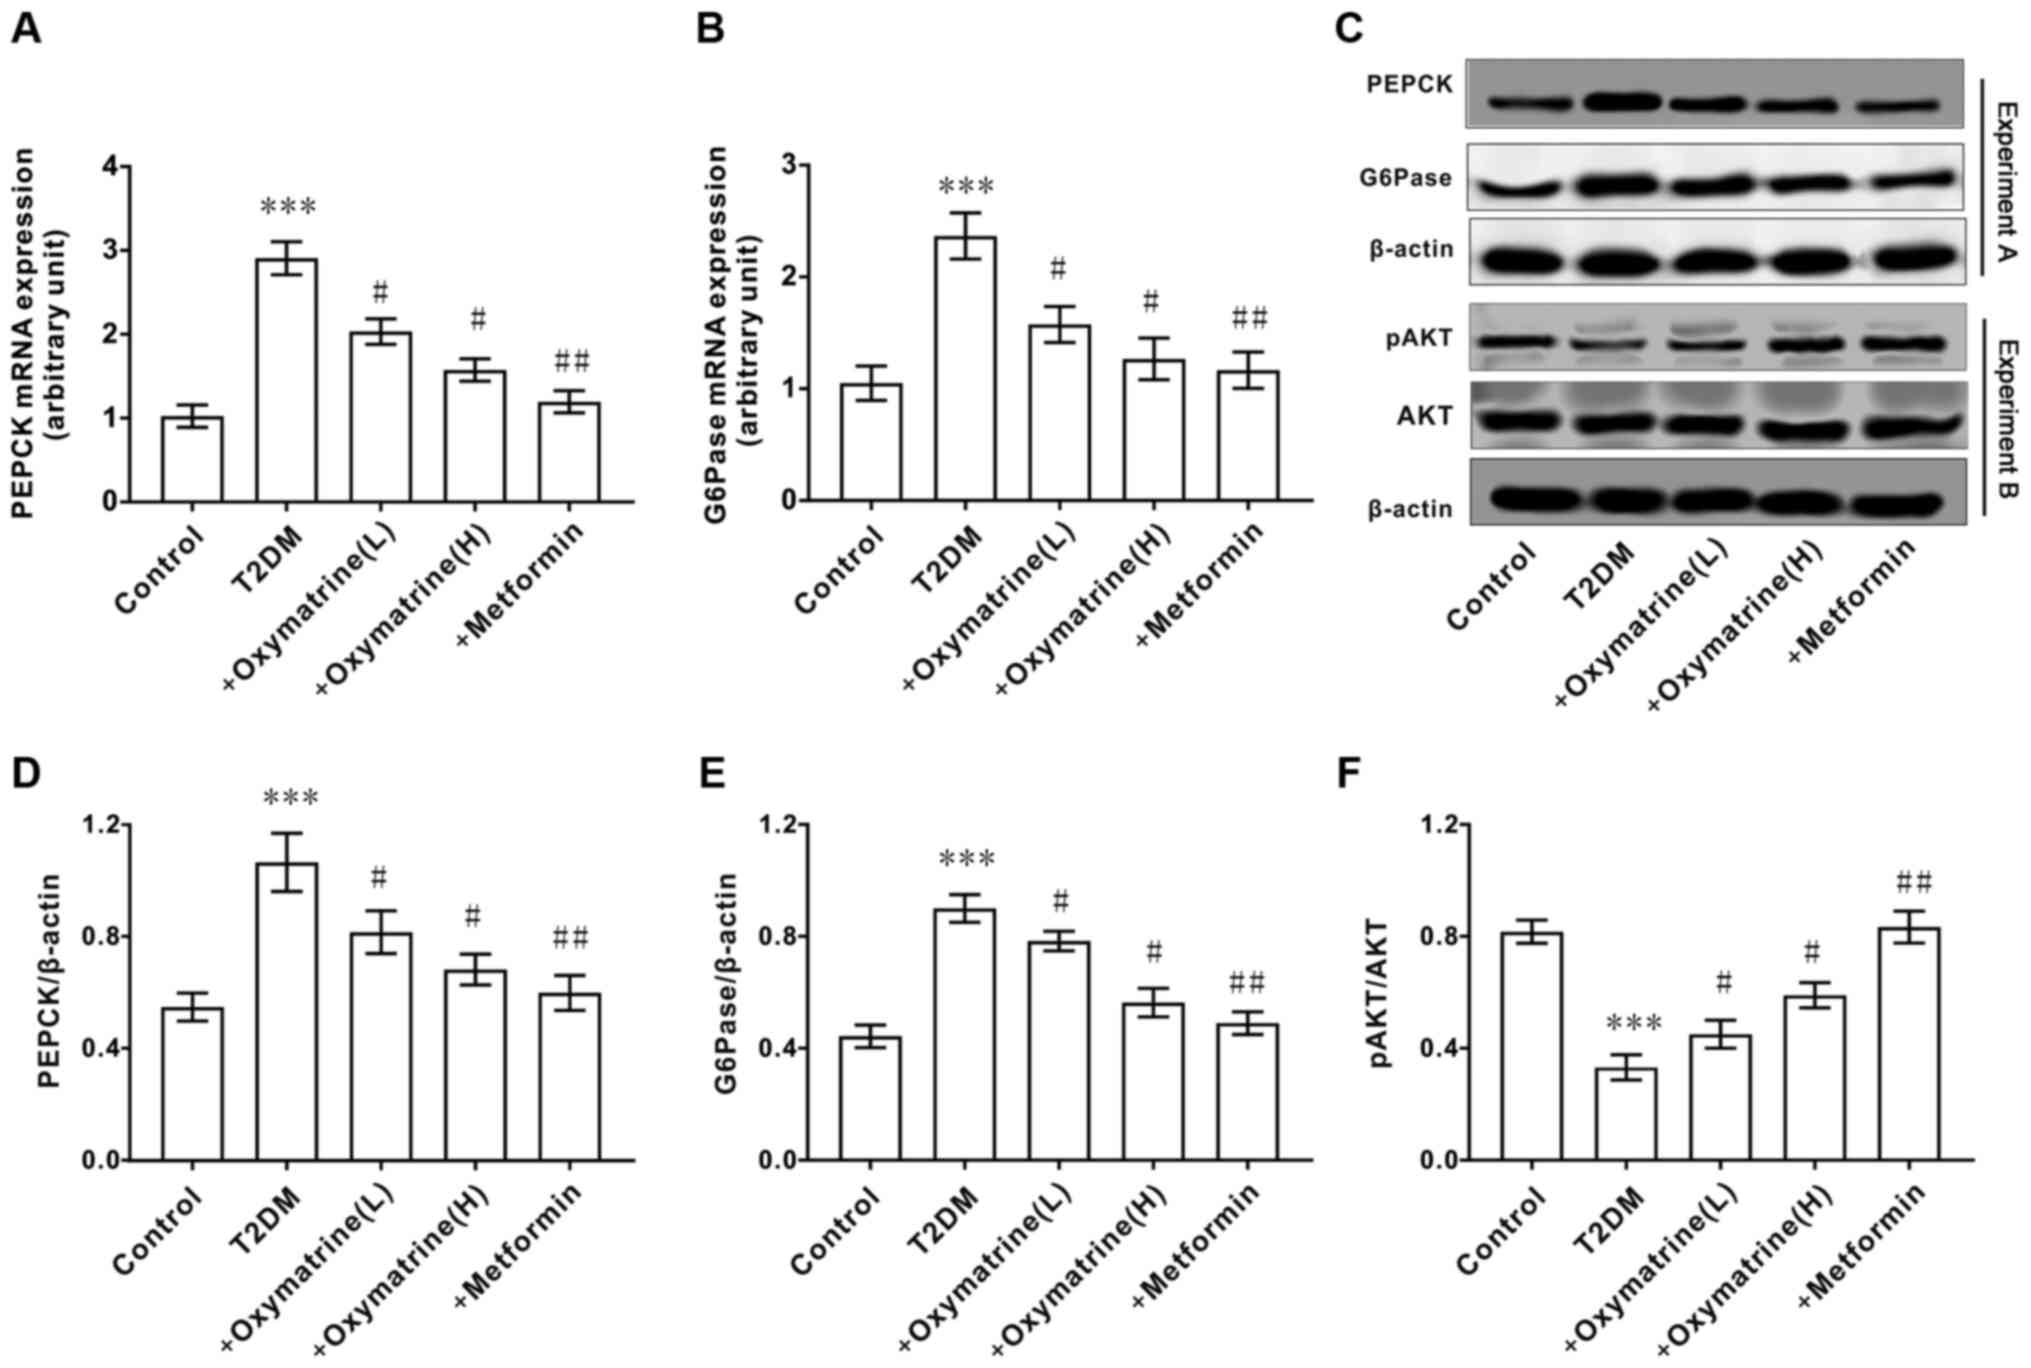
As the increase in hepatic gluconeogenesis caused by
insulin resistance is an important pathological characteristic of
T2DM, the effect of oxymatrine on the expression of PEPCK and
G6Pase in liver tissues was examined. As shown in Fig. 4A-E, compared with the control group,
the mRNA and protein levels of PEPCK and G6Pase in the livers of
T2DM rats were significantly increased, and oxymatrine
dose-dependently inhibited the expression of PEPCK and G6Pase. Due
to the important role of AKT in T2DM, the effect of oxymatrine on
the expression of AKT in the rat liver was examined. As shown in
Fig. 4C and F, compared with the control group, the
phosphorylation levels of AKT in the livers of T2DM rats was
significantly decreased, and oxymatrine dose-dependently increased
the phosphorylation levels of AKT in the livers of T2DM rats. These
results indicated that the protective function of oxymatrine in
T2DM rats may be associated with the inhibition of gluconeogenesis
and the regulation of AKT phosphorylation.
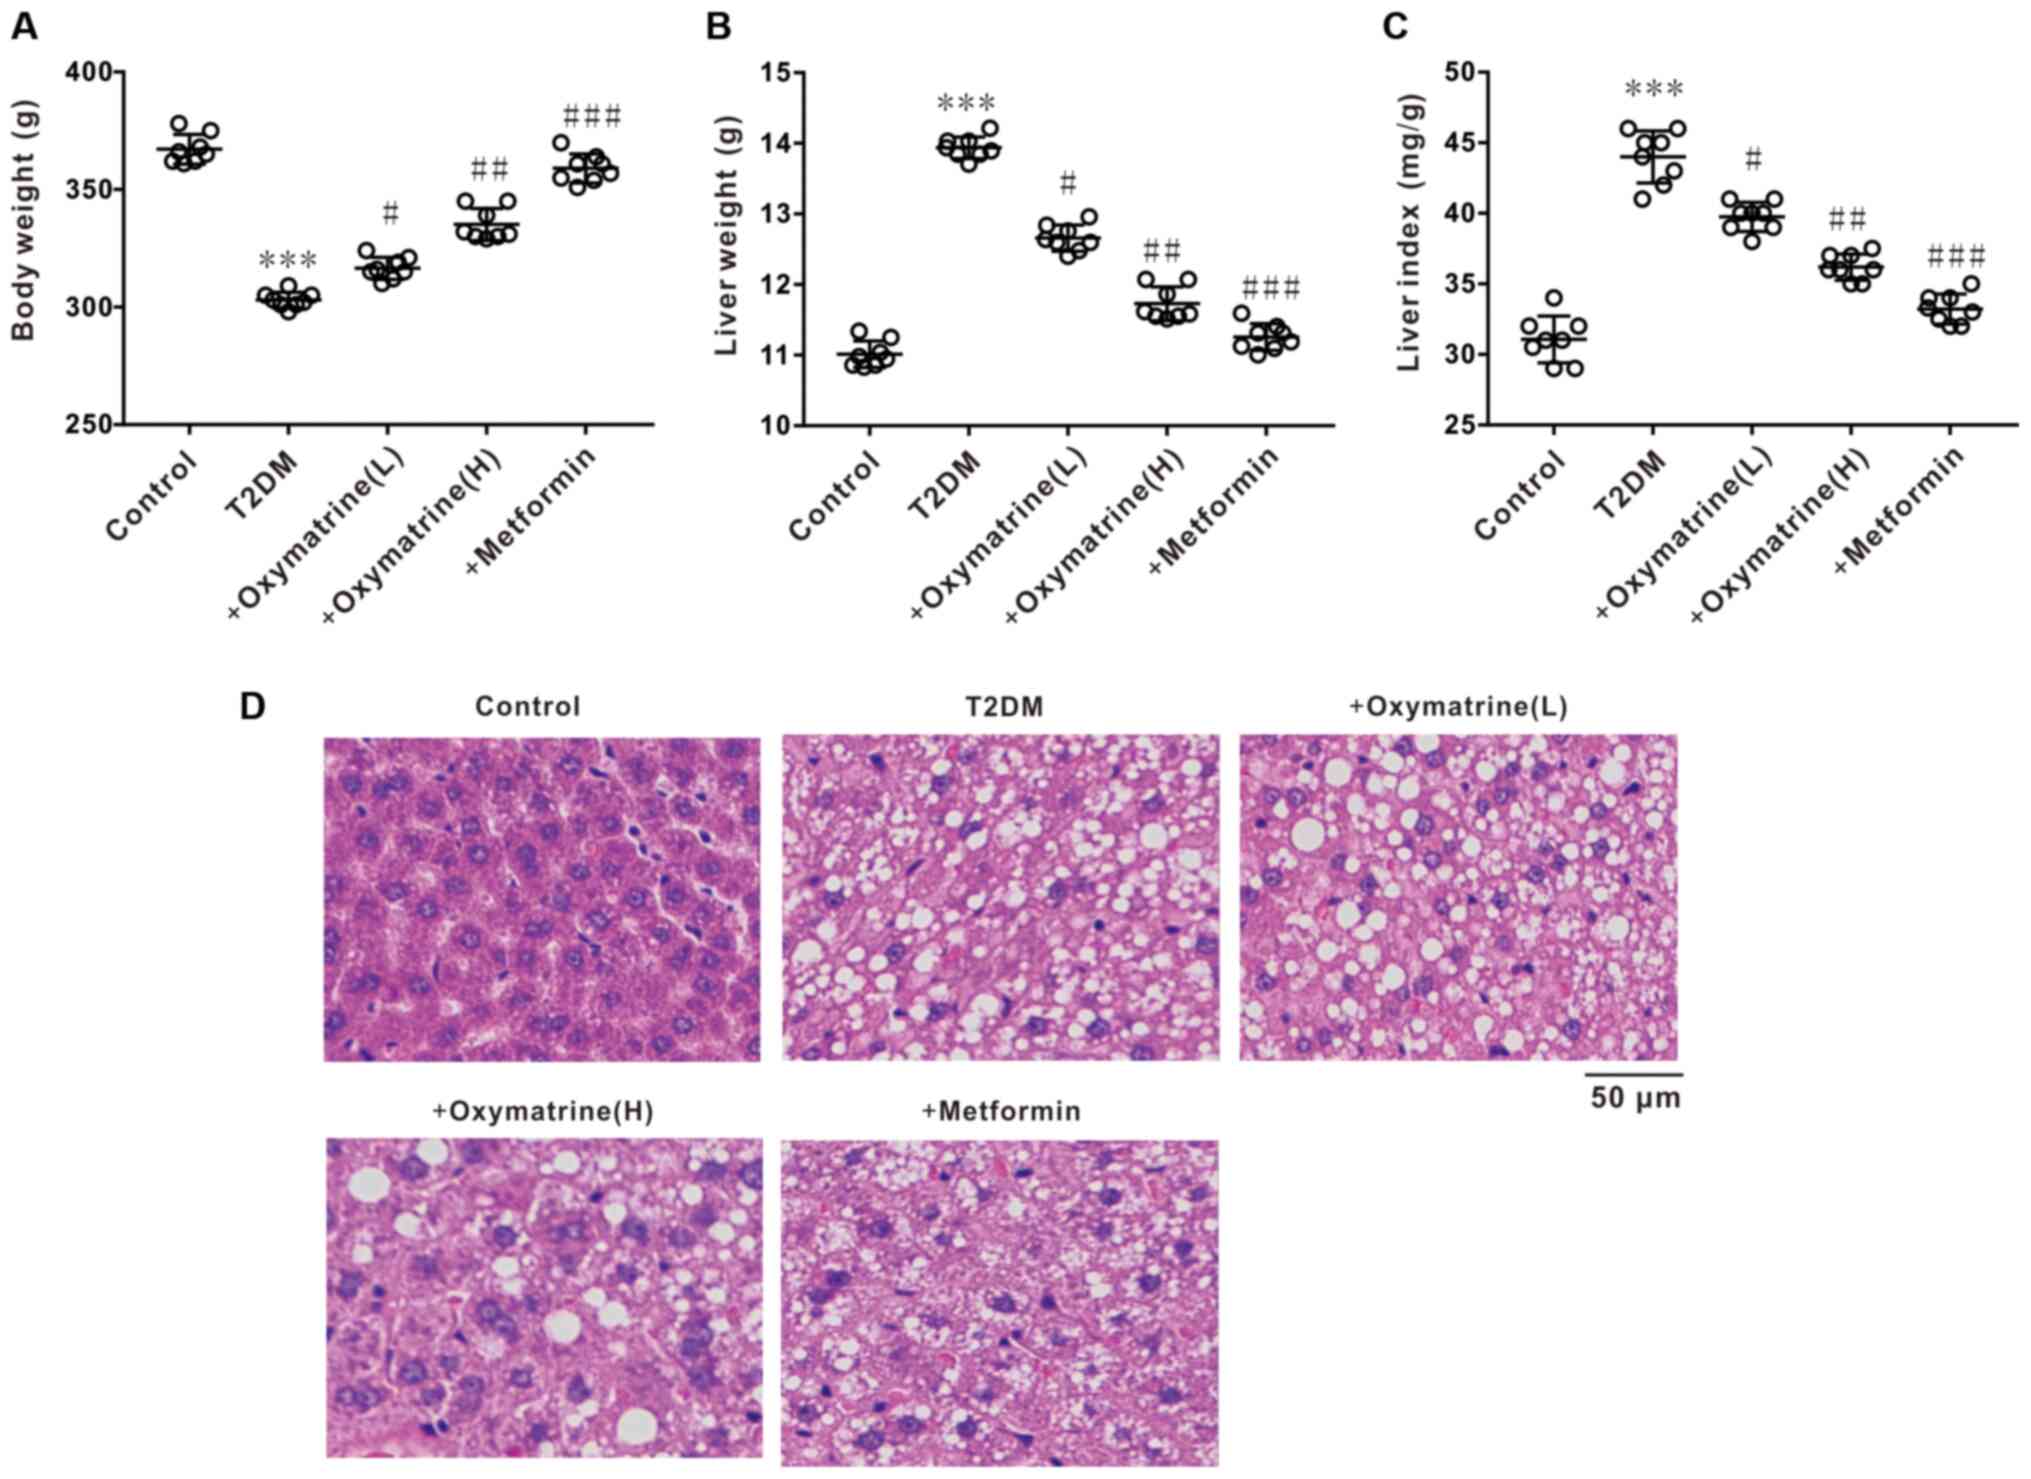
Effects of oxymatrine on liver index
and liver tissue morphology in T2DM rats
The next experiment was performed to observe the
effect of oxymatrine on the body weight, liver weight and liver
index of T2DM rats. The results revealed a notable decrease in body
weight, and an increase in liver weight and liver index of diabetic
rats, whereas oxymatrine dose-dependently reversed these phenomena
(Fig. 5A-C). HE staining revealed
that the liver tissues of diabetic rats exhibited obvious
morphological changes, such as karyopyknosis and fibrosis, whereas
oxymatrine dose-dependently prevented the morphological changes to
liver tissues (Fig. 5D). These
results indicated that oxymatrine exerts hepatoprotective
effects.
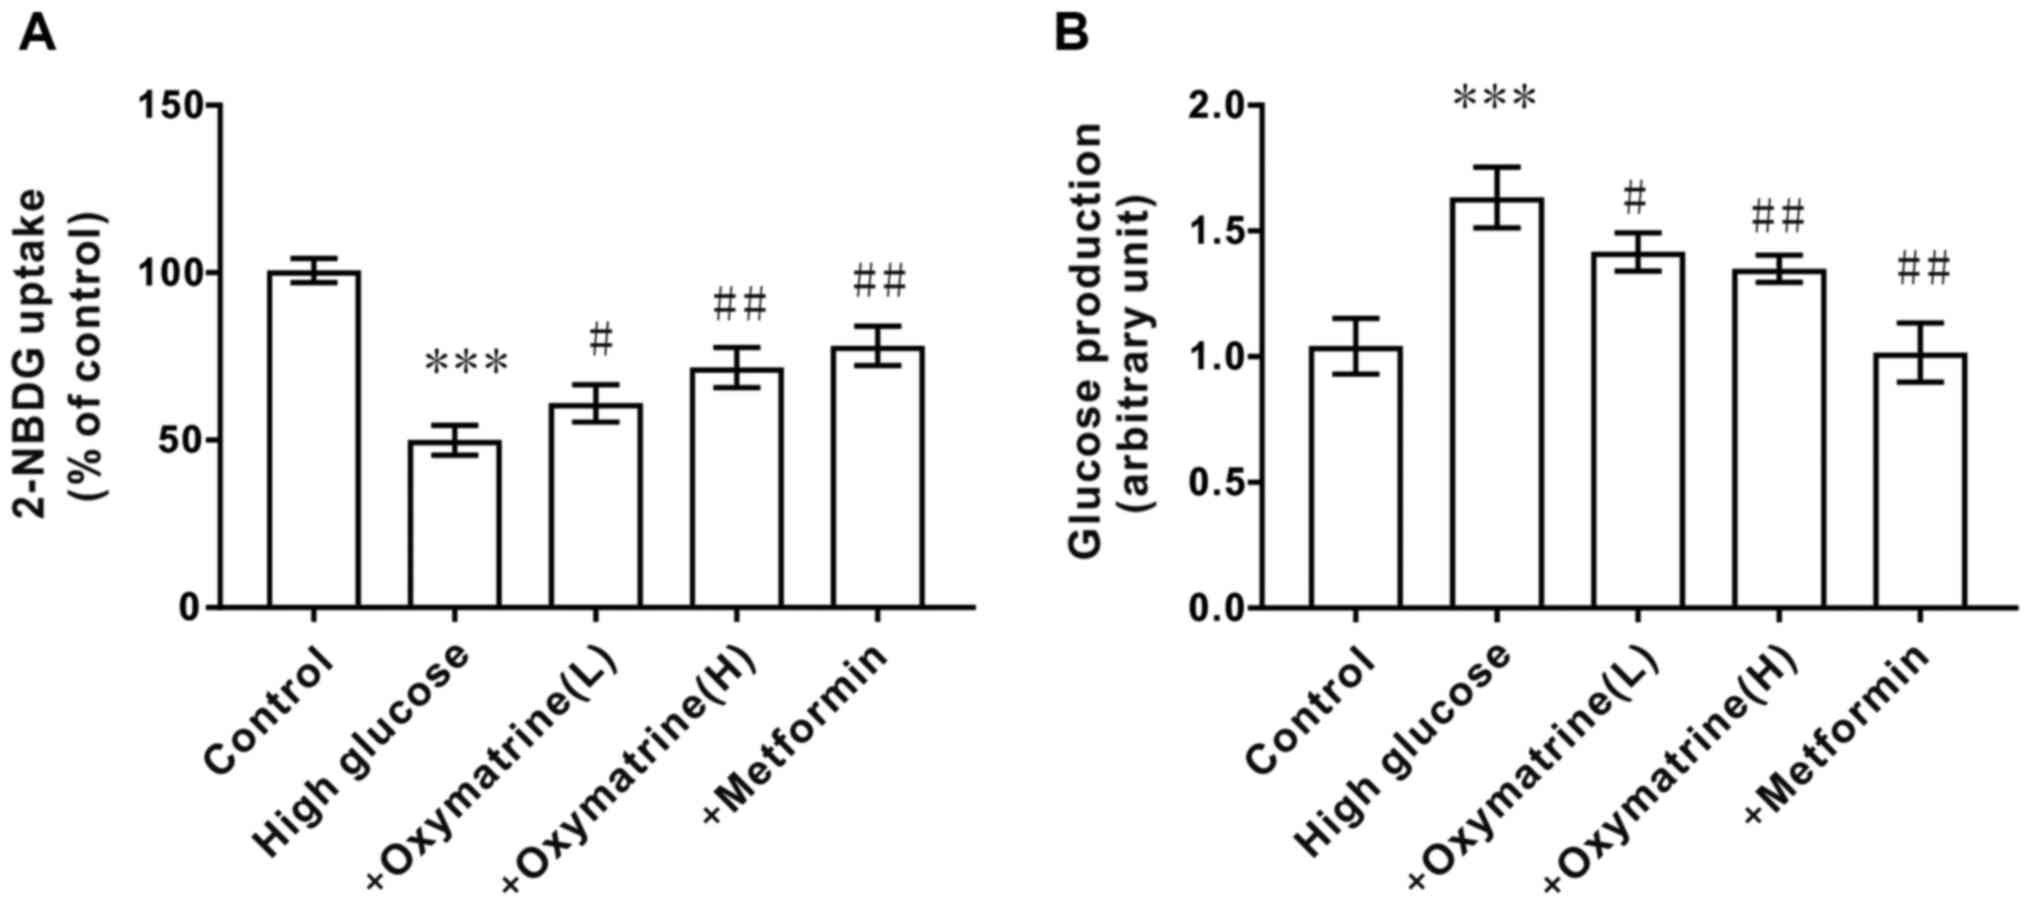
Effects of oxymatrine on glucose
production and uptake in HepG2 cells
To observe whether oxymatrine can inhibit the
gluconeogenesis of liver cells under diabetic conditions, HepG2
cells were treated with different concentrations of glucose and
oxymatrine. As shown in Fig. 6A, the
HepG2 cells treated with high glucose (55 mM) exhibited higher
glucose production activity when compared with the control cells,
and oxymatrine significantly reduced glucose production in a
dose-dependent manner (Fig. 6A). The
next experiment was designed to observe the effect of oxymatrine on
the glucose uptake ability of HepG2 cells. As shown in Fig. 6B, the HepG2 cells treated with high
glucose (55 mM) exhibited weaker glucose uptake ability, and
oxymatrine improved the glucose uptake ability of
high-glucose-treated cells in a dose-dependent manner. These data
suggested that oxymatrine may promote liver cell
gluconeogenesis.
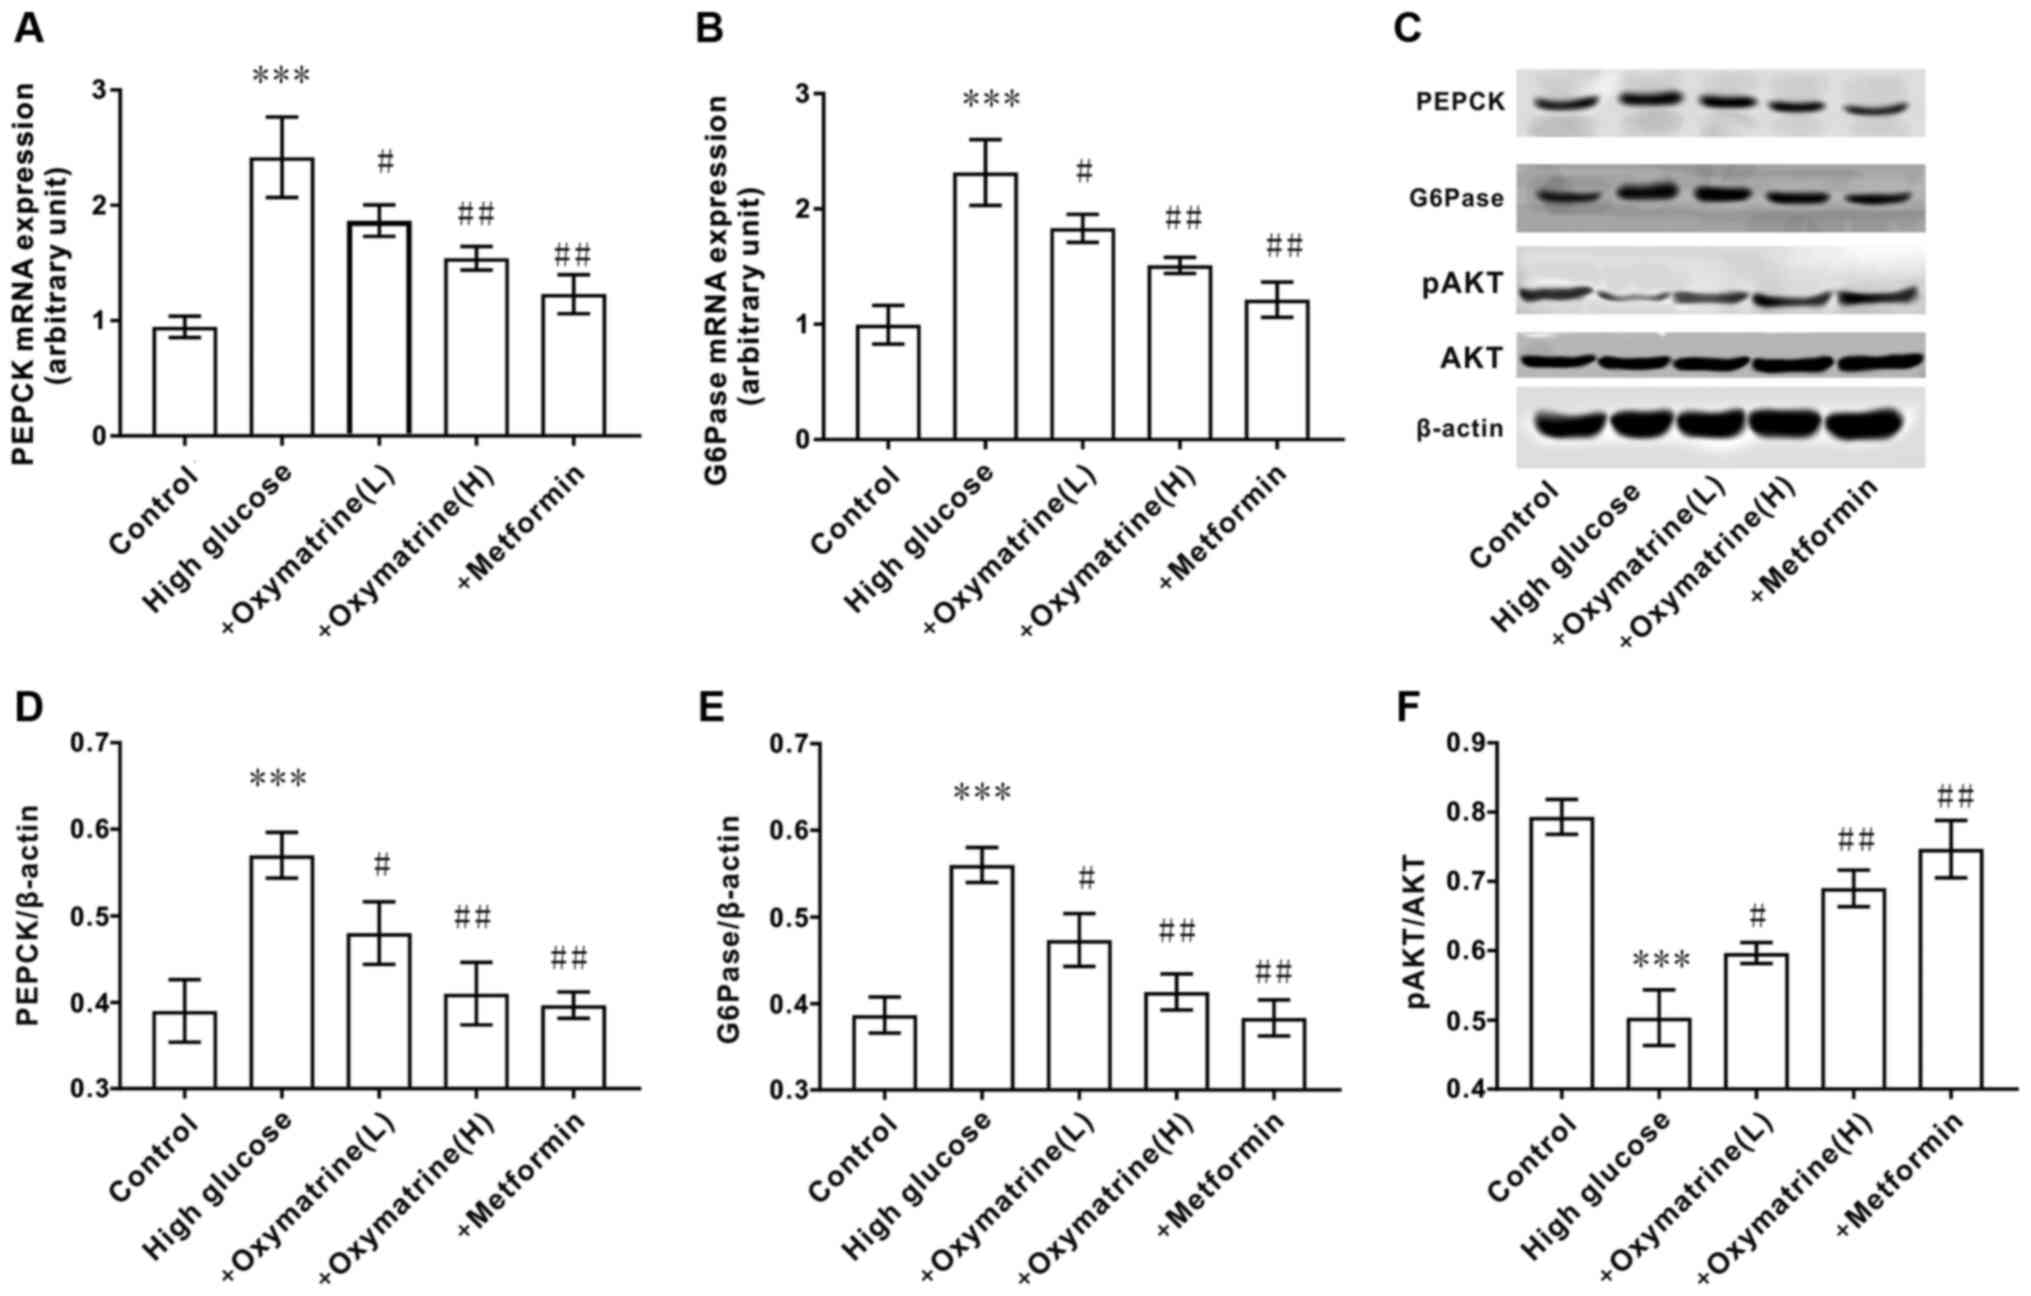
Effects of oxymatrine on the
expression of PEPCK and G6Pase and the phosphorylation of AKT in
HepG2 cells
The effect of oxymatrine on the expression of
gluconeogenesis-related genes in liver cells was next assessed. As
shown in Fig. 7, when compared with
the control cells, HepG2 cells treated with high glucose (55 mM)
exhibited significantly increased expression of PEPCK and G6Pase at
both the mRNA and protein levels, but decreased phosphorylation of
AKT. In accordance with the animal experimental results, oxymatrine
significantly inhibited the expression of PEPCK and G6Pase at both
the mRNA and protein level in HepG2 cells, and increased the
phosphorylation level of AKT. These data indicated that the effect
of oxymatrine on gluconeogenesis was associated with the regulation
of PEPCK and G6Pase expression, as well as AKT phosphorylation.
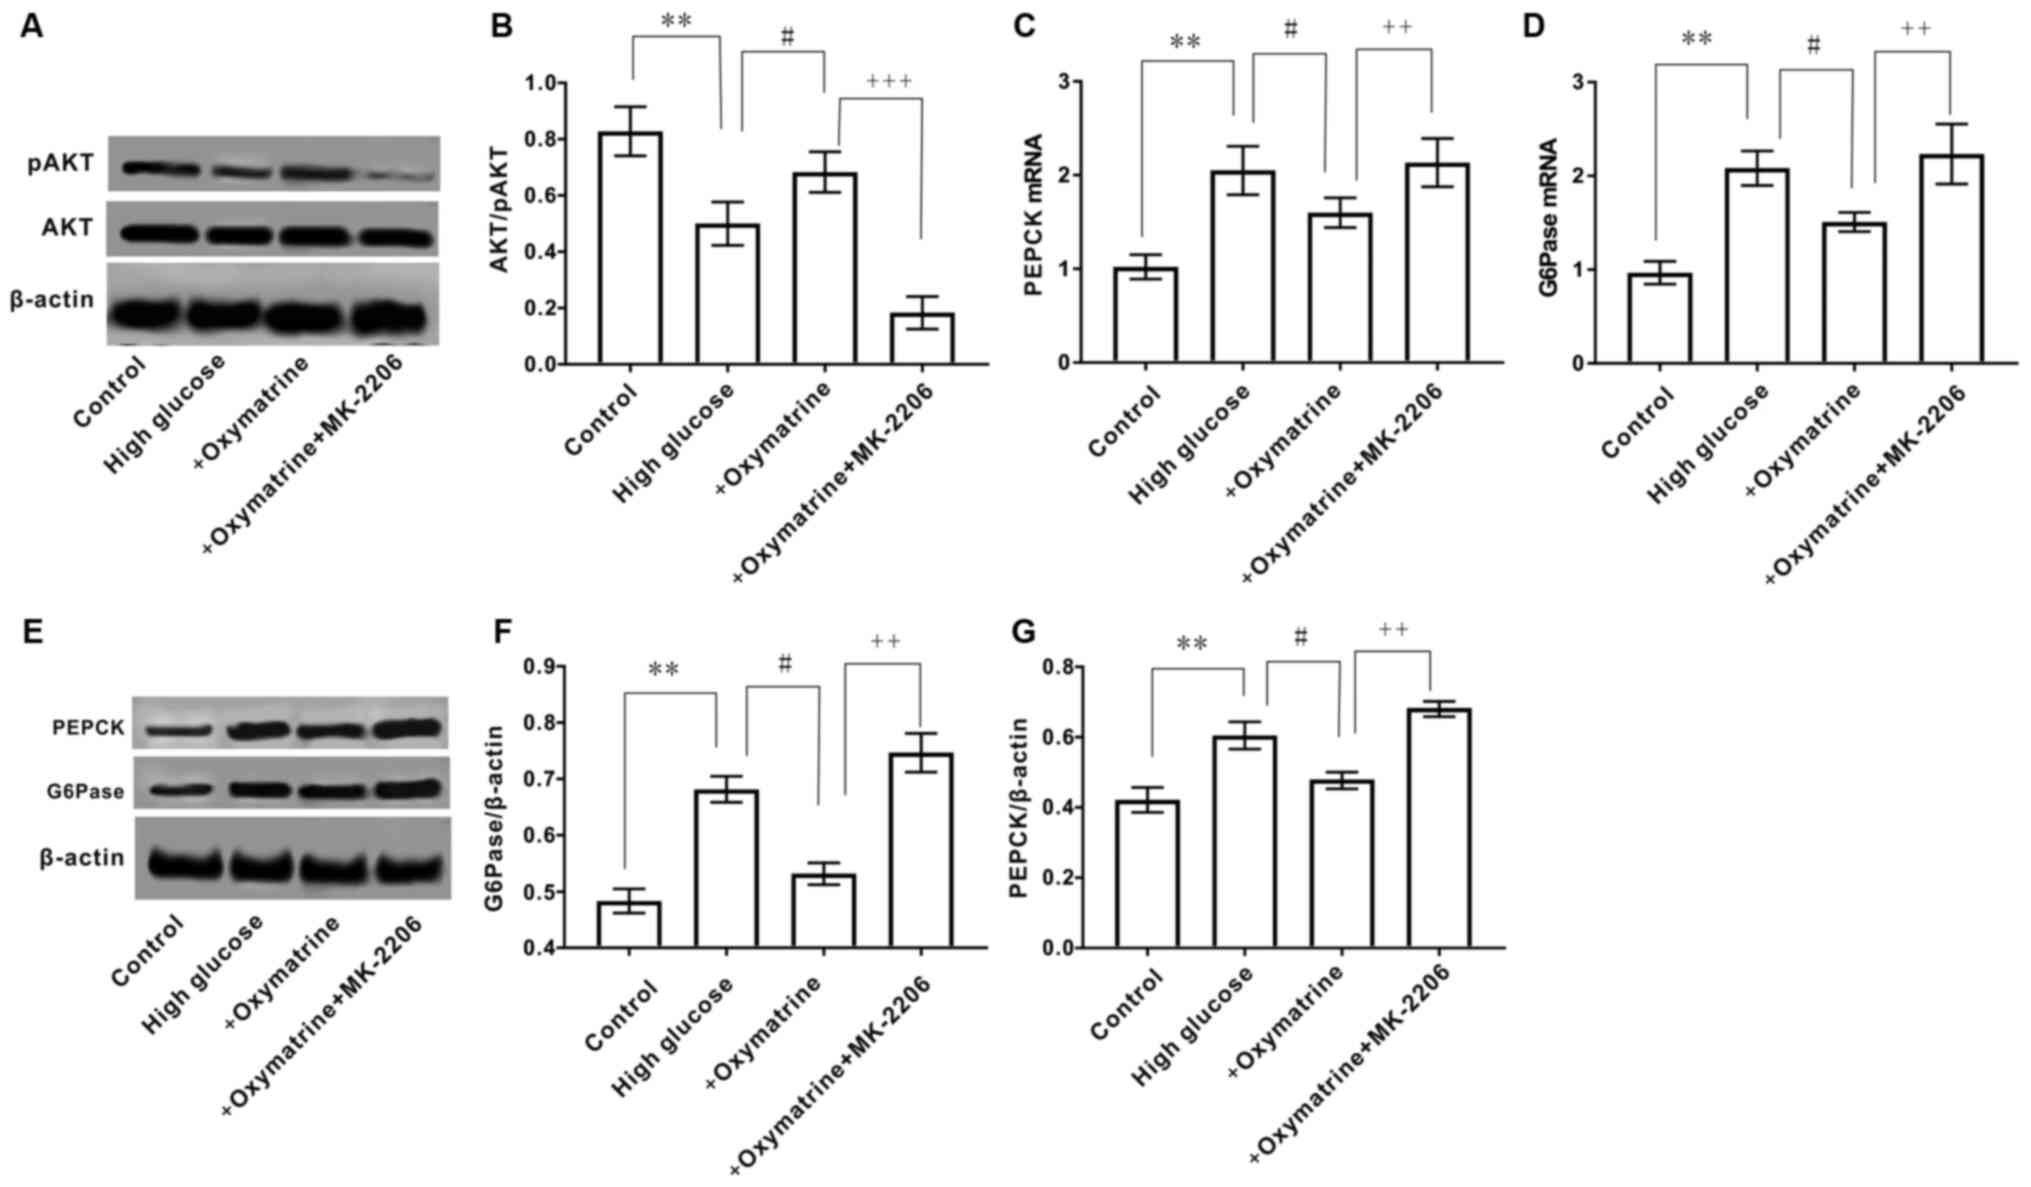
MK-2206 reverses the effect of
oxymatrine on the expression of PEPCK and G6Pase, and the
phosphorylation of AKT in HepG2 cells
To further observe whether the regulatory effect of
oxymatrine on the expression of PEPCK and G6Pase was associated
with the regulation of AKT phosphorylation, HepG2 cells were
treated with oxymatrine in combination with the AKT inhibitor,
MK-2206. As shown in Fig. 8A and
B, oxymatrine significantly
increased AKT phosphorylation in HepG2 cells subjected to high
glucose treatment, and this effect was reversed when the cells were
treated with MK-2206. The MK-2206 and oxymatrine combination
treatment significantly increased the expression of PEPCK and
G6Pase when compared with oxymatrine alone (Fig. 8C-G). These data suggested that the
effect of oxymatrine on the expression of PEPCK and G6Pase was
associated with the regulation of AKT phosphorylation.
Discussion
The present study demonstrated that the rats fed
with a high-fat diet and injected with streptozotocin, or HepG2
cells treated with high concentrations of glucose, exhibited
reduced phosphorylation of AKT and high expression of PEPCK and
G6Pase, whereas oxymatrine dose-dependently reversed these
phenomena. It was also observed that the AKT inhibitor
significantly reversed the effect of oxymatrine on AKT
phosphorylation, and PEPCK and G6Pase expression in HepG2 cells.
This indicated that the inhibitory effect of oxymatrine against
gluconeogenesis was associated with the regulation of the
expression of PEPCK and G6Pase, which was at least partly
associated with the regulation of AKT phosphorylation in the liver
(Fig. S2).
AKT has an important function in insulin signaling,
and its dysfunction causes insulin resistance, which is a
characteristic of T2DM (6). AKT
participates in numerous biological functions in mammalians, such
as cell cycle regulation, cell survival, glucose metabolism,
protein synthesis and NO production, by phosphorylating its
downstream target genes (21).
However, activation of AKT itself is also regulated by several
factors, such as insulin-like growth factor and transforming growth
factor (21). The inactivation of
AKT is associated with the dephosphorylation of AKT phosphorylase,
PI3K, and is mediated by PTEN (21).
The present and previous studies found that the levels of AKT
phosphorylation in the liver of T2DM rats decreased significantly,
indicating that abnormal AKT expression is an important factor
implicated in the occurrence and development of T2DM (22-24).
Therefore, the AKT signaling pathway may serve an important role in
blood glucose homeostasis, and insulin/AKT signaling may represent
a potential target for T2DM therapy.
The liver is the primary site of gluconeogenesis,
which can convert non-sugar substances, such as glycerin, lactic
acid and glycogenic amino acids, into glucose. The process of
gluconeogenesis is regulated by a number of factors, such as the
regulation of glycogenic substrates, key enzymes and transcription
factors, amongst which, the regulation of gluconeogenesis
rate-limiting enzymes is particularly important (4). Pyruvate, as the key substrate of
gluconeogenesis, is converted to oxaloacetic acid by pyruvate
carboxylase and malate dehydrogenase, and then to
phosphoenolpyruvate by PEPCK; phosphoenolpyruvate undergoes
multiple chemical reactions and is converted to
fructose-1,6-diphosphate, which is further converted to
fructose-6-phosphate; fructose-6-phosphate is then converted into
glucose-6-phosphate and transported to the endoplasmic reticulum,
where it is converted into glucose under the action of G6Pase
(4). PEPCK and G6Pase are both key
and rate-limiting enzymes in gluconeogenesis, and this has been
confirmed by experiments in which PEPCK knockout mice lost the
ability to synthesize glucose using lactic acid, which adversely
affected survival, and G6Pase knockout mice exhibited symptoms such
as hyperlipidemia and lactic acid accumulation (25,26). The
regulation of PEPCK expression is a complex biological process.
PEPCK can be acetylated by histone acetylase P300 and then labeled
by ubiquitin and subjected to proteasome degradation, while Sirt2
can deacetylate PEPCK and increase its expression (27). In addition, the expression of PEPCK
and G6Pase may also be regulated by several transcription factors,
such as cAMP response element-binding protein (CREB), FoxO1 and
CCAAT enhancer-binding protein α/β (28-30).
Inhibition of the transcription activity of CREB significantly
decreased the expression of PEPCK and G6Pase, which was accompanied
by reduced glucose production (31).
Moreover, it was reported that the expression of CREB and FoxO1 may
be regulated by the AKT signaling pathway and the expression of
PEPCK and G6Pase may be associated with AKT phosphorylation
deficiency (32,33). Consistently, the present study
demonstrated that AKT phosphorylation in the liver of T2DM rats was
significantly decreased, while the expression of PEPCK and G6Pase
was significantly increased, which was accompanied by an increase
in blood glucose concentration. The results demonstrated that when
AKT phosphorylation was dysregulated, the key enzymes of
gluconeogenesis, PEPCK and G6Pase, were upregulated, and
gluconeogenesis was significantly enhanced in the livers of T2DM
rats.
In view of the important role of insulin resistance
and gluconeogenesis in the occurrence and development of T2DM,
inhibiting insulin resistance and gluconeogenesis may prove to be
valuable methods for prevention and therapy of T2DM. However, some
of the drugs currently used for treatment of T2DM are not specific,
for example, rosiglitazone and metformin, and drug resistance
usually develops after long-term use (34). Therefore, novel drugs for T2DM are
urgently required. China has a long history of research and
application of Chinese herbal medicines (12,35).
Screening out the effective components related to insulin
resistance and gluconeogenesis in herbal medicines that exhibit
beneficial effects against insulin, may be an effective method for
identifying novel drugs for T2DM therapy (12). It was previously reported that
oxymatrine can protect obese rats from injury by reducing the
triglyceride and total cholesterol levels, and increasing serum
insulin content (35). In addition,
oxymatrine can increase the synthesis of glycogen (including liver
and muscle glycogen) and the expression levels of glucose
transporter 4(35). Our previous
study found that oxymatrine protects diabetic rats from insulin
resistance through the regulation of phosphorylation of AKT
(18). These results suggest that
the function of oxymatrine in protecting diabetic rats from
hyperglycemia may be associated with insulin resistance and
gluconeogenesis. Of note, a clinical trial performed by Yu et
al (36) demonstrated that the
administration of oxymatrine in combination with metformin was
beneficial for diabetic patients by inhibiting the symptoms of
insulin resistance. The present study demonstrated that oxymatrine
exerted protective effects in T2DM rats by improving insulin
sensitivity and reducing the blood glucose levels. The underlying
mechanism involved the regulation of the expression of PEPCK,
G6Pase and AKT in the liver, which suggests that oxymatrine may be
a novel candidate drug for T2DM therapy. However, one limitation of
the present study was the use of only male rats for the
experiments, as the possible differences in oxymatrine action
according to sex could not be evaluated. Therefore, further studies
are required to address these issues.
In conclusion, to the best of our knowledge, the
present study was the first to demonstrate that the effect of
oxymatrine against gluconeogenesis was associated with the
regulation of PEPCK and G6Pase expression in the liver, and that
its effects were at least partly mediated via regulation of AKT
phosphorylation.
Supplementary Material
Chemical structure of oxymatrine.
Schematic of the interaction between
AKT and PEPCK and G6Pase. PEPCK, phosphoenolpyruvate carboxykinase;
G6Pase, glucose-6-phosphatase.
Acknowledgements
Not applicable.
Funding
This work was supported by HuNan Provincial Science &
Technology Department (grant nos. 2020JJ5384 and 2020JJ4442); HuNan
Health Commission (grant no. C20200350), and ChangSha Science &
Technology Bureau (grant no. kq1801126).
Availability of data and materials
The dataset used and/or analyzed during the present
study are available from the corresponding author on reasonable
request.
Authors' contributions
YXZ, HQH, MLZ, TML and LM performed the experiments.
LCD, LM and MDSAS contributed to the data analysis and manuscript
drafting. GLS and ZBY contributed to the design of the experiments
and drafting of the manuscript. All authors have read and approved
the manuscript. YXZ and ZBY confirmed the authenticity of all the
raw data.
Ethics approval and consent to
participate
The study was performed in accordance with the
National Research Council (US) Committee guidelines for the care
and use of experimental animals and was approved by the Veterinary
Animal Care and use Committee of Hunan Normal University (approval
no. 2019111).
Patient consent for publication
Not applicable.
Competing interests
The authors declare that they have no competing
interests.
References
|
1
|
American Diabetes Association. Diagnosis
and classification of diabetes mellitus. Diabetes Care. 37 (Suppl
1):S81–S90. 2014.PubMed/NCBI View Article : Google Scholar
|
|
2
|
Ma RCW: Epidemiology of diabetes and
diabetic complications in China. Diabetologia. 61:1249–1260.
2018.PubMed/NCBI View Article : Google Scholar
|
|
3
|
Wu Y, Ding Y, Tanaka Y and Zhang W: Risk
factors contributing to type 2 diabetes and recent advances in the
treatment and prevention. Int J Med Sci. 11:1185–1200.
2014.PubMed/NCBI View Article : Google Scholar
|
|
4
|
Rines AK, Sharabi K, Tavares CD and
Puigserver P: Targeting hepatic glucose metabolism in the treatment
of type 2 diabetes. Nat Rev Drug Discov. 15:786–804.
2016.PubMed/NCBI View Article : Google Scholar
|
|
5
|
Rui L: Energy metabolism in the liver.
Compr Physiol. 4:177–197. 2014.PubMed/NCBI View Article : Google Scholar
|
|
6
|
De Meyts P: The insulin receptor and its
signal transduction network. [Updated 2016 Apr 27]. In. Feingold
KR, Anawalt B, Boyce A, Chrousos G, de Herder WW, Dhatariya K,
Dungan K, Grossman A, Hershman JM, Hofland J, et al (eds).
Endotext (Internet). South Dartmouth (MA), MDText.com, Inc.,
2000. https://www.ncbi.nlm.nih.gov/books/NBK378978. Accessed
April 27, 2016.
|
|
7
|
Muoio DM and Newgard CB: Mechanisms of
disease: Molecular and metabolic mechanisms of insulin resistance
and beta-cell failure in type 2 diabetes. Nat Rev Mol Cell Biol.
9:193–205. 2008.PubMed/NCBI View
Article : Google Scholar
|
|
8
|
Fan H, Li L, Zhang X, Liu Y, Yang C, Yang
Y and Yin J: Oxymatrine downregulates TLR4, TLR2, MyD88 and
NF-kappa B and protects rat brains against focal ischemia.
Mediators Inflamm. 2009(704706)2009.PubMed/NCBI View Article : Google Scholar
|
|
9
|
Liu Y, Xu Y, Ji W, Li X, Sun B, Gao Q and
Su C: Anti-tumor activities of matrine and oxymatrine: Literature
review. Tumour Biol. 35:5111–5119. 2014.PubMed/NCBI View Article : Google Scholar
|
|
10
|
Chen XS, Wang GJ, Cai X, Yu HY and Hu YP:
Inhibition of hepatitis B virus by oxymatrine in vivo. World J
Gastroenterol. 7:49–52. 2001.PubMed/NCBI View Article : Google Scholar
|
|
11
|
Wu XL, Zeng WZ, Jiang MD, Qin JP and Xu H:
Effect of oxymatrine on the TGF beta-Smad signaling pathway in rats
with CCl4-induced hepatic fibrosis. World J Gastroenterol.
14:2100–2105. 2008.PubMed/NCBI View Article : Google Scholar
|
|
12
|
Chan SM and Ye JM: Strategies for the
discovery and development of anti-diabetic drugs from the natural
products of traditional medicines. J Pharm Pharm Sci. 16:207–216.
2013.PubMed/NCBI View
Article : Google Scholar
|
|
13
|
Wang L, Li X, Zhang Y, Huang Y, Zhang Y
and Ma Q: Oxymatrine ameliorates diabetes-induced aortic
endothelial dysfunction via the regulation of eNOS and NOX4. J Cell
Biochem, Nov 19, 2018 (Epub ahead of print). doi:
10.1002/jcb.28006.
|
|
14
|
Wang SB and Jia JP: Oxymatrine attenuates
diabetes-associated cognitive deficits in rats. Acta Pharmacol Sin.
35:331–338. 2014.PubMed/NCBI View Article : Google Scholar
|
|
15
|
Lu ML, Xiang XH and Xia SH: Potential
signaling pathways involved in the clinical application of
oxymatrine. Phytother Res. 30:1104–1112. 2016.PubMed/NCBI View
Article : Google Scholar
|
|
16
|
National Research Council (US) Committee
for the update of the Guide for the Care and Use of Laboratory
Animals: Guide for the Care and Use of Laboratory Animals. 8th
edition. National Academicals Press, Washington, DC, 2011.
|
|
17
|
Ma C, Yu H, Xiao Y and Wang H: Momordica
charantia extracts ameliorate insulin resistance by regulating the
expression of SOCS-3 and JNK in type 2 diabetes mellitus rats.
Pharm Biol. 55:2170–2177. 2017.PubMed/NCBI View Article : Google Scholar
|
|
18
|
Zuo ML, Wang AP, Tian Y, Mao L, Song GL
and Yang ZB: Oxymatrine ameliorates insulin resistance in rats with
type 2 diabetes by regulating the expression of KSRP, PETN, and AKT
in the liver. J Cell Biochem. 120:16185–16194. 2019.PubMed/NCBI View Article : Google Scholar
|
|
19
|
Yoshioka K, Saito M, Oh KB, Nemoto Y,
Matsuoka H, Natsume M and Abe H: Intracellular fate of 2-NBDG, a
fluorescent probe for glucose uptake activity, in Escherichia coli
cells. Biosci Biotechnol Biochem. 60:1899–1901. 1996.PubMed/NCBI View Article : Google Scholar
|
|
20
|
Livak KJ and Schmittgen TD: Analysis of
relative gene expression data using real-time quantitative PCR and
the 2(-Delta Delta C(T)) method. Methods. 25:402–408.
2001.PubMed/NCBI View Article : Google Scholar
|
|
21
|
Zdychova J and Komers R: Emerging role of
AKT kinase/protein kinase B signaling in pathophysiology of
diabetes and its complications. Physiol Res. 54:1–16.
2005.PubMed/NCBI
|
|
22
|
Huang X, Liu G, Guo J and Su Z: The
PI3K/AKT pathway in obesity and type 2 diabetes. Int J Biol Sci.
14:1483–1496. 2018.PubMed/NCBI View Article : Google Scholar
|
|
23
|
Vinayagam A, Kulkarni MM, Sopko R, Sun X,
Hu Y, Nand A, Villalta C, Moghimi A, Yang X, Mohr SE, et al: An
integrative analysis of the InR/PI3K/AKT network identifies the
dynamic response to insulin signaling. Cell Rep. 16:3062–3074.
2016.PubMed/NCBI View Article : Google Scholar
|
|
24
|
Bathina S and Das UN: Dysregulation of
PI3K-AKT-mTOR pathway in brain of streptozotocin-induced type 2
diabetes mellitus in Wistar rats. Lipids Health Dis.
17(168)2018.PubMed/NCBI View Article : Google Scholar
|
|
25
|
Burgess SC, Hausler N, Merritt M, Jeffrey
FM, Storey C, Milde A, Koshy S, Lindner J, Magnuson MA, Malloy CR
and Sherry AD: Impaired tricarboxylic acid cycle activity in mouse
livers lacking cytosolic phosphoenolpyruvate carboxykinase. J Biol
Chem. 279:48941–48949. 2004.PubMed/NCBI View Article : Google Scholar
|
|
26
|
Mutel E, Abdul-Wahed A, Ramamonjisoa N,
Stefanutti A, Houberdon I, Cavassila S, Pilleul F, Beuf O,
Gautier-Stein A, Penhoat A, et al: Targeted deletion of liver
glucose-6 phosphatase mimics glycogen storage disease type l a
including development of multiple adenomas. J Hepatol. 54:529–537.
2011.PubMed/NCBI View Article : Google Scholar
|
|
27
|
Jiang WJ, Wang S, Xiao M, Lin Y, Zhou L,
Lei Q, Xiong Y, Guan KL and Zhao S: Acetylation regulates
gluconeogenesis by promoting PEPCK1 degradation via recruiting the
UBR5 ubiquitin ligase. Mol Cell. 43:33–44. 2011.PubMed/NCBI View Article : Google Scholar
|
|
28
|
Koo SH, Flechner L, Qi L, Zhang X,
Screaton RA, Jeffries S, Hedrick S, Xu W, Boussouar F, Brindle P,
et al: The CREB coactivator TORC2 is a key regulator of fasting
glucose metabolism. Nature. 437:1109–1111. 2005.PubMed/NCBI View Article : Google Scholar
|
|
29
|
Matsumoto M, Pocai A, Rossetti L, Depinho
RA and Accili D: Impaired regulmion of hepatic glucose production
in mice lacking the forkhead transcription factor Foxol in liver.
Cell Metab. 6:208–216. 2007.PubMed/NCBI View Article : Google Scholar
|
|
30
|
Zhou XY, Shibusawa N, Naik K, Porras D,
Temple K, Ou H, Kaihara K, Roe MW, Brady MJ and Wondisford FE:
Insulin regulation of hepatic gluconeogenesis through
phosphorylation of CREB-binding protein. Nat Med. l0:633–637.
2004.PubMed/NCBI View
Article : Google Scholar
|
|
31
|
Erion DM, Ignatova ID, Yonemitsu S, Nagai
Y, Chatterjee P, Weismann D, Hsiao JJ, Zhang D, 1wasaki T, Stark R,
et al: Prevention of hepatic steatosis and hepatic insulin
resistance by knockdown of cAMP response element-binding protein.
Cell Metab. 10:499–506. 2009.PubMed/NCBI View Article : Google Scholar
|
|
32
|
Cypess AM, Zhang H, Schulz TJ, Huang TL,
Espinoza DO, Kristiansen K, Unterman TG and Tseng YH: Insulin/IGF-I
regulation of necdin and brown adipocyte differentiation via CREB-
and FoxO1-associated pathways. Endocrinology. 152:3680–3689.
2011.PubMed/NCBI View Article : Google Scholar
|
|
33
|
Li X, Monks B, Ge Q and Birnbaum MJ:
AKT/PKB regulates hepatic metabolism by directly inhibiting
PGC-1alpha transcription coactivator. Nature. 447:1012–1016.
2007.PubMed/NCBI View Article : Google Scholar
|
|
34
|
Abdul-Ghani MA, Puckett C, Triplitt C,
Maggs D, Adams J, Cersosimo E and DeFronzo RA: Initial combination
therapy with metformin, pioglitazone and exenatide is more
effective than sequential add-on therapy in subjects with new-onset
diabetes. Results from the efficacy and durability of initial
combination therapy for Type 2 Diabetes (EDICT): A randomized
trial. Diabetes Obes Metab. 17:268–275. 2015.PubMed/NCBI View Article : Google Scholar
|
|
35
|
Guo C, Zhang C, Li L, Wang Z, Xiao W and
Yang Z: Hypoglycemic and hypolipidemic effects of oxymatrine in
high-fat diet and streptozotocin-induced diabetic rats.
Phytomedicine. 21:807–814. 2014.PubMed/NCBI View Article : Google Scholar
|
|
36
|
Yu XH, Zhu JS and Gu GM: Clinical effect
of oxymatrine combined with metformin on insulin resistance and
serum TNF-α in patients with non-alcoholic fatty liver. Chin J Clin
Hepatol. 23:195. 2007.
|