Introduction
Epilepsy affects 1 in 150 children under the age of
10 and is the most common chronic pediatric neurological condition
(1). Unfortunately, antiepileptic
drugs alone fail in 1/3 of these children (2,3).
Severe developmental delay from alterations in brain network
development results from poorly controlled epilepsy (4,5).
Early, accurate diagnosis of epilepsy to address these irreversible
developmental impacts is a top research priority for two large
international forums (6,7). Current paradigms suggest referral to
university centers if the epilepsy becomes drug resistant, that is
continued seizures despite a trial of two medications (2). Unfortunately, there is a mean 19-20
year time from seizure onset to epilepsy surgery referral for
eligible patients to these centers, partly due to a difficulty in
accurate identification of epilepsy, especially without an obvious
lesion or generalized motor component (7-9).
Both international forums proposed referral paradigm changes either
at initial diagnosis or after the first anti-epileptic drug fails
(6,7). If adopted, this paradigm change could
be quite costly as several children will achieve seizure freedom
with one medication (10).
Therefore, early and accurate diagnosis is absolutely necessary to
prevent over or underdiagnosis of epilepsy, particularly in
non-lesional or partial seizure cases.
Resting-state functional MRI (rfMRI) has been
evaluated as a potential non-invasive method to aid in the
diagnosis of epilepsy (11). RfMRI
sequences are obtained concurrently with anatomic MRI, as part of
the standard epilepsy workup at certain centers. Consequently,
there is no increased cost or need for additional procedures.
However, concurrent rfMRI acquisition is currently not part of the
standard of care (12,13). The blood-oxygen-level dependent
(BOLD) signal acquired at rest in rfMRI is associated with resting
metabolic neuronal activity (14).
As such, resting-state networks (RSNs) can be constructed from the
rfMRI signal using temporal latency analysis (15,16).
Disturbances in RSNs are thought to be associated with epilepsy
(17-19).
Several other techniques can also be used to
construct RSNs. Broadly, they can be divided into two categories:
Hypothesis-driven and data-driven methods. Hypothesis-driven
methods, such as seed-based functional connectivity, correlate the
BOLD signal obtained from the region of interest (ROI) with voxels
throughout the brain to construct the RSN (14). Alternatively, data-driven methods,
such as independent component analysis (ICA), do not require ROIs
to construct RSNs (20). Previous
studies have shown that ICA-generated RSNs can be used to analyze
epilepsy networks (21-23).
However, ICA is extremely time consuming, as each component map
must be individually inspected and categorized, thus decreasing the
potential ease and utility of this method.
As a result, rfMRI latency analysis, a novel
data-driven method of RSN construction, has continued to gain
popularity in the field. RfMRI latency analysis correlates the
timing of the global mean BOLD signal with the BOLD signal in
voxels throughout the brain. This allows for the characterization
of multiple brain networks by linking areas based on differences in
their BOLD signal timing relative to the global mean BOLD signal
(15,16). In our previous studies it has been
shown that areas with significantly early or late BOLD signal
timing compared to the global mean BOLD signal correlate with
epilepsy lateralization, and this can be used to accurately
lateralize temporal lobe and extratemporal lobe pediatric epilepsy
(11,24). However, this method of thresholding
rfMRI latency z-scores was unable to explain laterality in every
case.
Machine learning has become a popular technique to
explore complex relationships in data (25-27).
Supervised machine learning algorithms, such as Support Vector
Machines (SVM), Random Forest and Extreme Gradient Boosting
(XGBoost), use inputs (x) to define the relationship [f(x)] between
said input and an output (y) (28,29).
Algorithms then apply the learned relationship to predict outputs
from new inputs. For example, SVM creates linear hyperplanes, or
the most optimal decision boundary, in feature space to separate
class categories of interest. SVM utilizes kernels to transform a
non-linearly separable input feature space into higher dimensions
enabling the linear separation of the input data (22). On the other hand, Random Forest and
XGBoost are ensemble algorithms that classify examples by voting on
multiple decision trees created by bagging or boosting,
respectively (30,31). Boosting is a method where later
iterations of the machine learning model improve upon errors made
in prior models. Bagging combines predictions from several machine
learning models to increase model accuracy. In both cases, weak
learners, or decision trees that correctly predict an average of
50% of cases, are combined. The majority decision from the combined
decision trees is then used to make the final prediction. Models
generated from multiple weak learners as described, create stronger
learners that can make more accurate predictions from complex
datasets (32).
The aim of the present study was to compare the
performance of SVM, Random Forest, and XGBoost machine learning
classifier algorithms trained with novel rfMRI latency data to
distinguish children with epilepsy from healthy controls.
Materials and methods
Data source and study population
RfMRI and anatomical MRI were obtained following
University of Texas at Houston Institutional Review Board (IRB)
approval for an anonymized retrospective review of 78 patients with
refractory extratemporal epilepsy from a prospectively registered
clinical database from the Washington University School of
Medicine/St. Louis Children's Hospital (SLCH, n=73) and McGovern
Medical School at UTHealth/Children's Memorial Hermann Hospital
(CMHH, n=5) between September 2006 and September 2018. RfMRI and
anatomical MRI were obtained for 585 healthy control patients with
IRB approval from the multi-institutional ADHD 200 dataset of the
1000 Functional Connectomes Project, International Neuroimaging
Data-Sharing Initiative hosted by the Neuroimaging Tools and
Resources Collaboratory (33).
Informed consent was obtained as required by each
database and institution for each subject. Informed consent was
provided by the patients' caregivers or by capable patients aged
>18 years old for the 78 prospectively registered patients with
refractory epilepsy at SLCH and CMHH. Informed consent for healthy
control patients were obtained by each study site in the ADHD
dataset (34). The imaging
parameters for each scanner used to obtain rfMRI data at each of
the participating institutions are shown in Table SI.
Patients with refractory epilepsy analyzed in the
present study were referred to SLCH or CMHH for evaluation of
surgical management. Inclusion criteria required a diagnosis of
refractory epilepsy as determined by multidisciplinary epilepsy
conference at either SLCH or CMHH and available structural and
rfMRI. Patients who did not meet these requirements or whose rfMRI
data did not pass quality control were excluded. Quality control
consisted of visual inspection of pre-processed rfMRI data. Poorly
registered rfMRI to standard atlas volumetric sequences were
excluded. In the rfMRI processing section below, further
explanations are provided. After application of these criteria, the
final study population included 322 subjects. A total of 63
patients with refractory epilepsy were included (age range, 4-25
years; median age, 17 years old; 41 males and 22 females). A total
of 259 healthy controls were included in this study (age range,
7-26 years; median age, 10 years old; 25 males and 134 females).
Analysis of baseline characteristics of each cohort was performed.
A two-tailed Mann-Whitney U test was used to compare the mean age
of subjects within each cohort (epilepsy, n=63; healthy controls,
n=259; α=0.05). A χ2 test of independence was used to
evaluate for an association between sex and epilepsy (epilepsy,
n=63; healthy control, n=259; α=0.05).
RfMRI processing
MRI data was processed using the Washington
University in St. Louis (Wustl) 4dfpSuite Linux scripts developed
by the Washington University School of Medicine Neuroimaging
Laboratory, as described previously (11). Briefly, the BOLD signal sequences of
the healthy controls and patients with epilepsy were registered to
standard atlas volumetric sequences. Images were processed with
spatial smoothing using a Gaussian kernel of 6 mm full width
half-maximum, temporal low-pass filtering >0.1 Hz, regression of
nuisance waveforms and zero-meaning of each voxel time course.
Frames with excessive motion were excluded from analysis (16). Latency maps for patients in both the
healthy control and epilepsy groups were generated by computing a
voxel-wise lagged cross-covariance function. Lag or latency, is the
value at which the absolute cross-covariance function displays
extremum between the processed rfMRI BOLD signal and the
whole-brain mean signal from parabolic interpolation (16). The normal distributions of the
epilepsy and healthy control average latency maps were analyzed for
overlap in 36 seed regions (35,36).
Feature engineering
Healthy control and epilepsy latency z-score maps
were created by voxel-wise z-score calculation using whole-brain
healthy control mean and standard deviation latency maps as well as
Fslmaths in the FSL suite version 6.0 (11,37).
Principal component analysis (PCA) was performed to create features
to train the machine learning algorithms. Observations or features
in PCA were orthogonally transformed into linearly uncorrelated
principal components (PCs) that represented the variability of the
training dataset. PCA was performed in order to reduce the
dimensions of the original feature space, in an attempt to mitigate
‘the curse of dimensionality’, which states that the predictive
power of a classifier initially increases with the use of more
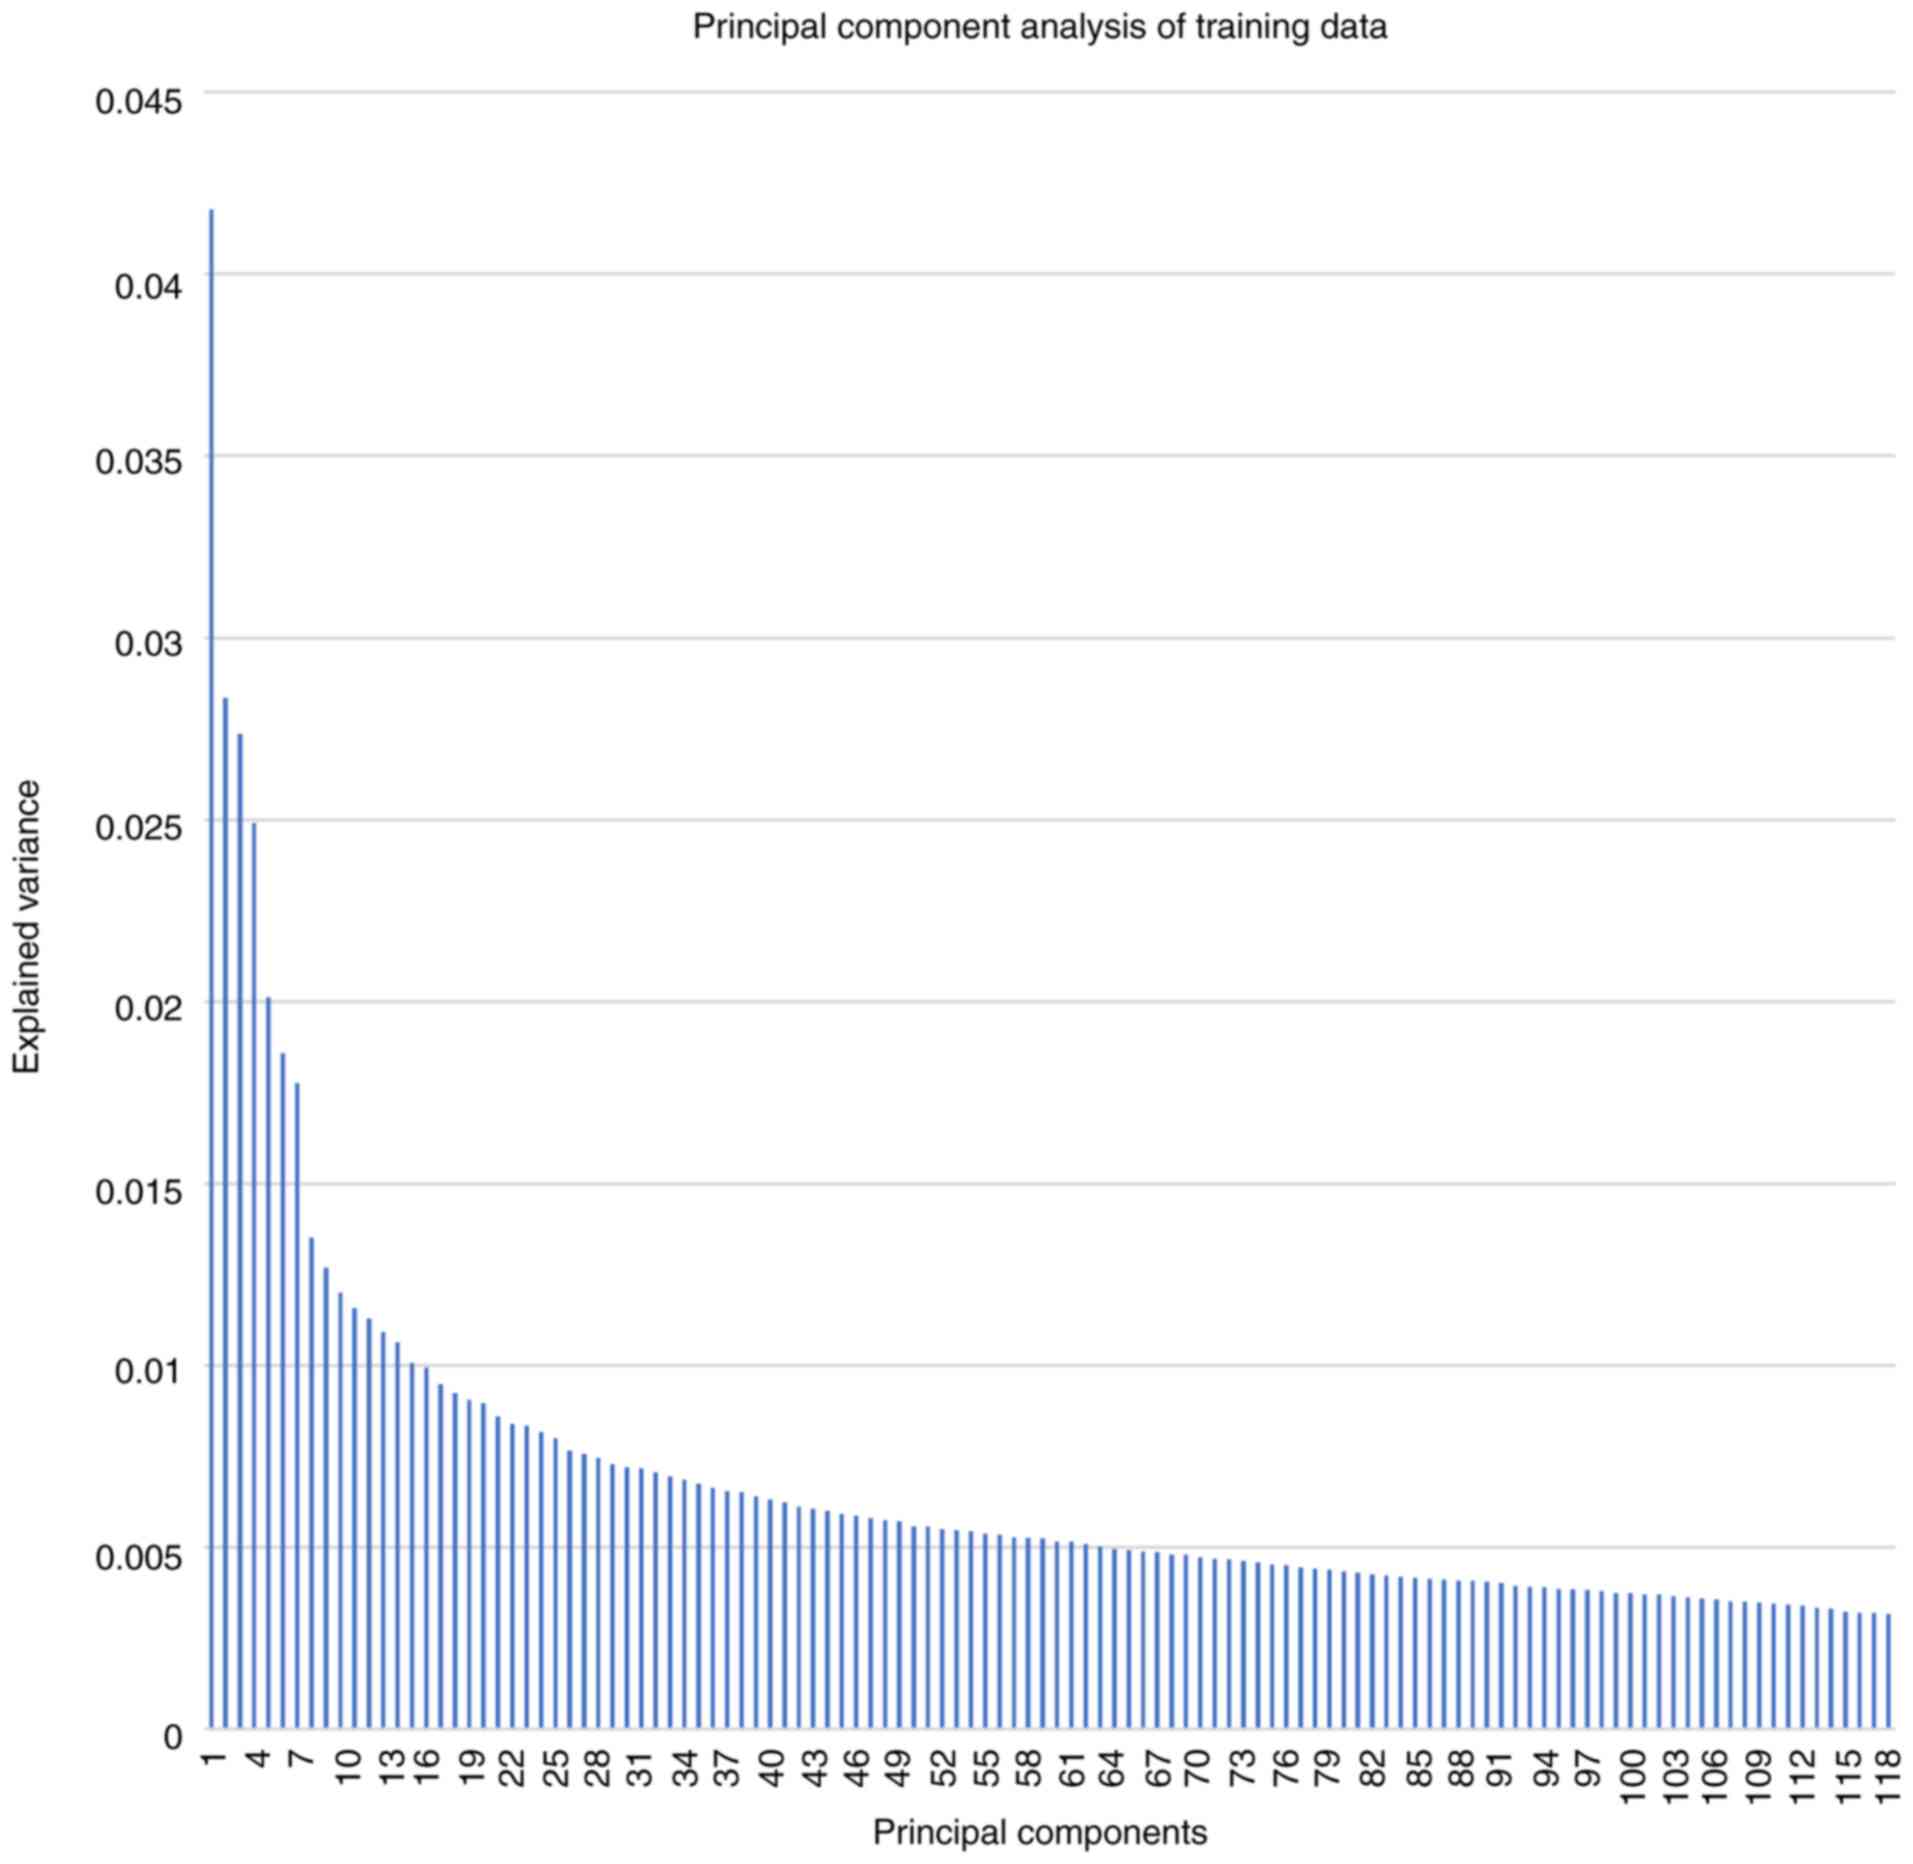
dimensions, but at some point, it begins to decrease (38). In the PCA transformations used in
the present study, the original 47,950 non-zero voxel
high-dimensional feature space was reduced to 118 PCs, which
explained 80% of the variance, and 80% explanation of the variance
was chosen, with 118 principal components (PCs), to balance
adequately reducing the dimensions of the feature space, whilst
also maintaining enough features to allow for effective model
classification of epilepsy from healthy controls. The
high-dimensional voxel feature space for the training dataset
containing both epilepsy and healthy controls was transformed with
PCA using the parameters stated above. The same transformation was
then also applied to the validation and test datasets to generate
comparable datasets with 118 PCs for the models to evaluate.
XGBoost training, validation and
testing data partitioning
All epilepsy patient disease labels were defined by
a consensus at multidisciplinary pediatric epilepsy conferences.
Healthy individuals' labels were determined by each participating
institution in the ADHD 200 dataset (34). The data was randomized and
stratified using a random seed to create a reproducible
pseudorandomized dataset with a constant ratio of patients with
epilepsy and control individuals. The data was partitioned into
train, validation and test datasets at a standard ratio of 60:20:20
with Python 3.6.3 sklearn.model_selection (version 0.20.3,
scikit-learn.org/stable/modules/cross_validation.html#cross-validation)
train_test_split function. R (version 3.5.0), e1071 (version
1.6-8), randomForest (version 4.6-14) and xgboost (version 0.71.2)
libraries were used for SVM, Random Forest, and XGBoost algorithms,
respectively (30,31,39-41).
The training data features and labels were used to train SVM,
Random Forest and XGBoost algorithms.
Hyperparameter optimization
Hyperparameters for SVM, Random Forest and XGBoost
were optimized to increase performance accuracy, area under the
receiver operating characteristics (ROC) curve (AUC), specificity
and F1-score. Grid searching was used to minimize overfitting of
the models. Hyperparameters affected training, model creation,
model performance and generalizability. Each hyperparameter was
explored at a range and step size to assess model performance in a
grid-wise manner within a multidimensional hyperparameter space as
shown in Table I, Table II, Table III for SVM, Random Forest and
XGBoost algorithms, respectively. Optimal hyperparameters were
chosen based on overall model performance using validation data.
Then, SVM, Random Forest and XGBoost models with optimal
hyperparameters were evaluated with unseen test data to assess
model generalizability.
 | Table IDescription of the Support Vector
Machine algorithm hyperparameters and ranges. |
Table I
Description of the Support Vector
Machine algorithm hyperparameters and ranges.
| Hyperparameter | Definition |
Significance/usefulness | Grid search
range |
|---|
| Kernel | Computes the dot
product in the feature space using vectors from the original
space. | Kernel function
allows low-cost operations in the original feature space without
computing the coordinates of the data in a higher dimension
space. | Linear, radial
basis function, polynomial, and sigmoid |
| γ | Distance of
influence a single training point has on a kernel. | For high or low γ,
training points closer or further from the decision boundary are
weighted, respectively. Improved fitting of the decision boundary
to training cases increases model generalizability. | 0.1, 1, 10 and
100 |
| Cost | ‘C’-constant of
regularization term from the Lagrange formulation (53). | Controls the
trade-off between misclassifications and margin width. Simplified
decision boundary for low or high cost to improve point
classification. | 0.1, 1, 10, 100 and
1,000 |
| Table IIDescription of the Random Forest
algorithm hyperparameters and ranges. |
Table II
Description of the Random Forest
algorithm hyperparameters and ranges.
| Hyperparameter | Definition |
Significance/usefulness | Grid search
range |
|---|
| Mtry | Number of variables
available for splitting at each tree node | The predictor
variable/feature importance estimates are affected by mtry. | 1, 2, 3, 4, 5, 6,
7, 8, 9, 10, 11, 12, 13, 14, and 15 |
| Ntree | Number of trees to
be grown in the model | Number of trees
affects model variance. Increasing ntree increases performance and
computation cost. | 1, 5, 10, 100, 500,
1,000, 1,500, 2,000 and 2,500 |
| Table IIIDescription of the Extreme Gradient
Boosting algorithm hyperparameters and ranges. |
Table III
Description of the Extreme Gradient
Boosting algorithm hyperparameters and ranges.
| Hyperparameter | Definition |
Significance/usefulness | Grid search
range |
|---|
| ETA | ETA is the
shrinkage of the learning rate at each step | ETA prevents the
model from overfitting by scaling contribution of each tree. | From 0.01 to 1 at a
step size of 0.01 |
| Max Depth | Maximum depth of
each tree | Max depth affects
the complexity of each tree and the overfitting of the model.
Deeper trees can overfit the data. | 1, 2, 3, 4 and
5 |
| Minimum Child
Weight | The minimum weight
required in order to create a new node in each tree | Adjusting the value
can prevent overfitting and reduce the model complexity. | 1, 2, 3, 4 and
5 |
| γ | Minimum loss
reduction required to create a further partition on a tree's leaf
node | Increasing γ causes
the model to be more conservative. | 1, 2, 3, 4 and
5 |
| Nround | The number of
training rounds within the model | Increasing Nrounds
can reduce biases and variance in a model. | Varies depending on
model error/loss and 200 Nround early stopping |
Performance metrics
In the present study, the positive class represents
subjects with epilepsy and the negative class represents the
healthy controls. Mean accuracy, AUC, specificity and F1-score were
used to evaluate models and each metric carried equal weight.
F1-score was the harmonic mean between precision and recall
(sensitivity). A model with a high F1-score has both good positive
predictive power (precision) and good true positive rate
(sensitivity or recall) (42). The
F1 score was calculated as follows: F1 score=2x[(precision x
recall)/precision + recall)]. The model with the highest mean value
was then used to decide the optimal model overall, after evaluation
with the validation dataset.
Model selection
Algorithm hyperparameters were tuned by evaluating
trained models with validation data. For each algorithm (SVM,
Random Forest and XGBoost), the model with the highest accuracy,
AUC, specificity and F1-score determined by the mean was then
evaluated with unseen test data. Models with a specificity or
sensitivity of zero were eliminated. In addition to performance,
the generalizability of each model was evaluated with the final
unseen test data by taking the absolute value of the difference
between test and validation accuracy, AUC, sensitivity, specificity
and F1-score. After evaluating models with validation data, the
following SVM, Random Forest and XGBoost model hyperparameter
settings were selected for evaluation with test data: SVM: γ=1,
Cost=0.01, Kernel=Sigmoid; Random Forest: Mtry=12, Ntree=5.0;
XGBoost: ETA=0.61, Max Depth=2.0, γ=1.0, Minimum Child Weight=4.0,
Nround=11.0.
Results
The final study population (n=322) included 63
patients with epilepsy and 259 healthy controls. Baseline
characteristics and cohort analysis are shown in Table IV. Briefly, the epilepsy cohort
(n=63; age range, 4-25 years; 41 males and 22 females) consisted of
significantly more males than females (P=0.017) with a sex ratio of
1.86 males-to-females. The epilepsy cohort was also significantly
older than the healthy controls with a mean age of 14.5 years with
a standard deviation of 6.0 (P<0.00001). The healthy control
cohort (n=259; age range, 7-26 years; 125 males and 134 females)
included slightly more females than males with a sex ratio of 0.93
males-to-females. The healthy control cohort was significantly
younger than the epilepsy cohort with a mean age of 10.7 years and
a standard deviation of 2.6 (P<0.00001).
| Table IVBaseline characteristics of the study
population and cohort analysis. |
Table IV
Baseline characteristics of the study
population and cohort analysis.
| | Refractory epilepsy
cohort | Healthy control
cohort | P-value |
|---|
| Cohort size, n
(%) | 63 (19.6) | 259 (80.4) | |
| Males, n (%) | 41 (65.1) | 125 (48.3) | 0.017a |
| Female, n (%) | 22 (34.9) | 134 (51.7) | |
| Median age
(interquartile range) | 17(8) | 10(3) |
<0.00001b |
Explained variance for PCs ranged from 4.18% (PC no.
1) to 0.32% (PC no. 118) with a mean and median explained variance
of 0.69 and 0.52% as shown in Fig.
1.
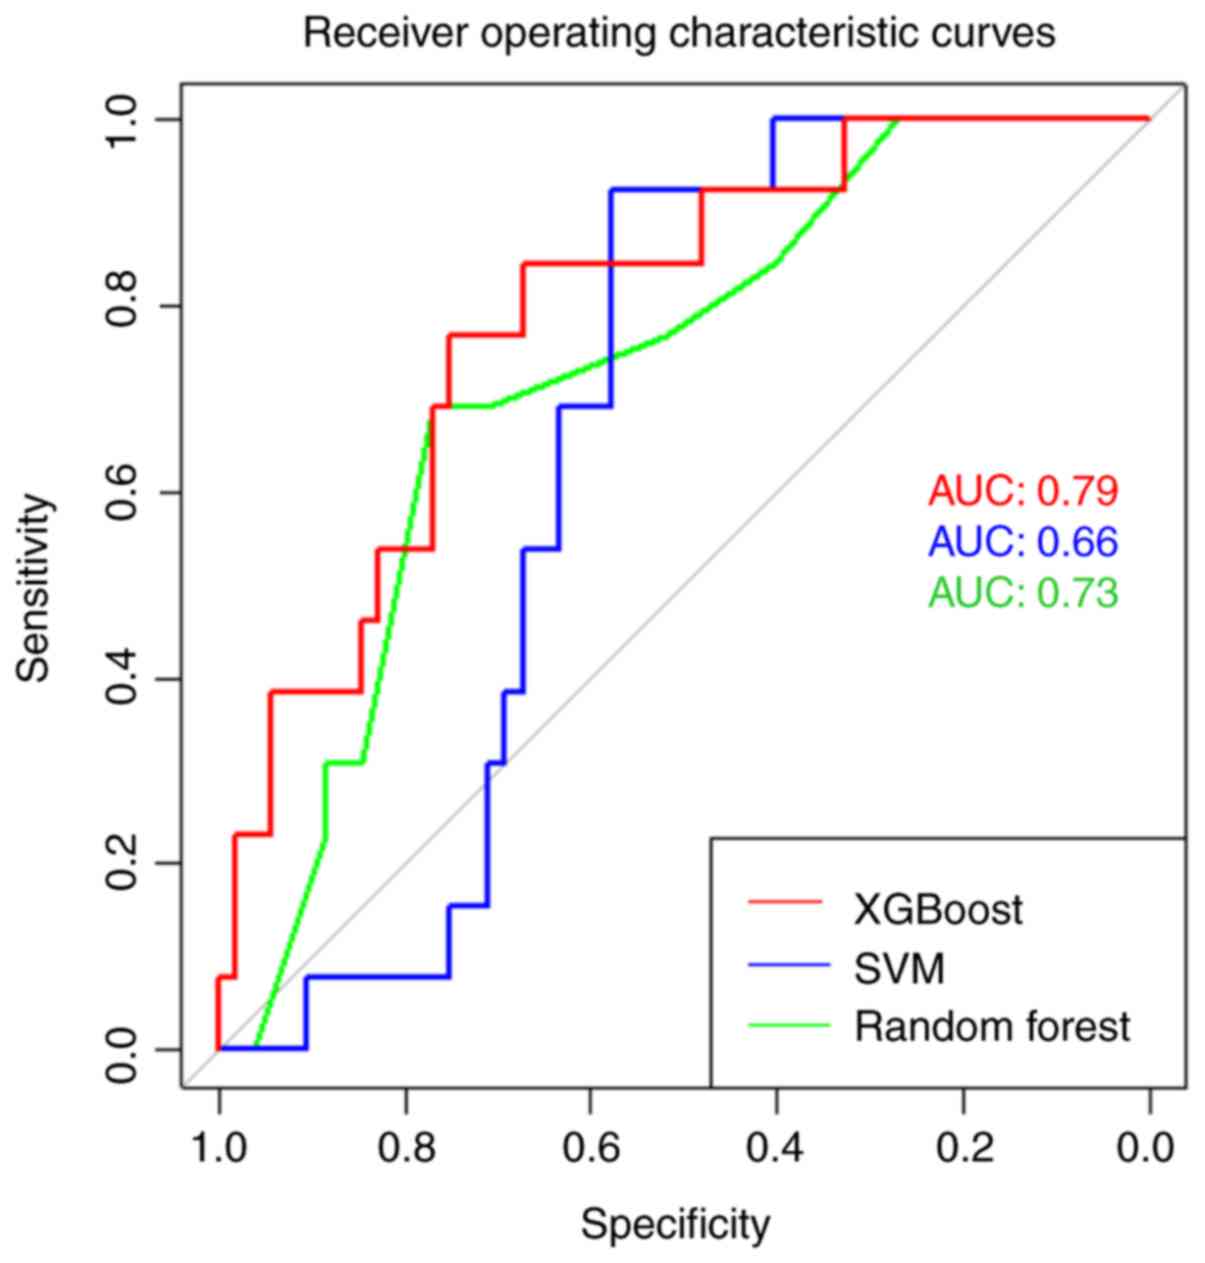
Validation results for each model are presented in
Table V. Final test performance and
generalizability analyses of the best model from each algorithm are
presented in Table VI. The
absolute difference between the test-validation results for each
model are also presented in Table
VI. Lower absolute difference values are desired as they
represent less variation between model test and validation results
and thus, less overfitting and improved model generalizability. ROC
curves were created for each algorithm using test data, and AUC
values were calculated as shown in Fig.
2.
| Table VValidation results from the best SVM,
Random Forest and XGBoost models. |
Table V
Validation results from the best SVM,
Random Forest and XGBoost models.
| Model | AUC | Accuracy | Sensitivity | Specificity | F1-Score |
|---|
| SVM | 0.72 | 0.75 | 0.58 | 0.79 | 0.46 |
| Random Forest | 0.86 | 0.84 | 0.33 | 0.96 | 0.44 |
| XGBoost | 0.81 | 0.84 | 0.67 | 0.88 | 0.62 |
| Table VITest results for the best SVM, Random
Forest and XGBoost modelsa. |
Table VI
Test results for the best SVM, Random
Forest and XGBoost modelsa.
| Model | AUC | Accuracy | Sensitivity | Specificity | F1-Score |
|---|
| SVM | 0.66 (0.06) | 0.62 (0.13) | 0.38 (0.20) | 0.67 (0.12) | 0.23 (0.18) |
| Random Forest | 0.73 (0.13) | 0.77 (0.07) | 0.31 (0.03) | 0.88 (0.08) | 0.34 (0.10) |
| XGBoost | 0.79 (0.02) | 0.74 (0.11) | 0.77 (0.10) | 0.73 (0.15) | 0.54 (0.07) |
XGBoost demonstrated superior performance compared
to all the other models tested. XGBoost correctly classified 74% of
patients with epilepsy and healthy controls. Importantly, the
XGBoost model was sensitive (77%) with a good AUC (0.79), which are
both desired characteristics of a screening diagnostic method.
XGBoost also outperformed all other tested models in three of the
five performance metrics (AUC, sensitivity and F1-score), whereas
the Random Forest algorithm performed the best in the remaining two
performance metrics (accuracy and specificity). Furthermore,
XGBoost-PCA had the greatest generalizability, as demonstrated by
the smallest absolute test-validation performance difference for
both AUC and F1-score. Random Forest performed well, correctly
predicting 77% of patients with a good AUC (0.73). However, the
model's performance may be primarily attributed to the correct
prediction of control individuals (specificity=88%) as the model
poorly predicted patients with epilepsy (sensitivity=31%), which
was reflected in a poor mean score of all five metrics. Whilst SVM
and Random Forest models were both specific, they were not
sensitive, and thus are less effective diagnostic screening tools.
The XGBoost model was both sensitive and specific making it the
best model for this application.
Discussion
At present, ~1 in 150 children under the age of 10
will be diagnosed with epilepsy (1). One-third of pediatric patients with
epilepsy are refractory to treatment with anticonvulsant therapy
alone (2). Several of these
patients may benefit from additional evaluation at comprehensive
epilepsy centers where appropriate treatments can be further
explored. Specifically, surgical intervention has demonstrated
higher rates of seizure freedom and improved cognitive and
developmental outcomes when performed early in appropriate patients
(8,43,44).
Unfortunately, patients experience a two-decade delay between
seizure onset and surgical intervention on average, underlining the
need for earlier comprehensive epilepsy evaluation for patients
with epilepsy (45,46). Delays in diagnosis and effective
treatment of epilepsy place patients at risk of poor development
and sudden death from uncontrolled epilepsy (47,48).
Whilst several factors may contribute to the referral delay for
specialized epilepsy care, the lack of diagnostic methods for
early, accurate identification of any kind of epilepsy is a major
contributor (6,7). This is especially true in
nonconvulsive epilepsy. In the present study, the performance of
SVM, Random Forest and XGBoost machine learning algorithms trained
with novel rfMRI latency data were evaluated as a classifier to
distinguish children with epilepsy from healthy controls.
Previous studies have shown that rfMRI data is
correlated with seizure foci laterality and localization (11,21,23,24).
Recent machine learning studies demonstrated successful
classification of patients with temporal lobe epilepsy from healthy
controls, that rfMRI data could be used to improve preoperative
planning prior to surgical intervention (21,22).
The present study used rfMRI latency analysis, a novel method for
RSN construction and analysis, and machine learning to create
models that can differentiate children with epilepsy from healthy
controls. RfMRI latency analysis has been shown to be correlate
with seizure foci laterality, and rfMRI latency analysis has been
used to classify epilepsy (11,49).
Recently, an SVM model trained with RSN data
obtained from ICA of rfMRI data was able to accurately (97.52%)
classify temporal lobe epilepsy with high sensitivity (100%) and
specificity (94.4%), but extratemporal epilepsy is far more
challenging to classify and treat (11,21).
This study also used visual inspection and selection of independent
components for RSN construction, which differs from the novel
method of constructing RSNs with rfMRI latency analysis used in the
present study. The present study demonstrated that RSN trained
machine learning algorithms can be used to classify epilepsy in an
automated manner using a novel, objective and efficient method of
RSN construction that has not yet been demonstrated in the
literature to the best of our knowledge.
One aspect of the present study that limited further
analysis was the method of feature engineering. PCA transformed the
rfMRI latency z-score data into 118 PCs that represent the variance
in the training data. However, the use of PC features also
prevented analysis of specific pathologies for relevant image
features. It was unable to reconstruct the original rfMRI latency
z-score spatial data and assign weighting for PC features from the
trained XGBoost model. In previous attempts, models trained with
the original rfMRI latency voxel z-scores as features did not
achieve >50% sensitivity (data not shown). Therefore, PCA was
chosen to create a reduced dimension feature space for model
training despite these drawbacks. It is hypothesized that the poor
performance of the original feature space vs. the PC feature space
was due to the relatively small dataset (n=322) compared to the
large input features for training the machine learning algorithms
(n=47,950).
The primary limitation of the present study was the
small amount of training data available at the time of analysis. In
future studies, the use of larger training datasets will improve
model performance and decrease overfitting, thereby increasing
model generalizability (50). The
rfMRI data used for analysis was obtained from multiple
institutions, using different imaging protocols. However, other
publicly accessible healthy rfMRI datasets (ABIDE I and II) could
potentially be used to increase the size of the dataset (51,52).
Specifics of the imaging parameters used by each scanner to obtain
data in the present study are listed in Table SI. The use of different scanner
parameters in rfMRI latency data collection could affect model
performance, but this also accounts for normal variance present at
each institution if this method were to be used to assist in the
identification of pediatric epilepsy. Nevertheless, to attempt to
mitigate these biases, similar imaging parameters will be used in
future studies for all subjects, and the total study population
will be increased. In addition, the limitation of the size of the
training data affected our ability to age and sex match epilepsy
and healthy control cohorts. Additional patients in the healthy
control cohort were not eliminated, as it was theorized that it
could affect the ability of the models to train when based on a
limited dataset. This could affect the features the models use to
classify images (such as subtle age and sex brain image differences
vs. epilepsy specific image differences). Additionally, the
relatively small sample of patients with epilepsy compared with the
control individuals could affect how PCA captured the variance in
the epilepsy group. However, in the present study PCA was able to
capture the variance in the epilepsy cases as both sensitivity and
specificity were comparable in the XGBoost model's performance on
the test data. However, this was not the case in both Random Forest
and SVM, possibly indicating the superiority of XGBoost at
detecting more subtle differences in the variance of the PC
features between epilepsy and control groups. The potential effects
of age, sex and the previously discussed scanner parameters is
difficult to assess, and with additional epilepsy and healthy
control individuals these potential affects will be mitigated in
future studies.
The present study is also limited to binary
classification (healthy vs. epilepsy) due to the small sample size
and limited representation of rare classification groups in
multi-class applications. With additional varied epilepsy rfMRI
data, these data distribution effects can be mitigated, and models
can be developed to predict epilepsy subgroups (such as surgical
outcome and pathological etiology, amongst others), seizure foci
lateralization and, ultimately, seizure foci localization.
Refractory epilepsy patient and healthy individuals'
data were included in the present study. It was possible to
classify these two groups using the Random Forest, SVM and XGBoost
models, but it is difficult to assess the ability of these models
to classify the diverse spectrum of epilepsy conditions (including
non-refractory and temporal epilepsy) from healthy individuals.
In future studies, the use of other machine learning
algorithms that will allow for further examination of rfMRI
latency, such as semantic segmentation with CNNs will be assessed,
which could allow for voxel-wise classification and epileptogenic
seizure foci localization. In addition, additional epilepsy data
are being collected to expand classification to subgroup analysis
and to include non-refractory and temporal epilepsy, with the aim
of improving generalizability of the constructed models.
In conclusion, in the present study it was
demonstrated that rfMRI latency analysis and machine learning
algorithms could be used to identify patients with epilepsy. The
XGBoost machine learning model trained with rfMRI latency z-score
PC features was better able to distinguish pediatric patients with
epilepsy from healthy controls compared with identically trained
Random Forest and SVM models. The high sensitivity of the XGBoost
test model presented in this study is encouraging. Additional
studies with multi-institutional neurological imaging datasets are
required to further clarify the value of the machine learning and
rfMRI latency in the diagnosis and evaluation of pediatric epilepsy
as well as its potential to decrease morbidity and improve
prognostication within this patient population.
Supplementary Material
Scanner parameters for resting.state
functional MRI data acquisition for both the healthy control and
refractory epilepsy cohorts.
Acknowledgements
We would like to thank Dr Marc E. Raichle
(Washington University School of Medicine) and Dr Abraham Z. Snyder
(Washington University) for their support in rfMRI analysis.
Funding
The present study was partly funded by the National Institutes
of Health National Institute of Neurological Disorders and Stroke
(grant no. R21NS120085).
Availability of data and materials
The code described during the present study is
available from the corresponding author on reasonable request. The
data will be made available pending approval from the Institutional
Review Board at Washington University and McGovern Medical School.
Upon approval, the data that support the findings of this study
will be made available from the corresponding author upon
reasonable request.
Authors' contributions
RDN, MDS and MNS were all involved in study design
and co-ordination. RDN wrote the manuscript. RPP, JEL, GVA, MWW,
MEF and MNS acquired resting-state functional MRI (rfMRI) data from
the Children's Memorial Hermann Hospital. MDS acquired rfMRI data
from St. Louis Children's Hospital. LZ and RDN were involved with
extreme gradient boosting (XGBoost) model development and algorithm
optimization, including tuning of model hyperparameters to achieve
optimal performance. LZ, EHK and RDN analyzed the XGBoost model
data. LZ assisted with biostatistical analysis for the entire
study. LPP, EHK and RDN contributed to the preprocessing of the
rfMRI latency data for analysis. AM developed rfMRI latency data
analysis software. AM created and revised the protocols used to
perform the rfMRI latency data analysis. MDS oversaw rfMRI latency
data analysis. SKS performed statistical analysis of the two study
cohorts and interpreted these results. RDN and SKS edited the
manuscript. MNS coordinated data acquisition from multiple
institutions, oversaw rfMRI data latency analysis and manuscript
production. All authors contributed to the intellectual concept
investigated in this study and have agreed to be accountable for
all aspects of their work. All authors have read and approved the
final manuscript. RDN and MNS confirm the authenticity of all the
raw data.
Ethics approval and consent to
participate
IRB approval (approval no. UT Houston IRB
#HSC-MS-17-0092) was obtained at both Washington University and
McGovern Medical School for images obtained from St. Louis
Children's Hospital, Children's Memorial Hermann Hospital, and the
multi-institutional ADHD 200 dataset of the 1000 Functional
Connectomes Project, International Neuroimaging Data-Sharing
Initiative hosted by the Neuroimaging Tools & Resources
Collaboratory. Informed consent was obtained from the patient's
caregivers or by capable patients aged >18 years old, as
required by each database and institution.
Patient consent for publication
All identifiable patient information was removed
from the MRI data obtained prior to processing. Then, images were
randomly separated into training, validation, and test datasets for
comparison. Informed consent was obtained for each study patient
from the patient's caregivers or by capable patients aged >18
years old for publication of their data.
Competing interests
The authors declare that they have no competing
interests.
References
|
1
|
Aaberg KM, Gunnes N, Bakken IJ, Lund
Søraas C, Berntsen A, Magnus P, Lossius MI, Stoltenberg C, Chin R
and Surén P: Incidence and prevalence of childhood epilepsy: A
nationwide cohort study. Pediatrics. 139(e20163908)2017.PubMed/NCBI View Article : Google Scholar
|
|
2
|
Kwan P and Brodie MJ: Early identification
of refractory epilepsy. N Engl J Med. 342:314–319. 2000.PubMed/NCBI View Article : Google Scholar
|
|
3
|
Smith SJ: EEG in the diagnosis,
classification, and management of patients with epilepsy. J Neurol
Neurosurg Psychiatry. 76 (Suppl 2):ii2–ii7. 2005.PubMed/NCBI View Article : Google Scholar
|
|
4
|
Mihara T, Inoue Y, Matsuda K, Tottori T,
Otsubo T, Watanabe Y, Hiyoshi T, Kubota Y, Yagi K and Seino M:
Recommendation of early surgery from the viewpoint of daily quality
of life. Epilepsia. 37 (Suppl 3):S33–S36. 1996.PubMed/NCBI View Article : Google Scholar
|
|
5
|
Westerveld M, Sass KJ, Chelune GJ, Hermann
BP, Barr WB, Loring DW, Strauss E, Trenerry MR, Perrine K and
Spencer DD: Temporal lobectomy in children: Cognitive outcome. J
Neurosurg. 92:24–30. 2000.PubMed/NCBI View Article : Google Scholar
|
|
6
|
Baulac M, de Boer H, Elger C, Glynn M,
Kälviäinen R, Little A, Mifsud J, Perucca E, Pitkänen A and Ryvlin
P: Epilepsy priorities in Europe: A report of the ILAE-IBE epilepsy
advocacy Europe task force. Epilepsia. 56:1687–1695.
2015.PubMed/NCBI View Article : Google Scholar
|
|
7
|
Berg AT, Baca CB, Loddenkemper T, Vickrey
BG and Dlugos D: Priorities in pediatric epilepsy research:
Improving children's futures today. Neurology. 81:1166–1175.
2013.PubMed/NCBI View Article : Google Scholar
|
|
8
|
Dlugos DJ: The early identification of
candidates for epilepsy surgery. Arch Neurol. 58:1543–1546.
2001.PubMed/NCBI View Article : Google Scholar
|
|
9
|
Gilliam F, Kuzniecky R, Meador K, Martin
R, Sawrie S, Viikinsalo M, Morawetz R and Faught E:
Patient-oriented outcome assessment after temporal lobectomy for
refractory epilepsy. Neurology. 53:687–694. 1999.PubMed/NCBI View Article : Google Scholar
|
|
10
|
Guerrini R: Epilepsy in children. Lancet.
367:499–524. 2006.PubMed/NCBI View Article : Google Scholar
|
|
11
|
Shah MN, Nguyen RD, Pao LP, Zhu L,
CreveCoeur TS, Mitra A and Smyth MD: Role of resting state MRI
temporal latency in refractory pediatric extratemporal epilepsy
lateralization. J Magn Reson Imaging. 49:1347–1355. 2019.PubMed/NCBI View Article : Google Scholar
|
|
12
|
Guidelines for neuroimaging evaluation of
patients with uncontrolled epilepsy considered for surgery.
Commission on neuroimaging of the international league against
epilepsy. Epilepsia. 39:1375–1376. 1998.PubMed/NCBI View Article : Google Scholar
|
|
13
|
Recommendations for neuroimaging of
patients with epilepsy. Commission on neuroimaging of the
international league against epilepsy. Epilepsia. 38:1255–1256.
1997.PubMed/NCBI View Article : Google Scholar
|
|
14
|
Biswal B, Yetkin FZ, Haughton VM and Hyde
JS: Functional connectivity in the motor cortex of resting human
brain using echo-planar MRI. Magn Reson Med. 34:537–541.
1995.PubMed/NCBI View Article : Google Scholar
|
|
15
|
Mitra A, Snyder AZ, Blazey T and Raichle
ME: Lag threads organize the brain's intrinsic activity. Proc Natl
Acad Sci USA. 112:E2235–E2244. 2015.PubMed/NCBI View Article : Google Scholar
|
|
16
|
Mitra A, Snyder AZ, Hacker CD and Raichle
ME: Lag structure in resting-state fMRI. J Neurophysiol.
111:2374–2391. 2014.PubMed/NCBI View Article : Google Scholar
|
|
17
|
Jirsa VK, Proix T, Perdikis D, Woodman MM,
Wang H, Gonzalez-Martinez J, Bernard C, Bénar C, Guye M, Chauvel P
and Bartolomei F: The virtual epileptic patient: Individualized
whole-brain models of epilepsy spread. Neuroimage. 145:377–388.
2017.PubMed/NCBI View Article : Google Scholar
|
|
18
|
Pizoli CE, Shah MN, Snyder AZ, Shimony JS,
Limbrick DD, Raichle ME, Schlaggar BL and Smyth MD: Resting-state
activity in development and maintenance of normal brain function.
Proc Natl Acad Sci USA. 108:11638–11643. 2011.PubMed/NCBI View Article : Google Scholar
|
|
19
|
Proix T, Bartolomei F, Guye M and Jirsa
VK: Individual brain structure and modelling predict seizure
propagation. Brain. 140:641–654. 2017.PubMed/NCBI View Article : Google Scholar
|
|
20
|
Beckmann CF, DeLuca M, Devlin JT and Smith
SM: Investigations into resting-state connectivity using
independent component analysis. Philos Trans R Soc Lond B Biol Sci.
360:1001–1013. 2005.PubMed/NCBI View Article : Google Scholar
|
|
21
|
Bharath RD, Panda R, Raj J, Bhardwaj S,
Sinha S, Chaitanya G, Raghavendra K, Mundlamuri RC, Arimappamagan
A, Rao MB, et al: Machine learning identifies ‘rsfMRI epilepsy
networks’ in temporal lobe epilepsy. Eur Radiol. 29:3496–3505.
2019.PubMed/NCBI View Article : Google Scholar
|
|
22
|
Boerwinkle VL, Mirea L, Gaillard WD,
Sussman BL, Larocque D, Bonnell A, Ronecker JS, Troester MM,
Kerrigan JF, Foldes ST, et al: Resting-state functional MRI
connectivity impact on epilepsy surgery plan and surgical
candidacy: Prospective clinical work. J Neurosurg Pediatr. 1–8.
2020.PubMed/NCBI View Article : Google Scholar : (Online ahead of
print).
|
|
23
|
Boerwinkle VL, Mohanty D, Foldes ST,
Guffey D, Minard CG, Vedantam A, Raskin JS, Lam S, Bond M, Mirea L,
et al: Correlating resting-state functional magnetic resonance
imaging connectivity by independent component analysis-based
epileptogenic zones with intracranial electroencephalogram
localized seizure onset zones and surgical outcomes in prospective
pediatric intractable epilepsy study. Brain Connect. 7:424–442.
2017.PubMed/NCBI View Article : Google Scholar
|
|
24
|
Shah MN, Mitra A, Goyal MS, Snyder AZ,
Zhang J, Shimony JS, Limbrick DD, Raichle ME and Smyth MD: Resting
state signal latency predicts laterality in pediatric medically
refractory temporal lobe epilepsy. Childs Nerv Syst. 34:901–910.
2018.PubMed/NCBI View Article : Google Scholar
|
|
25
|
Darcy AM, Louie AK and Roberts LW: Machine
learning and the profession of medicine. JAMA. 315:551–552.
2016.PubMed/NCBI View Article : Google Scholar
|
|
26
|
Deo RC: Machine learning in medicine.
Circulation. 132:1920–1930. 2015.PubMed/NCBI View Article : Google Scholar
|
|
27
|
Rajkomar A, Dean J and Kohane I: Machine
learning in medicine. N Engl J Med. 380:1347–1358. 2019.PubMed/NCBI View Article : Google Scholar
|
|
28
|
Jordan MI and Mitchell TM: Machine
learning: Trends, perspectives, and prospects. Science.
349:255–260. 2015.PubMed/NCBI View Article : Google Scholar
|
|
29
|
Cortes C and Vapnik V: Support-vector
networks. Mach Learn. 20:273–297. 1995.
|
|
30
|
Chen T and Guestrin C: XGBoost: A scalable
tree boosting system. In Proceedings of the 22nd acm sigkdd
international conference on knowledge discovery and data mining,
pp785-794, 2016.
|
|
31
|
Liaw A and Wiener M: Classification and
regression by randomForest. R News. 2:18–22. 2002.
|
|
32
|
Fern A and Givan R: Online ensemble
learning: An empirical study. Mach Learn. 53:71–109. 2003.
|
|
33
|
Mennes M, Biswal BB, Castellanos FX and
Milham MP: Making data sharing work: The FCP/INDI experience.
Neuroimage. 82:683–691. 2013.PubMed/NCBI View Article : Google Scholar
|
|
34
|
Bellec P, Chu C, Chouinard-Decorte F,
Benhajali Y, Margulies DS and Craddock RC: The neuro bureau
ADHD-200 preprocessed repository. Neuroimage. 144:275–286.
2017.PubMed/NCBI View Article : Google Scholar
|
|
35
|
Brier MR, Thomas JB, Snyder AZ, Benzinger
TL, Zhang D, Raichle ME, Holtzman DM, Morris JC and Ances BM: Loss
of intranetwork and internetwork resting state functional
connections with Alzheimer's disease progression. J Neurosci.
32:8890–8899. 2012.PubMed/NCBI View Article : Google Scholar
|
|
36
|
Kowerko D: https://www.mathworks.com/matlabcentral/fileexchange/49823-calc_overlap_twonormal(s1,s2,mu1,mu2,xstart,xend,xinterval).
MATLAB Central File Exchange. Retrieved July 19, 2021.
|
|
37
|
Jenkinson M, Beckmann CF, Behrens TE,
Woolrich MW and Smith SM: FSL. Neuroimage. 62:782–790.
2012.PubMed/NCBI View Article : Google Scholar
|
|
38
|
Verleysen M and François D: The Curse of
Dimensionality in Data Mining and Time Series Prediction. Vol 3521.
IWANN 2005: Computational Intelligence and Bioinspired Systems,
pp758-770, 2005.
|
|
39
|
Meyer D, Dimitriadou E, Hornik K,
Weingessel A and Leisch F: e1071: Misc functions of the department
of statistics, probability theory group (Formerly: E1071), TU Wien,
2017.
|
|
40
|
R Core Team: R: A Language and Environment
for Statistical Computing. R Foundation for Statistical Computing,
Vienna, Austria, 2019. Available from: http://www.r-project.org/index.html.
|
|
41
|
RStudio Team: RStudio: Integrated
Development for R. RStudio, Inc., Boston MA (Computer Software
v0.98.1074), 2015.
|
|
42
|
Sasaki Y: The truth of the F-measure.
Teach Tutor Mater, 2007.
|
|
43
|
Baca CB, Vickrey BG, Vassar S, Hauptman
JS, Dadour A, Oh T, Salamon N, Vinters HV, Sankar R and Mathern GW:
Time to pediatric epilepsy surgery is related to disease severity
and nonclinical factors. Neurology. 80:1231–1239. 2013.PubMed/NCBI View Article : Google Scholar
|
|
44
|
Loddenkemper T, Holland KD, Stanford LD,
Kotagal P, Bingaman W and Wyllie E: Developmental outcome after
epilepsy surgery in infancy. Pediatrics. 119:930–935.
2007.PubMed/NCBI View Article : Google Scholar
|
|
45
|
Berg AT, Vickrey BG, Testa FM, Levy SR,
Shinnar S, DiMario F and Smith S: How long does it take for
epilepsy to become intractable? A prospective investigation. Ann
Neurol. 60:73–79. 2006.PubMed/NCBI View Article : Google Scholar
|
|
46
|
Trevathan E and Gilliam F: Lost years:
Delayed referral for surgically treatable epilepsy. Neurology.
61:432–433. 2003.PubMed/NCBI View Article : Google Scholar
|
|
47
|
Elger CE, Helmstaedter C and Kurthen M:
Chronic epilepsy and cognition. Lancet Neurol. 3:663–672.
2004.PubMed/NCBI View Article : Google Scholar
|
|
48
|
Sperling MR: Sudden unexplained death in
epilepsy. Epilepsy Curr. 1:21–23. 2001.PubMed/NCBI View Article : Google Scholar
|
|
49
|
Nguyen RD, Kennady EH, Smyth MD, Zhu L,
Pao LP, Swisher SK, Rosas A, Mitra A, Patel RP, Lankford J, et al:
Convolutional neural networks for pediatric refractory epilepsy
classification using resting-state functional magnetic resonance
imaging. World Neurosurg. 149:e1112–e1122. 2021.PubMed/NCBI View Article : Google Scholar
|
|
50
|
Hastie T, Tibshirani R and Friedman J: The
Elements of Statistical Learning: Data Mining, Inference and
Prediction. Springer, New York, NY, 2016.
|
|
51
|
Di Martino A, O'Connor D, Chen B, Alaerts
K, Anderson JS, Assaf M, Balsters JH, Baxter L, Beggiato A,
Bernaerts S, et al: Enhancing studies of the connectome in autism
using the autism brain imaging data exchange II. Sci Data.
4(170010)2017.PubMed/NCBI View Article : Google Scholar
|
|
52
|
Di Martino A, Yan CG, Li Q, Denio E,
Castellanos FX, Alaerts K, Anderson JS, Assaf M, Bookheimer SY,
Dapretto M, et al: The autism brain imaging data exchange: Towards
a large-scale evaluation of the intrinsic brain architecture in
autism. Mol Psychiatry. 19:659–667. 2014.PubMed/NCBI View Article : Google Scholar
|
|
53
|
Schölkopf B and Smola AJ: Learning with
Kernels: Support Vector Machines, Regularization, Optimization, and
Beyond. Adaptive Computation and Machine Learning Series, 2018.
|