Introduction
Hepatitis B virus (HBV) infection causes cirrhosis
and hepatocellular carcinoma (1,2); de
novo HBV infection also causes acute liver failure (2). Treatment for HBV infection focuses on
improving survival and quality of life by preventing disease
progression (3). Long-term
administration of a potent nucleoside/nucleotide analog (NA) with a
high barrier to resistance is the treatment of choice regardless of
the severity of liver disease, and the preferred regimens are
entecavir (ETV), tenofovir disoproxil (TDF) and tenofovir
alafenamide (TAF) (3). In cases of
long-term administration of NA, patients are at an increased risk
of renal disease and should undergo periodic renal monitoring,
including at least estimated glomerular filtration rate (eGFR) and
serum phosphate level (3). Chronic
HBV infection is associated with kidney damage (4), and follow-up of renal function in
patients with HBV is important during treatment.
Additionally, hepatic osteodystrophy (HOD) is common
in chronic liver diseases, including viral hepatitis (5-7).
HOD includes osteoporosis and osteomalacia, which are caused by
hormonal abnormality-induced advanced liver failure complicated
with abnormal serum calcium and phosphate (5-7).
HBV infection is associated with the risk of osteoporosis and bone
mineral density (BMD) loss (8,9). The
bone metabolic marker, tartrate-resistant acid phosphatase isoform
5b (TRACP-5b), is an activation marker of osteoclasts, and is
elevated in patients with HOD associated with chronic liver disease
(6). TRACP-5b levels from baseline
to 3 months after treatment may predict the efficacy of bone
therapy after 12 months (10).
Therefore, measurements of BMD and bone metabolic markers are
useful in the diagnosis and management of osteoporosis (11).
TAF is associated with a slightly lower degree of
BMD loss and creatinine (Cr) elevation compared with TDF, without
loss of the excellent anti-viral effects (12-14).
Patients on TDF that are at a risk of development of or have
already developed underlying renal or bone disease should be
considered for a switch to ETV or TAF (3). However, switching from ETV to TAF is
contested. When ETV was switched to TAF, serum Cr (15) or renal tubular function (16) improved, hepatitis B surface antigen
(HBsAg) decreased, however no-change in BMD and renal function were
observed (17). ETV is administered
orally once daily under fasting conditions, and TAF is administered
orally once daily. Switching from ETV to TAF can be a useful
approach for improving medication adherence and satisfaction
(18,19).
Based on favorable adherence, TAF is being chosen
for the treatment naïve patients with HBV in our hospital, and
patients have been encouraged to switch from ETV to TAF since 2017.
In this study, the influence of TAF treatment on bone metabolism
and kidney function for 1 year of TAF treatment was evaluated.
Patients and methods
Patients
A total of 87 patients with HBV infection were
admitted to the Nagasaki Harbor Medical Center between April 2017
and February 2020. Of these, 32 patients (median age, 58.96; range,
36-86; female/male, 14/18) were naïve to treatment with TAF
(Vemlidy, Gilead Sciences) (Naïve group), and 55 patients (median
age, 59.89; range, 35-82; female/male, 15/40) were treated with ETV
(Baraclude, Bristol-Myers Sqibb) for at least 1 year, and switched
to TAF (Switch group). The reason for switching was to ensure drug
compliance, adjusted for lifestyle. ETV was administered orally at
a dose of 0.5 mg once daily under fasting conditions. TAF was
administered orally at a dose of 25 mg once daily. No patients were
treated for osteoporosis before TAF initiation. The medical records
of the 87 patients were compared at the start of TAF and after 1
year. The prevention group was treated with TAF for asymptomatic
HBV using immunosuppressants and/or anticancer drugs. The bone
disease-positive group was defined as follows: Chronic steroid use
or use of other medications that worsen bone density and/or history
of fragility fracture and/or osteoporosis.
The medical records of the 87 patients were
retrospectively reviewed. Informed consent was obtained from each
patient included in the study, and the patients were guaranteed the
right to leave the study if they desired. The study protocol
conformed to the ethical guidelines of the 1975 Declaration of
Helsinki (20) and was approved by
the Human Research Ethics Committee of the Nagasaki Harbor Medical
Center (approval no. H30-031).
Laboratory measurements
Laboratory data and anthropometric measurements were
obtained for each subject every 4-12 weeks during treatment, and
BMD and urinalysis were examined every 12 months. The body mass
index of each patient was calculated by dividing their weight in kg
by the square of their height in meters. Laboratory examinations
included platelet count, Cr, cystatin C (CysC), albumin, total
bilirubin, alanine aminotransferase (ALT), calcium (Ca), inorganic
phosphorus (P), α-fetoprotein, protein induced by vitamin K
absence-II (PIVKA-II), Mac-2 binding protein glycan isomer
(M2BPGi), total type I procollagen N-propeptide (P1NP), and
tartrate-resistant acid phosphatase 5b (TRACP-5b). HBsAg, HBeAg,
HBe antibody (HBeAb), HB core-related Ag (HBcrAg) and HBV-DNA were
evaluated at the start of TAF administration and 1 year later.
Urinalysis was performed using the β2-microglobulin-to-creatinine
β2MG/Cr ratio and total protein-to-creatinine protein/Cr ratio.
Radiological findings in the present study.
Osteoporosis, osteopenia and normal BMD were
diagnosed according to the World Health Organization criteria
(osteoporosis, T-score ≤-2.5; osteopenia, T-score between -2.5 and
-1; normal BMD: T-score >-1) (21). Bone mineral density was measured at
the lumbar spine (mean, L2-L4) and femoral neck using dual-energy
X-ray absorptiometry (DEXA).
Cr- and CysC-based estimated GFRs (eGFRs)
(ml/min/1.73 m2) in women and men were calculated using
the equations provided by the Japanese Society of Nephrology for
Japanese patients (22). The
sarcopenia index (SI) was calculated as follows: Cr/CysC
x100(23). The calculated body
muscle mass (CBMM) was calculated as follows: (body weight in kg x
Cr)/[K x body weight in kg x CysC)+ Cr], where K=0.00675 for men
and 0.01006 for women (24).
Statistical analysis
Data were analyzed using StatFlex version 6.0
(Artech Co., Ltd.) and are presented as the mean ± standard
deviation. Laboratory result variables were compared using a
Wilcoxon test for differences between paired groups, a Mann-Whitney
tests comparison for unpaired two groups, and a χ2 test
for comparison between discrete variables. A standardized partial
regression coefficient β was employed. Univariate and multivariate
analyses were performed using a logistic regression analysis.
Correlations were evaluated using Pearson's correlation coefficient
(R). P<0.05 was considered to indicate a statistically
significant difference.
Results
The clinical characteristics of the patients at the
start of TAF and after 1 year, are described in Table I. It was observed that male patients
were dominant and 51 patients were ≥60 years of age. The prevention
group included patients with asymptomatic HBV infection treated
with TAF as part of an anticancer or immunosuppressive therapy.
During the 1-year observation period, HBsAg levels were not
significantly altered, but HBcrAg and HBV-DNA levels significantly
decreased. Albumin levels increased and M2BPGi levels decreased.
Regarding renal function, Cr levels were increased, Cr-based eGFR
decreased and urine protein/Cr ratio increased. CysC, CysC eGFR,
Ca, P and urine β2MG/Cr ratios were not significantly changed. In
bone metabolism, lumbar BMD did not change, but the BMD of the neck
of femur decreased. However, TRACP-5b levels significantly
improved. P1NP was not measured after 1 year.
 | Table IClinical characteristics at start of
treatment and after 1 year. |
Table I
Clinical characteristics at start of
treatment and after 1 year.
| Factor | At start | After 1 year | P-value |
|---|
| Female/male, n | 29/58 | 29/58 | |
| Age, years | 59.55(12) | | - |
| Age bracket, n | | | - |
|
≥60
years | 51 | | |
|
<60
years | 37 | | |
| Body weight, kg | 61.83 (12.1) | 61.91 (12.18) | 0.5899 |
| Body mass index,
kg/m2 | 23.07 (3.64) | | |
| Groups, n | | | |
|
Naïve | 32 | | |
|
Switch | 55 | | |
|
Prevention | 20 | | |
| HBsAg IU/ml | 3,134 (9,744) | 2,115 (3,697) | 0.0005 |
| HBcrAg Log
U/ml | 3.457 (1.612) | 3.11 (1.485) |
<0.0001c |
| HBcrAg positive,
n | 45 | 36 |
<0.001c |
| HBeAg C.O.I. | 97.756(376) | 55.628(271) | 0.0352a |
| HBeAg positive,
n | 13 | 13 | 0.999 |
| HBeAb %
inhibition | 74.41 (34.12) | 72.84 (32.5) | 0.2149 |
| HBV-DNA log
IU/ml | 1.80 (2.522) | 0.251 (0.559) |
<0.0001d |
| HBV-DNA positive,
n | 41 | 17 |
<0.0001d |
| AST U/l | 68.92 (227.13) | 26.73 (14.85) | 0.019a |
| ALT U/l | 79.91 (310.1) | 24.97 (21.05) | 0.0241a |
| Platelet
x104/µl | 17.86 (7.164) | 18.64 (17.49) | 0.342 |
| Albumin g/dl | 4.098 (0.578) | 4.226 (0.456) | 0.0053b |
| Total bilirubin
mg/dl | 0.921 (0.985) | 0.907 (0.577) | 0.0198a |
| M2BPGi C.O.I | 1.436 (2.05) | 1.058 (1.37) | 0.0014b |
| Cr mg/d | 0.825 (0.248) | 0.857 (0.219) | 0.0007c |
| Cr-eGFR ml/min/1.73
m2 | 72.945
(19.006) | 68.51 (16.91) | <0.0001 |
| Cys C mg/l | 1.103 (0.345) | 1.098 (0.328) | 0.6944 |
| Cys C-eGFR
ml/min/1.73 m2 | 70.74 (22.66) | 70.36 (22.49) | 0.6253 |
| Sarcopenia
indexe | 77.21 (18.4) | 80.69 (817.82) | 0.0424a |
| Ca mg/dl | 9.074 (0.493) | 9.138 (0.486) | 0.2563 |
| P mg/dl | 3.127 (0.502) | 3.193 (0.522) | 0.4027 |
| Urine protein/Cr
g/g | 0.147 (0.383) | 0.199 (0.536) | 0.0205a |
| Urine b2MG/Cr
µg/mg | 4.499 (19.301) | 7.845 (32.666) | 0.9357 |
| Lumbar BMD
g/cm2 | 0.906 (0.206) | 0.907 (0.2) | 0.2041 |
| Lumbar t-score | -1.09 (1.697) | -1.091 (1.668) | 0.4505 |
| Lumbar young adult
mean | 87.62 (19.614) | 87.427
(18.833) | 0.7057 |
| Lumbar
osteoporosis, n | 19 | 15 | 0.3409 |
| Neck of femur BMD
g/cm2 | 0.66 (0.142) | 0.636 (0.132) |
<0.0001d |
| Neck of femur
t-score | -1.504 (1.111) | -1.699 (1.026) | 0.0001d |
| Neck of femur young
adult mean | 78.785
(15.523) | 75.813
(14.659) |
<0.0001d |
| Neck of femur
Osteoporosis, n | 13 | 21 | 0.0625 |
| TRACP-5b mU/dl | 417.7(207) | 356.5 (142.3) | 0.0039b |
| TRACP-5b High,
n | 18 | 13 | 0.1714 |
| P1NP ng/ml | 55.05 (28.25) | | |
| P1NP
Highe | 9 | 0 | |
| α-fetoprotein
ng/ml | 10.64(25) | 4.93 (4.5) | 0.6469 |
| PIVKA-II
mAU/ml | 38.33 (114.3) | 38.46 (106.5) | 0.4463 |
A focus was placed on the change in TRACP-5b
associated with TAF. The change in TRACP-5b levels were compared
with clinical factors (Table II).
TRACP-5b at start in male patients, patients who were
HBeAg-positive, HBcrAg-positive, HBV-DNA-negative, switch,
treatment, high albumin (≥4 g/dl), high platelet count
(≥15x104/µl) and low body mass index (<25) were lower
than after 1 year. In conforming with the EASL guidelines (4), old age (≥60 years), bone disease
[chronic steroid use or use of other medications that worsen bone
density and/or history of fragility fracture and/or osteoporosis)
and renal alteration (eGFR <60 ml/min/1.73 m2 and/or
moderate dipstick proteinuria and/or low P (<2.5 mg/dl) and/or
hemodialysis] were selected for the disease group. Old age (≥60
years) and bone disease significantly decreased TRAC-5b levels.
Next, whether these factors contributed to the decrease in TRCAP-5b
levels with TAF use was assessed. Since bone metabolic markers have
various circadian variations, MSCs were set for each marker. The
MSC of TRACP-5b showed over a 12.4% of change rate
[(pre-treatment-after treatment)/pretreatment x100]. Therefore, the
contribution of TRACP-5b to MSCs (32 cases) was evaluated.
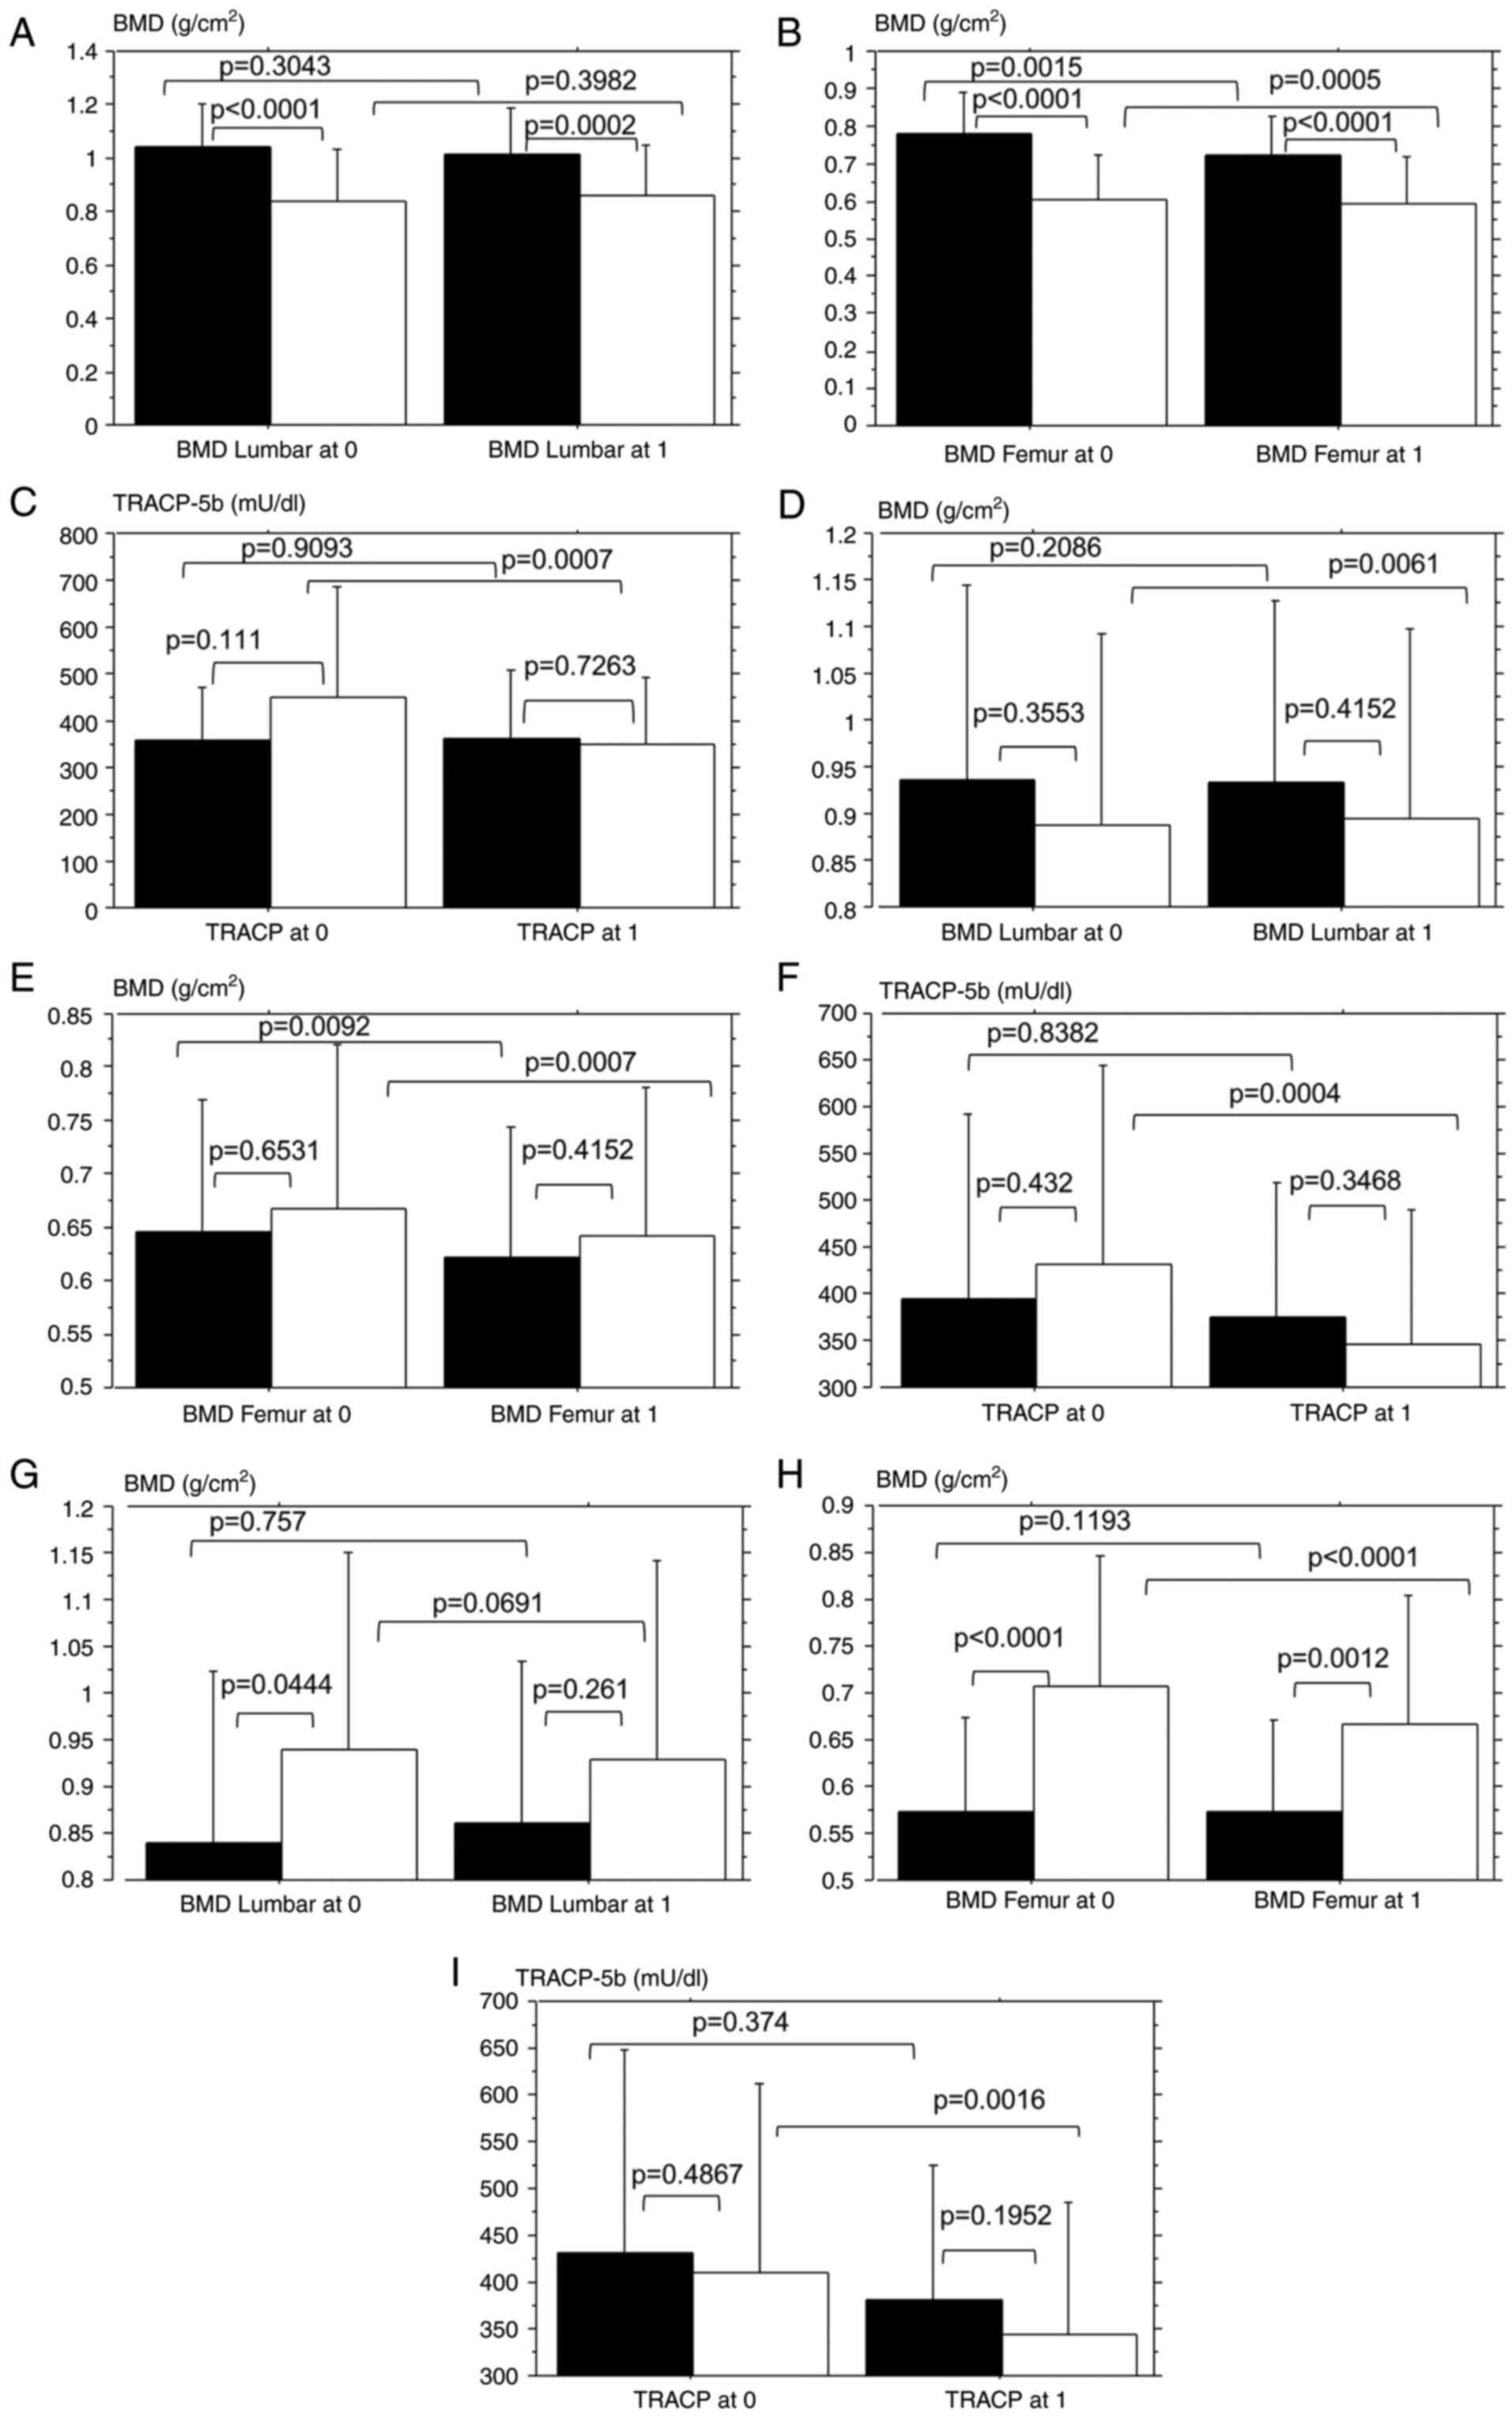
Univariate logistic regression analysis revealed that bone disease
was the only contributing factor for MSCs. The bone disease group
had lower BMD in the lumbar and neck of the femur at start and
after 1 year compared with the control group. A high tendency of
TRACP-5b levels at the start was observed, however there was no
difference in TRACP-5b levels after 1 year (Fig. 1A-C).
| Table IIChange in TRACP-5b levels and
contributing factors in the MSC of TRACP-5b. |
Table II
Change in TRACP-5b levels and
contributing factors in the MSC of TRACP-5b.
| | Logistical analysis
for MSC of TRACP-5b | Comparison of
TRACP-5b between at start and after 1 year |
|---|
| Group (n) | At
startd | After 1
yeard | P-value | Odds ratio | 95% Confidence
interval | P-value |
|---|
| Female (29) | 431 (216.6) | 381.68 (143.3) | 0.374 | | | |
| Male (58) | 410.1 (203.2) | 343.9 (141.2) | 0.0016b | 1.082 | 0.422-2.773 | 0.8699 |
| Age <60 years
old (36) | 366.73 (179.3) | 313.46 (113.2) | 0.0596 | | | |
| Age ≥60 years old
(51) | 453.49 (219.3) | 387.2 (153.68) | 0.0311a | 1.083 | 0.435-2.696 | 0.8646 |
| HBeAg positive
(13) | 308.77 (119.1) | 299.23 (141.1) | 0.005b | 0.903 | 0.266-3.059 | 0.8695 |
| HBeAg negative
(74) | 438.84 (214.3) | 366.99(141) | 0.3463 | | | |
| HBcrAg positive
(45) | 412.3 (215.7) | 327.5 (129.3) | 0.0012b | 1.062 | 0.361-2.456 | 0.9014 |
| HBcrAg negative
(42) | 431.3 (210.2) | 370.3 (128.7) | 0.18 | | | |
| HBV-DNA positive
(41) | 406.97
(208.53) | 369.1 (147.86) | 0.9547 | | | |
| HBV-DNA negative
(46) | 427.4 (207.77) | 346.1 (138.3) | 0.0015b | 1.232 | 0.5-3.039 | 0.6504 |
| Bone disease
negative (33) | 356.57(115) | 364.5 (145.9) | 0.9093 | | | |
| Bone disease
positive (54) | 450.6 (237.2) | 351.58 (141.2) | 0.0007c | 2.885 | 1.044-7.972 | 0.0411a |
| Renal alteration
negative (53) | 399.8 (161.63) | 346.4 (137.69) | 0.0043b | | | |
| Renal alteration
positive (34) | 446 (264.1) | 372(150) | 0.2989 | 0.563 | 0.219-1.445 | 0.2322 |
| Naïve TAF (32) | 394.66(198) | 375.83 (142.8) | 0.8382 | | | |
| Switch ETV to TAF
(55) | 430.8 (212.8) | 346.3 (142.3) | 0.0004c | 2.222 | 0.828-5.964 | 0.1129 |
| Treatment (67) | 403 (177.2) | 339.88 (1249) | 0.002b | | | |
| Prevention
(20) | 472.24
(293.28) | 413.37 (185.2) | 0.4347 | 0.755 | 0.248-2.304 | 0.6218 |
| Albumin ≥4 g/dl
(65) | 407.42 (211.7) | 347.75 (139.6) | 0.0079b | | | |
| Albumin <4 g/dl
(22) | 453.1 (191.56) | 386.4
(8,151.19) | 0.2775 | 1.036 | 0.348-3.085 | 0.9493 |
| Platelet
≥15x104/µl over (62) | 405.7(193) | 352.14(146) | 0.0123a | | | |
| Platelet
<15x104/µl (25) | 451.38 (244.2) | 366.8 (135.59) | 0.1218 | 0.66 | 0.232-1.878 | 0.4360 |
| BMI ≥25(25) | 380(185) | 359.5 (132.8) | 0.8314 | | | |
| BMI <25(62) | 432.9(215) | 355.24 (147.2) | 0.001b | 1.843 | 0.656-5.178 | 0.2458 |
| CBMM High (57) | 387 (189.9) | 344.4 (134.14) | 0.0387 | | | |
| CBMM Low (30) | 477.9 (229.1) | 382.1 (157.78) | 0.0573 | 1.117 | 0.431-2.899 | 0.8193 |
Next, the relationship between TRACP-5b rate change
and clinical factors at the start of TAF were evaluated (Table III). Cr-eGFR, P, P1NP and TRACP-5b
were positively correlated with the TRACP-5b rate of change.
Amongst these factors, Cr-eGFR and TRACP-5b were related to the
TRCAP-5b rate of change in the multi-regression model. The change
in these factors (at the start of TAF and after 1 year) was also
evaluated in relation to the TRACP-5b rate of change (Table III). The change in P was only
related to the TRACP-5b rate of change.
| Table IIIRate of change in TRACP-5b levels and
clinical factors. |
Table III
Rate of change in TRACP-5b levels and
clinical factors.
| | Factors at start
and TRACP-5b rate of change | Change in factor
and TRACP-5b change rate |
|---|
| Factor | R | P-value | β | P-value | R | P-value | β | P-value |
|---|
| Age | -0.007 | 0.9547 | | | | | | |
| Body weight | -0.05 | 0.6609 | | | -0.148 | 0.1961 | | |
| Body mass
index | -0.132 | 0.2481 | | | | | | |
| HBsAg | -0.004 | 0.9711 | | | 0.014 | 0.9022 | | |
| HBcrAg | 0.09 | 0.4589 | | | 0.138 | 0.2679 | | |
| HBeAg | -0.129 | 0.2581 | | | 0.094 | 0.4359 | | |
| HBV-DNA | -0.081 | 0.4813 | | | -0.038 | 0.7431 | | |
| AST | 0.064 | 0.5755 | | | 0.067 | 0.5561 | | |
| ALT | 0.067 | 0.5567 | | | 0.079 | 0.4925 | | |
| Platelet | 0.06 | 0.5982 | | | -0.044 | 0.7019 | | |
| Albumin | 0.02 | 0.8607 | | | -0.001 | 0.9905 | | |
| Total
bilirubin | 0.152 | 0.1803 | | | 0.158 | 0.1645 | | |
| M2BPGi | 0.186 | 0.1384 | | | 0.14 | 0.2837 | | |
| Cr | -0.178 | 0.1168 | | | -0.022 | 0.848 | | |
| Cr-eGFR | 0.221 | 0.0498a | 0.267 | 0.003b | 0.025 | 0.8288 | | |
| Cys C | -0.145 | 0.2042 | | | 0.006 | 0.9618 | | |
| Cys C-eGFR | 0.122 | 0.2868 | | | 0.004 | 0.9743 | | |
| Sarcopenia
index | -0.035 | 0.7608 | | | -0.037 | 0.7626 | | |
| Ca | 0.069 | 0.552 | | | 0.191 | 0.1026 | | |
| P | 0.254 | 0.0244a | 0.097 | 0.3656 | 0.312 | 0.0055b | 0.312 | 0.0057b |
| Urine
protein/Cr | -0.125 | 0.3111 | | | 0.057 | 0.6601 | | |
| Urine b2MG/Cr | 0.167 | 0.1906 | | | -0.081 | 0.5436 | | |
| Lumbar BMD | -0.205 | 0.0772 | | | -0.184 | 0.1304 | | |
| Lumbar t-score | -0.213 | 0.066 | | | | | | |
| Lumbar young adult
mean | -0.208 | 0.0737 | | | | | | |
| Neck of Femur
BMD | -0.127 | 0.279 | | | 0.036 | 0.7697 | | |
| Neck of Femur
t-score | -0.15 | 0.2003 | | | | | | |
| Neck of Femur young
adult mean | -0.145 | 0.2163 | | | | | | |
| TRACP-5b | 0.532 |
<0.0001c | 0.533 | 0.0003c | | | | |
| P1NP | 0.393 | 0.0008 | -0.005 | 0.9702 | | | | |
| α-fetoprotein | 0.097 | 0.4062 | | | 0.043 | 0.7195 | | |
| PIVKA-II | -0.081 | 0.4898 | | | 0.073 | 0.5418 | | |
Changes in lumbar BMD were evaluated based on
clinical factors (Table IV). The
clinical factors were the same as in Table II. The Switch group exhibited
increased BMD only in the lumbar region, but the control group
(naïve group) did not exhibit any significant changes. Increases in
BMD were significant between the start and after 1 year, [(44 cases
exhibited increased BMD after 1 year compared with at the start].
Logistic univariate analysis showed that the switch was a
contributing factor for the increased BMD in the lumbar spine. The
Switch group did not exhibit a difference in BMD of the lumbar and
neck of the femur and TRACP-5b at the start and after 1 year
compared to the control (Fig.
1D-F). BMD in the lumbar region after 1 year in the switch
group increased more than at the start (Fig. 1D), and TRACP-5b after 1 year after
switching also decreased more than at the start (Fig. 1F).
| Table IVChange of BMD in the lumbar region
and factors contributing to the increased BMD in the lumbar
region. |
Table IV
Change of BMD in the lumbar region
and factors contributing to the increased BMD in the lumbar
region.
| | Comparison with BMD
in Lumbar | Factors
contributing to the increase in BMD in the lumbar region |
|---|
| Group (n) | At start | After 1 year | P-value | Odds ratio | 95% confidence
interval | P-value |
|---|
| Female (29) | 0.839 (0.184) | 0.861 (0.171) | 0.757 | | | |
| Male (58) | 0.94 (0.184) | 0.93 (0.211) | 0.0691 | | | |
| Age <60 years
old (36) | 0.906 (0.155) | 0.908 (0.146) | 0.896 | | | |
| Age ≥60 years old
(51) | 0.906 (0.239) | 0.906 (0.234) | 0.1428 | | | |
| HBeAg positive
(13) | 0.858 (0.157) | 0.888 (0.143) | 0.2791 | | | |
| HBeAg negative
(74) | 0.913 (0.213) | 0.91 (0.208) | 0.4752 | | | |
| HBcrAg positive
(45) | 0.925 (0.181) | 0.936 (0.177) | 0.7915 | | | |
| HBcrAg negative
(42) | 0.875 (0.243) | 0.866 (0.229) | 0.0926 | | | |
| HBV-DNA positive
(41) | 0.923 (0.202) | 0.942 (0.169) | 0.7531 | | | |
| HBV-DNA negative
(46) | 0.89 (0.211) | 0.881 (0.219) | 0.147 | | | |
| Bone disease
negative (33) | 1.046 (0.155) | 1.013 (0.173) | 0.3043 | | | |
| Bone disease
positive (54) | 0.841 (0.195) | 0.857 (0.193) | 0.3982 | | | |
| Renal alteration
negative (53) | 0.888 (0.205) | 0.876 (0.208) | 0.8126 | | | |
| Renal alteration
positive (34) | 0.935 (0.208) | 0.959 (0.178) | 0.0875 | | | |
| Naïve TAF (32) | 0.934 (0.21) | 0.933 (0.193) | 0.2086 | | | |
| Switch ETV to TAF
(55) | 0.888 (0.204) | 0.894 (0.204) | 0.0061a | 3.923 | 1.409-10.925 | 0.0089a |
| Treatment (67) | 0.898 (0.2) | 0.891 (0.194) | 0.1459 | | | |
| Prevention
(20) | 0.936 (0.235) | 0.972 (0.251) | 0.9999 | | | |
| Albumin ≥4 g/dl
(65) | 0.898 (0.208) | 0.889 (0.199) | 0.3172 | | | |
| Albumin <4 g/dl
(22) | 0.936 (0.202) | 0.913 (0.21) | 0.3061 | | | |
| Platelet count
≥15x104/µl (62) | 0.902 (0.216) | 0.913 (0.21) | 0.089 | | | |
| Platelet count
<15x104/µl (25) | 0.916 (0.181) | 0.89 (0.173) | 0.6231 | | | |
| Body mass index
≥25(25) | 1.051 (0.214) | 1.049 (0.203) | 0.8562 | | | |
| Body mass index
<25(62) | 0.846 (0.172) | 0.852 (0.171) | 0.1029 | | | |
| CBMM High (57) | 0.955 (0.213) | 0.953 (0.211) | 0.1972 | | | |
| CBMM Low (30) | 0.81 (0.155) | 0.816 (0.139) | 0.511 | | | |
Similarly, the change in BMD in the neck of the
femur was also evaluated based on several clinical factors
(Table V). Male sex, prevention
group, low albumin levels and a low BMI did not decrease BMD in the
neck of the femur after 1 year. Changes in BMD in the femoral neck
were evaluated. There were 18 cases of increased BMD (at
start-after 1 year). Logistic univariate analysis revealed that
female sex was the only factor for increased BMD in the neck of the
femur. The number of patients with increased BMD (18 cases) in the
femoral neck was less than that in the lumbar region (44 cases,
P=0.0001) and MSCs in TRACP-5b (32 cases, P=0.0289). BMD in the
femoral neck was lower in females than in males at the start and
after 1 year; however there was no difference between the start and
after 1 year in females (Fig. 1H).
BMD in the lumbar spine and TRACP-5b also showed no difference
between the start and after 1 year in females (Fig. 1G and I).
| Table VChange of BMD in the neck of femur
and factors contributing to the increased BMD in the neck of
femur. |
Table V
Change of BMD in the neck of femur
and factors contributing to the increased BMD in the neck of
femur.
| | Comparison with BMD
in the neck of femur | Factors
contributing to the in BMD in the neck of femur |
|---|
| Group (n) | At
starte | After 1
yeare | P-value | Odds ratio | 95% confidence
interval | P-value |
|---|
| Female (29) | 0.572 (0.101) | 0.574 (0.098) | 0.1193 | | | |
| Male (58) | 0.705 (0.14) | 0.667 (0.137) |
<0.0001d | 0.308 | 0.102-0.928 | 0.0364a |
| Age <60 years
old (36) | 0.702 (0.128) | 0.671 (0.11) | 0.0011b | | | |
| Age ≥60 years old
(51) | 0.629 (0.146) | 0.61 (0.142) | 0.0008c | | | |
| HBeAg positive
(13) | 0.603 (0.079) | 0.594 (0.078) |
<0.0001d | | | |
| HBeAg negative
(74) | 0.669 (0.148) | 0.642 (0.138) | 0.0467a | | | |
| HBcrAg positive
(45) | 0.693 (0.136) | 0.672 (0.117) | 0.0003c | | | |
| HBcrAg negative
(42) | 0.622 (0.156) | 0.595 (0.152) | 0.0104a | | | |
| HBV-DNA positive
(41) | 0.644 (0.121) | 0.637 (0.113) | 0.0402a | | | |
| HBV-DNA negative
(46) | 0.674 (0.159) | 0.635 (0.147) |
<0.0001d | | | |
| Bone disease
negative (33) | 0.78 (0.108) | 0.726 (0.102) | 0.0015b | | | |
| Bone disease
positive (54) | 0.604 (0.12) | 0.594 (0.124) | 0.0005c | | | |
| Renal alteration
negative (53) | 0.663 (0.1439 | 0.634 (0.134) | 0.0001d | | | |
| Renal alteration
positive (34) | 0.655 (0.142) | 0.638 (0.131) | 0.0092c | | | |
| Naïve TAF (32) | 0.647 (0.124) | 0.623 (0.122) | 0.0007c | | | |
| Switch ETV to TAF
(55) | 0.668 (0.153) | 0.643 (0.138) | 0.0012c | | | |
| Treatment (67) | 0.665 (0.134) | 0.643 (0.118) |
<0.0001d | | | |
| Prevention
(20) | 0.641 (0.175) | 0.608 (0.181) | 0.0621 | 0.782 | 0.192-3.188 | 0.7314 |
| Albumin ≥4 g/dl
(65) | 0.651 (0.149) | 0.635 (0.141) |
<0.0001d | | | |
| Albumin <4 g/dl
(22) | 0.685 (0.118) | 0.639 (0.106) | 0.2238 | 2.582 | 0.703-9.493 | 0.1531 |
| Platelet count
≥15x104/µl (62) | 0.729 (0.141) | 0.714 (0.119 |
<0.0001d | | | |
| Platelet
<15x104/µl (25) | 0.632 (0.134) | 0.606 (0.125) | 0.0457a | | | |
| Body mass index
≥25(25) | 0.729 (0.141) | 0.714 (0.119) | 0.1043 | | | |
| Body mass index
<25(62) | 0.632 (0.134) | 0.606 (0.125) |
<0.0001d | 0.357 | 0.115-1.105 | 0.074 |
| CBMM High (57) | 0.7 (0.129) | 0.678 (0.125) |
<0.0001d | | | |
| CBMM Low (30) | 0.583 (0.136) | 0.551 (0.105) | 0.0114a | | | |
Discussion
Treatment with TAF for 1 year decreased TRACP-5b
levels, especially in patients with bone disease, excluding the MSC
of TRACP-5b. The rate of change of TRACP-5b was associated with
changes in P, Cr-eGFR and TRACP-5b levels at the start of TAF.
Increased BMD in the lumbar region contributed to the switch from
ETV to TAF. Increased BMD in the neck of the femur was present in
female patients.
TRACP-5b at the start of TAF was related to the rate
of change of TRACP-5b. HBV-infected patients exhibited
hyperosteoclast function before TAF treatment. Carbon tetrachloride
induced liver damage may have increased the levels of TRACP-5b
(25), and HOD has been reported to
increase TRACP-5b levels in patients with chronic liver disease
(6). HOD is based on cirrhosis and
is caused by insufficient liver-related factors, vitamin K, vitamin
D, parathyroid hormone (PTH) and fibroblast growth factor (FGF)23
(5-7).
However, in the present study, low albumin and low platelet counts
were not contributing factors for the MSC of TRACP-5b. Previous
population-based studies have described the relationship between
HBV infection and osteoporosis (8,9). It is
speculated that HOD appears in pre-cirrhosis related to HBV.
TRACP-5b levels are reflected in osteoclast
function, number and volume (6,26), and
is a bone turnover marker and predictor of fracture-independent BMD
(27,28). High serum P was related to changes
in TRACP-5b levels, and a decrease in P for 1 year was positively
related to a decrease in TRACP-5b levels. More osteoblasts were
normalized by TAF, and bone reabsorption was recovered. As a
result, P was resorbed to the bone, and serum P decreased (6). The results showed that TAF was
effective for the amelioration of osteoclasts. Since changes in
TRACP-5b are related to fracture (11,27,28),
BMD in the lumbar and neck of the femur was not improved by TAF;
thus whether TAF could prevent fractures will be the focus of
future studies.
BMD in the neck of the femur decreased during the
observation period. A previous study described mean hip BMD at 1
year after TAF treatment was lower than that at the start of
treatment, but less than 1 year after TDF treatment (12-14).
There was no control after 1 year; however, BMD in the lumbar spine
and TRACP-5b did not worsen after 1 year. There were 18 cases of
increased BMD in the femur, less than the number of cases of
increased BMD in the lumbar (44 cases) and MSC (32 cases) groups.
Females exhibited increased BMD in the femoral neck, and TRACP-5b
did not decrease after 1 year. Differences between the femur and
lumbar vertebrae in patients with CHB treated with TAF will
continue to be observed in the future.
Increased Cr and decreased Cr-eGFR were observed
after 1 year of TAF treatment. However, CysC and CysC eGFR were not
altered significantly during the treatment period. The SI indicates
muscle volume and prognosis in patients in the intensive care unit
(23). SI elevation reflects an
increase in Cr, whilst CysC remains unchanged, and this is
indicative of muscle volume gain. Changes in muscle mass should
also be evaluated in future studies. Urine protein/creatinine ratio
was elevated after 1 year, but the β2MG/creatinine ratio did not
differ during the observational period. Previous reports did not
identify the adverse effects of TAF on the kidney (14-17).
In contrast to previous reports, the prevention group in the
present study (20 cases) were treated with anticancer agents and/or
immunosuppressants at the start of TAF administration, and this was
continued after 1 year. It is hypothesized that there is a
relationship between concomitant drug use with TAF and
proteinuria.
Switching ETV to TAF was a contributing factor in
the increased BMD in the lumbar spine. The Switch group showed
decreased TRACP-5b levels. TAF treatment resulted in less BMD loss
than TDF treatment (12-14),
but BMD gain was not observed. In the switch from ETV to TAF, BMD
was not changed after 48 weeks in a previous report (17), and there was no significant increase
in the incidence of osteoporosis/osteopenia in patients with CHB
treated with TDF or ETV compared to those without treatment
(29). It may seem that reduced BMD
may be partly due to underlying chronic liver disease, and several
patients with CHB may already have pre-existing low BMD prior to
commencing antiviral therapy (8,9,30).
Long-term observations are required to explore the anti-HBV effects
of NAs and BMD.
The present study has some limitations. This was a
single-center, small retrospective study, including prevention and
a 1 year observational analysis. Thus, it was not possible to
evaluate HOD-related bone related hormones, such as FGF23, PTH,
vitamin D and vitamin K. The protective effects of TAF on renal
function has been now widely established (3,12).
However, it may be possible to ascertain additional useful
information regarding the relationship between HBV infection and
bone metabolism.
In conclusion, patients with HBV infection
complicated by bone disease exhibited decreased TRACP-5b levels
after treatment with TAF. Switching ETV to TAF increased BMD in the
lumbar spine and decreased the TRAC-5b levels. TAF is acceptable
for improving/maintaining bone metabolism in patients with HBV
infection, and TRACP-5b was shown to be a useful bone metabolic
marker, especially when attempting to prevent fractures in patients
with HBV.
Acknowledgements
Not applicable.
Funding
Funding: No funding was received.
Availability of data and materials
The datasets used and/or analyzed during the present
study are available from the corresponding author on reasonable
request.
Authors' contributions
TO and TIc wrote the manuscript, analyzed the data
and designed the study. HM, SM, YM, MY, SY, MK, TH, HY, TIk, OM,
YK, YN, NT and KN collected the data. All authors have read and
approved the final manuscript. KN and NT confirm the authenticity
of all the raw. data.
Ethics approval and consent to
participate
The present study was approved by the Human Research
Ethics Committee of the Nagasaki Harbor Medical Center (approval
no. H30-031). Informed consent was obtained from each patient
included in the study, and the patients were guaranteed the right
to leave the study if they desired.
Patient consent for publication
Not applicable.
Competing interests
The authors declare that they have no competing
interests.
References
|
1
|
Papatheodoridis G, Buti M, Cornberg M,
Janssen H, Mutimer D, Pol S and Raimondo G: EASL clinical practice
guidelines: Management of chronic hepatitis B virus infection. J
Hepatol. 57:167–185. 2012.PubMed/NCBI View Article : Google Scholar
|
|
2
|
Raffetti E, Fattovich G and Donato F:
Incidence of hepatocellular carcinoma in untreated subjects with
chronic hepatitis B: A systematic review and meta-analysis. Liver
Int. 36:1239–1251. 2016.PubMed/NCBI View Article : Google Scholar
|
|
3
|
Lampertico P, Agarwal K, Berg T, Buti M,
Janssen HLA, Papatheodoridis G, Zoulim F and Tacke F: EASL 2017
clinical practice guidelines on the management of hepatitis B virus
infection. J Hepatol. 67:370–398. 2017.PubMed/NCBI View Article : Google Scholar
|
|
4
|
Si J, Yu C, Guo Y, Bian Z, Qin C, Yang L,
Chen Y, Yin L, Li H, Lan J, et al: Chronic hepatitis B virus
infection and risk of chronic kidney disease: A population-based
prospective cohort study of 0.5 million Chinese adults. BMC Med.
16(93)2018.PubMed/NCBI View Article : Google Scholar
|
|
5
|
Rouillard S and Lane NE: Hepatic
osteodystrophy. Hepatology. 33:301–307. 2001.PubMed/NCBI View Article : Google Scholar
|
|
6
|
Ehnert S, Aspera-Werz RH, Ruoß M, Dooley
S, Hengstler JG, Nadalin S, Relja B, Badke A and Nussler AK:
Hepatic osteodystrophy-molecular mechanisms proposed to favor its
development. Int J Mol Sci. 20(2555)2019.PubMed/NCBI View Article : Google Scholar
|
|
7
|
Leslie WD, Bernstein CN and Leboff MS:
American Gastroenterological Association Clinical Practice
Commitee. AGA technical review on osteoporosis in hepatic
disorders. Gastroenterology. 125:941–966. 2003.PubMed/NCBI View Article : Google Scholar
|
|
8
|
Chen CH, Lin CL and Kao CH: Association
between chronic hepatitis B virus infection and risk of
osteoporosis: A nationwide population-based study. Medicine
(Baltimore). 94(e2276)2015.PubMed/NCBI View Article : Google Scholar
|
|
9
|
Baeg MK, Yoon SK, Ko SH, Han KD, Choi HJ,
Bae SH, Choi JY and Choi MG: Males seropositive for hepatitis B
surface antigen are at risk of lower bone mineral density: The
2008-2010 Korea national health and nutrition examination surveys.
Hepatol Int. 10:470–477. 2016.PubMed/NCBI View Article : Google Scholar
|
|
10
|
Shimizu T, Arita K, Murota E, Hiratsuka S,
Fujita R, Ishizu H, Asano T, Takahashi D, Takahata M and Iwasaki N:
Effects after starting or switching from bisphosphonate to
romosozumab or denosumab in Japanese postmenopausal patients. J
Bone Miner Metab. 39:868–875. 2021.PubMed/NCBI View Article : Google Scholar
|
|
11
|
Miller PD, Hochberg MC, Wehren LE, Ross PD
and Wasnich RD: How useful are measures of BMD and bone turnover?
Curr Med Res Opin. 21:545–554. 2005.PubMed/NCBI View Article : Google Scholar
|
|
12
|
Agarwal K, Brunetto M, Seto WK, Lim YS,
Fung S, Marcellin P, Ahn SH, Izumi N, Chuang WL, Bae H, et al: 96
weeks treatment of tenofovir alafenamide vs tenofovir disoproxil
fumarate for hepatitis B virus infection. J Hepatol. 68:672–681.
2018.PubMed/NCBI View Article : Google Scholar
|
|
13
|
Seto WK, Asahina Y, Brown TT, Peng CY,
Stanciu C, Abdurakhmanov D, Tabak F, Nguyen TT, Chuang WL, Inokuma
T, et al: Improved bone safety of tenofovir alafenamide compared to
tenofovir disoproxil fumarate over 2 years in patients with chronic
HBV infection. Clin Gastroenterol Hepatol, Jun 20, 2018 (Online
ahead of print).
|
|
14
|
Chan HL, Fung S, Seto WK, Chuang WL, Chen
CY, Kim HJ, Hui AJ, Janssen HL, Chowdhury A, Tsang TY, et al:
Tenofovir alafenamide versus tenofovir disoproxil fumarate for the
treatment of HBeAg-positive chronic hepatitis B virus infection: A
randomised, double-blind, phase 3, non-inferiority trial. Lancet
Gastroenterol Hepatol. 1:185–195. 2016.PubMed/NCBI View Article : Google Scholar
|
|
15
|
Ogawa E, Nomura H, Nakamuta M, Furusyo N,
Koyanagi T, Dohmen K, Ooho A, Satoh T, Kawano A, Kajiwara E, et al:
Tenofovir alafenamide after switching from entecavir or
nucleos(t)ide combination therapy for patients with chronic
hepatitis B. Liver Int. 40:1578–1589. 2020.PubMed/NCBI View Article : Google Scholar
|
|
16
|
Notsumata K, Nomura Y, Tanaka A, Ueda T,
Sanada T, Watanabe H and Toya D: Early changes in tubular
dysfunction markers and phosphorus metabolism regulators as a
result of switching from entecavir to tenofovir alafenamide
fumarate nucleoside analog therapy for chronic hepatitis B
patients. Hepatol Res. 50:402–404. 2020.PubMed/NCBI View Article : Google Scholar
|
|
17
|
Hagiwara S, Nishida N, Ida H, Ueshima K,
Minami Y, Takita M, Komeda Y and Kudo M: Switching from entecavir
to tenofovir alafenamide versus maintaining entecavir for chronic
hepatitis B. J Med Virol. 91:18040–1810. 2019.PubMed/NCBI View Article : Google Scholar
|
|
18
|
Uchida Y, Nakao M, Tsuji S, Uemura H,
Kouyama JI, Naiki K, Motoya D, Sugawara K, Nakayama N, Imai Y, et
al: Significance of switching of the nucleos(t)ide analog used to
treat Japanese patients with chronic hepatitis B virus infection
from entecavir to tenofovir alafenamide fumarate. J Med Virol.
92:329–338. 2020.PubMed/NCBI View Article : Google Scholar
|
|
19
|
Tamaki N, Kurosaki M, Nakanishi H, Itakura
J, Inada K, Kirino S, Kirino S, Yamashita K, Osawa L, Sekiguchi S,
et al: Comparison of medication adherence and satisfaction between
entecavir and tenofovir alafenamide therapy in chronic hepatitis B.
J Med Virol. 92:1355–1358. 2020.PubMed/NCBI View Article : Google Scholar
|
|
20
|
Shephard DA: The 1975 declaration of
Helsinki and consent. Can Med Assoc J. 115:1191–1192.
1976.PubMed/NCBI
|
|
21
|
Assessment of fracture risk and its
application to screening for postmenopausal osteoporosis. Report of
a WHO study group. World Health Organ Tech Rep Ser. 843:1–129.
1994.PubMed/NCBI
|
|
22
|
Matsuo S, Imai E, Horio M, Yasuda Y,
Tomita K, Nitta K, Yamagata K, Tomino Y, Yokoyama H and Hishida A:
Collaborators developing the Japanese equation for estimated GFR.
Revised equations for estimated GFR from serum creatinine in Japan.
Am J Kidney Dis. 53:982–992. 2009.PubMed/NCBI View Article : Google Scholar
|
|
23
|
Kashani KB, Frazee EN, Kukrálová L,
Sarvottam K, Herasevich V, Young PM, Kashyap R and Lieske JC:
Evaluating muscle mass by using markers of kidney function:
Development of the sarcopenia index. Crit Care Med. 45:e23–e29.
2017.PubMed/NCBI View Article : Google Scholar
|
|
24
|
Kim SW, Jung HW, Kim CH, Kim K, Chin HJ
and Lee H: A new equation to estimate muscle mass from creatinine
and cystatin C. PLoS One. 11(e0148495)2016.PubMed/NCBI View Article : Google Scholar
|
|
25
|
Spirlandeli AL, Dick-de-paula I, Zamarioli
A, Jorgetti V, Ramalho LNZ, Nogueira-Barbosa MH, Volpon JB, Jordão
AA, Cunha FQ, Fukada SY and de Paula FJA: Hepatic osteodystrophy:
The mechanism of bone loss in hepatocellular disease and the
effects of pamidronate treatment. Clinics (Sao Paulo). 72:231–237.
2017.PubMed/NCBI View Article : Google Scholar
|
|
26
|
Lv Y, Wang G, Xu W, Tao P, Lv X and Wang
Y: Tartrate-resistant acid phosphatase 5b is a marker of osteoclast
number and volume in RAW 264.7 cells treated with
receptor-activated nuclear κB ligand. Exp Ther Med. 9:143–146.
2015.PubMed/NCBI View Article : Google Scholar
|
|
27
|
Ivaska KK, Gerdhem P, Väänänen HK, Akesson
K and Obrant KJ: Bone turnover markers and prediction of fracture:
A prospective follow-up study of 1040 elderly women for a mean of 9
years. J Bone Miner Res. 25:393–403. 2010.PubMed/NCBI View Article : Google Scholar
|
|
28
|
Kasai H, Mori Y, Ose A, Shiraki M and
Tanigawara Y: Prediction of fracture risk from early-stage bone
markers in patients with osteoporosis treated with once-yearly
administered zoledronic acid. J Clin Pharmacol. 61:606–613.
2021.PubMed/NCBI View Article : Google Scholar
|
|
29
|
Wei MT, Le AK, Chang MS, Hsu H, Nguyen P,
Zhang JQ, Wong C, Wong C, Cheung R and Nguyen MH: Antiviral therapy
and the development of osteopenia/osteoporosis among Asians with
chronic hepatitis B. J Med Virol. 91:1288–1294. 2019.PubMed/NCBI View Article : Google Scholar
|
|
30
|
Fung J, Seto W, Lai C and Yuen M:
Extrahepatic effects of nucleoside and nucleotide analogues in
chronic hepatitis B treatment. J Gastroenterol Hepatol. 29:428–434.
2014.PubMed/NCBI View Article : Google Scholar
|