The incidence of renal cell carcinoma (RCC) has
increased in past decades: RCC accounts for 2-3% of adult
malignancies worldwide and is the 14th most common type of solid
cancer, with 431,288 new cases reported in 2020(1). The dominant subtype is clear cell
(cc)RCC (2). Immune checkpoint
inhibitors (ICIs) that target programmed death receptor-1 (PD-1) on
T cells have been widely used to treat advanced renal cancer
(3-11).
Tyrosine kinase inhibitors of vascular endothelial growth factors
combined with ICIs have been approved as first- and subsequent-line
therapies for advanced ccRCC (3-8).
ICI combination (9) is recommended
as first- and subsequent-line therapy for advanced ccRCC and ICI
monotherapy (10) has been
recommended as subsequent-line therapy by The National
Comprehensive Cancer Network. In addition, ICIs have been
investigated as adjuvant therapy options for ccRCC with positive
results (11). The overall response
rate of first-line therapies is 42.0-59.3% (5,7-9).
Although the overall response rate is higher than that of
traditional options, such as chemotherapy or radiotherapy, numerous
patients do not benefit from these therapies. Therefore, screening
of the targeted population and detection of ICI resistance is
key.
The tumor microenvironment (TME) is associated with
poor prognosis in patients with numerous types of cancer [renal
cell carcinoma (12), non-small
cell lung cancer (13), Liver
Cancer (14), and so on]. TME
involves the recruitment of immunosuppressive cells, such as
regulatory T (Treg) and myeloid-derived suppressor cells and
tumor-associated macrophages (15-18).
Multiple mechanisms of Treg-mediated immunosuppression have been
described, including cell contact-dependent and humoral
factor-mediated mechanisms, that involve a range of molecules, such
as cell surface molecules [programmed death (PD)-1, Programmed
death-ligand 1(PD-L1), Cytotoxic T-lymphocyte-associated antigen 4
(CTLA-4), CD25, T cell immunoreceptor with Ig and ITIM domains
(TIGIT), CD39 and CD73], cytokines (IL-2, IL-10, TGF-β and IL-35)
and secreted or intracellular molecules (granzyme, cyclic AMP and
Indoleamine 2,3-dioxygenase)] (19).
Cytoplasmic polyadenylation element binding protein
3 (CPEB3), a member of the CPEB family (27), has a tumor-suppressive effect in
numerous types of cancers, such as gastric cancer (28) and esophageal squamous cell carcinoma
(29). Particularly in colorectal
cancer, CPEB3 is involved in crosstalk between colorectal cancer
cells and tumor-associated macrophages by targeting IL-6
receptor/STAT3 signaling (30).
However, the exact role and underlying mechanism of CPEB3 in ccRCC
progression remain poorly characterized. The present study examined
the expression of CPEB3 in ccRCC tissue to provide insights into
the inhibition of Treg infiltration in TME.
ccRCC tissue microarrays (TMAs; HKidE180Su03) were
obtained from Shanghai Xinchao Biological Technology Co. Ltd.
HKidE180Su03 contains 90 pairs of ccRCC and matched paracancerous
tissue that were used for immunohistochemistry (IHC) analysis.
Outdo BioTech also provided the detailed clinicopathological
characteristics of cohorts. The Clinical Research Ethics Committee
of Outdo BioTech granted ethical approval for the study of the TMAs
(Shanghai, China; approval no. SHYJS-CP-1707003).
IHC staining was performed on TAMs to detect protein
expression levels of CPEB3. In brief, tissue samples were fixed in
4% paraformaldehyde for 8 h at room temperature, then embedded in
paraffin and sliced into 3-µm thick sections. Sections were
deparaffinized with xylene at room temperature for 30 min and
rehydrated using a descending ethanol series Sections were heated
in a water bath at 95˚C with Dako Target Retrieval Solution (Code
S1699; Agilent Technologies, Inc.) for 20 min. Sections were then
treated with 3% hydrogen peroxide in methanol to quench the
endogenous peroxidase activity, followed by incubation with normal
goat serum (10%; Beijing Biosynthesis Biotechnology Co., Ltd.) for
10 min at room temperature to block the nonspecific binding.
Sections were incubated with rabbit polyclonal CPEB3 antibody
(1:100; cat. no. ab10883; Abcam) for overnight at 4˚C, followed by
application of a secondary antibody [1:1,000; Peroxidase AffiniPure
Goat Anti-Rabbit IgG (H+L); cat. no. 111-035-003; Jackson
ImmunoResearch Laboratories, Inc.] for 40 min at 37˚C. DAB) was
used as the chromogenic substrate and the sections were
counterstained with hematoxylin for 1 min at 20˚C. Positive
controls were performed in each experiment. negative controls were
performed in the same condition without primary antibodies. Full
slide images were reviewed and evaluated by two pathologists under
a light microscope (Aperio XT; Leica biosystems; magnification,
x40).
Immunostaining intensity ranged from weak to strong
as follows: 0, no staining; 1 (weak staining), 2 (low to moderate
staining), 3 (moderate staining) or 4, strong staining). The final
score was calculated as proportion of CPEB3-positive cells
multiplied by staining intensity. Tumors were divided in high- or
low-expression groups based on a final score ≥300 or <300,
respectively. Each sample was independently assessed by two
experienced pathologists, with a third pathologist making the final
decision in case of disagreement.
Expression levels of CPEB3 were compared between
normal and tumor tissues using the Stat package (version 4.2.1)
(https://www.r-project.org/). Total
protein expression of CPEB3 and its methylation levels in ccRCC
were also identified using the UALCAN database (36,37).
The Stat package was used to identify co-expressed genes.
Furthermore, after dividing the samples into groups based on the
median expression of CPEB3 (cut-off value, 2.2454), differentially
expressed genes were identified using DESeq2 (version 1.36.0)
(38) with the following threshold
parameters: Log-fold change absolute value >1.5 and P<0.05.
The results were visualized using ggplot2 package (version 3.3.6)
(39).
To detect whether CPEB3 expression influences immune
cell infiltration, status of 24 types of infiltrating immune cells
(46) in ccRCC was determined using
the gene set variation analysis package (version 1.46.0) (47). Tumor Immune System Interaction
database was used to determine the relationship between abundance
of tumor-infiltrating lymphocytes and expression of CPBE3. The
immune-associated signatures of tumor-infiltrating lymphocytes were
obtained from the study by Charoentong et al (48). Association between Tregs and CPEB3
was assessed using TIMER2.0 (timer.cistromen.org/) (49). Associations between CPEB3 and immune
checkpoints [including CD274, B and T lymphocyte attenuator,
lymphocyte-activation gene3 (LAG3) and CTLA] cell markers (such as
FOXP3) were analyzed using the ggplot2 package.
CPEB3 expression and OS was analyzed by Kaplan-Meier
survival curves, a log-rank test and univariate and multivariate
Cox regression models. Survival package (version 3.3.1) (50) was used for subgroup analysis and
forest plots were constructed using ggplot2. Survival package was
used to generate the Kaplan-Meier overall survival (OS) and
disease-specific survival (DSS) curves for ccRCC. Associations
between CPEB3 expression and clinical features were assessed using
ggplot2. Receiver operating characteristic (ROC) curves were
constructed using the pROC package (version 1.18.0.) (51) to determine whether CPEB3 could be a
tumor prediction index. Rms (version 6.3.0; cran.r-project.org/web/packages/rms/index.html) and
survival packages were used to construct the nomogram.
Mann-Whitney U test was used to compare the
difference in expression of CPEB3 between normal tissue and tumors
in pan-cancer. The significance of clinicopathological variables
for survival was analyzed using the univariate and multivariate Cox
proportional hazards method. The Mann-Whitney U test was also used
to compare expression of CPEB3 in immune cells. Paired t test was
used to analyze the expression of CPEB3 in paired samples of ccRCC.
The chi-square test was used for comparisons of CPEB3 expression in
clinicopathological features. Data are presented as the mean ± SEM.
Hypergeometric distribution test was used for GO/KEGG analysis.
Permutation test calculated the likelihood of occurrence of the
observed enrichment score (ES). Cox regression analysis and
Kaplan-Meier method with long-rank test were used for prognostic
analysis of CPEB3. The Shapiro-Wilk normality test was performed to
evaluate the normality and then Pearson or Spearman correlation was
utilized to calculate correlation coefficients. All statistical
analyses of bioinformatics data were performed using R programming
language. P<0.05 was considered to indicate a statistically
significant difference.
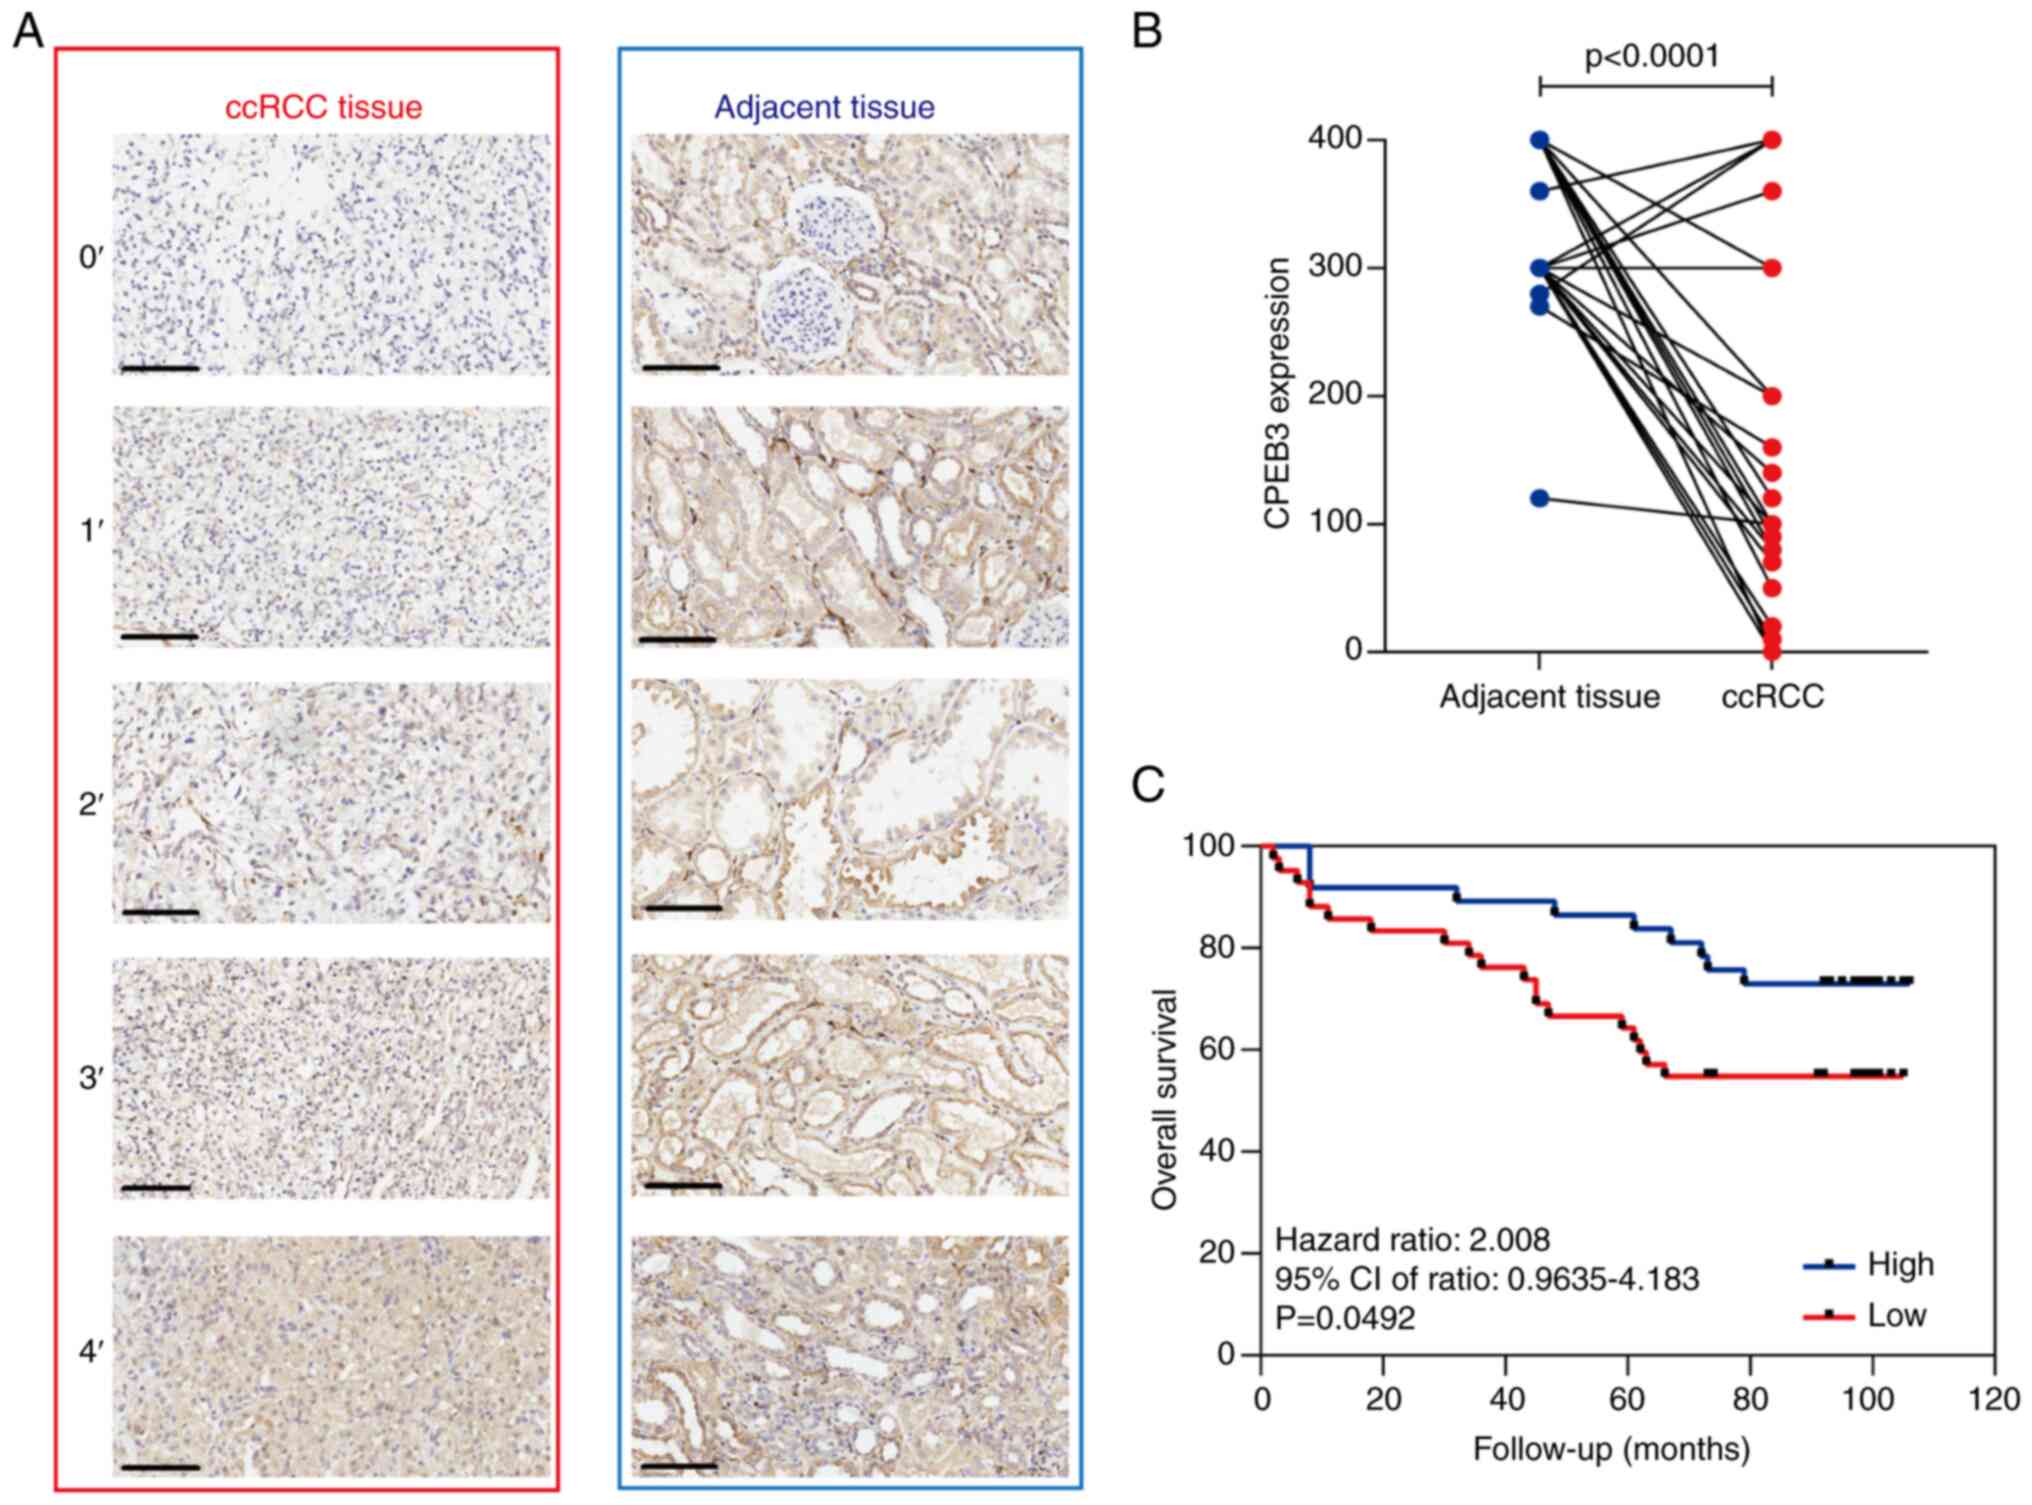
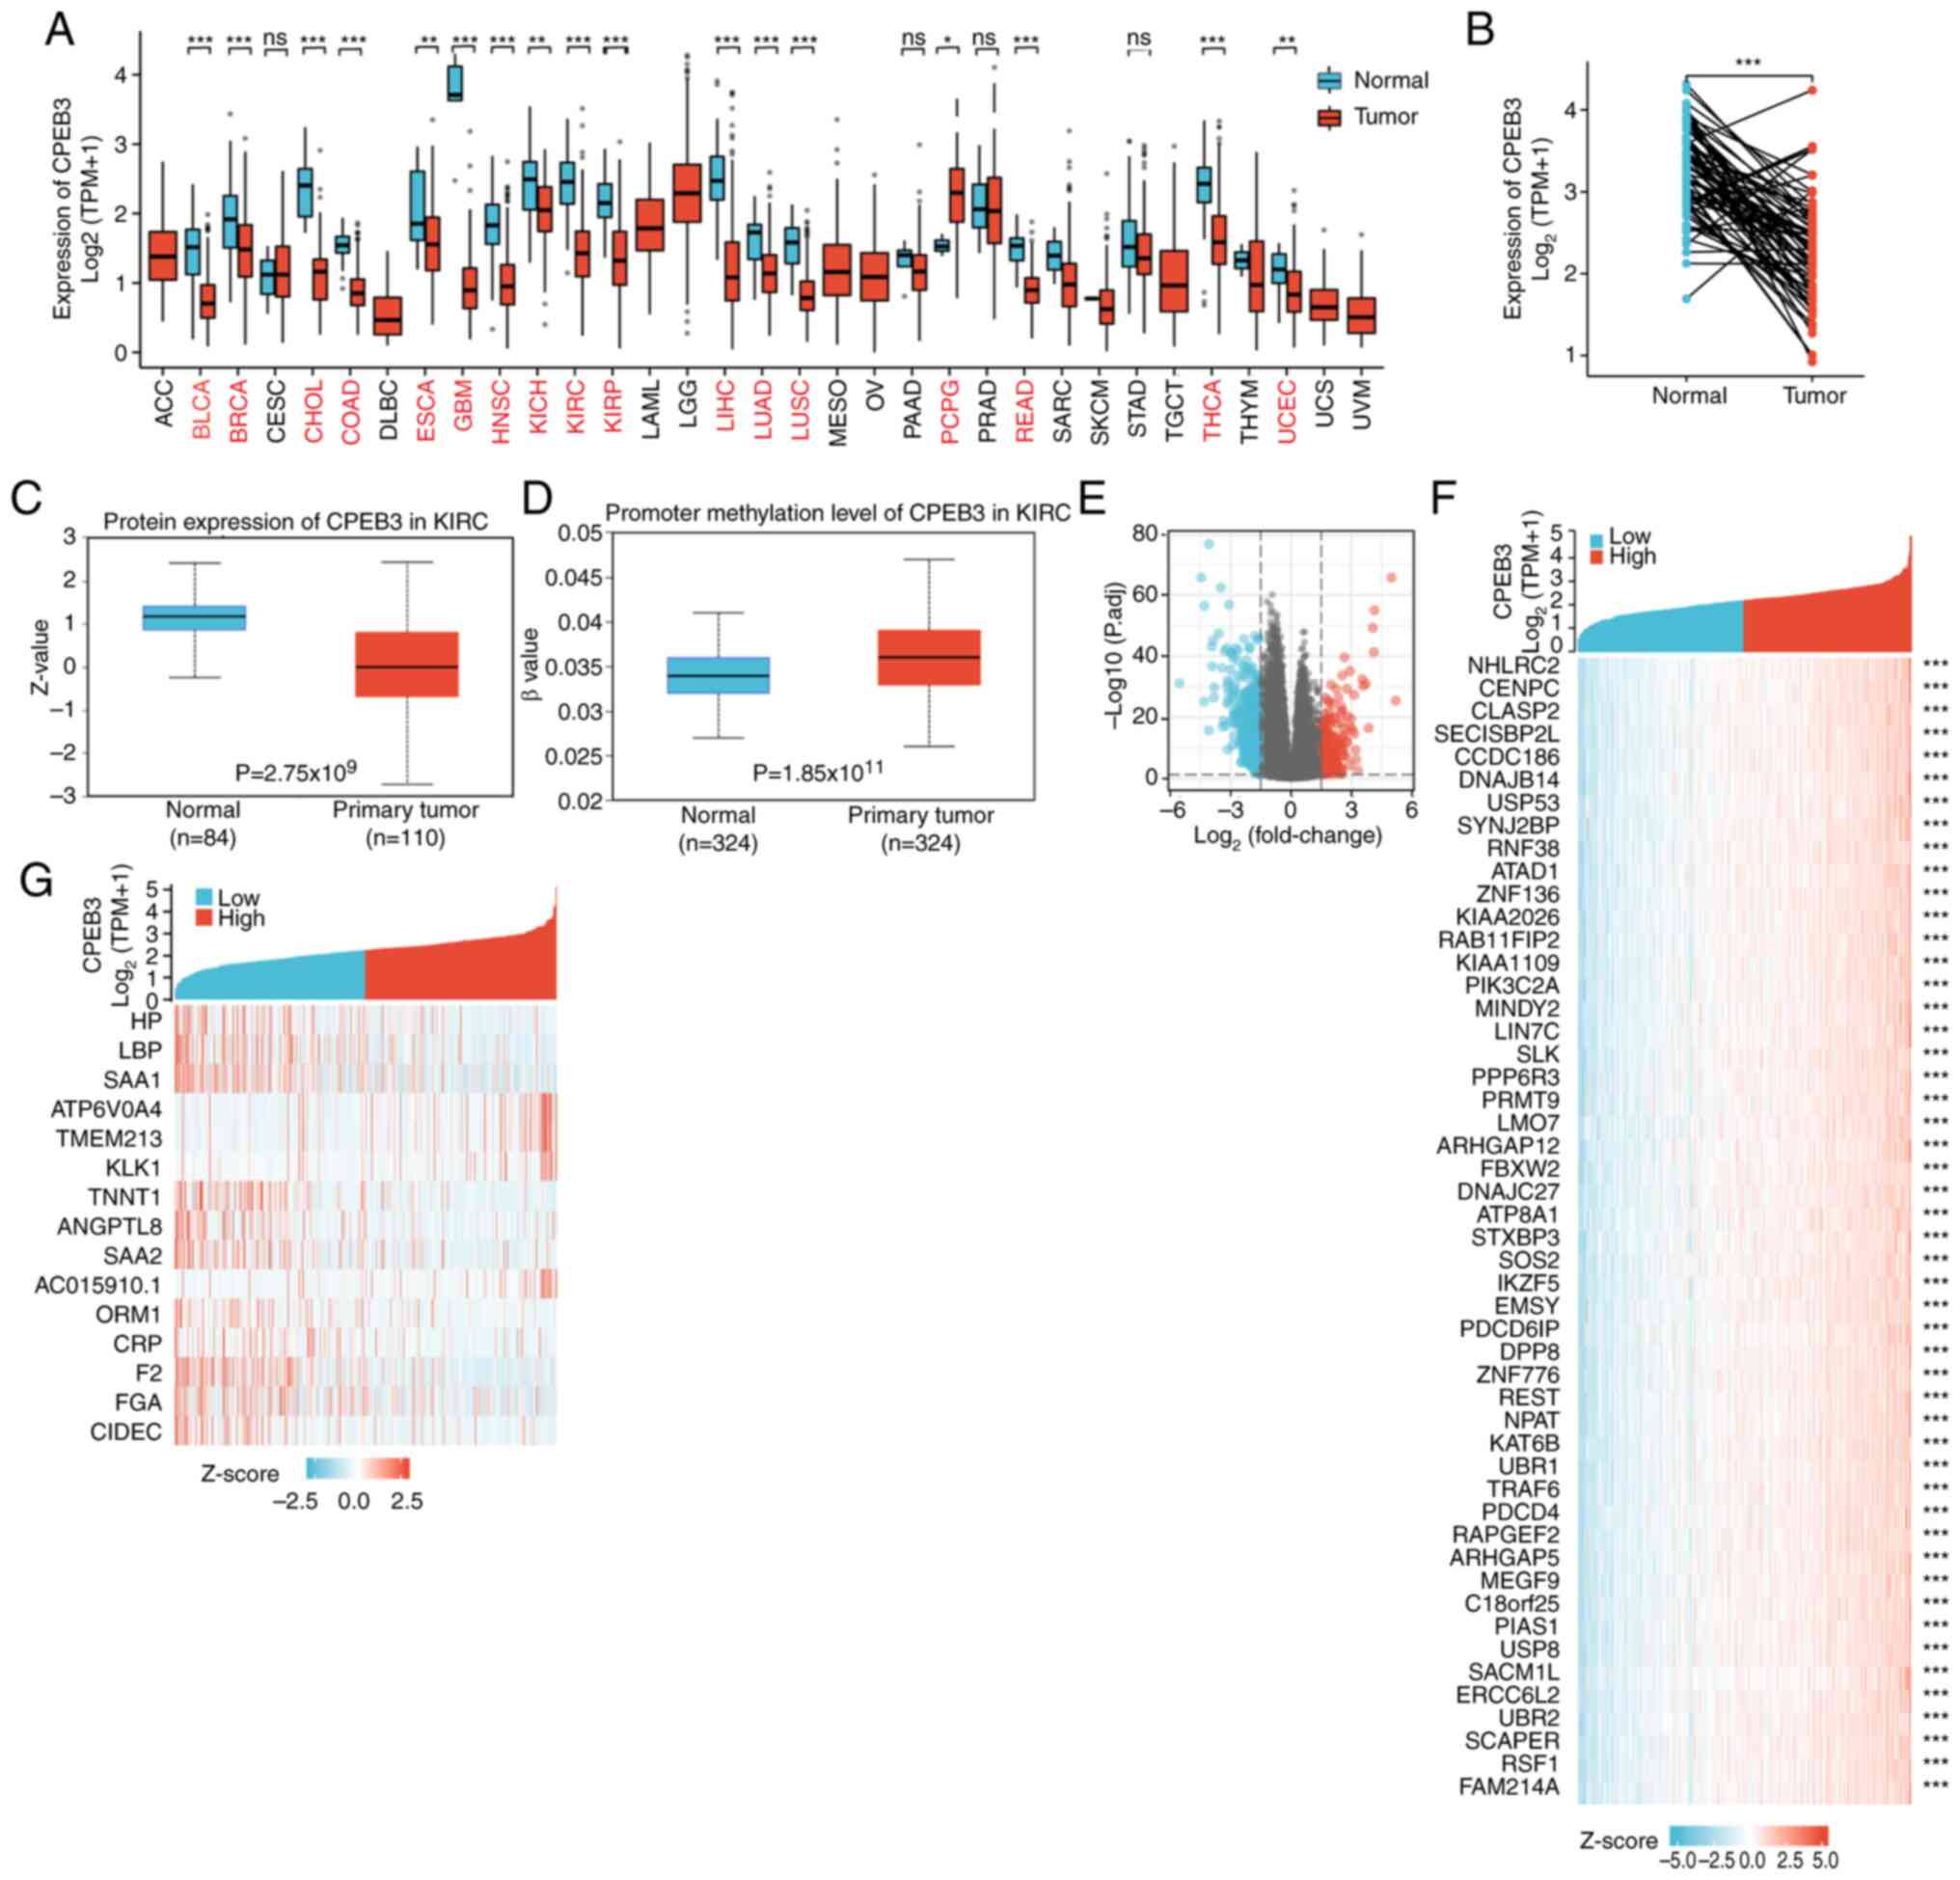
CPEB3 expression was examined using IHC in 81 pairs
of human ccRCC and adjacent non-cancerous tissue samples (Fig. 1A). CPEB3 staining was observed only
in the cytoplasm of the cells. High CPEB3 expression was observed
in 96.3% (78/81) of normal renal and 30.9% (25/81) of the ccRCC
tissue samples (Fig. 1B). ccRCC
expression was not associated with sex, age, distant metastasis,
tumor stage, histological grade or lymph node metastasis (Table SI).
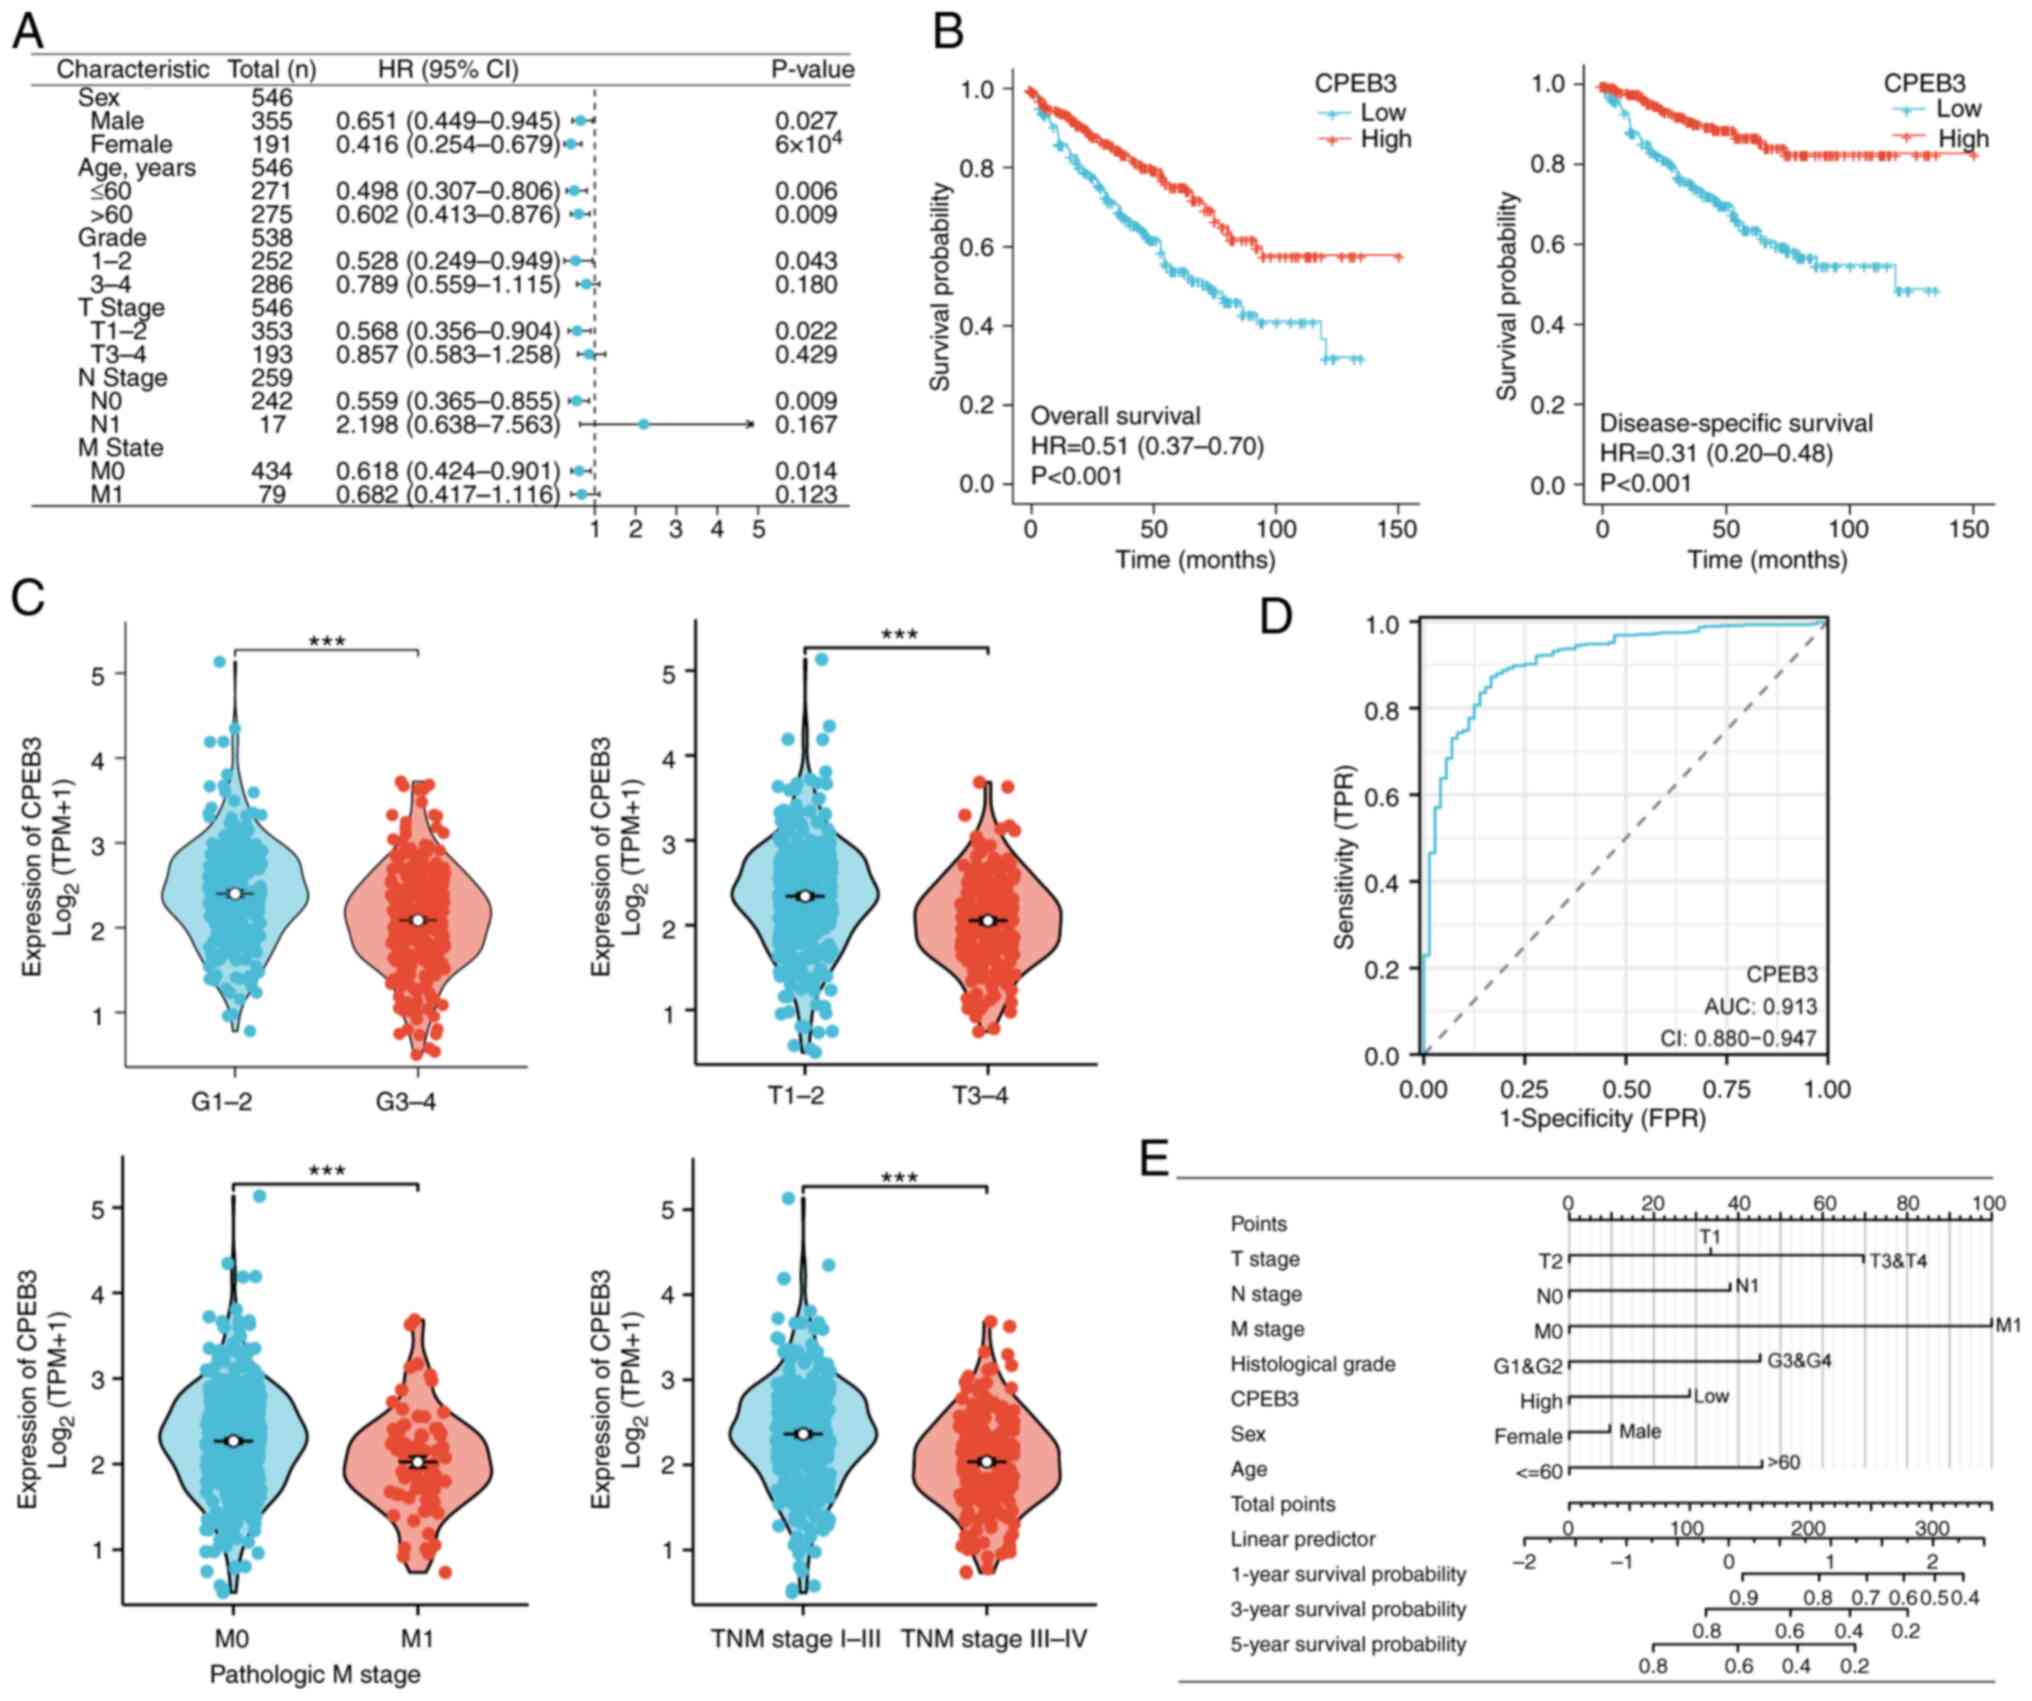
To determine the prognostic value of CPEB3
expression, association between CPEB3 expression and OS was
analyzed by Kaplan-Meier survival curves, a log-rank test and
univariate and multivariate Cox regression models. The median
follow-up time was 93 months (range, 2-106 months), and 64.4% of
the patients were alive without evidence of disease. Compared with
high CPEB3 expression, low expression was associated with shorter
OS (Fig. 1C). To identify the
clinicopathological variables associated with survival time,
univariate analysis (sex, age, tumor size, T, N and M stage, tumor
grade and CPEB3 expression) was performed. Differences in prognosis
were expressed as hazard ratios (HR) and P-values. Univariate
analysis demonstrated that age, tumor size, T, N and M stage, tumor
grade and CPEB3 expression were significant predictors of OS
(Table II). The relative
importance of each variable was determined using multivariate Cox
proportional hazards analysis. Multivariate analysis showed that
age, T and N stage and CPEB3 expression were independent predictors
of OS. Patients with low CPEB3 expression had a 3.57-time higher
risk of death than those with high expression (HR, 0.28, 95% CI,
0.091-0.865; Table II).
By setting the threshold of absolute log fold-change
to >1.5 and P-value <0.05, 897 genes were identified as
differentially expressed; 652 of these were downregulated and 245
were upregulated (Fig. 2E). The top
15 differentially and 50 co-expressed genes (most significant) are
presented in a heat map (Fig. 2F
and G).
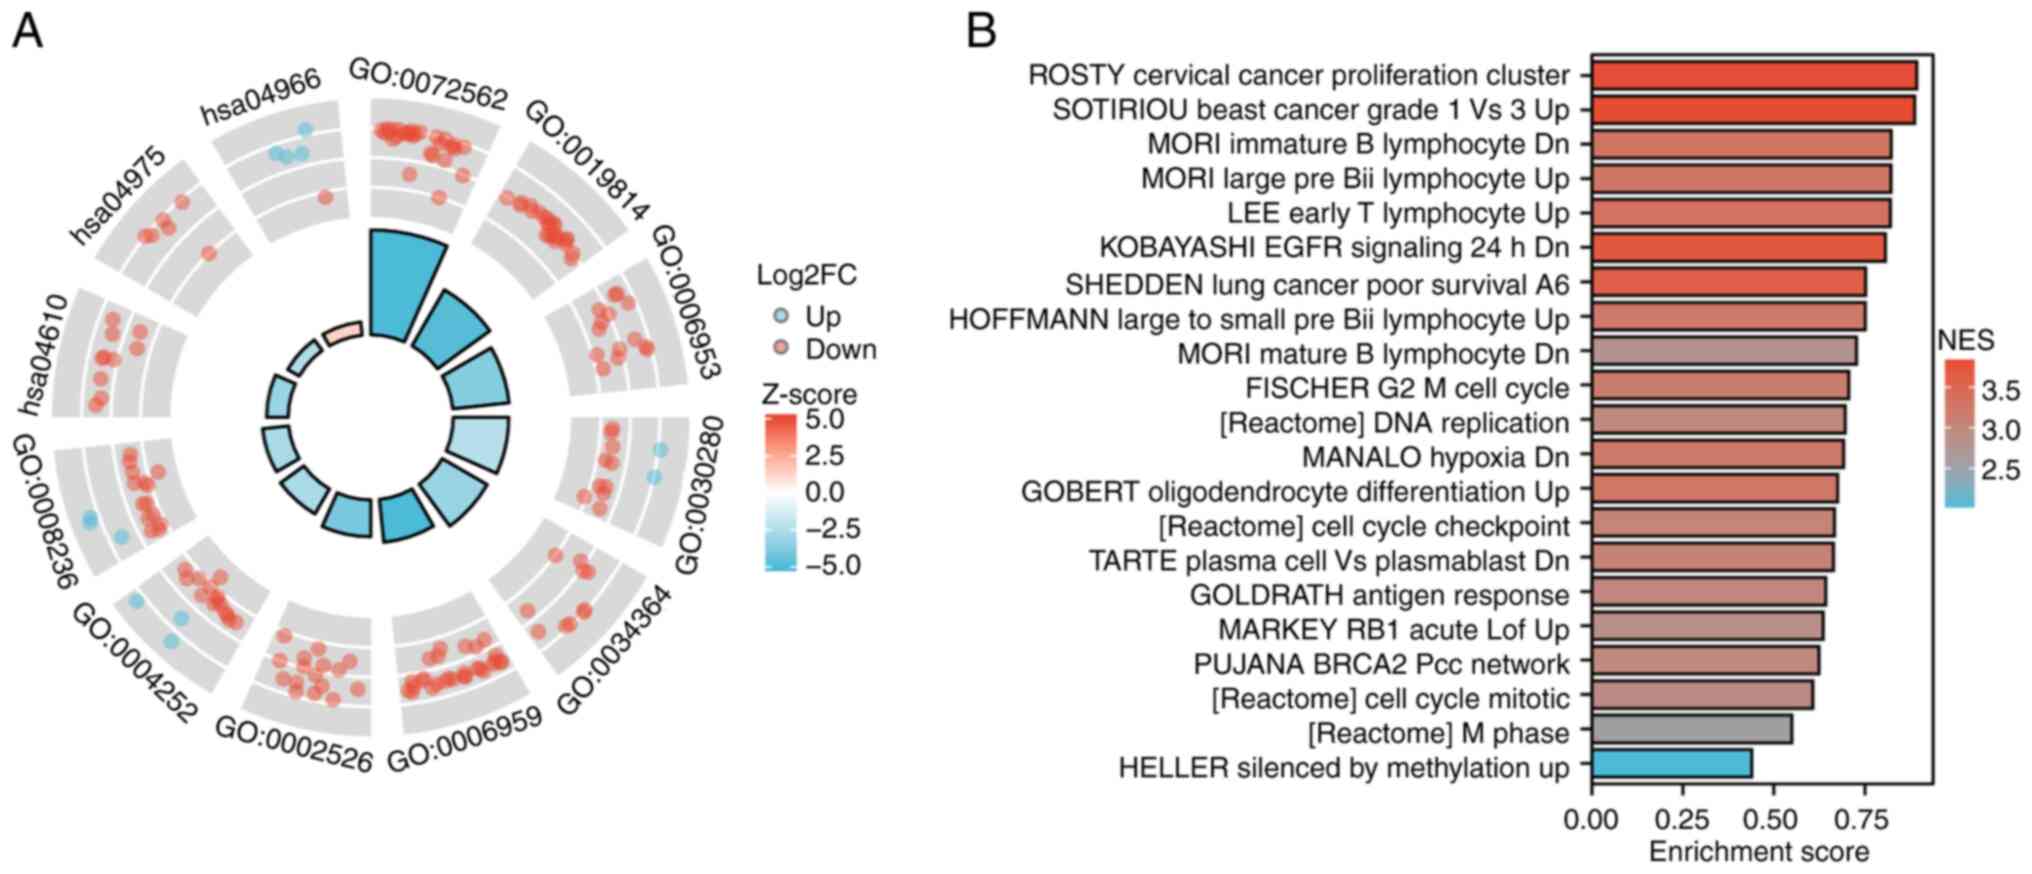
Biological functions and related pathways of CPEB3
were investigated by GO and KEGG analysis of differentially
expressed genes (Fig. 3A; Table SII). BPs included ‘acute-phase
response’, ‘humoral immune response’ and ‘acute inflammatory
response’; CCs included ‘blood microparticle’, ‘immunoglobulin
complex’ and ‘high-density lipoprotein particle’; MFs included
‘structural constituent of skin epidermis’, ‘serine-type
endopeptidase activity’ and ‘serine-type peptidase activity’. A
total of three KEGG pathways were enriched: ‘Complement and
coagulation cascades’, ‘fat digestion and absorption’ and
‘collecting duct acid secretion’. GSEA was used to explore the
possible mechanisms affected by CPEB3 (Fig. 3B). The differentially expressed
genes were associated with ROSTY Cervical Cancer Proliferation
Cluster, SOTIRIOUS Breast Cancer Grade 1 vs. 3 Up, MORI Immature B
Lymphocyte Dn, MORI Large Pre Bii Lymphocyte Up, LEE Early T
Lymphocyte Up, KOBAYASHI EGFR Signaling 24 h Dn, SHEDDEN Lung
Cancer Poor Survival A6, HOFFMANN Large To Small Pre Bii Lymphocyte
Up, MORI Mature B Lymphocyte Dn, FISCHER G2/M Cell Cycle,
[Reactome] DNA replication, MANALO Hypoxia Dn, GOBERT
Oligodendrocyte Differentiation Up, [Reactome] Cell Cycle
Checkpoints, TARTE Plasma Cell vs. Plasmablast Dn, GOLDRATH Antigen
Response, MARKEY RB1 Acute Lof Up, PUJANA BRCA2 Pcc Network,
[Reactome] Cell Cycle Mitotic, [Reactome] M Phase, HELLER Silenced
By Methylation Up.
A total of 24 types of infiltrating immune cells
influenced by CPEB3 expression in ccRCC were assessed (Fig. 4A). Among all cell types, negatively
correlated infiltrating immune cells were activated DC, B,
cytotoxic, natural killer CD56bright cell, T helper
(Th)1 and 2 cells and Tregs (Fig.
4B). Positively correlated infiltrating immune cells were
eosinophils, mast and Th cells, T central memory (Tcm), T effector
memory (Tem), Tγδ) and Th17 cells (Fig.
4C). Tregs were the most significantly negatively correlated
infiltrating immune cells, whereas Tcm was the most significantly
positively correlated type. Tregs were further confirmed to be
significantly negatively correlated with CPEB3 expression in ccRCC
using TIMER2.0 and TISIDB (Fig. 4D
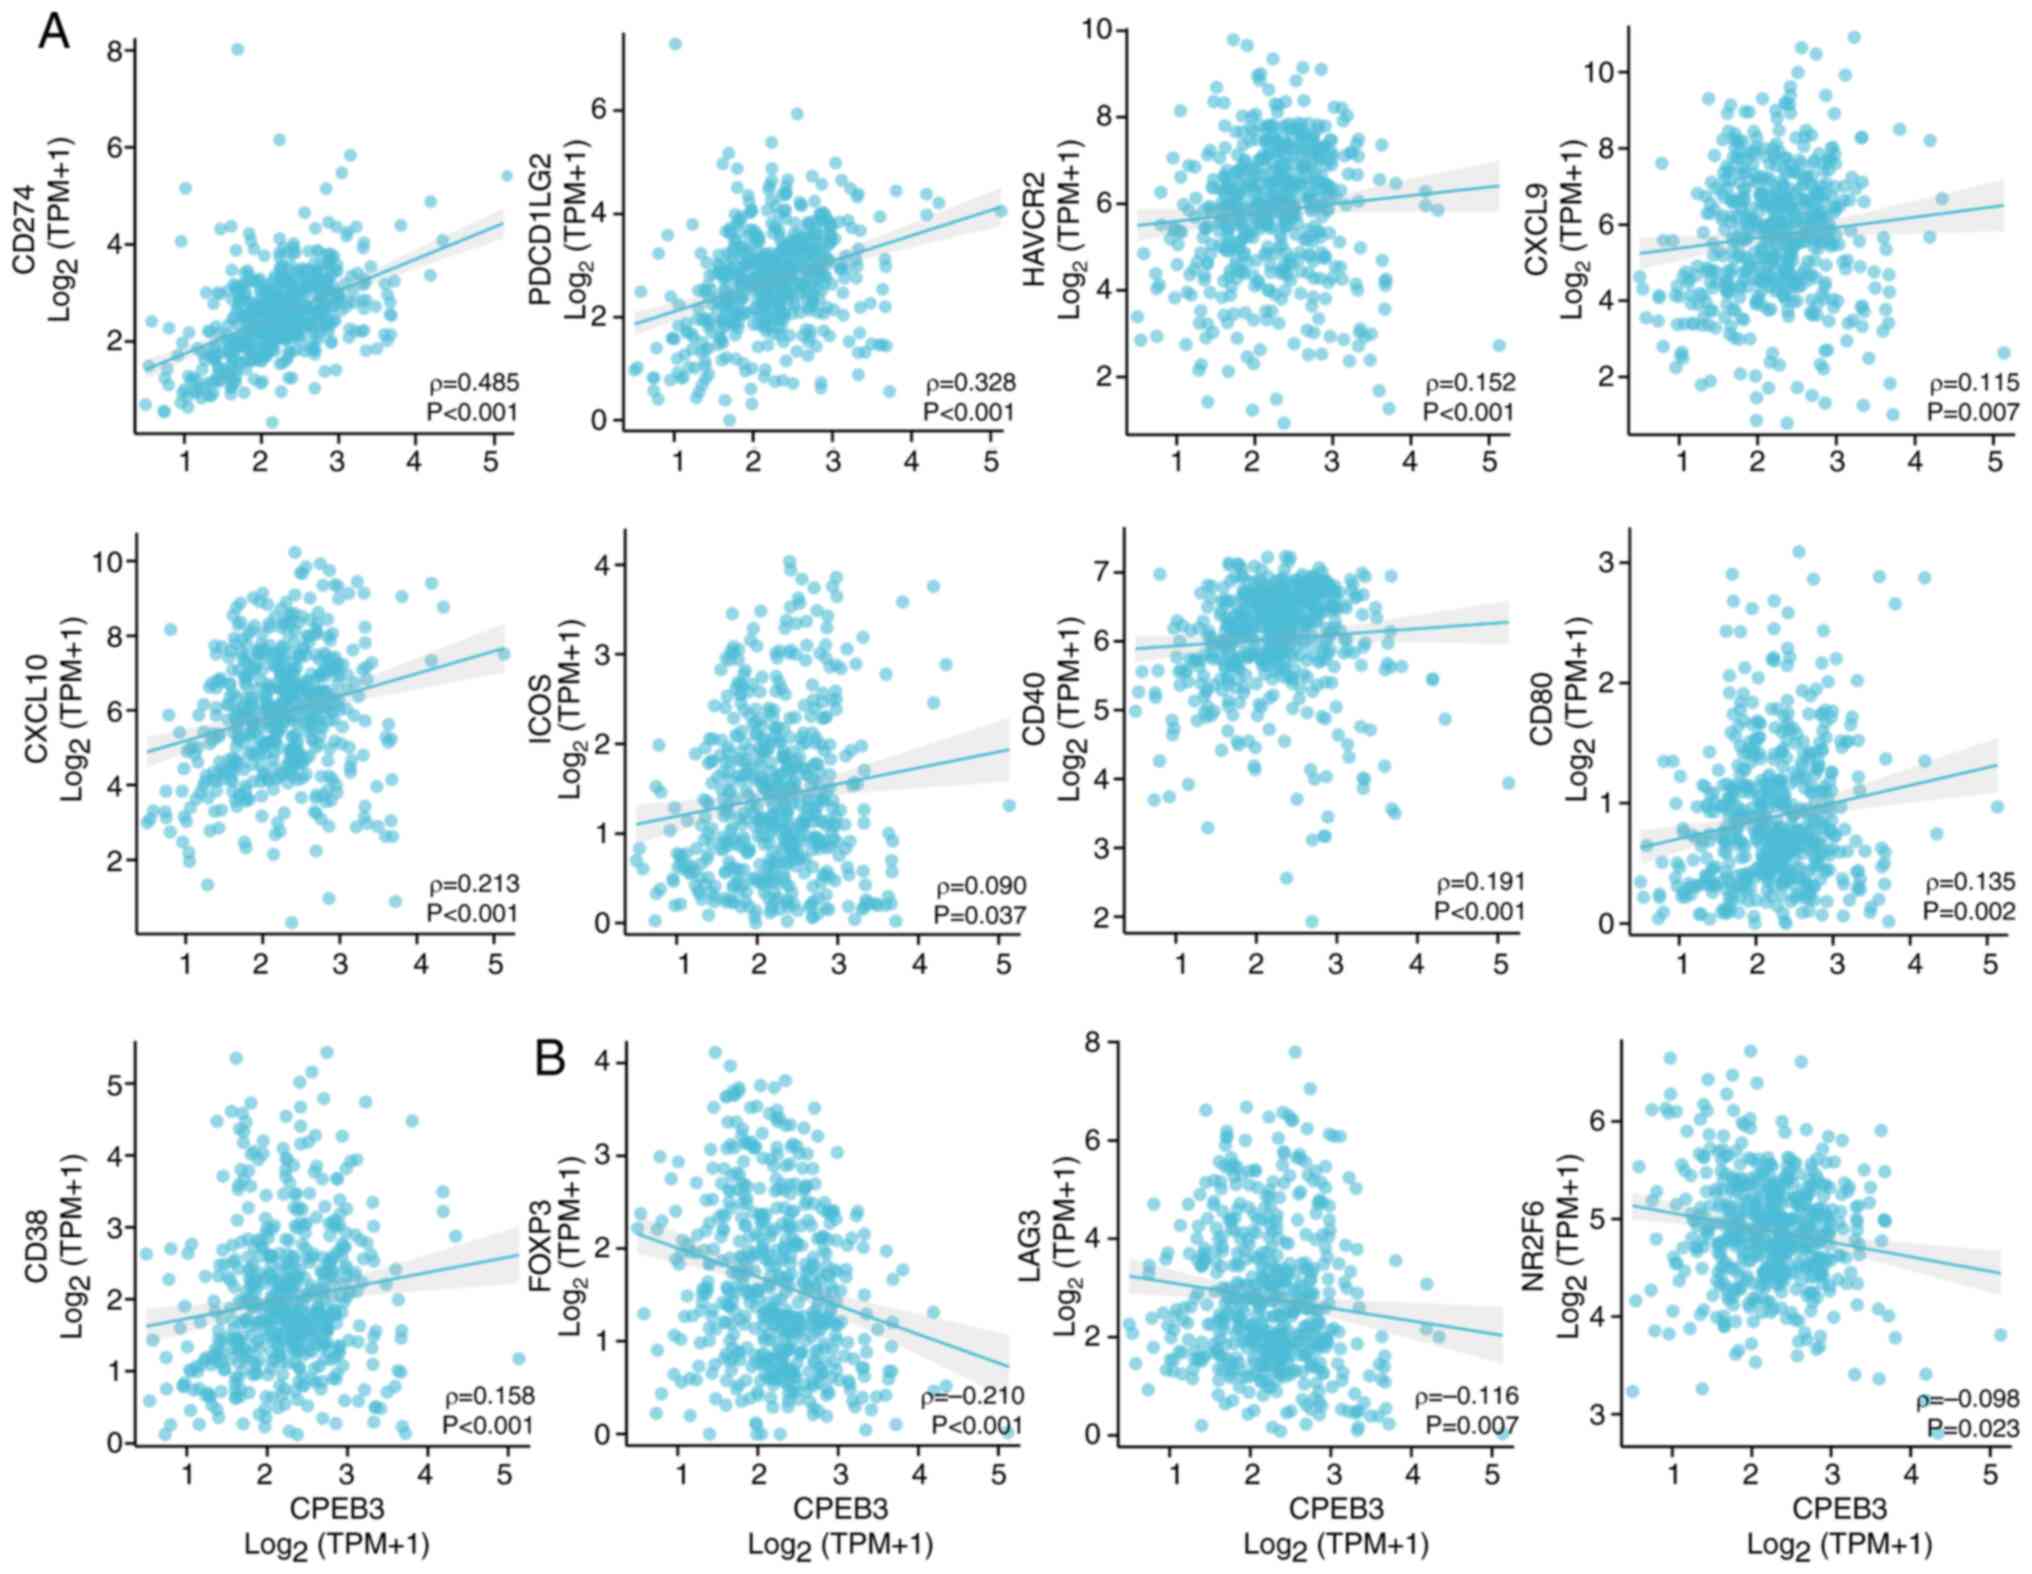
and E). CPEB3 expression was
positively correlated with immune biomarkers CD274, programmed cell
death 1 ligand 2 (PDCD1LG2), Hepatitis a virus cellular receptor 2
(HAVCR2), Chemokine (C-X-C motif) ligand (CXCL)9, CXCL10, Inducible
T cell costimulatory (ICOS), CD40, CD80 and CD38 (Fig. 5A). CPEB3 expression was inversely
associated with immune biomarkers FOXP3, LAG3 and Nuclear receptor
subfamily 2, group F, member 6 (NR2F6) (Fig. 5B).
Patients with ccRCC with different characteristics,
such as sex, age, grade and T, N and M stages, were grouped
according to expression of CPEB3. Patients with high CPEB3
expression showed better OS regardless of sex and age (Fig. 6A). High CPEB3 expression in patients
with grade 1 and 2, T stage 1 and 2, N0 and M0 was associated with
favorable survival (Fig. 6A).
Moreover, CPEB3 expression levels were significantly associated
with prognosis of patients with ccRCC. Kaplan-Meier curves showed
that patients with high CPEB3 expression had better OS and DSS
(Fig. 6B). These patients also had
better clinical features, such as tumor grade and T, M and
pathological stage (Fig. 6C). The
ROC curve analysis indicated that the area under the curve for
ccRCC was 0.916 (Fig. 6D). Finally,
the constructed nomogram could be used as a powerful tool to
predict survival probability at 1, 3 and 5 years (Fig. 6E).
Timely detection, early intervention and precise
therapy have been extensively studied to improve outcomes in
patients with ccRCC (54-57).
However, these efforts are yet to yield a comprehensive cure. The
present study demonstrated decreased CPEB3 protein expression in
ccRCC. Furthermore, high CPEB3 expression was associated with a
favorable prognosis and was an independent predictor of OS in
ccRCC. Nevertheless, ccRCC tissue specimens primarily originated
from patients at initial stages of the disease and additional
samples, particularly from advanced tumor stages, are required for
further studies. Additionally, the molecular mechanisms responsible
for CPEB3 expression in cancer necessitate further investigation.
The present study examined the role of CPEB3 in ccRCC via
bioinformatics analysis, which revealed low expression of CPEB3 in
ccRCC, whereas promoter methylation of CPEB3 was higher in ccRCC
than in normal tissue. These results suggest that CPEB3 may act as
an important tumor suppressor gene in ccRCC and DNA methylation
silences the tumor suppressor function of CPEB3. Patients with high
CPEB3 expression had better clinical features and longer survival.
ROC curves demonstrated that CPEB3 levels could predict ccRCC with
high accuracy. This may support the use of this gene for tumor
diagnosis and prognosis in future. However, the present data were
retrospective or sourced from a publicly accessible database, which
is limited by its retrospective nature. Future investigations
should encompass a larger dataset and employ prospective study
designs to validate the present findings.
CPEB3 and differentially expressed genes were
strongly associated with immune and inflammatory responses. GSEA
revealed that CPEB3 may be associated with the immune system,
cancer proliferation, differentiation and the cell cycle. These
results suggest that CPEB3 may participate in multiple mechanisms
of tumor progression.
Taken together, the present results showed that
CPEB3 may be a tumor suppressor and mediate immune processes in
ccRCC. Although these results were based on a retrospective
analysis of clinical data and public databases, they provide
direction for future research on CPEB3. Further experiments are
required to confirm the functions of CPEB3 and its use as a novel
biomarker and therapeutic target in ccRCC.
The present study demonstrated the prognostic and
diagnostic value of CPEB3 in ccRCC. The expression of CPEB3 in
ccRCC tissues was significantly lower than in normal tissue and its
methylation level was higher. This indicated that CPEB3 may act as
a tumor suppressor. CPEB3 may potentially serve as a favorable
prognostic biomarker in ccRCC and patients with high CPEB3
expression are likely to have better outcomes. In addition,
numerous types of infiltrating immune cell, particularly Tregs,
were correlated with CPEB3 expression levels, suggesting that CPEB3
may affect TME and anti-tumor responses. Additional experimental
and clinical studies are required to confirm these findings.
The authors would like to thank Mrs Fan Fan
(Guangzhou Lupeng Pharmaceutical Co., Ltd. Guangzhou, Guangdong,
China) for project management.
Funding: No funding was received.
The data generated in the present study may be
requested from the corresponding author.
HH and PO conceived and supervised the study,
analyzed data and wrote and revised the manuscript. HH, PO, XS and
WO designed the experiments. HH, PO, XS and WO performed
experiments. HH and PO confirm the authenticity of all the raw
data. All authors have read and approved the final manuscript.
The Clinical Research Ethics Committee of Outdo
BioTech granted ethical approval for the study of the tissue
microarrays (approval no. SHYJS-CP-1707003). Patient consent was
obtained from all participants for participation in the study for
use of their tissue.
Not applicable.
The authors declare that they have no competing
interests.
|
1
|
Sung H, Ferlay J, Siegel RL, Laversanne M,
Soerjomataram I, Jemal A and Bray F: Global cancer statistics 2020:
GLOBOCAN estimates of incidence and mortality worldwide for 36
cancers in 185 countries. CA Cancer J Clin. 71:209–249.
2021.PubMed/NCBI View Article : Google Scholar
|
|
2
|
Leibovich BC, Lohse CM, Crispen PL,
Boorjian SA, Thompson RH, Blute ML and Cheville JC: Histological
subtype is an independent predictor of outcome for patients with
renal cell carcinoma. J Urol. 183:1309–1315. 2010.PubMed/NCBI View Article : Google Scholar
|
|
3
|
Cella D, Motzer RJ, Suarez C, Blum SI,
Ejzykowicz F, Hamilton M, Wallace JF, Simsek B, Zhang J, Ivanescu
C, et al: Patient-reported outcomes with first-line nivolumab plus
cabozantinib versus sunitinib in patients with advanced renal cell
carcinoma treated in CheckMate 9ER: an open-label, randomised,
phase 3 trial. Lancet Oncol. 23:292–303. 2022.PubMed/NCBI View Article : Google Scholar
|
|
4
|
Motzer R, Alekseev B, Rha SY, Porta C, Eto
M, Powles T, Grünwald V, Hutson TE, Kopyltsov E, Méndez-Vidal MJ,
et al: Lenvatinib plus pembrolizumab or everolimus for advanced
renal cell carcinoma. N Engl J Med. 384:1289–1300. 2021.PubMed/NCBI View Article : Google Scholar
|
|
5
|
Choueiri TK, Powles T, Burotto M, Escudier
B, Bourlon MT, Zurawski B, Oyervides Juárez VM, Hsieh JJ, Basso U,
Shah AY, et al: Nivolumab plus cabozantinib versus sunitinib for
advanced renal-cell carcinoma. N Engl J Med. 384:829–841.
2021.PubMed/NCBI View Article : Google Scholar
|
|
6
|
Powles T, Plimack ER, Soulières D, Waddell
T, Stus V, Gafanov R, Nosov D, Pouliot F, Melichar B, Vynnychenko
I, et al: Pembrolizumab plus axitinib versus sunitinib monotherapy
as first-line treatment of advanced renal cell carcinoma
(KEYNOTE-426): Extended follow-up from a randomised, open-label,
phase 3 trial. Lancet Oncol. 21:1563–1573. 2020.PubMed/NCBI View Article : Google Scholar
|
|
7
|
Rini BI, Plimack ER, Stus V, Gafanov R,
Hawkins R, Nosov D, Pouliot F, Alekseev B, Soulières D, Melichar B,
et al: Pembrolizumab plus axitinib versus sunitinib for advanced
renal-cell carcinoma. N Engl J Med. 380:1116–1127. 2019.PubMed/NCBI View Article : Google Scholar
|
|
8
|
Motzer RJ, Penkov K, Haanen J, Rini B,
Albiges L, Campbell MT, Venugopal B, Kollmannsberger C, Negrier S,
Uemura M, et al: Avelumab plus axitinib versus sunitinib for
advanced renal-cell carcinoma. N Engl J Med. 380:1103–1115.
2019.PubMed/NCBI View Article : Google Scholar
|
|
9
|
Motzer RJ, Tannir NM, McDermott DF, Arén
Frontera O, Melichar B, Choueiri TK, Plimack ER, Barthélémy P,
Porta C, George S, et al: Nivolumab plus ipilimumab versus
sunitinib in advanced renal-cell carcinoma. N Engl J Med.
378:1277–1290. 2018.PubMed/NCBI View Article : Google Scholar
|
|
10
|
Motzer RJ, Escudier B, McDermott DF,
George S, Hammers HJ, Srinivas S, Tykodi SS, Sosman JA, Procopio G,
Plimack ER, et al: Nivolumab versus everolimus in advanced
renal-cell carcinoma. N Engl J Med. 373:1803–1813. 2015.PubMed/NCBI View Article : Google Scholar
|
|
11
|
Choueiri TK, Tomczak P, Park SH, Venugopal
B, Ferguson T, Chang YH, Hajek J, Symeonides SN, Lee JL, Sarwar N,
et al: Adjuvant pembrolizumab after nephrectomy in renal-cell
carcinoma. N Engl J Med. 385:683–694. 2021.PubMed/NCBI View Article : Google Scholar
|
|
12
|
Bi K, He MX, Bakouny Z, Kanodia A,
Napolitano S, Wu J, Grimaldi G, Braun DA, Cuoco MS, Mayorga A, et
al: Tumor and immune reprogramming during immunotherapy in advanced
renal cell carcinoma. Cancer Cell. 39:649–661.e5. 2021.PubMed/NCBI View Article : Google Scholar
|
|
13
|
Wu F, Fan J, He Y, Xiong A, Yu J, Li Y,
Zhang Y, Zhao W, Zhou F, Li W, et al: Single-cell profiling of
tumor heterogeneity and the microenvironment in advanced non-small
cell lung cancer. Nat Commun. 12(2540)2021.PubMed/NCBI View Article : Google Scholar
|
|
14
|
Ma L, Hernandez MO, Zhao Y, Mehta M, Tran
B, Kelly M, Rae Z, Hernandez JM, Davis JL, Martin SP, et al: Tumor
cell biodiversity drives microenvironmental reprogramming in liver
cancer. Cancer Cell. 36:418–430.e6. 2019.PubMed/NCBI View Article : Google Scholar
|
|
15
|
Barkley D, Moncada R, Pour M, Liberman DA,
Dryg I, Werba G, Wang W, Baron M, Rao A, Xia B, et al: Cancer cell
states recur across tumor types and form specific interactions with
the tumor microenvironment. Nat Genet. 54:1192–1201.
2022.PubMed/NCBI View Article : Google Scholar
|
|
16
|
Nakamura K and Smyth MJ: Myeloid
immunosuppression and immune checkpoints in the tumor
microenvironment. Cell Mol Immunol. 17:1–12. 2020.PubMed/NCBI View Article : Google Scholar
|
|
17
|
Kumagai S, Koyama S, Itahashi K,
Tanegashima T, Lin YT, Togashi Y, Kamada T, Irie T, Okumura G, Kono
H, et al: Lactic acid promotes PD-1 expression in regulatory T
cells in highly glycolytic tumor microenvironments. Cancer Cell.
40:201–218.e9. 2022.PubMed/NCBI View Article : Google Scholar
|
|
18
|
Naser R, Fakhoury I, El-Fouani A,
Abi-Habib R and El-Sibai M: Role of the tumor microenvironment in
cancer hallmarks and targeted therapy (review). Int J Oncol.
62(23)2023.PubMed/NCBI View Article : Google Scholar
|
|
19
|
Josefowicz SZ, Lu LF and Rudensky AY:
Regulatory T cells: Mechanisms of differentiation and function.
Annu Rev Immunol. 30:531–564. 2012.PubMed/NCBI View Article : Google Scholar
|
|
20
|
Khattri R, Cox T, Yasayko SA and Ramsdell
F: Pillars article: An essential role for scurfin in CD4+CD25+ T
regulatory cells. Nat. Immunol. 2003.4:337-342. J Immunol.
198:993–998. 2017.PubMed/NCBI
|
|
21
|
Hori S, Nomura T and Sakaguchi S: Control
of regulatory T cell development by the transcription factor Foxp3.
Science. 299:1057–1061. 2003.PubMed/NCBI View Article : Google Scholar
|
|
22
|
Fontenot JD, Gavin MA and Rudensky AY:
Foxp3 programs the development and function of CD4+CD25+ regulatory
T cells. Nat Immunol. 4:330–336. 2003.PubMed/NCBI View
Article : Google Scholar
|
|
23
|
Sakaguchi S, Sakaguchi N, Asano M, Itoh M
and Toda M: Immunologic self-tolerance maintained by activated T
cells expressing IL-2 receptor alpha-chains (CD25). Breakdown of a
single mechanism of self-tolerance causes various autoimmune
diseases. J Immunol. 155:1151–1164. 1995.PubMed/NCBI
|
|
24
|
Tada Y, Togashi Y, Kotani D, Kuwata T,
Sato E, Kawazoe A, Doi T, Wada H, Nishikawa H and Shitara K:
Targeting VEGFR2 with Ramucirumab strongly impacts
effector/activated regulatory T cells and CD8+ T cells
in the tumor microenvironment. J Immunother Cancer.
6(106)2018.PubMed/NCBI View Article : Google Scholar
|
|
25
|
Togashi Y and Nishikawa H: Regulatory T
cells: Molecular and cellular basis for immunoregulation. Curr Top
Microbiol Immunol. 410:3–27. 2017.PubMed/NCBI View Article : Google Scholar
|
|
26
|
Saito T, Nishikawa H, Wada H, Nagano Y,
Sugiyama D, Atarashi K, Maeda Y, Hamaguchi M, Ohkura N, Sato E, et
al: Two FOXP3(+)CD4(+) T cell subpopulations distinctly control the
prognosis of colorectal cancers. Nat Med. 22:679–684.
2016.PubMed/NCBI View
Article : Google Scholar
|
|
27
|
Mendez R, Barnard D and Richter JD:
Differential mRNA translation and meiotic progression require
Cdc2-mediated CPEB destruction. EMBO J. 21:1833–1844.
2002.PubMed/NCBI View Article : Google Scholar
|
|
28
|
Chen J, Li L, Liu TY, Fu HF, Lai YH, Lei
X, Xu JF, Yu JS, Xia YJ, Zhang TH, et al: CPEB3 suppresses gastric
cancer progression by inhibiting ADAR1-mediated RNA editing via
localizing ADAR1 mRNA to P bodies. Oncogene. 41:4591–4605.
2022.PubMed/NCBI View Article : Google Scholar
|
|
29
|
Cheng J, Ma H, Yan M, Zhang Z and Xing W:
Circ_0007624 suppresses the development of esophageal squamous cell
carcinoma via targeting miR-224-5p/CPEB3 to inactivate the
EGFR/PI3K/AKT signaling. Cell Signal. 99(110448)2022.PubMed/NCBI View Article : Google Scholar
|
|
30
|
Zhong Q, Fang Y, Lai Q, Wang S, He C, Li
A, Liu S and Yan Q: CPEB3 inhibits epithelial-mesenchymal
transition by disrupting the crosstalk between colorectal cancer
cells and tumor-associated macrophages via IL-6R/STAT3 signaling. J
Exp Clin Cancer Res. 39(132)2020.PubMed/NCBI View Article : Google Scholar
|
|
31
|
Goldman MJ, Craft B, Hastie M, Repečka K,
McDade F, Kamath A, Banerjee A, Luo Y, Rogers D, Brooks AN, et al:
Visualizing and interpreting cancer genomics data via the Xena
platform. Nat Biotechnol. 38:675–678. 2020.PubMed/NCBI View Article : Google Scholar
|
|
32
|
Vivian J, Rao AA, Nothaft FA, Ketchum C,
Armstrong J, Novak A, Pfeil J, Narkizian J, Deran AD,
Musselman-Brown A, et al: Toil enables reproducible, open source,
big biomedical data analyses. Nat Biotechnol. 35:314–316.
2017.PubMed/NCBI View Article : Google Scholar
|
|
33
|
Cancer Genome Atlas Research Network.
Weinstein JN, Collisson EA, Mills GB, Shaw KR, Ozenberger BA,
Ellrott K, Shmulevich I, Sander C and Stuart JM: The cancer genome
atlas pan-cancer analysis project. Nat Genet. 45:1113–1120.
2013.PubMed/NCBI View Article : Google Scholar
|
|
34
|
GTEx Consortium: Human genomics. The
genotype-tissue expression (GTEx) pilot analysis: Multitissue gene
regulation in humans. Science. 348:648–660. 2015.PubMed/NCBI View Article : Google Scholar
|
|
35
|
R Core Team. R: A Language and Environment
for Statistical Computing. R Foundation for Statistical Computing,
Vienna, Austria, 2019.
|
|
36
|
Chandrashekar DS, Karthikeyan SK, Korla
PK, Patel H, Shovon AR, Athar M, Netto GJ, Qin ZS, Kumar S, Manne
U, et al: UALCAN: An update to the integrated cancer data analysis
platform. Neoplasia. 25:18–27. 2022.PubMed/NCBI View Article : Google Scholar
|
|
37
|
Chandrashekar DS, Bashel B, Balasubramanya
SAH, Creighton CJ, Ponce-Rodriguez I, Chakravarthi BVSK and
Varambally S: UALCAN: A portal for facilitating tumor subgroup gene
expression and survival analyses. Neoplasia. 19:649–658.
2017.PubMed/NCBI View Article : Google Scholar
|
|
38
|
Love MI, Huber W and Anders S: Moderated
estimation of fold change and dispersion for RNA-seq data with
DESeq2. Genome Biol. 15(550)2014.PubMed/NCBI View Article : Google Scholar
|
|
39
|
Villanueva RAM and Chen ZJ: ggplot2:
Elegant graphics for data analysis (2nd ed.). Meas: Inter Res
Perspect. 17:160–167. 2019.
|
|
40
|
Ashburner M, Ball CA, Blake JA, Botstein
D, Butler H, Cherry JM, Davis AP, Dolinski K, Dwight SS, Eppig JT,
et al: Gene ontology: Tool for the unification of biology. The gene
ontology consortium. Nat Genet. 25:25–29. 2000.PubMed/NCBI View Article : Google Scholar
|
|
41
|
Gene Ontology Consortium. Aleksander SA,
Balhoff J, Carbon S, Cherry JM, Drabkin HJ, Ebert D, Feuermann M,
Gaudet P, Harris NL, et al: The gene ontology knowledgebase in
2023. Genetics. 224(iyad031)2023.PubMed/NCBI View Article : Google Scholar
|
|
42
|
Yu G, Wang LG, Han Y and He QY:
clusterProfiler: An R package for comparing biological themes among
gene clusters. OMICS. 16:284–287. 2012.PubMed/NCBI View Article : Google Scholar
|
|
43
|
Walter W, Sánchez-Cabo F and Ricote M:
GOplot: An R package for visually combining expression data with
functional analysis. Bioinformatics. 31:2912–2914. 2015.PubMed/NCBI View Article : Google Scholar
|
|
44
|
Subramanian A, Tamayo P, Mootha VK,
Mukherjee S, Ebert BL, Gillette MA, Paulovich A, Pomeroy SL, Golub
TR, Lander ES and Mesirov JP: Gene set enrichment analysis: A
knowledge-based approach for interpreting genome-wide expression
profiles. Proc Natl Acad Sci USA. 102:15545–15550. 2005.PubMed/NCBI View Article : Google Scholar
|
|
45
|
Liberzon A, Birger C, Thorvaldsdóttir H,
Ghandi M, Mesirov JP and Tamayo P: The molecular signatures
database (MSigDB) hallmark gene set collection. Cell Syst.
1:417–425. 2015.PubMed/NCBI View Article : Google Scholar
|
|
46
|
Bindea G, Mlecnik B, Tosolini M,
Kirilovsky A, Waldner M, Obenauf AC, Angell H, Fredriksen T,
Lafontaine L, Berger A, et al: Spatiotemporal dynamics of
intratumoral immune cells reveal the immune landscape in human
cancer. Immunity. 39:782–795. 2013.PubMed/NCBI View Article : Google Scholar
|
|
47
|
Hänzelmann S, Castelo R and Guinney J:
GSVA: Gene set variation analysis for microarray and RNA-seq data.
BMC Bioinformatics. 14(7)2013.PubMed/NCBI View Article : Google Scholar
|
|
48
|
Charoentong P, Finotello F, Angelova M,
Mayer C, Efremova M, Rieder D, Hackl H and Trajanoski Z: Pan-cancer
immunogenomic analyses reveal genotype-immunophenotype
relationships and predictors of response to checkpoint blockade.
Cell Rep. 18:248–262. 2017.PubMed/NCBI View Article : Google Scholar
|
|
49
|
Li T, Fu J, Zeng Z, Cohen D, Li J, Chen Q,
Li B and Liu XS: TIMER2.0 for analysis of tumor-infiltrating immune
cells. Nucleic Acids Res. 48 (W1):W509–W514. 2020.PubMed/NCBI View Article : Google Scholar
|
|
50
|
Therneau TM: A package for survival
analysis in R. https://CRAN.R-project.org/package=survival.
|
|
51
|
Robin X, Turck N, Hainard A, Tiberti N,
Lisacek F, Sanchez JC and Müller M: pROC: An open-source package
for R and S+ to analyze and compare ROC curves. BMC Bioinformatics.
12(77)2011.PubMed/NCBI View Article : Google Scholar
|
|
52
|
Amin MB, Edge SB, Greene FL, Byrd DR,
Brookland RK, Washington MK, Gershenwald JE, Compton CC, Hess KR,
Sullivan DC (eds), et al: AJCC cancer staging manual. 8th edition.
New York: Springer, 2017.
|
|
53
|
Pablo C, Marcela G, Lía EA and María IA:
Correlation between MVD and two prognostic factors: Fuhrman grade
and tumoral size, in clear cell renal cell carcinoma. J Cancer Sci
Ther. 4:313–316. 2012.
|
|
54
|
Kim SP, Alt AL, Weight CJ, Costello BA,
Cheville JC, Lohse C and Leibovich BC: Independent validation of
the 2010 American joint committee on cancer TNM classification for
renal cell carcinoma: Results from a large, single institution
cohort. J Urol. 185:2035–2039. 2011.PubMed/NCBI View Article : Google Scholar
|
|
55
|
Klatte T, Patard JJ, Goel RH, Kleid MD,
Guille F, Lobel B, Abbou CC, De La Taille A, Tostain J, Cindolo L,
et al: Prognostic impact of tumor size on pT2 renal cell carcinoma:
An international multicenter experience. J Urol. 178:35–40.
2007.PubMed/NCBI View Article : Google Scholar
|
|
56
|
Ged Y, Markowski MC, Singla N and Rowe SP:
The shifting treatment paradigm of metastatic renal cell carcinoma.
Nat Rev Urol. 19:631–632. 2022.PubMed/NCBI View Article : Google Scholar
|
|
57
|
No authors listed. New treatments emerge
for RCC. Cancer Discov. 11(OF10)2021.PubMed/NCBI View Article : Google Scholar
|
|
58
|
Zilionis R, Engblom C, Pfirschke C, Savova
V, Zemmour D, Saatcioglu HD, Krishnan I, Maroni G, Meyerovitz CV,
Kerwin CM, et al: Single-cell transcriptomics of human and mouse
lung cancers reveals conserved myeloid populations across
individuals and species. Immunity. 50:1317–1334.e10.
2019.PubMed/NCBI View Article : Google Scholar
|
|
59
|
Rosenthal R, Cadieux EL, Salgado R, Bakir
MA, Moore DA, Hiley CT, Lund T, Tanić M, Reading JL, Joshi K, et
al: Neoantigen-directed immune escape in lung cancer evolution.
Nature. 567:479–485. 2019.PubMed/NCBI View Article : Google Scholar
|
|
60
|
McGranahan N and Swanton C: Cancer
evolution constrained by the immune microenvironment. Cell.
170:825–827. 2017.PubMed/NCBI View Article : Google Scholar
|
|
61
|
Vesely MD, Kershaw MH, Schreiber RD and
Smyth MJ: Natural innate and adaptive immunity to cancer. Annu Rev
Immunol. 29:235–271. 2011.PubMed/NCBI View Article : Google Scholar
|
|
62
|
Schreiber RD, Old LJ and Smyth MJ: Cancer
immunoediting: Integrating immunity's roles in cancer suppression
and promotion. Science. 331:1565–1570. 2011.PubMed/NCBI View Article : Google Scholar
|
|
63
|
Koebel CM, Vermi W, Swann JB, Zerafa N,
Rodig SJ, Old LJ, Smyth MJ and Schreiber RD: Adaptive immunity
maintains occult cancer in an equilibrium state. Nature.
450:903–907. 2007.PubMed/NCBI View Article : Google Scholar
|
|
64
|
Wolchok JD, Chiarion-Sileni V, Gonzalez R,
Grob JJ, Rutkowski P, Lao CD, Cowey CL, Schadendorf D, Wagstaff J,
Dummer R, et al: Long-Term outcomes with nivolumab plus ipilimumab
or nivolumab alone versus ipilimumab in patients with advanced
melanoma. J Clin Oncol. 40:127–137. 2022.PubMed/NCBI View Article : Google Scholar
|
|
65
|
Taylor MH, Betts CB, Maloney L, Nadler E,
Algazi A, Guarino MJ, Nemunaitis J, Jimeno A, Patel P,
Munugalavadla V, et al: Safety and efficacy of pembrolizumab in
combination with acalabrutinib in advanced head and neck squamous
cell carcinoma: Phase 2 proof-of-concept study. Clin Cancer Res.
28:903–914. 2022.PubMed/NCBI View Article : Google Scholar
|
|
66
|
Slomski A: Pembrolizumab boosts breast and
cervical cancer survival. JAMA. 326(2001)2021.PubMed/NCBI View Article : Google Scholar
|
|
67
|
Ferris RL, Blumenschein G Jr, Fayette J,
Guigay J, Colevas AD, Licitra L, Harrington K, Kasper S, Vokes EE,
Even C, et al: Nivolumab for recurrent squamous-cell carcinoma of
the head and neck. N Engl J Med. 375:1856–1867. 2016.PubMed/NCBI View Article : Google Scholar
|
|
68
|
Brahmer J, Reckamp KL, Baas P, Crinò L,
Eberhardt WE, Poddubskaya E, Antonia S, Pluzanski A, Vokes EE,
Holgado E, et al: Nivolumab versus docetaxel in advanced
squamous-cell non-small-cell lung cancer. N Engl J Med.
373:123–135. 2015.PubMed/NCBI View Article : Google Scholar
|
|
69
|
Ugel S, Canè S, De Sanctis F and Bronte V:
Monocytes in the tumor microenvironment. Annu Rev Pathol.
16:93–122. 2021.PubMed/NCBI View Article : Google Scholar
|
|
70
|
Li C, Teixeira AF, Zhu HJ and Ten Dijke P:
Cancer associated-fibroblast-derived exosomes in cancer
progression. Mol Cancer. 20(154)2021.PubMed/NCBI View Article : Google Scholar
|
|
71
|
Cheng HS, Lee JXT, Wahli W and Tan NS:
Exploiting vulnerabilities of cancer by targeting nuclear receptors
of stromal cells in tumor microenvironment. Mol Cancer.
18(51)2019.PubMed/NCBI View Article : Google Scholar
|
|
72
|
Quail DF, Bowman RL, Akkari L, Quick ML,
Schuhmacher AJ, Huse JT, Holland EC, Sutton JC and Joyce JA: The
tumor microenvironment underlies acquired resistance to CSF-1R
inhibition in gliomas. Science. 352(aad3018)2016.PubMed/NCBI View Article : Google Scholar
|
|
73
|
De Henau O, Rausch M, Winkler D, Campesato
LF, Liu C, Cymerman DH, Budhu S, Ghosh A, Pink M, Tchaicha J, et
al: Overcoming resistance to checkpoint blockade therapy by
targeting PI3Kγ in myeloid cells. Nature. 539:443–447.
2016.PubMed/NCBI View Article : Google Scholar
|
|
74
|
Quail DF and Joyce JA: Microenvironmental
regulation of tumor progression and metastasis. Nat Med.
19:1423–1437. 2013.PubMed/NCBI View Article : Google Scholar
|
|
75
|
Coussens LM, Zitvogel L and Palucka AK:
Neutralizing tumor-promoting chronic inflammation: A magic bullet?
Science. 339:286–291. 2013.PubMed/NCBI View Article : Google Scholar
|
|
76
|
Mao X, Xu J, Wang W, Liang C, Hua J, Liu
J, Zhang B, Meng Q, Yu X and Shi S: Crosstalk between
cancer-associated fibroblasts and immune cells in the tumor
microenvironment: New findings and future perspectives. Mol Cancer.
20(131)2021.PubMed/NCBI View Article : Google Scholar
|
|
77
|
Erez N, Truitt M, Olson P, Arron ST and
Hanahan D: Cancer-associated fibroblasts are activated in incipient
neoplasia to orchestrate tumor-promoting inflammation in an
NF-kappaB-dependent manner. Cancer Cell. 17:135–147.
2010.PubMed/NCBI View Article : Google Scholar
|
|
78
|
Gajewski TF, Schreiber H and Fu YX: Innate
and adaptive immune cells in the tumor microenvironment. Nat
Immunol. 14:1014–1022. 2013.PubMed/NCBI View Article : Google Scholar
|
|
79
|
Wade RJ and Burdick JA: Engineering ECM
signals into biomaterials. Mater Today. 15:454–459. 2012.
|
|
80
|
Baumeister SH, Freeman GJ, Dranoff G and
Sharpe AH: Coinhibitory pathways in immunotherapy for cancer. Annu
Rev Immunol. 34:539–573. 2016.PubMed/NCBI View Article : Google Scholar
|
|
81
|
Masugi Y, Nishihara R, Hamada T, Song M,
da Silva A, Kosumi K, Gu M, Shi Y, Li W, Liu L, et al: Tumor
PDCD1LG2 (PD-L2) expression and the lymphocytic reaction to
colorectal cancer. Cancer Immunol Res. 5:1046–1055. 2017.PubMed/NCBI View Article : Google Scholar
|
|
82
|
Wolf Y, Anderson AC and Kuchroo VK: TIM3
comes of age as an inhibitory receptor. Nat Rev Immunol.
20:173–185. 2020.PubMed/NCBI View Article : Google Scholar
|
|
83
|
Anderson AC, Joller N and Kuchroo VK:
Lag-3, Tim-3, and TIGIT: Co-inhibitory receptors with specialized
functions in immune regulation. Immunity. 44:989–1004.
2016.PubMed/NCBI View Article : Google Scholar
|
|
84
|
Reschke R and Gajewski TF: CXCL9 and
CXCL10 bring the heat to tumors. Sci Immunol.
7(eabq6509)2022.PubMed/NCBI View Article : Google Scholar
|
|
85
|
Duhen R, Fesneau O, Samson KA, Frye AK,
Beymer M, Rajamanickam V, Ross D, Tran E, Bernard B, Weinberg AD
and Duhen T: PD-1 and ICOS coexpression identifies tumor-reactive
CD4+ T cells in human solid tumors. J Clin Invest.
132(e156821)2022.PubMed/NCBI View Article : Google Scholar
|
|
86
|
Yan C and Richmond A: Hiding in the dark:
Pan-cancer characterization of expression and clinical relevance of
CD40 to immune checkpoint blockade therapy. Mol Cancer.
20(146)2021.PubMed/NCBI View Article : Google Scholar
|
|
87
|
Sugiura D, Maruhashi T, Okazaki IM,
Shimizu K, Maeda TK, Takemoto T and Okazaki T: Restriction of PD-1
function by cis-PD-L1/CD80 interactions is required for optimal T
cell responses. Science. 364:558–566. 2019.PubMed/NCBI View Article : Google Scholar
|
|
88
|
Chen L, Diao L, Yang Y, Yi X, Rodriguez
BL, Li Y, Villalobos PA, Cascone T, Liu X, Tan L, et al:
CD38-mediated immunosuppression as a mechanism of tumor cell escape
from PD-1/PD-L1 blockade. Cancer Discov. 8:1156–1175.
2018.PubMed/NCBI View Article : Google Scholar
|
|
89
|
Liu Y, Wang L, Predina J, Han R, Beier UH,
Wang LC, Kapoor V, Bhatti TR, Akimova T, Singhal S, et al:
Inhibition of p300 impairs Foxp3+ T regulatory cell function and
promotes antitumor immunity. Nat Med. 19:1173–1177. 2013.PubMed/NCBI View Article : Google Scholar
|
|
90
|
Grebinoski S, Zhang Q, Cillo AR, Manne S,
Xiao H, Brunazzi EA, Tabib T, Cardello C, Lian CG, Murphy GF, et
al: Autoreactive CD8+ T cells are restrained by an
exhaustion-like program that is maintained by LAG3. Nat Immunol.
23:868–877. 2022.PubMed/NCBI View Article : Google Scholar
|
|
91
|
Klepsch V, Hermann-Kleiter N, Do-Dinh P,
Jakic B, Offermann A, Efremova M, Sopper S, Rieder D, Krogsdam A,
Gamerith G, et al: Nuclear receptor NR2F6 inhibition potentiates
responses to PD-L1/PD-1 cancer immune checkpoint blockade. Nat
Commun. 9(1538)2018.PubMed/NCBI View Article : Google Scholar
|