Introduction
Gastric cancer (GC) is one of the most common tumors
worldwide, ranking fifth regarding cancer-related mortality rate
(1). Particularly in East Asia, the
incidence and mortality rates of GC remain high. Due to the strong
pathological heterogeneity of GC, patients often already have
advanced stage cancer at the time of diagnosis, and the prognosis
remains poor (2). Despite
advancements in diagnostic and therapeutic strategies, its
heterogeneous biological behavior and poor prognosis (particularly
in advanced stages) highlight the urgent need for reliable
biomarkers to guide risk stratification and personalized treatment
(2). Among these biomarkers, cell
proliferation markers have garnered significant attention due to
their direct association with tumor aggressiveness and therapeutic
resistance. Therefore, identifying effective biomarkers, especially
those that can reflect tumor proliferation activity, is of great
significance for the development of personalized treatment
strategies and the assessment of patient prognosis.
Ki-67 is a nuclear protein closely associated with
cell proliferation and is widely used to evaluate the proliferative
activity of tumor cells. In gastric cancer, the expression level of
Ki-67 is closely linked to tumor biological behavior, clinical
prognosis, and treatment response (3). Multiple studies indicate that high
Ki-67 expression correlates with poorer overall survival (OS) and
progression-free survival (PFS) in gastric cancer patients
(4). A high Ki-67 index may suggest
a higher likelihood of lymph node metastasis and distant metastasis
(5). Poorly differentiated or
undifferentiated gastric cancers often exhibit higher Ki-67
indices, indicating active proliferation (6). Ki-67 is a protein marker related to
cell proliferation. Research has shown that the expression levels
of Ki-67 are closely related to the invasiveness, staging,
prognosis and treatment response of various malignant tumors
(7). In GC, high expression of
Ki-67 often indicates that the tumor has stronger invasive ability
and a poorer prognosis (8).
Therefore, accurately assessing the expression of Ki-67 is crucial
for the diagnosis, staging and personalized treatment decisions of
GC.
Currently, detecting the expression levels of Ki-67
mainly relies on pathological testing of tissue biopsies or
surgical resection samples. This method is not only invasive but
also has sampling bias, and for patients with advanced or
unresectable GC, repeated biopsies carry significant operational
risks and limitations (9).
Therefore, developing a non-invasive, convenient and efficient
method to predict the expression levels of Ki-67 has recently
garnered attention.
Existing research has shown that radiomics has high
accuracy in predicting various biomarkers, including Ki-67. The
rich tumor information provided by contrast-enhanced computed
tomography (CT) imaging can effectively capture its potential
biological characteristics (10).
Therefore, the present study aimed to establish a non-invasive and
feasible Ki-67 expression prediction model based on the radiomics
features of multi-phase enhanced CT, to provide new imaging
evidence for clinical treatment decisions for patients with GC.
This model is expected to serve as a non-invasive tool for
predicting Ki-67 status and guiding clinical treatment, helping
doctors better assess tumor proliferation activity, and providing
important references for personalized treatment and prognostic
evaluation of GC.
Patients and methods
Patients
The present study was approved (approval no.
KY-20243021) by the Ethics Committee of the Second Affiliated
Hospital of Xuzhou Medical University, and all studies were
conducted in accordance with relevant guidelines/regulations and
The Declaration of Helsinki. The present study is a retrospective,
and the used data collected as part of the participants' routine
care. Written informed consent for participation was waived in
accordance with the national legislation and the institutional
requirements. The current study reviewed a total of 266 patients
who were diagnosed and surgically treated for GC at The Second
Affiliated Hospital of Xuzhou Medical University between September
2015 and September 2023. Inclusion criteria were enhanced CT
examination was performed within 1 week before gastric resection
surgery and postoperative pathology confirmed GC. Exclusion
criteria were as follows: Poor gastric filling or artifacts in CT
images making it difficult to identify small GC lesions;
preoperative chemotherapy or radiotherapy and no postoperative
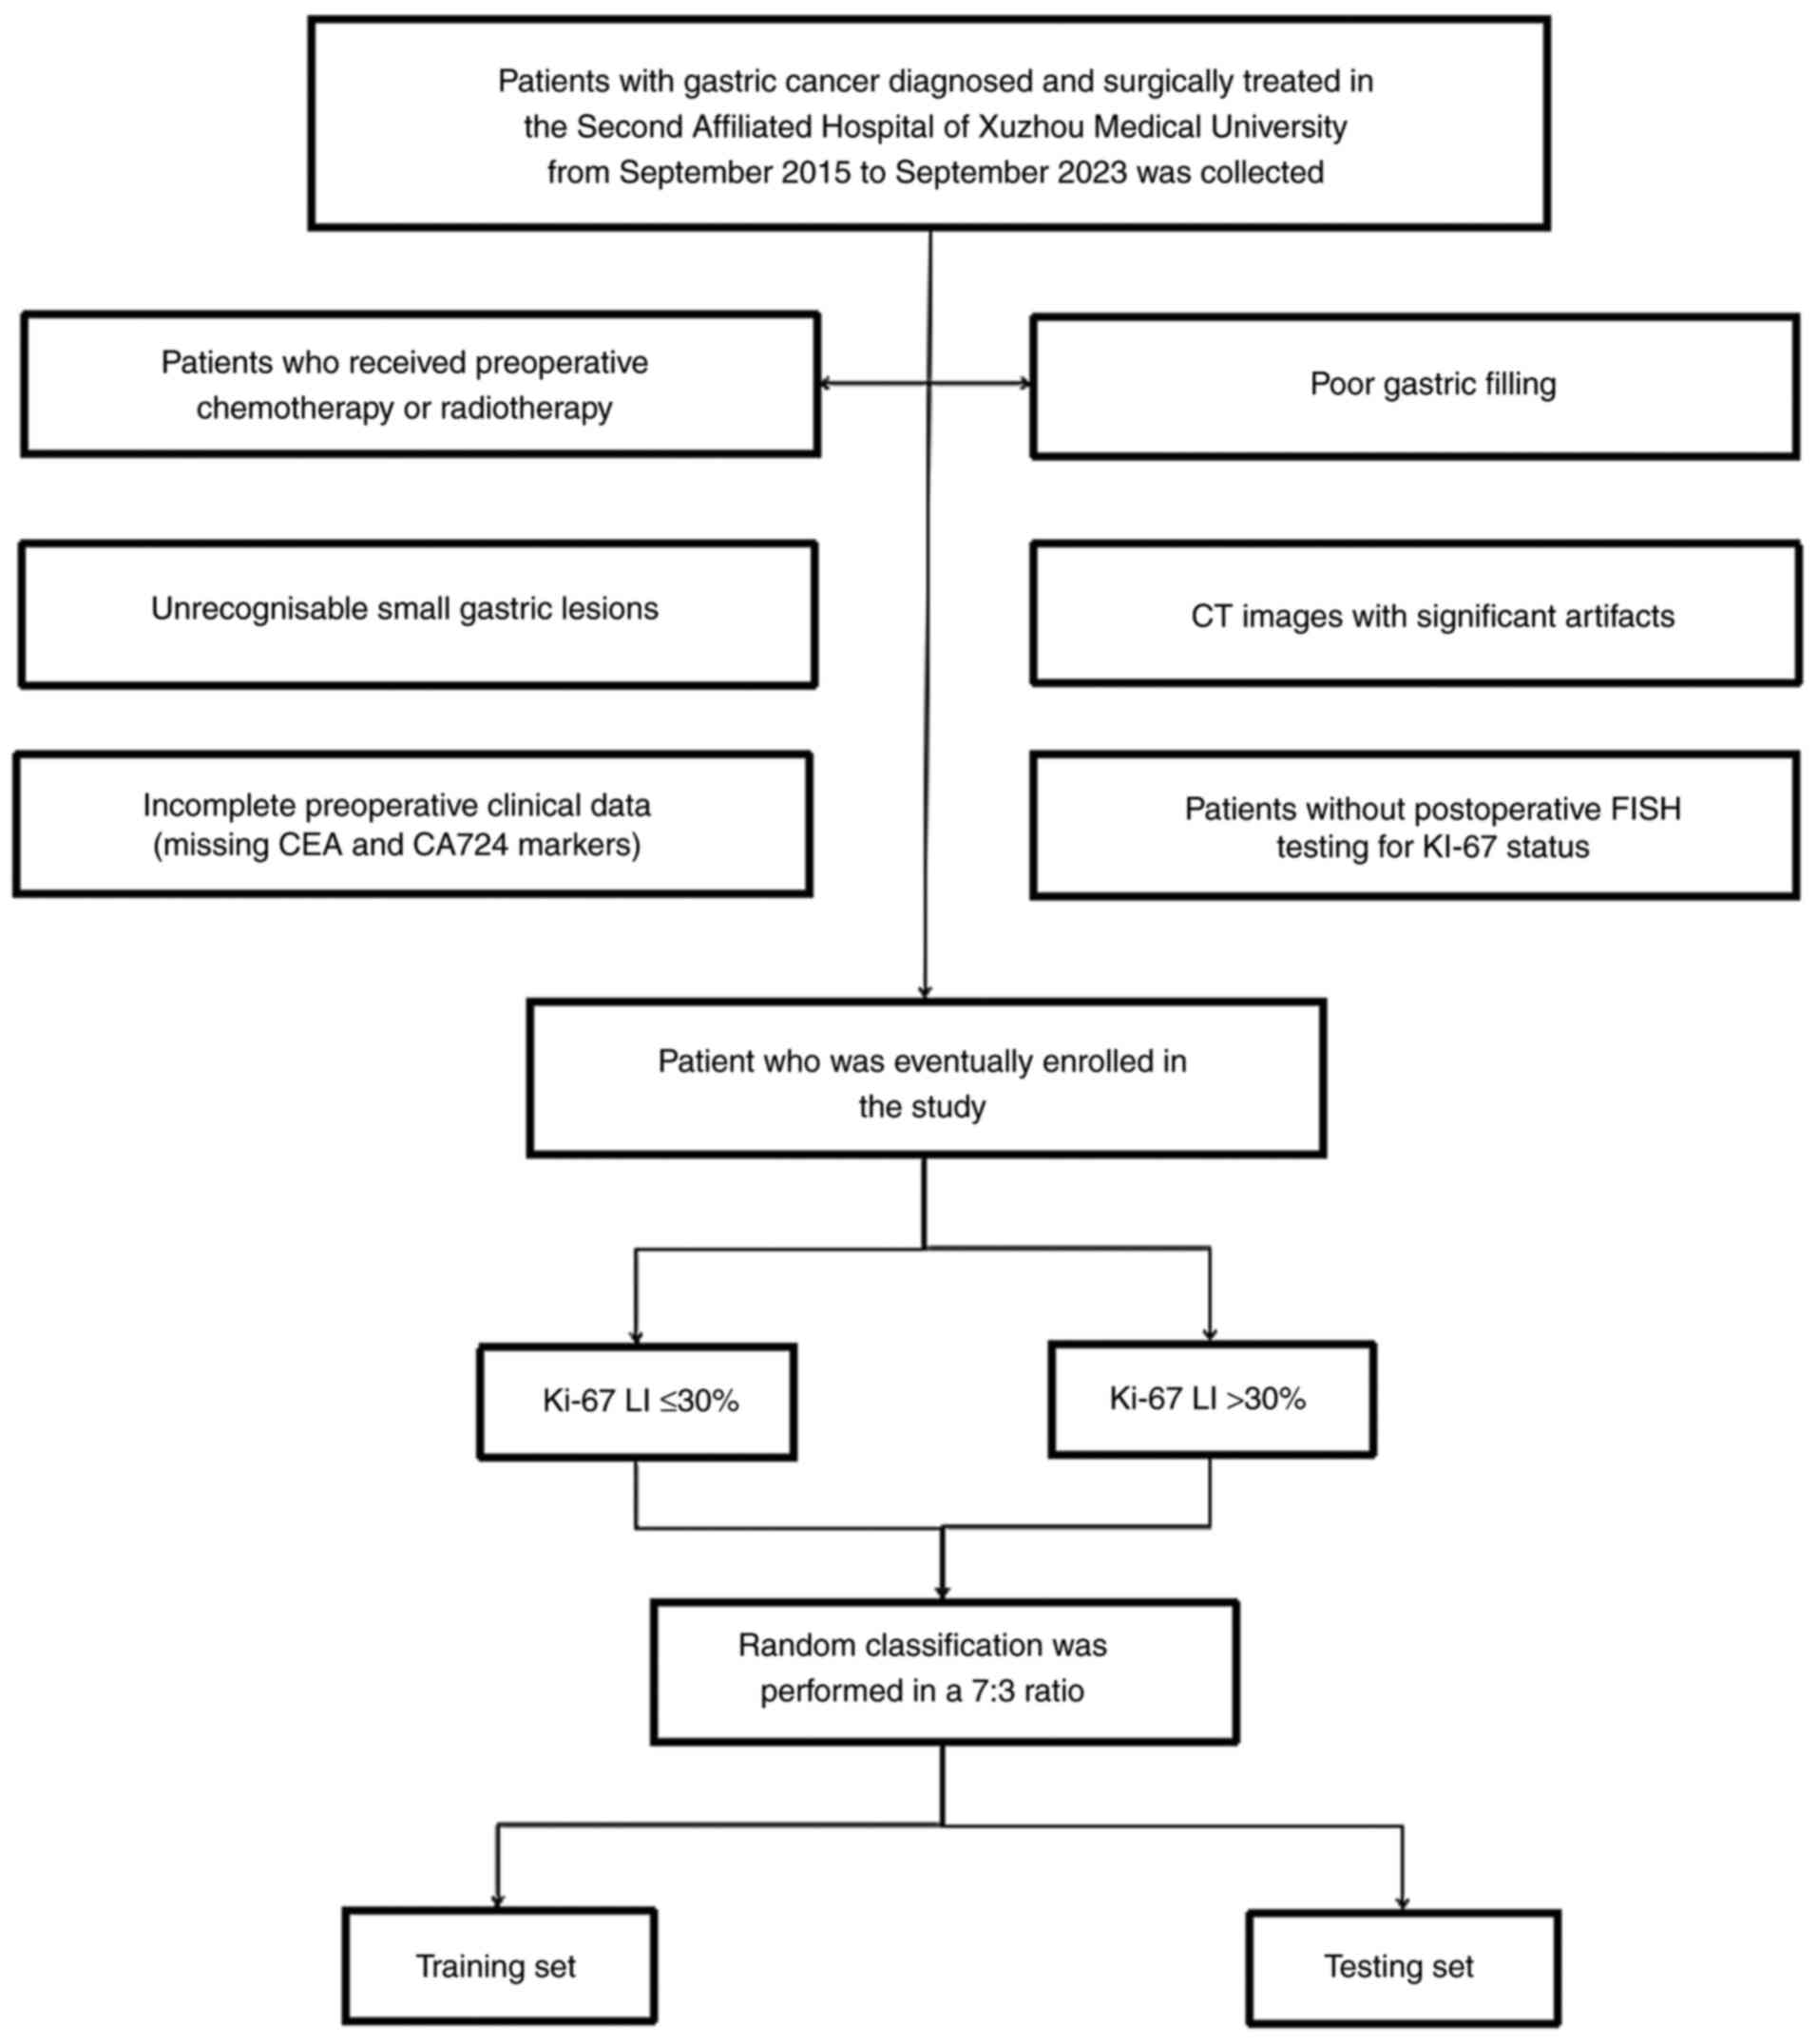
detection of Ki-67 expression levels. A total of 164 patients were
finally included in the study, which were allocated into two
independent cohorts in a 7:3 ratio, namely the training set (n=114
cases) and the testing set (n=50 cases). Due to the notably lower
number of patients with high Ki-67 expression compared with those
with low Ki-67 expression in the present study, the borderline
synthetic minority over-sampling technique was used to address the
imbalanced data (Fig. 1 shows the
flow chart for inclusion and exclusion). Moreover, 40 cases of GC
from The Cancer Imaging Archive (TCIA) (https://www.cancerimagingarchive.net/) were utilized
as the external validation set.
Acquisition of clinical and imaging
data
Clinical laboratory data and imaging results were
obtained from the hospital information system, and patient
preparation and imaging standards before CT image acquisition were
performed in accordance with the imaging technology standards of
tertiary hospitals. Re-evaluation of T staging, lymph node status
and serosal invasion in enhanced CT images was performed by three
radiologists with >5 years of experience in abdominal diagnosis.
This evaluation process was independently performed by the three
radiologists, who were blinded to the pathological information of
the patients. If there were discrepancies, the majority opinion was
taken as the final T staging, lymph node status and serosal
invasion status.
Determination of Ki-67 expression
levels
Tumor tissue samples were obtained through surgical
resection or endoscopic biopsy, and immunohistochemical (IHC)
staining was used to detect the expression levels of the Ki-67
protein, strictly following the staining and scoring criteria.
Paraffin-embedded tissue samples (3-5)
were fixed in 10% neutral buffered formalin at for 24-48 h. For
blocking, 5-10% normal goat serum (cat. no. S26-100ML;
MilliporeSigma) in Tris-buffered saline was used at room
temperature (RT) for 30-60 min. Primary antibody [Clone: MIB-1;
cat. no. M7240; Agilent; 1:50-1:200 in antibody diluent (REAL
Antibody Diluent; cat. no. S2022; DAKO; Agilent Technologies, Inc.)
was incubated at 4˚C overnight. 3,3'-Diaminobenzidine (DAB) (DAB +
Substrate Buffer; cat. no. K3468; DAKO; Agilent Technologies, Inc.)
was used as a chromogen at a concentration of 0.05% DAB (prepared
with 0.03% H2O2 in TBS). Staining was
performed at RT for 5-10 min. Light microscope for DAB-based
chromogenic staining was used for observation.
The scoring criteria for Ki-67 were primarily based
on the proportion of positive cells (for example, Ki-67 labeling
index, LI). The typical scoring range was 0-100%, with a higher
proportion of positive cells indicating stronger tumor
proliferative activity. In the present study, Ki-67 LI ≤30% was
considered to indicate low proliferative activity, whereas Ki-67 LI
>30% was considered to indicate high proliferative activity
(11).
Region of interest segmentation
To eliminate the difference in the signal intensity
of the images acquired by different CT devices, all images were
normalized to the signal intensity to 1-500 HU. After normalizing
the images, two radiologists with >5 years of experience in
abdominal CT diagnosis used ITK-SNAP software (version 3.8.0)
(http://www.itksnap.org/) to outline the three
phases of CT images in three-dimensional regions of interest
(volume of interest, VOI). The three phases refer to the arterial
phase, venous phase and delayed phase, which are described as
follows. Arterial phase: Scanning was performed immediately after
injection of the contrast agent, usually within 20-30 sec
post-injection, at which point the contrast agent is primarily
concentrated in the arterial vessels; this is used to observe the
blood supply to the tumor. Venous phase: Conducted after the
arterial phase, usually 60-70 sec post-injection, at which point
the contrast agent begins to flow from the arteries to the veins;
this is used to assess the contrast between the tumor and
surrounding tissues. Delayed phase: Conducted after the venous
phase, usually 2-5 min post-injection, at which point the
distribution of the contrast agent in the tissues is more uniform,
helping to observe the late enhancement characteristics of the
tumor. For different pathological types of GC, the area of maximum
enhancement in the three phases was selected as the baseline for
outlining, with strict adherence to the tumor edges during
outlining, avoiding gas, gastric fluid, necrotic areas and adipose
tissue, and then VOIs of the same shape and size were drawn in the
same region of the remaining phase images, while excluding the top
and bottom image slices to reduce bias caused by partial volume
effects. One doctor segmented the lesions of all subjects. Another
doctor randomly selected 30 cases from all samples for outlining,
calculating the intra-class correlation coefficient to assess
inter-operator variability.
Feature extraction
The open-source PyRadiomics software package based
on Python (version 3.0.1) (https://pyradiomics.readthedocs.io/) was used to
extract radiomics features from the VOIs. Detailed calculations of
the radiomics features are described and provided in the online
documentation of PyRadiomics (https://pyradiomics.readthedocs.io/en/latest/). The
extracted features comply with the Image Biomarker Standardization
Initiative. A total of 386 candidate radiomics features were
extracted from three Dynamic Contrast Enhanced (DCE)-CT phases of
each patient in four major categories, including 14 shape features,
18 first-order statistical features, 75 texture features and 279
features based on the Laplacian of Gaussian. Specifically, texture
features were further divided into gray-level co-occurrence matrix
features, gray-level size zone matrix features, gray-level run
length matrix features, neighboring gray tone difference matrix
features and gray-level dependence matrix features. These features
cover multiple aspects of tumor morphology, texture and signal
distribution, providing rich information for subsequent model
construction and analysis. Various machine learning algorithms were
used to build predictive models, specifically support vector
machine (SVM), random forest (RandomForest), K-nearest neighbors
(KNN), LightGBM and XGBoost. The fusion model was built by
multi-phase radiomics features and independent clinical risk
factors for patients with high expression levels of Ki-67, and the
multi-phase model was built by the three single-phase radiomics
features.
Statistical analysis
For continuous variables, the Kolmogorov-Smirnov
test was applied to check for normal distribution, followed by the
Mann-Whitney U test or independent t-test to compare differences,
whereas the χ2 test was used to compare categorical
variables. Normally distributed data were presented as the mean ±
standard deviation (SD) and compared using the independent t-test.
Non-normally distributed data were presented as median
(interquartile range, IQR) and analyzed with the Mann-Whitney U
test. The DeLong test was used to compare the statistical
differences of the area under the curve (AUC) between different
models, and the Hosmer-Lemeshow test was used to assess the
goodness of fit of the model. All statistical analyses were
performed using SPSS 26.0 (IBM Corp.) and R 4.1.0 (R Foundation for
Statistical Computing, Austria), with statistical significance set
at P<0.05.
Results
Patient characteristics
The study cohort comprised 164 participants (male:
117, female: 47) meeting eligibility criteria, with median age of
69 years (range: 35-88). The clinical characteristics of 164
patients with GC are summarized in Table I; the training set included 114
patients and the testing set included 50 patients. The average age
of patients in the training set was 68.44 years and was 67.90 years
in the testing set. There was no significant difference in the
proportion of patients with high Ki-67 expression between the
training set and the testing set (P>0.05). In addition, there
were no significant differences between the training set and the
testing set in terms of age, sex, tumor location, tumor marker
levels, lymph node metastasis status, T staging, Ki-67 expression
and serosal invasion status, indicating that the two groups of
samples had a favorable balance in baseline characteristics, thus
providing a reliable foundation for subsequent model training and
validation.
 | Table IComparison of clinical characteristics
between training set and test set patients. |
Table I
Comparison of clinical characteristics
between training set and test set patients.
| Variable | Training set | Testing set | t/x2 | P-value |
|---|
| Sample size | 114 | 50 | | |
| Average age,
years | 68.44 | 67.90 | 0.064 | 0.297 |
| Sex | | | 0.250 | 0.624 |
|
Female | 32 | 15 | | |
|
Male | 82 | 35 | | |
| Tumor location | | | 0.531 | 0.684 |
|
Cardia/Fundus | 26 | 12 | | |
|
Body | 55 | 18 | | |
|
Antrum | 27 | 19 | | |
|
Multi-location | 6 | 1 | | |
| Carcinoembryonic
antigen | | | -0.203 | 0.683 |
|
Normal | 15 | 6 | | |
|
Abnormal | 99 | 44 | | |
| CA724 | | | 0.322 | 0.515 |
|
Normal | 91 | 41 | | |
|
Abnormal | 23 | 9 | | |
| CT reported
LNM | | | 1.170 | 0.301 |
|
Negative | 48 | 26 | | |
|
Positive | 66 | 24 | | |
|
CT reported
T stage | | | 0.434 | 0.435 |
|
T1 + T2 | 46 | 22 | | |
|
T3 + T4 | 68 | 28 | | |
| Ki-67 | | | 0.000 | 1.000 |
|
Negative | 57 | 25 | | |
|
Positive | 57 | 25 | | |
| CT-serous membrane
invasion | | | -0.353 | 0.473 |
|
Negative | 28 | 11 | | |
|
Positive | 86 | 39 | | |
|
HER2 | | | | |
|
Negative | 85 | 37 | -0.075 | 0.881 |
|
Positive | 29 | 13 | | |
Clinical features screening and model
establishment
Univariate analysis of clinical indicators for
patients in the training set after oversampling showed that sex,
CA724 levels and CT serosal invasion were associated with high
expression of Ki-67 (all P<0.05; Table II). Subsequently, multivariate
analysis of the aforementioned indicators showed that CT serosal
invasion and CA724 levels were independent risk factors for high
expression of Ki-67 (P<0.05). Both were used to construct a
clinical prediction model using RandomForest regression and to draw
the receiver operating characteristic curve, with AUC values of
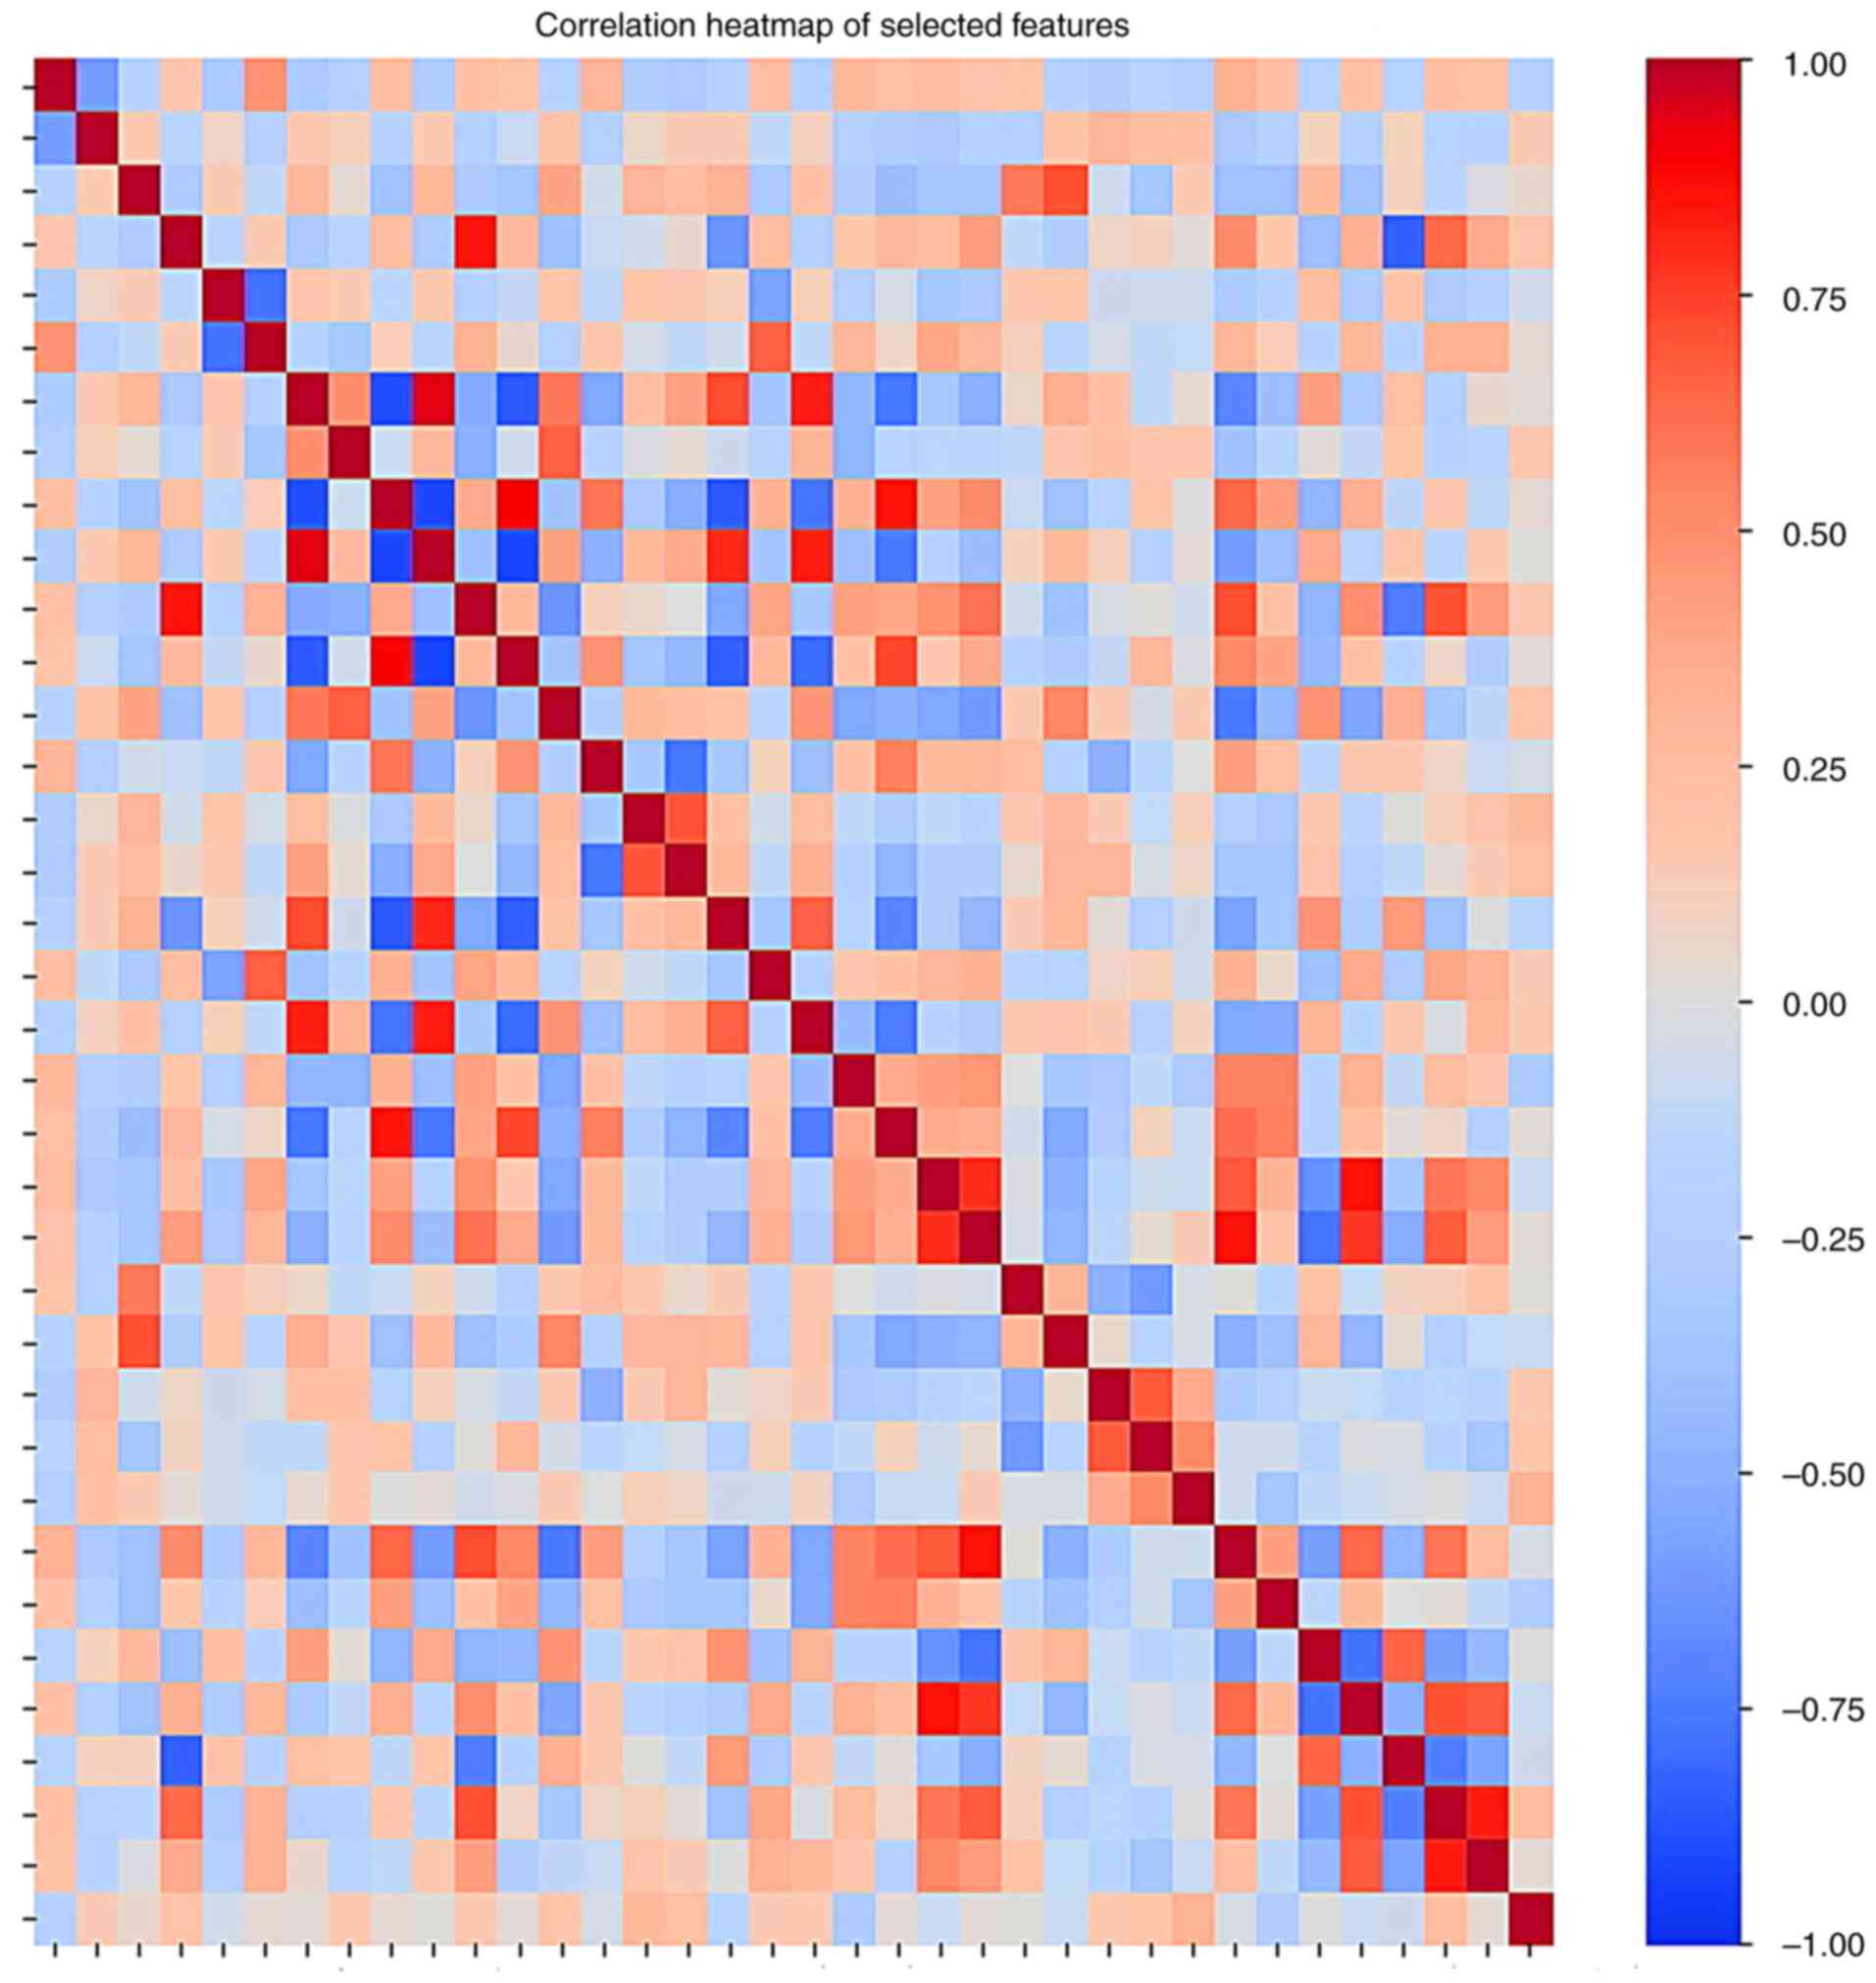
0.614 and 0.520. Correlation heatmap of selected features is
demonstrated in Fig. 2. The
radiomics workflow for the venous model construction is revealed in
Fig. 3A-E.
| Table IIPreoperative clinical risk factors
for HER2 positive. |
Table II
Preoperative clinical risk factors
for HER2 positive.
| | Univariate analysis
(P-value) | Multivariate
analysis (P-value) |
|---|
| Average age,
years | 0.719 | |
| Sex | 0.037 | 0.067 |
| Tumor location | 0.909 | |
| Carcinoembryonic
antigen | 0.784 | |
| CA724 | 0.002 | 0.001 |
| CT reported
LNM | 0.259 | |
| CT reported T
stage | 0.256 | |
| CT-serous membrane
invasion | 0.030 | 0.032 |
| HER2 | 0.832 | |
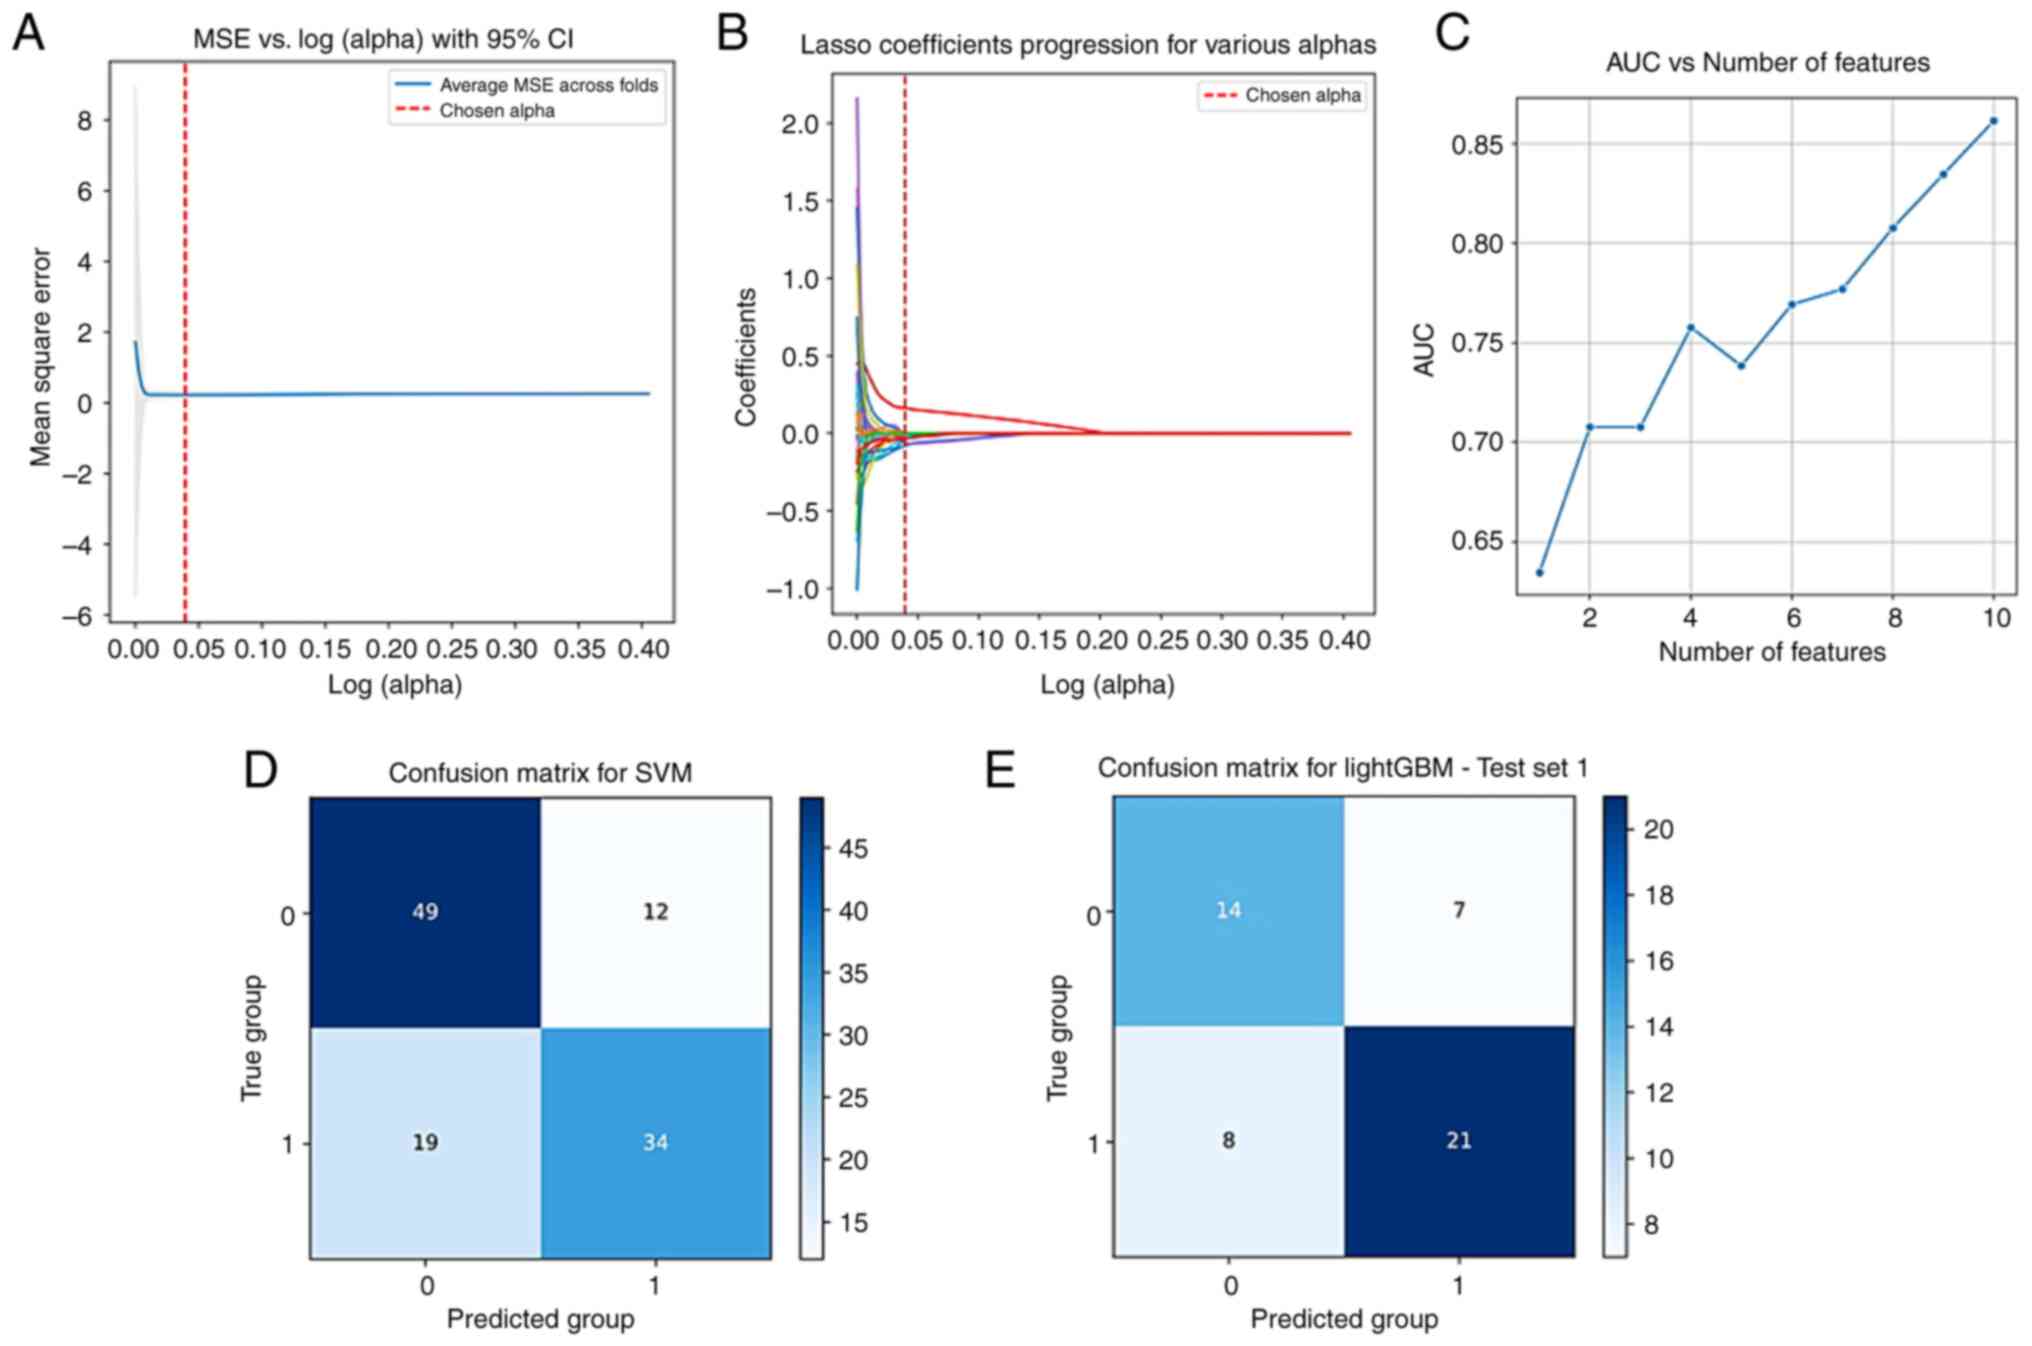
Imaging feature selection
Sequentially using the t-test, Spearman correlation
analysis, least absolute shrinkage and selection operator
regression and 10-fold cross-validation, and Random Forest feature
importance ranking, the radiomics features of the three phases were
screened; based on the features with the best AUC values obtained,
two, 10 and five features were finally selected from the arterial
phase, venous phase and delayed phase CT images, respectively.
Construction and validation of
multiple models
Based on the selected imaging features, machine
learning was used to apply various algorithms to construct three
radiological feature signatures as independent predictors of Ki-67.
For the arterial phase, the SVM model in the training set had the
highest AUC value of 0.697, whereas in the validation set the
RandomForest model had the highest AUC value of 0.658; for the
venous phase, the SVM model in the training set had the highest AUC
value of 0.783, and in the validation set the LightGBM model had
the highest AUC value of 0.747; for the delayed phase, the KNN
model in the training set had the highest AUC value of 0.772,
whereas in the validation set the SVM model had the highest AUC
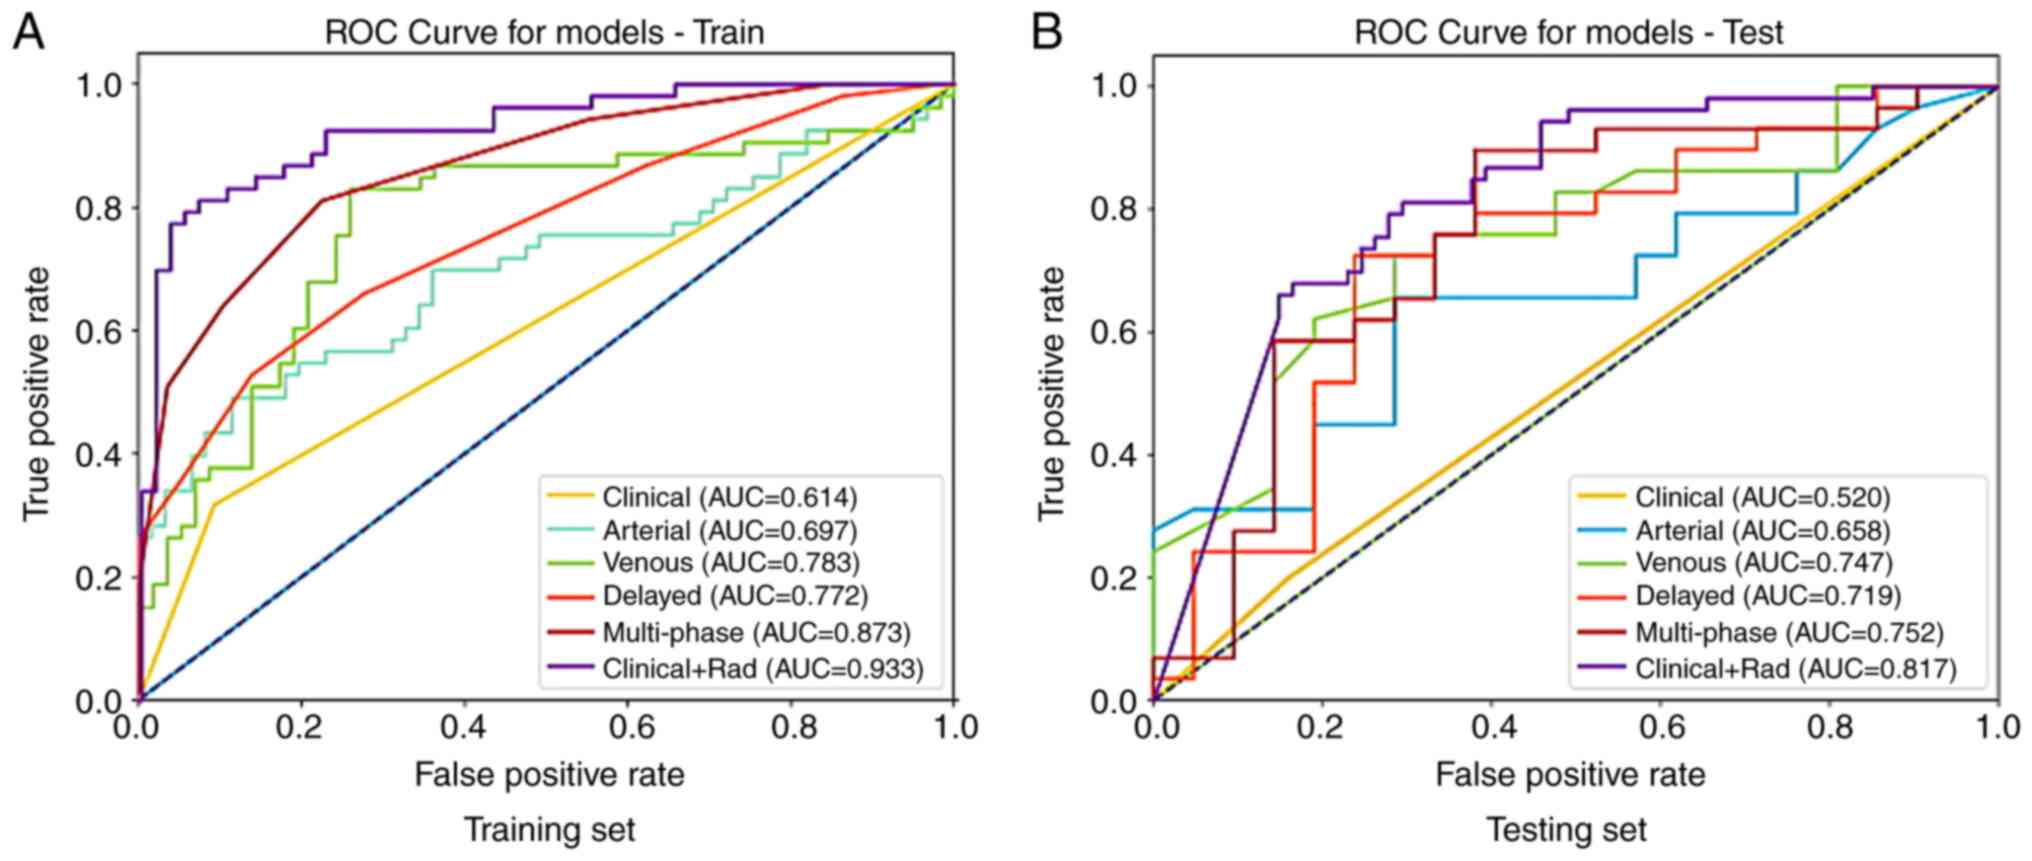
value of 0.719. Subsequently, the three phase feature signatures
were fused to obtain a multi-phase feature model, with the KNN
model in the training set having the highest AUC value of 0.873,
and in the validation set the RandomForest model had the highest
AUC value of 0.752. The ROC curves of different models in the
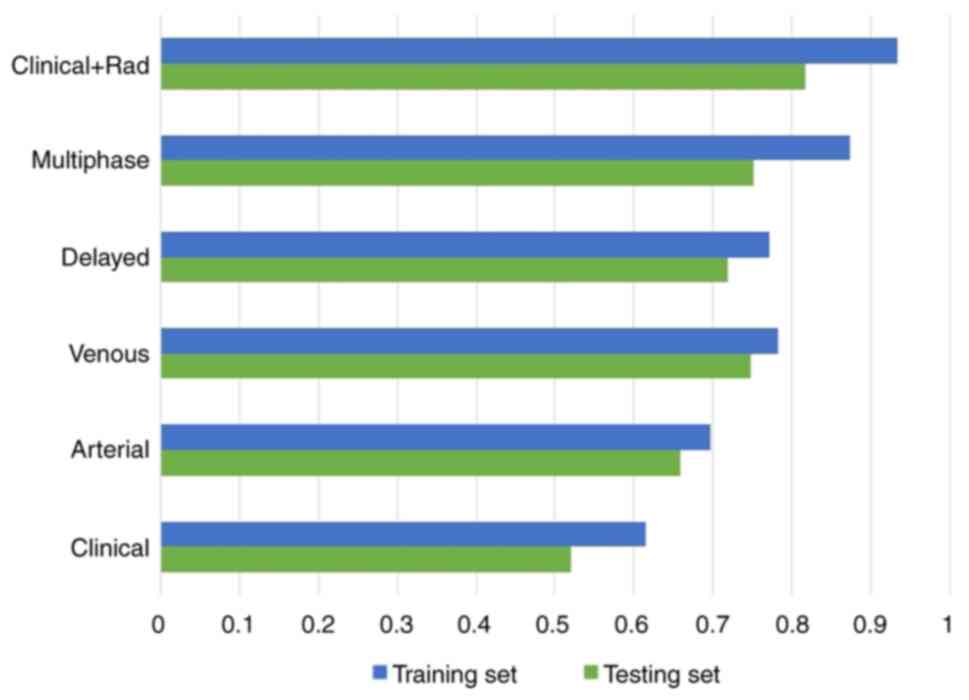
training and testing sets are demonstrated in Fig. 4. The AUC values of different models
in the training and testing sets are shown in Fig. 5.
Construction and validation of the
integrated model
Screened independent predictors and independent
clinical risk factors for patients with high expression levels of
Ki-67 were fused to build a fusion model through machine learning.
The highest AUC value of the SVM algorithm model in the training
set was 0.933, whereas in the testing set the highest AUC value of
the stochastic gradient descent (SGD) algorithm model was 0.817;
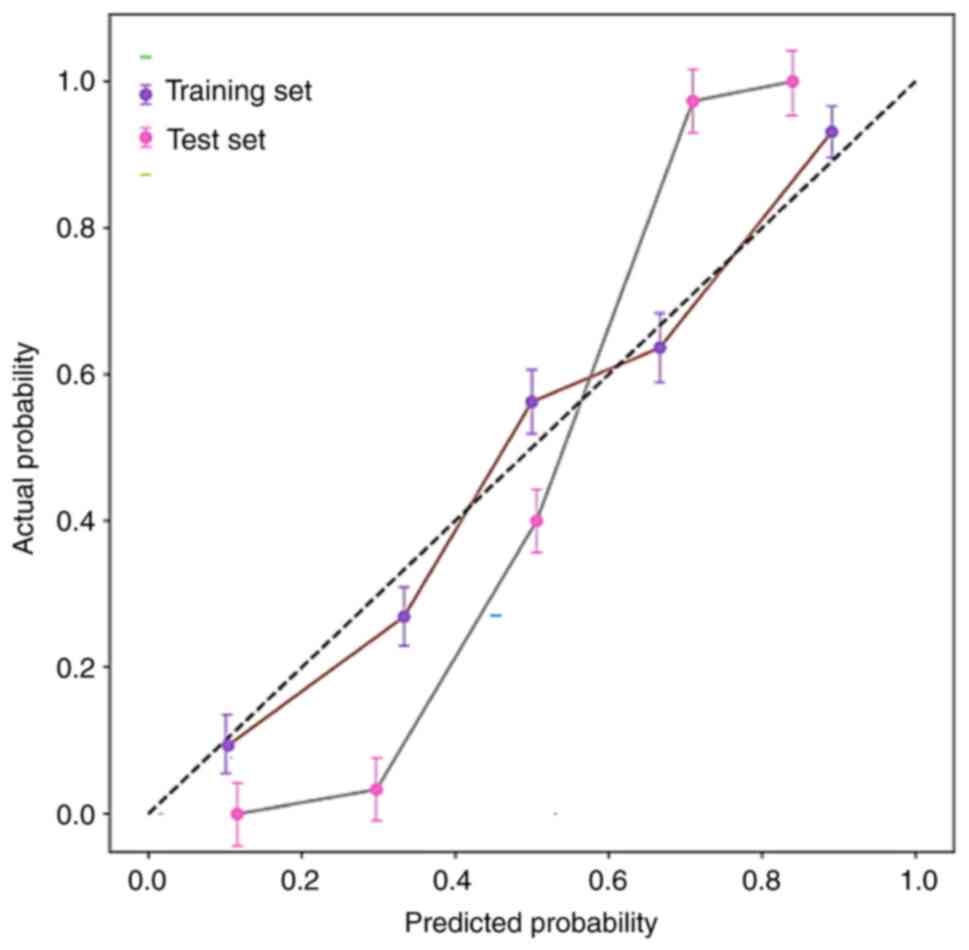
the Hosmer-Lemeshow test showed that the R-values in both the
training set and the validation set were >0.5, indicating that
the predicted values of the fusion model aligned well with the
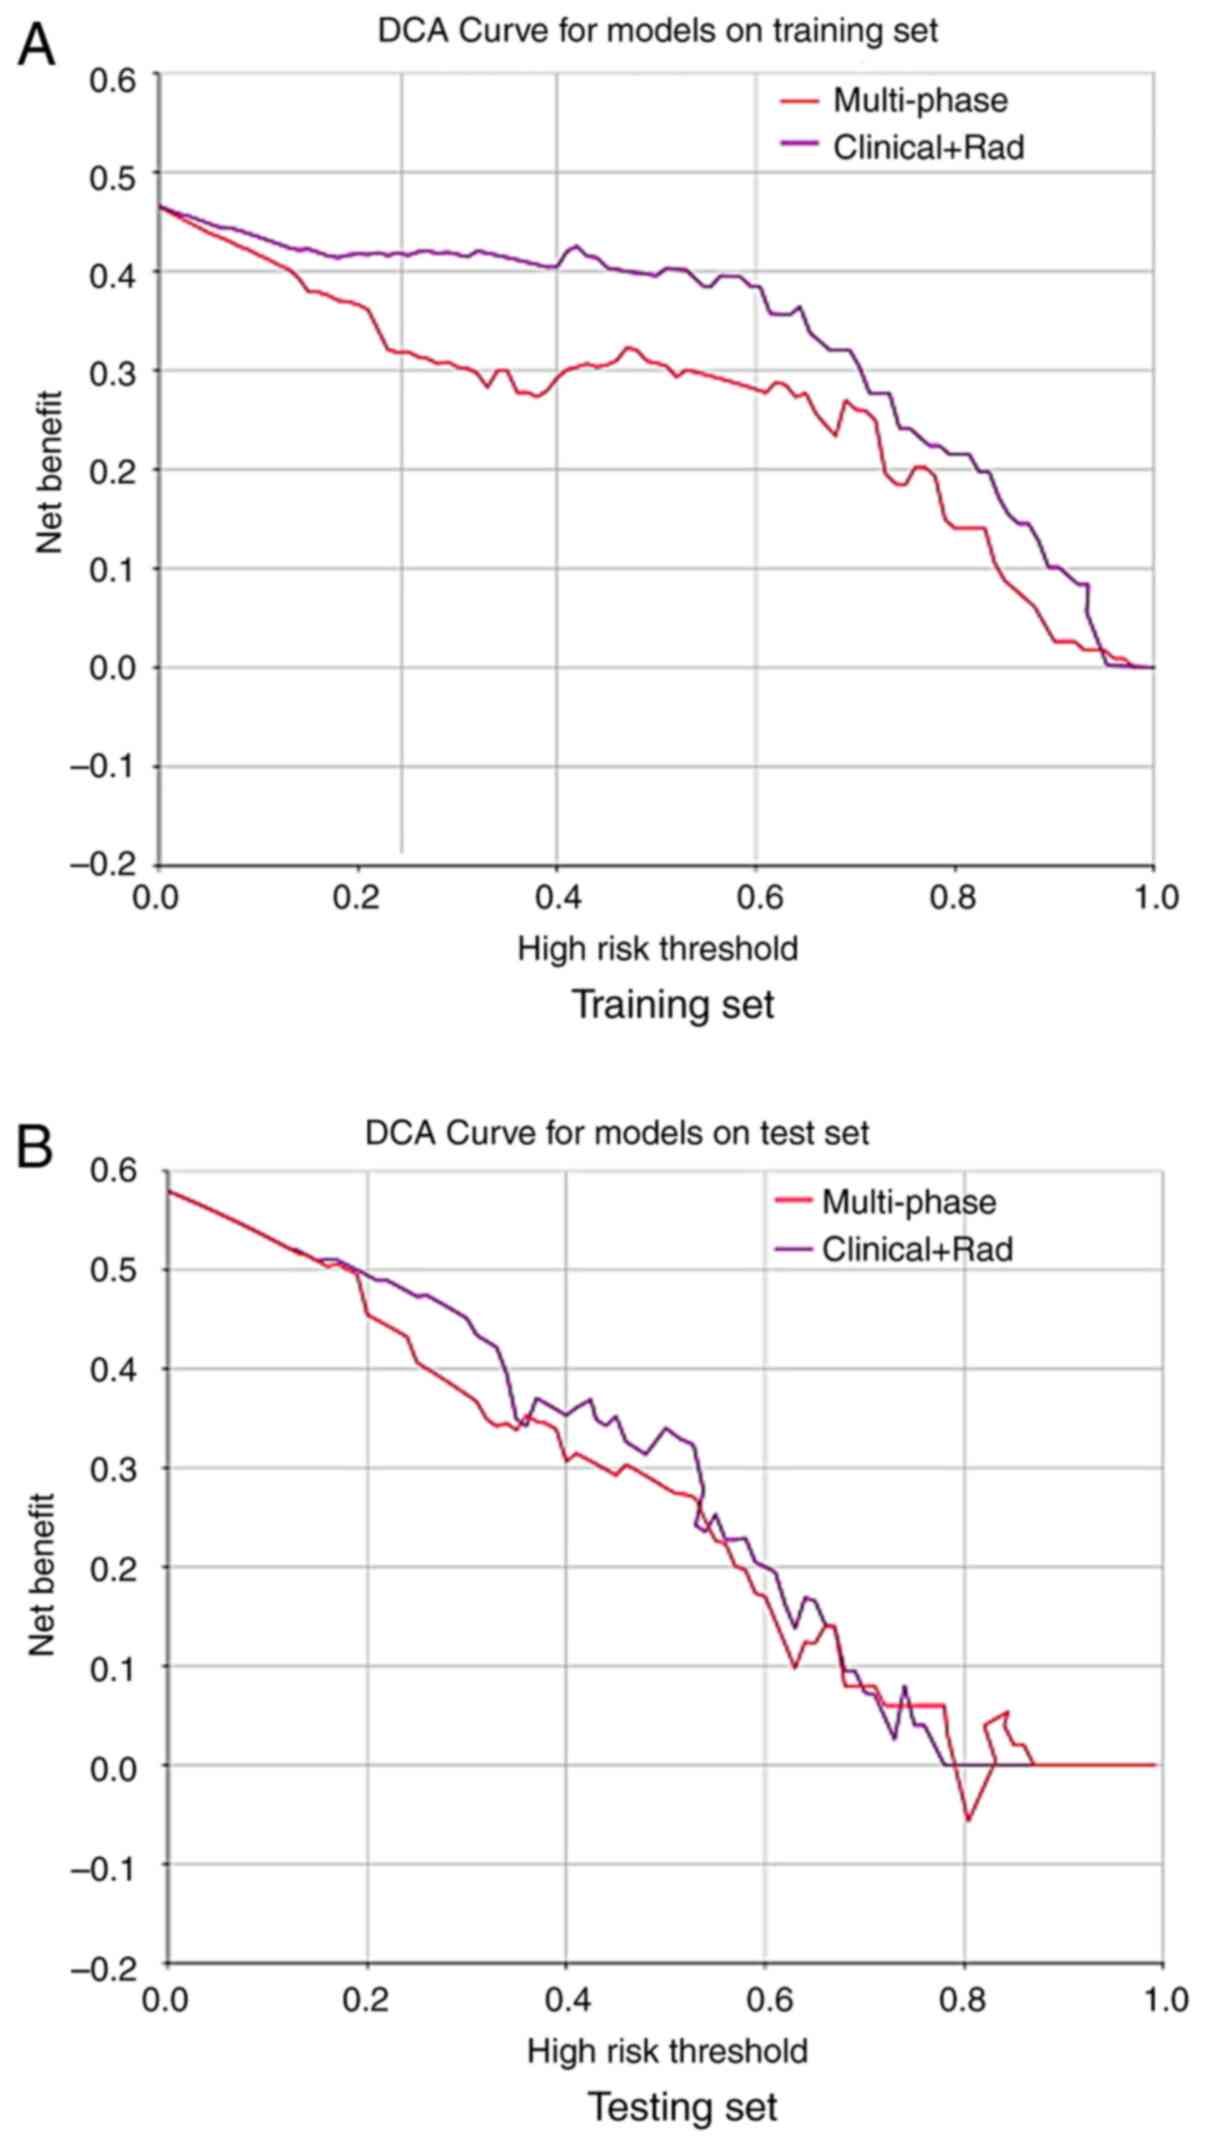
actual values, and the calibration curve had a favorable fit. Both
the multi-phase model and the fusion model were shown to have
favorable decision-making capabilities, and their clinical
applicability was better than that of other models, with the fusion
model being even more advantageous. The DCA curves of different
models in the training and testing sets are demonstrated in
Fig. 6. The clinical + radiomics
model calibration curve is presented in Fig. 7. Furthermore, the fusion model
achieved an AUC value of 0.805 in the external validation dataset
from TCIA.
Discussion
GC is one of the most common types of cancer
worldwide, and early GC may not have obvious symptoms, leading to a
high mortality rate (12). Ki-67 is
a nuclear antigen associated with cell proliferation, and its
expression is higher in numerous malignant tumors compared with in
normal tissues, reflecting the proliferation status of these
tumors. In GC, high expression of Ki-67 is usually closely related
to the proliferative activity of the tumor (13). Studies have shown that Ki-67 serves
an important role in the occurrence of GC, and its expression is
related to the degree of tumor differentiation and depth of
invasion. The positive expression rate of Ki-67 significantly
increases in gastritis, low-grade atypical hyperplasia, high-grade
atypical hyperplasia and GC, and with the worsening of lesion
severity, strong positive expression significantly increases
(14). By detecting the expression
of Ki-67, it can help assess the biological behavior of GC and
provide important information for clinical treatment decisions
(15). The detection of Ki-67
protein expression usually requires pathological analysis of
samples obtained through a tissue biopsy or surgery, which is an
invasive method and may lead to biased results due to sampling
limitations. For patients with advanced or surgically unresectable
GC, repeated biopsies not only carry higher risks but also have
certain limitations (16). Chen
et al (17) conducted a
retrospective analysis of 167 patients with gastrointestinal
stromal tumor (GIST) who preoperatively underwent enhanced CT; the
results showed that a higher necrotic volume ratio combined with
lobulated/irregular shapes may predict high expression of Ki-67 in
gastric GIST.
The present study adopted a late fusion strategy,
training random forest models to process radiomics features and
logistic regression models to process clinical data, and finally
fusing the results through weighted average probability. The
principle is to independently mine information from different data
sources, reduce inter modal interference, and highlight important
features through weight adjustment. The advantages include:
(1) Comprehensively utilizing the
complementarity of imaging and clinical information to improve
diagnostic accuracy; (2) Reduce the
risk of over-fitting in high-dimensional radiomics data; (3) The weighting mechanism can flexibly
adapt to different clinical scenarios.
The present study adopts a hierarchical cross
validation strategy, first dividing the data into a training set
and an independent testing set in a 7:3 ratio. During the training
phase, hyper-parameters such as tree depth and feature subset size
of random forests are optimized through 5-fold cross validation,
and early stopping is used to prevent over-fitting. During the
validation phase, the optimal weight fusion ratio (radiomics vs.
clinical model) is determined through grid search. The final
evaluation on the test set showed that the AUC of the fusion model
reached 0.817, significantly improved compared with that of the
single modal model (P<0.05).
Compared with models that rely solely on radiomics
or clinical features, fusion models bring significant performance
improvements. The primary reasons for these results are as follows:
First, radiomics features and clinical features are complementary
(rather than being highly redundant); Second, the fusion
methodology in the model is well-designed and has undergone
rigorous statistical validation.
The present study developed and validated various
omics models and conducted comparative evaluations. The results
revealed that the clinical model alone had the lowest ability to
differentiate Ki-67 expression levels, whereas the other radiomics
models (except for the arterial phase model) were significantly
different from it (P<0.05). Among the three single-phase
radiomics models, the arterial phase model had poor predictive
ability; however, there were no significant differences in these
three models in distinguishing Ki-67 expression levels. Among them,
the performance of the multi-phase radiomics model was slightly
improved, but there was only a significant difference between the
clinical and arterial phase models, and no significant difference
between the venous and delayed phase models in distinguishing Ki-67
expression levels. At the same time, data analysis found that the
predictive performance of the fusion model was the best, and there
were significant differences between other models; it was thus
obtained that the addition of radiomics signatures could
significantly improve the discriminative ability of the clinical
models, and the inclusion of the clinical models may also enhance
the predictive ability of the multi-phase radiomics model for Ki-67
expression (Table III). A
decision analysis comparing the clinical model, multi-phase
radiomics model and fusion model showed that within a certain
threshold, all two models had a net benefit advantage over the
‘full treatment or no treatment’ scheme, with the multi-phase
radiomics model only having a net benefit advantage within a narrow
threshold range. In addition, the predictive ability of the
clinical model was far lower than that of the multi-phase radiomics
model and the fusion model, thus its applicability may be limited.
The net benefit advantage of the fusion model was higher than that
of the multi-phase radiomics model in both the training and testing
sets. Ultimately, it was concluded that the fusion model
incorporating radiomics signatures based on three-phase CT
enhancement, CT showing serosal invasion and CA724 levels had
improved discriminative ability and clinical applicability,
demonstrating certain clinical application potential.
| Table IIISignificance comparison of the
differences in AUC values across the different models in the
training and testing sets. |
Table III
Significance comparison of the
differences in AUC values across the different models in the
training and testing sets.
| | Training set | Testing set |
|---|
| | AUC difference | P-value | AUC difference | P-value |
|---|
| Clinic +
Rad-Clinical | 0.319 | <0.0001 | 0.297 | 0.003 |
| Clinical +
Rad-Arterial | 0.236 | <0.0001 | 0.159 | 0.009 |
| Clinical +
Rad-Venous | 0.150 | 0.015 | 0.070 | 0.210 |
| Clinical +
Rad-Delayed | 0.161 | 0.009 | 0.098 | 0.104 |
| Clinical +
Rad-Multiphase | 0.060 | 0.363 | 0.065 | 0.273 |
|
Clinical-Arterial | -0.083 | 0.088 | -0.138 | 0.067 |
|
Clinical-Venous | -0.169 | 0.006 | -0.227 | 0.008 |
|
Clinical-Delayed | -0.158 | 0.010 | -0.199 | 0.024 |
|
Clinical-Multiphase | -0.259 | 0.000 | -0.232 | 0.006 |
|
Arterial-Venous | -0.086 | 0.068 | -0.089 | 0.169 |
|
Arterial-Delayed | -0.075 | 0.198 | -0.061 | 0.307 |
|
Arterial-Multiphase | -0.176 | 0.001 | -0.094 | 0.184 |
| Venous-Delayed | 0.011 | 0.863 | -0.028 | 0.712 |
|
Venous-Multiphase | -0.095 | 0.108 | -0.005 | 0.978 |
|
Delayed-Multiphase | -0.101 | 0.058 | -0.033 | 0.641 |
Multi-phase enhanced CT can provide information on
the hemodynamic changes and tissue perfusion of tumors at different
time points, thereby capturing the biological characteristics and
microenvironment of tumors more comprehensively (18,19).
Compared with biopsies that require tissue samples, multi-phase
enhanced CT is a non-invasive examination that reduces patient
suffering and the risk of complications (20). Due to the potential heterogeneity
within tumors, a single-point biopsy may not fully represent the
entire tumor. Multi-phase enhanced CT can provide information about
the entire tumor region, thus reducing sampling bias (21). Du et al (22) used novel spectral CT-derived
parameters to predict the histological types of GC and Ki-67
expression, with results showing significant differences in values
between the mucinous and non-mucinous cancer groups during both the
arterial and venous phases, and quantitative spectral parameters
were shown to distinguish between low and high Ki-67 expression, as
well as different histological types in GC.
The current study indicated that the multi-phase
enhanced CT radiomics model could effectively predict the
expression levels of Ki-67. By analyzing CT imaging data from
multiple phases, including plain scan, arterial phase, venous phase
and delayed phase, a large number of radiomics features related to
Ki-67 expression were extracted, capturing important information
such as tumor heterogeneity, hemodynamic changes and tumor
microenvironment. Compared with single-phase imaging data,
multi-phase enhanced CT provides more information on tumor dynamic
changes, allowing the multi-phase model to more accurately assess
the biological behavior of tumors and thus predict the expression
level of Ki-67.
Radiomics, as an emerging imaging analysis method,
is gradually being applied in the diagnosis and prognostic
assessment of tumors (23,24). Chen et al (25) evaluated the relationship between the
radiomics features of visceral adipose tissue (VAT) from
18F-fluorodeoxyglucose positron emission tomography (18F-FDG
PET)/CT imaging, and the positive expression of Her-2 and Ki-67 in
GC. The results indicated that the VAT radiomics model based on
18F-FDG PET/CT performed well in predicting the expression status
of Her2 and Ki-67 in patients with GC. These findings indicated
that radiomics features can serve as imaging biomarkers for GC. The
results of the present study suggested that radiomics methods
cannot only assist in assessing Ki-67 expression but also support
personalized treatment decisions. Patients with high Ki-67
expression typically have a poorer prognosis and may require more
aggressive treatment strategies. By predicting Ki-67 expression
through CT radiomics models, clinicians can quickly assess the
proliferation status of the tumor at the time of diagnosis and
adjust treatment plans in a timely manner. Furthermore, radiomics
models can continuously and dynamically monitor changes in Ki-67,
providing data support for post-treatment efficacy evaluation and
recurrence risk prediction. Compared with traditional tissue
biopsies, the non-invasive nature of radiomics makes it more
suitable for long-term follow-up and multiple assessments,
especially in cases of high tumor heterogeneity, multiple tumors or
when patients are unsuitable for multiple biopsies. By accurately
assessing Ki-67 expression, doctors can improve formulation of
personalized treatment plans, thereby improving patient survival
rates and quality of life. Additionally, the application of this
model helps reduce reliance on traditional tissue biopsies,
lowering the risk of invasive procedures for patients, and
enhancing the efficiency and accuracy of clinical decision-making.
The promotion of this radiomics approach may provide novel insights
for the early diagnosis and treatment of GC, demonstrating
significant clinical application potential.
Radiomics features are high-dimensional quantitative
features (such as texture, shape and intensity heterogeneity)
extracted from medical images (CT and MRI), capturing microscopic
heterogeneity information that the human eye cannot recognize. For
example, the radiomics features of tumors may reflect their
invasiveness, gene expression, or treatment response. Clinical
features are the integration of demographic information (age, sex),
medical history (complications, staging), laboratory indicators
(such as blood markers) or treatment records of patients, providing
disease background and clinical interpretability. Radiomics
compensates for the lack of microscopic information in clinical
features, while clinical features assist in interpreting the
biological significance of imaging results (26-28).
Recent studies (6,29) have
shown that the fusion model based on CT/MRI radiomics combined with
clinical features has an accuracy of 83-89%, sensitivity of
~80-85%, specificity of ~78-84%, and AUC of 0.85-0.91 for
predicting Ki-67 expression in GC. These models significantly
outperform single data source prediction by quantifying the
synergistic effect of tumor heterogeneity and clinical parameters
such as CEA levels and Borrmann classification. Despite its
excellent performance, current clinical applications still face the
following challenges: Firstly, the corresponding mechanism between
imaging features and the spatial distribution of Ki-67 protein
needs further exploration; Secondly, it is necessary to develop
real-time analysis tools that are compatible with the DICOM
standard; Furthermore, it has not been validated through
large-scale prospective clinical trials.
The present study demonstrated the potential of
radiomics models in predicting Ki-67 expression; however, there are
certain limitations. First, as a retrospective study, although the
images were normalized, there may still be some differences in the
quality and consistency of the imaging data, and future research
should include more prospective data for validation. Second, the
sample size of the study was relatively small, and single-center
data may not fully represent the situation of patients from other
institutions or different regions. Therefore, subsequent research
should expand the sample size and conduct multi-center validation
to improve the generalizability of the model. In addition, although
CT imaging data were included from multiple phases, the image
acquisition at different phases may be affected by factors such as
patient positioning, breathing and heartbeat. Future studies could
consider applying more refined image registration techniques to
further enhance the predictive performance of the model.
In summary, the present study constructed various CT
radiomics models and successfully predicted the expression levels
of Ki-67 in patients with GC. The fusion model demonstrated high
accuracy and reliability in predicting high and low expression
levels of Ki-67, showcasing the potential of radiomics in
non-invasive assessment of GC. Future research should aim to
further optimize the models and validate their applicability in
different clinical settings, providing more support for precision
medicine and personalized treatment.
Acknowledgements
Not applicable.
Funding
Funding: The present study was supported by Key R&D Project
of Xuzhou Science and Technology Bureau (grant no. KC23208), the
Development Fund Project of Xuzhou Medical University Affiliated
Hospital (grant no. XYFY202460), the Research Project of Jiangsu
Provincial Health Commission (grant no. Z2024021) and Clinical
Technology Key Personnel Advanced Training Program of Xuzhou.
Availability of data and materials
The data generated in the present study may be
requested from the corresponding author.
Authors' contributions
TS and BX performed data acquisition and drafted the
manuscript. TS and LC were in charge of statistical analyses and
data interpretation. TS and ML was responsible for recruiting
patients. PD made substantial contributions to the study design. PD
and AC made substantial contributions to conception and design of
the study and provided professional guidance. All authors read and
approved the final version of the manuscript and confirm the
authenticity of all the raw data.
Ethics approval and consent to
participate
The study protocol was approved by the Institutional
Review Board of The Second Affiliated Hospital of Xuzhou Medical
University (approval no. KY-20243021; Xuzhou, China), and all
studies were conducted in accordance with relevant
guidelines/regulations, and all studies were conducted in
accordance with the Declaration of Helsinki. This study is
retrospective, and the used data collected as part of the
participants' routine care. Written informed consent for
participation was waived in accordance with the national
legislation and the institutional requirements.
Patient consent for publication
Not applicable.
Competing interests
The authors declare that they have no competing
interests.
References
|
1
|
Bray F, Laversanne M, Sung H, Ferlay J,
Siegel RL, Soerjomataram I and Jemal A: Global cancer statistics
2022: GLOBOCAN estimates of incidence and mortality worldwide for
36 cancers in 185 countries. CA Cancer J Clin. 74:229–263.
2024.PubMed/NCBI View Article : Google Scholar
|
|
2
|
Tu Z, Wang Y, Liang J and Liu J:
Helicobacter pylori-targeted AI-driven vaccines: A paradigm shift
in gastric cancer prevention. Front Immunol.
15(1500921)2024.PubMed/NCBI View Article : Google Scholar
|
|
3
|
Rafiepoor H, Banoei MM, Ghorbankhanloo A,
Muhammadnejad A, Razavirad A, Soleymanjahi S and Amanpour S:
Exploring the potential of machine learning in gastric cancer:
Prognostic biomarkers, subtyping, and stratification. BMC Cancer.
25(809)2025.PubMed/NCBI View Article : Google Scholar
|
|
4
|
Yang L, Ding Y, Zhang D, Yang G, Dong X,
Zhang Z, Zhang C, Zhang W, Dai Y and Li Z: Predictive value of
enhanced CT and pathological indicators in lymph node metastasis in
patients with gastric cancer based on GEE model. BMC Med Imaging.
25(36)2025.PubMed/NCBI View Article : Google Scholar
|
|
5
|
Liu X, Han T, Wang Y, Liu H, Deng J, Xue
C, Li S and Zhou J: Prediction of Ki-67 expression in gastric
gastrointestinal stromal tumors using histogram analysis of
monochromatic and iodine images derived from spectral CT. Cancer
Imaging. 24(173)2024.PubMed/NCBI View Article : Google Scholar
|
|
6
|
Chen Z, Zhang G, Liu Y and Zhu K:
Radiomics analysis in predicting vascular invasion in gastric
cancer based on enhanced CT: A preliminary study. BMC Cancer.
24(1020)2024.PubMed/NCBI View Article : Google Scholar
|
|
7
|
Helal A, Hammam E, Ovenden CD, Candy NG,
Chaurasia B, Atallah O and Jukes A: A systematic review of
radiological prediction of ki 67 proliferation index of meningioma.
Neurosurg Rev. 47(881)2024.PubMed/NCBI View Article : Google Scholar
|
|
8
|
Peng C, Xu X, Ouyang Y, Li Y, Lu N, Zhu Y
and He C: Spatial variation of the gastrointestinal microbiota in
response to long-term administration of vonoprazan in mice with
high risk of gastric cancer. Helicobacter.
29(e13117)2024.PubMed/NCBI View Article : Google Scholar
|
|
9
|
Wang SN, Wang YK, Zhu CY, Jiang B, Ge DF
and Li YY: Significance of concurrent evaluation of HER2 gene
amplification and p53 and Ki67 expression in gastric cancer
tissues. Clin Transl Oncol. 27:126–134. 2025.PubMed/NCBI View Article : Google Scholar
|
|
10
|
Wu M, Zhu H, Han Z, Xu X, Liu Y, Cao H and
Zhu X: Prediction study of surrounding tissue invasion in clear
cell renal cell carcinoma based on multi-phase enhanced CT
radiomics. Abdom Radiol (NY). 50:2533–2548. 2025.PubMed/NCBI View Article : Google Scholar
|
|
11
|
Li C, Yue X, Chen S, Lin Y, Zhang Y, Liao
L and Zhang P: Preoperative prediction of Ki-67 expression in
hepatocellular carcinoma by spectral imaging on dual-energy
computed tomography (DECT). Quant Imaging Med Surg. 14:8402–8413.
2024.PubMed/NCBI View Article : Google Scholar
|
|
12
|
Gül S, Alberto M, Annika K, Pratschke J
and Rau B: Emerging treatment modalities for gastric cancer with
macroscopic peritoneal metastases: A systematic review. J Surg
Oncol. 130:1364–1377. 2024.PubMed/NCBI View Article : Google Scholar
|
|
13
|
Seo JW, Park KB, Chin HM and Jun KH: Does
Epstein-Barr virus-positive gastric cancer establish a significant
relationship with the multiple genes related to gastric
carcinogenesis? PLoS One. 18(e0283366)2023.PubMed/NCBI View Article : Google Scholar
|
|
14
|
Mao LT, Chen WC, Lu JY, Zhang HL, Ye YS,
Zhang Y, Liu B, Deng WW and Liu X: Quantitative parameters in novel
spectral computed tomography: Assessment of Ki-67 expression in
patients with gastric adenocarcinoma. World J Gastroenterol.
29:1602–1613. 2023.PubMed/NCBI View Article : Google Scholar
|
|
15
|
Yuan L, Lin X, Zhao P, Ma H, Duan S and
Sun S: Correlations between DKI and DWI with Ki-67 in gastric
adenocarcinoma. Acta Radiol. 64:1792–1798. 2023.PubMed/NCBI View Article : Google Scholar
|
|
16
|
Kock Am Brink M, Dunst LS, Behrens HM,
Krüger S, Becker T and Röcken C: Intratumoral heterogeneity affects
tumor regression and Ki67 proliferation index in perioperatively
treated gastric carcinoma. Br J Cancer. 128:375–386.
2023.PubMed/NCBI View Article : Google Scholar
|
|
17
|
Chen XS, Shan YC, Dong SY, Wang WT, Yang
YT, Liu LH, Xu ZH, Zeng MS and Rao SX: Utility of preoperative
computed tomography features in predicting the Ki-67 labeling index
of gastric gastrointestinal stromal tumors. Eur J Radiol.
142(109840)2021.PubMed/NCBI View Article : Google Scholar
|
|
18
|
Huang S, Nie X, Pu K, Wan X and Luo J: A
flexible deep learning framework for liver tumor diagnosis using
variable multi-phase contrast-enhanced CT scans. J Cancer Res Clin
Oncol. 150(443)2024.PubMed/NCBI View Article : Google Scholar
|
|
19
|
Gao Y, Yang X, Li H and Ding DW: A
knowledge-enhanced interpretable network for early recurrence
prediction of hepatocellular carcinoma via multi-phase CT imaging.
Int J Med Inform. 189(105509)2024.PubMed/NCBI View Article : Google Scholar
|
|
20
|
Yu Z, Liu Y, Dai X, Cui E, Cui J and Ma C:
Enhancing preoperative diagnosis of microvascular invasion in
hepatocellular carcinoma: Domain-adaptation fusion of multi-phase
CT images. Front Oncol. 14(1332188)2024.PubMed/NCBI View Article : Google Scholar
|
|
21
|
Zhang G, Man Q, Shang L, Zhang J, Cao Y,
Li S, Qian R, Ren J, Pu H, Zhou J, et al: Using multi-phase CT
radiomics features to predict EGFR mutation status in lung
adenocarcinoma patients. Acad Radiol. 31:2591–2600. 2024.PubMed/NCBI View Article : Google Scholar
|
|
22
|
Du M, Wang X, Zhuang S, Lou K, Li G, Xie
X, Wang M, Zang H, Wang M and Shen W: Quantitative parameters in
novel spectral computed tomography for assessing gastric cancer and
cell proliferation. Eur J Radiol. 167(111052)2023.PubMed/NCBI View Article : Google Scholar
|
|
23
|
Wu L, Wang H, Chen Y, Zhang X, Zhang T,
Shen N, Tao G, Sun Z, Ding Y, Wang W and Bu J: Beyond
radiologist-level liver lesion detection on multi-phase
contrast-enhanced CT images by deep learning. iScience.
26(108183)2023.PubMed/NCBI View Article : Google Scholar
|
|
24
|
Ananda S, Jain RK, Li Y, Iwamoto Y, Han
XH, Kanasaki S, Hu H and Chen YW: A boundary-enhanced liver
segmentation network for multi-phase CT images with unsupervised
domain adaptation. Bioengineering (Basel). 10(899)2023.PubMed/NCBI View Article : Google Scholar
|
|
25
|
Chen D, Zhou R and Li B: Preoperative
prediction of Her-2 and Ki-67 status in gastric cancer using
18F-FDG PET/CT radiomics features of visceral adipose
tissue. Br J Hosp Med (Lond). 85:1–18. 2024.PubMed/NCBI View Article : Google Scholar
|
|
26
|
Yang C, Zhu F, Yang J, Wang M, Zhang S and
Zhao Z: DCE-MRI quantitative analysis and MRI-based radiomics for
predicting the early efficacy of microwave ablation in lung
cancers. Cancer Imaging. 25(26)2025.PubMed/NCBI View Article : Google Scholar
|
|
27
|
Hou J, Zhang S, Li S, Zhao Z, Zhao L,
Zhang T and Liu W: CT-based radiomics models using intralesional
and different perilesional signatures in predicting the
microvascular density of hepatic alveolar echinococcosis. BMC Med
Imaging. 25(84)2025.PubMed/NCBI View Article : Google Scholar
|
|
28
|
Lin J, Ou Y, Luo M, Jiang X, Cen S and
Zeng G: Combining clinical characteristics with CT radiomics to
predict Ki67 expression level of small renal mass based on
artificial intelligence algorithms. Front Oncol.
15(1541143)2025.PubMed/NCBI View Article : Google Scholar
|
|
29
|
Sun S, Li L, Xu M, Wei Y, Shi F and Liu S:
Epstein-Barr virus positive gastric cancer: The pathological basis
of CT findings and radiomics models prediction. Abdom Radiol (NY).
49:1779–1791. 2024.PubMed/NCBI View Article : Google Scholar
|